Our AMD Ryzen 9 9950X3D2 CPU review includes gaming and production benchmarks against 25-30 other CPUs
The Highlights
- In 24 hours, we put together 24 benchmark charts for the 9950X3D2
- While the CPU does perform well, it is simply too expensive at $900 considering it rarely does much of anything (if anything at all) to improve performance
- We had one outlier in the results, but other than the OpenFOAM result, everything else is typically 0 to 6% improved (with sometimes no movement at all)
- Original MSRP: $900
- Release Date: April 22, 2026
Table of Contents
- AutoTOC

Intro
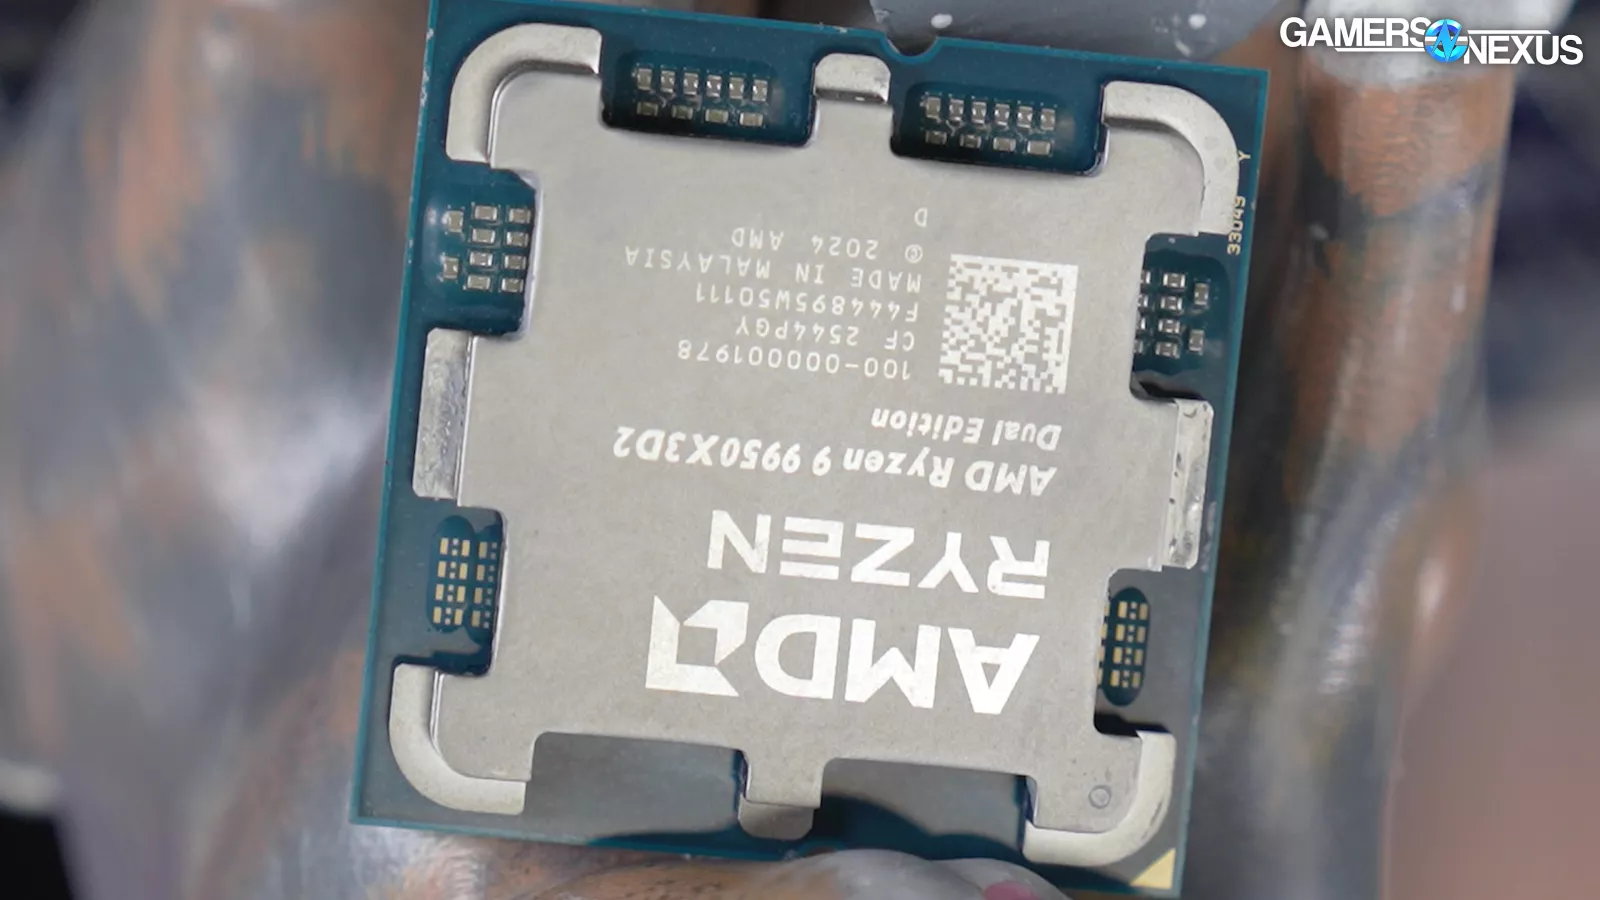
Today, we’re reviewing the AMD 9950X3D2 and you shouldn’t buy this $900 CPU. It arrived 24 hours ago, and we have 24 charts to go through with around 25-30 CPUs tested across the spread. It was a long night, but we have a ton of data to go over. There’s only one problem: This CPU is the upside-down edition, because Steve from Hardware Unboxed shipped it to us from Australia. If you’re in the Northern Hemisphere, your 9950X3D2 will look a little different from ours...Also, if you flush the CPU down the toilet, it will go the other direction. Anyway, thanks, Steve!
Editor's note: This was originally published on April 23, 2026 as a video. This content has been adapted to written format for this article and is unchanged from the original publication.
Credits
Test Lead, Host, Writing, Video Editing
Steve Burke
Writing, Testing
Patrick Lathan
Video editing, Testing
Mike Gaglione
Video Editing
Tim Phetdara
Writing, Web Editing
Jimmy Thang
No bullshit, here’s the conclusion upfront:
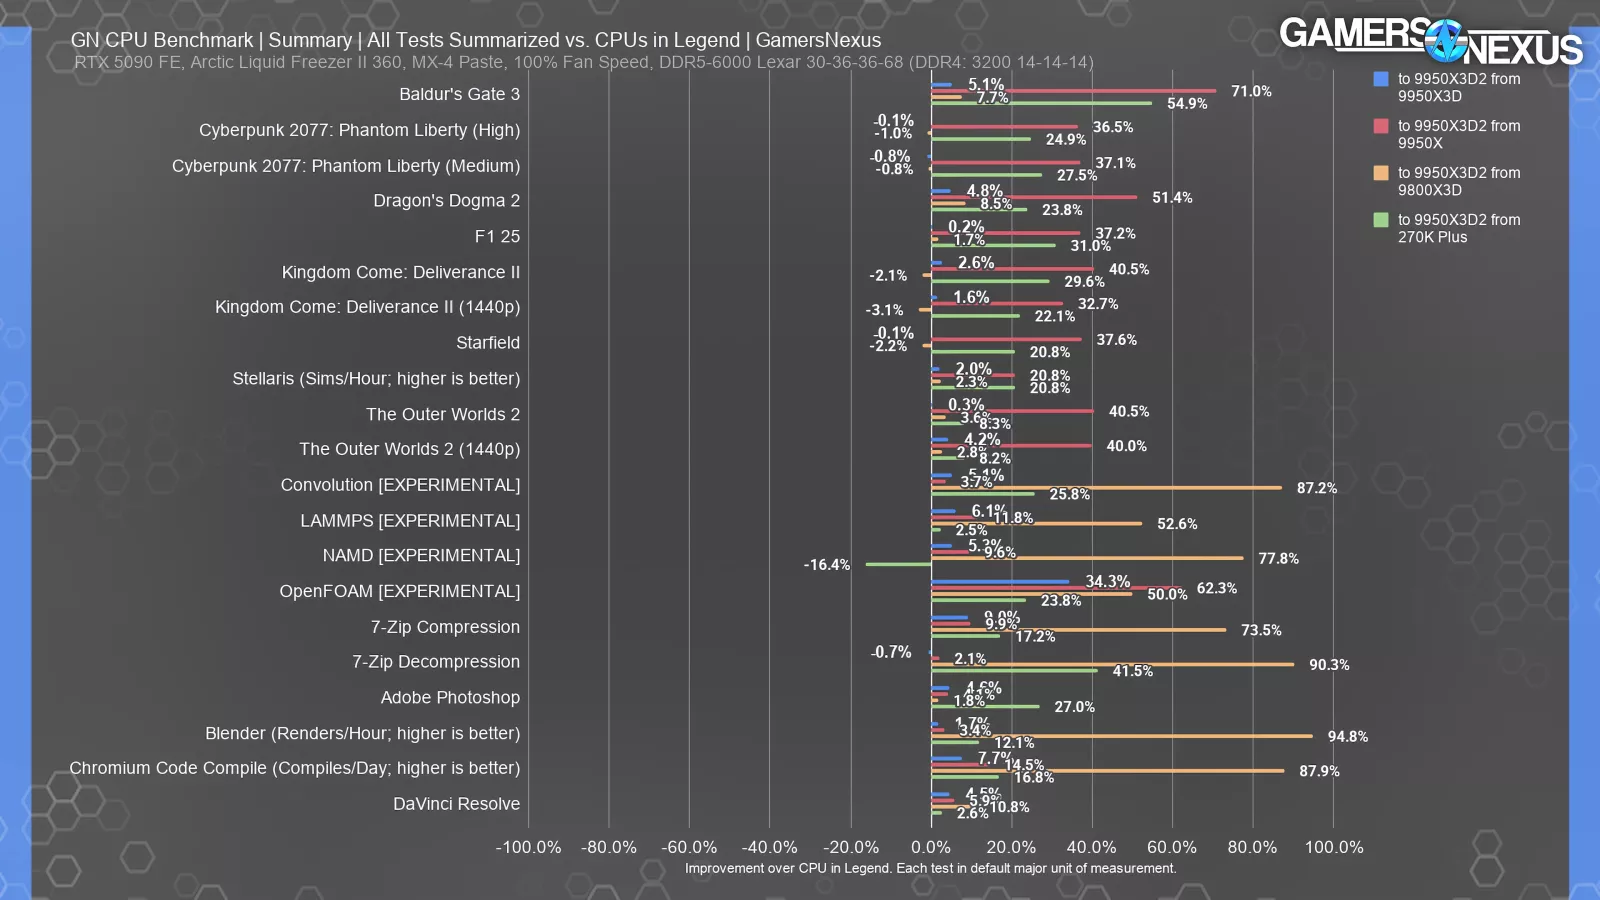
You all always ask us for a summary chart, so here it is in the intro. This is the review. Stick around for the details and the other 25+ CPUs not shown here, but these are the basics.
In gaming, the 9950X3D2 runs 0% to 6% better or so against the 9950X3D1, aka 9950X3D. Against the 9950X-non-3D, predictably, it’s anywhere from 21% to 71% better. Against the 9800X3D, they’re often about the same -- sometimes slightly worse, sometimes slightly better. Against the 270K Plus (read our review), it’s variable but often 20% to 30% better for the 9950X3D2.
In our scientific testing, which include SpecWorkstation OpenFOAM computational fluid dynamics analysis, large-scale atomic molecular massively parallel simulators for molecular dynamics modeling and materials science, biomolecular modeling, and convolutional filters, we saw mostly similar result of 0-6% improvement for the 9950X3D2 vs. 9950X3D. There was one break-out exception though, which was OpenFOAM CFD that had the 9950X3D2 at 34% improved over the 9950X3D. This test seems highly sensitive to cache. That said, this is also an experimental test, which means it is more prone to error or issue. We’ll talk about that in this review.
Finally, in production tests, the 9950X3D2 is 0% to 9% better than the 9950X3D1. Intel gets closer to it with the 270K Plus as well versus earlier tests.
That covers the first 21 charts, but we have some more scattered throughout here.
That’s pretty much it. That’s the whole review. With 0-6% in a lot of cases, it’s just not worth $900, but we’ll go over the details throughout.
With the conclusion out of the way, it’s time to show our work and get into the details of this CPU that you shouldn’t buy because it's $900.
Overview

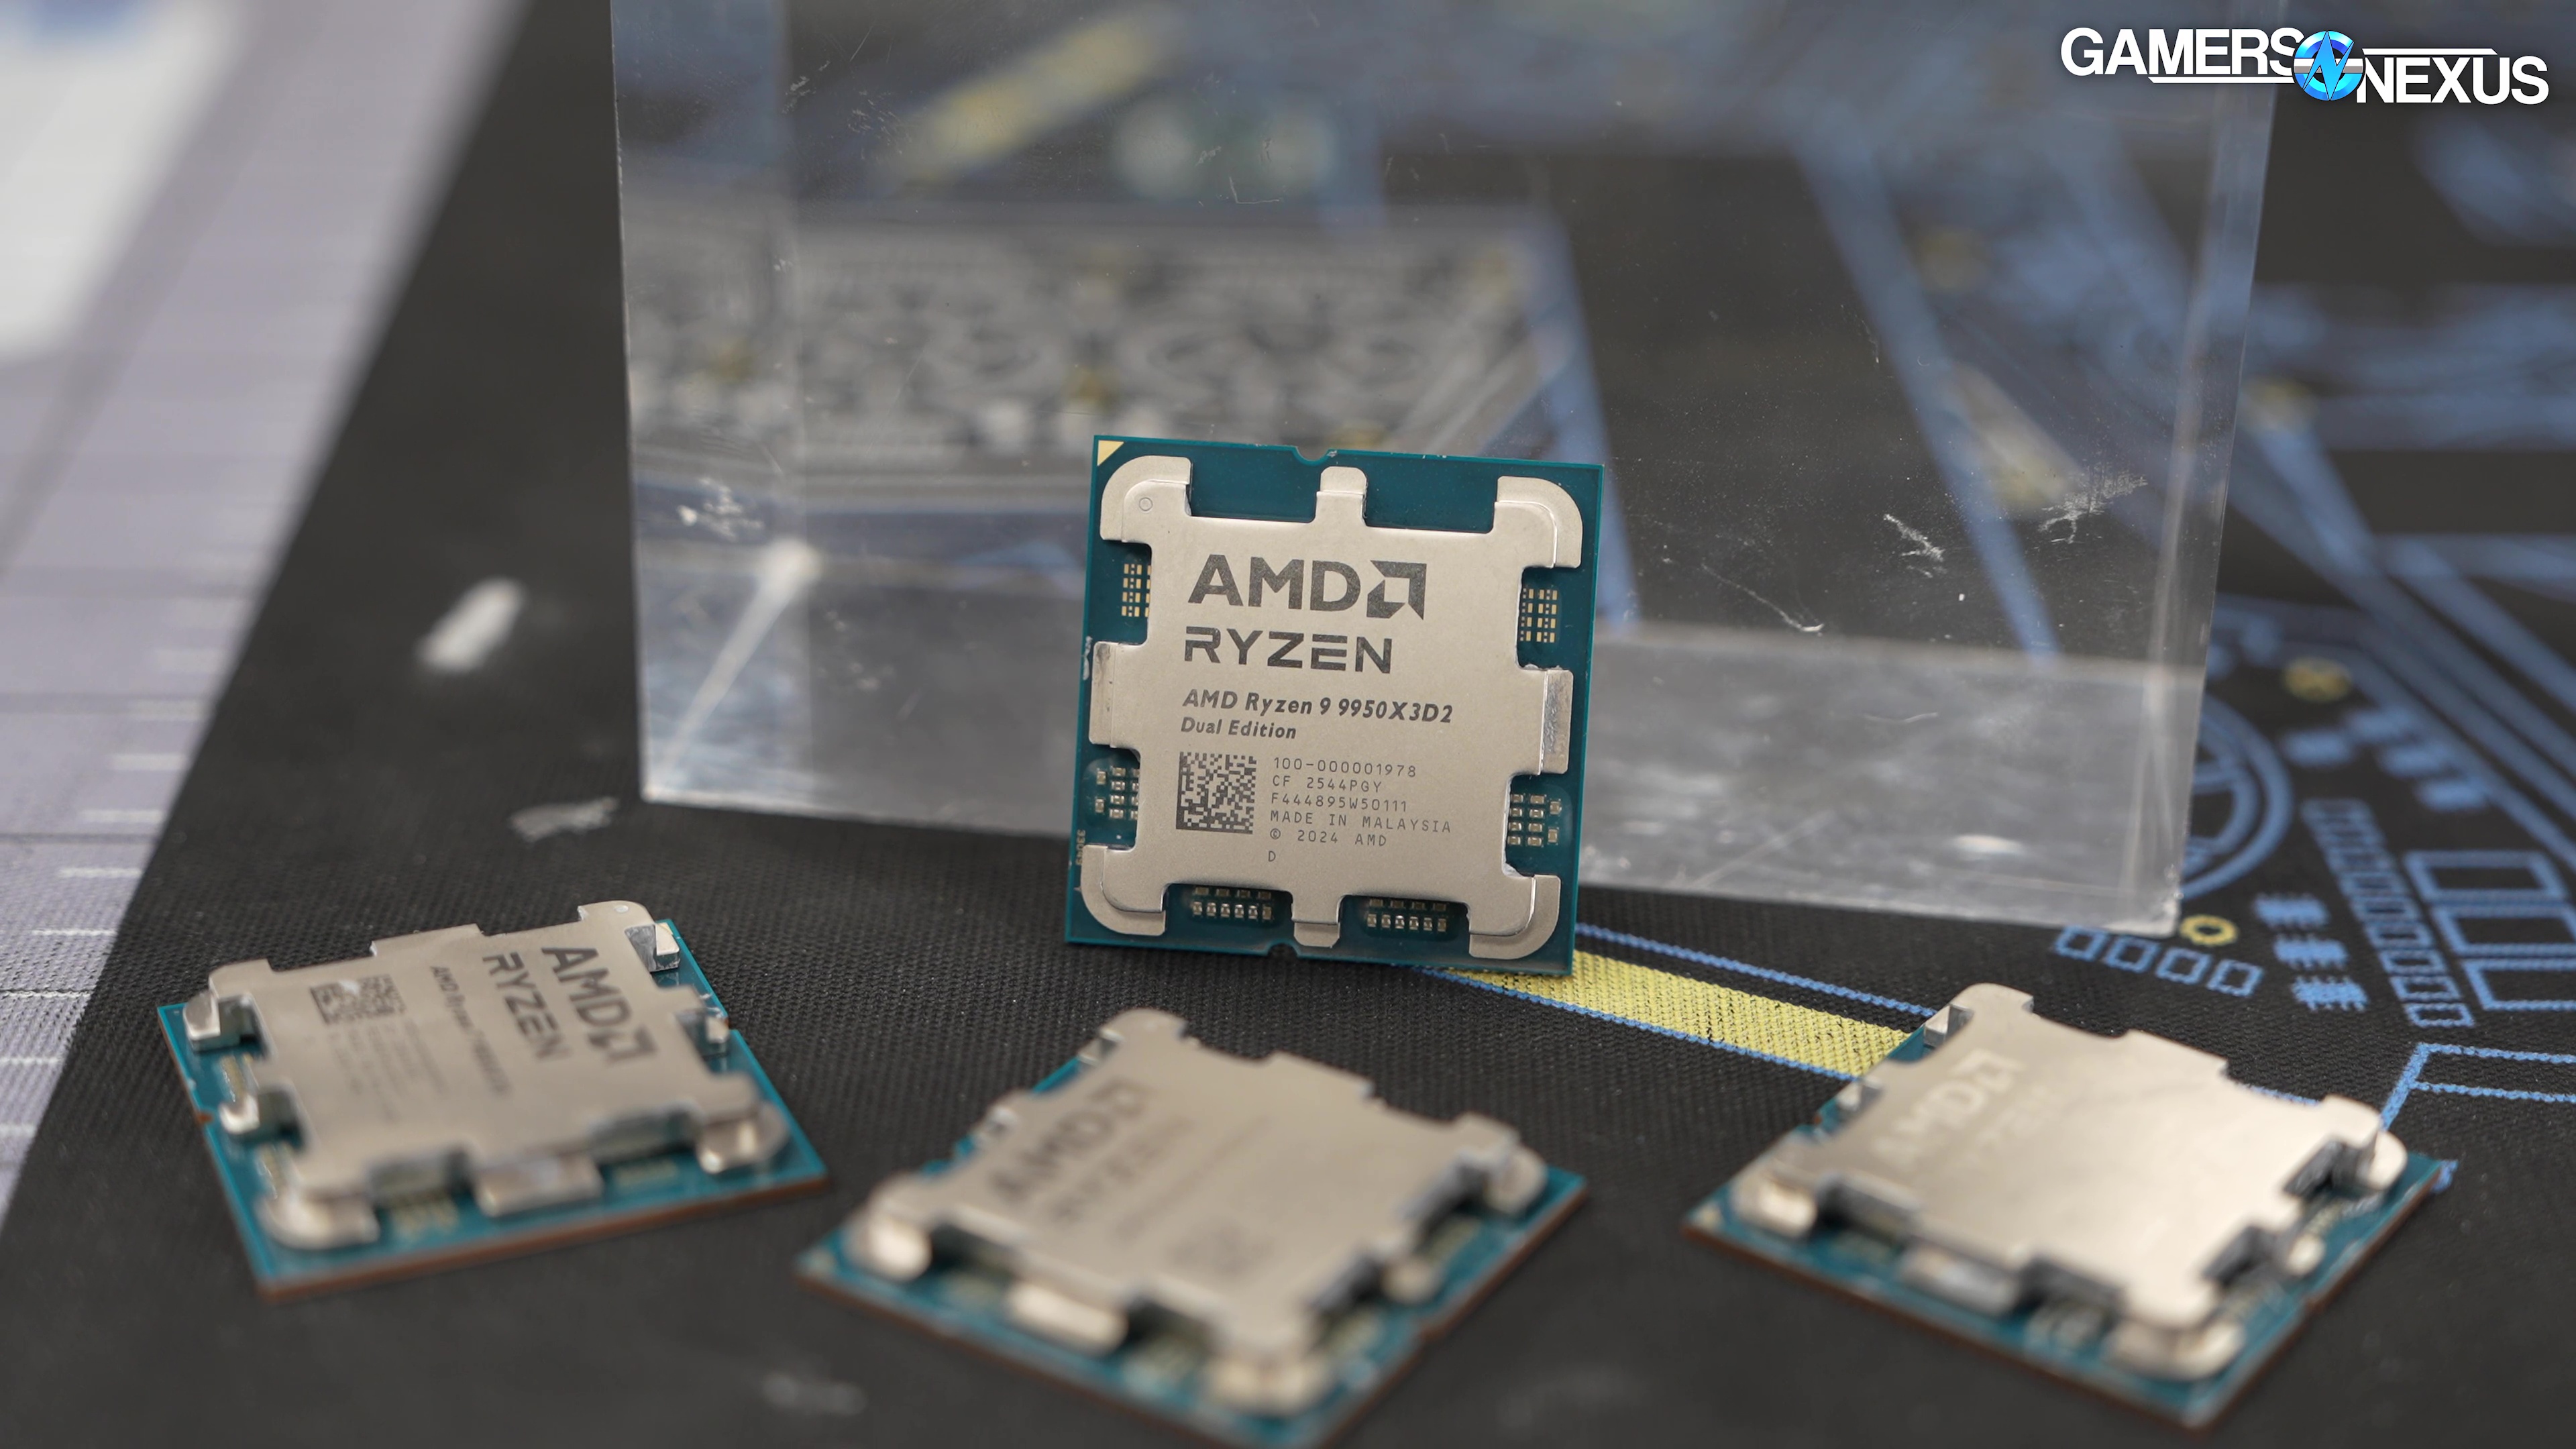
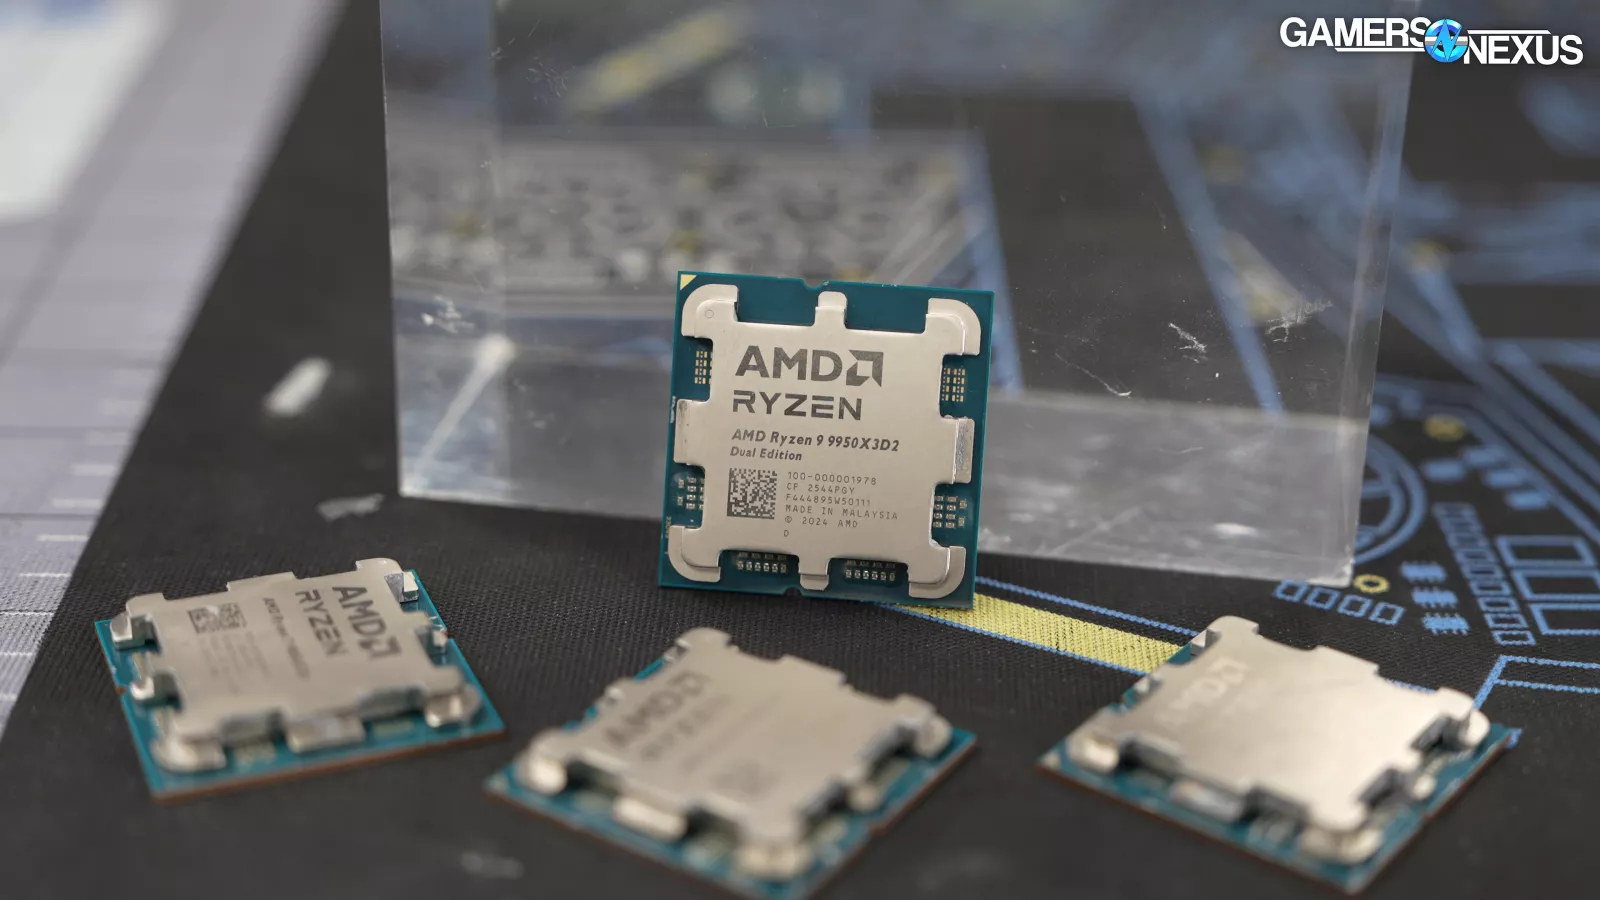
All right, here are the basics: The 9950X3D2 is a $900 CPU. It's two CCDs. It has an IO die. That's three total chiplets. The two CCD chiplets have stacked V-cache, both of them this time. That's the difference, which brings up the L3 cache to 192 megabytes. And that's really the key here. It simplifies the scheduling. It simplifies the core parking situation.
Now, the problem with this is AMD was pretty hesitant to release such a solution for years. We actually got to see this, we think it was the 5950X (watch our review) version, many years ago. One of those didn't come out and the reason for that is what you're going to see today. In most cases, it’s not interesting. There's one case where it was very interesting, but that's kind of what we're evaluating. Basically, it makes things simpler. It's just that the stuff it's simplifying is mostly automatic anyway.
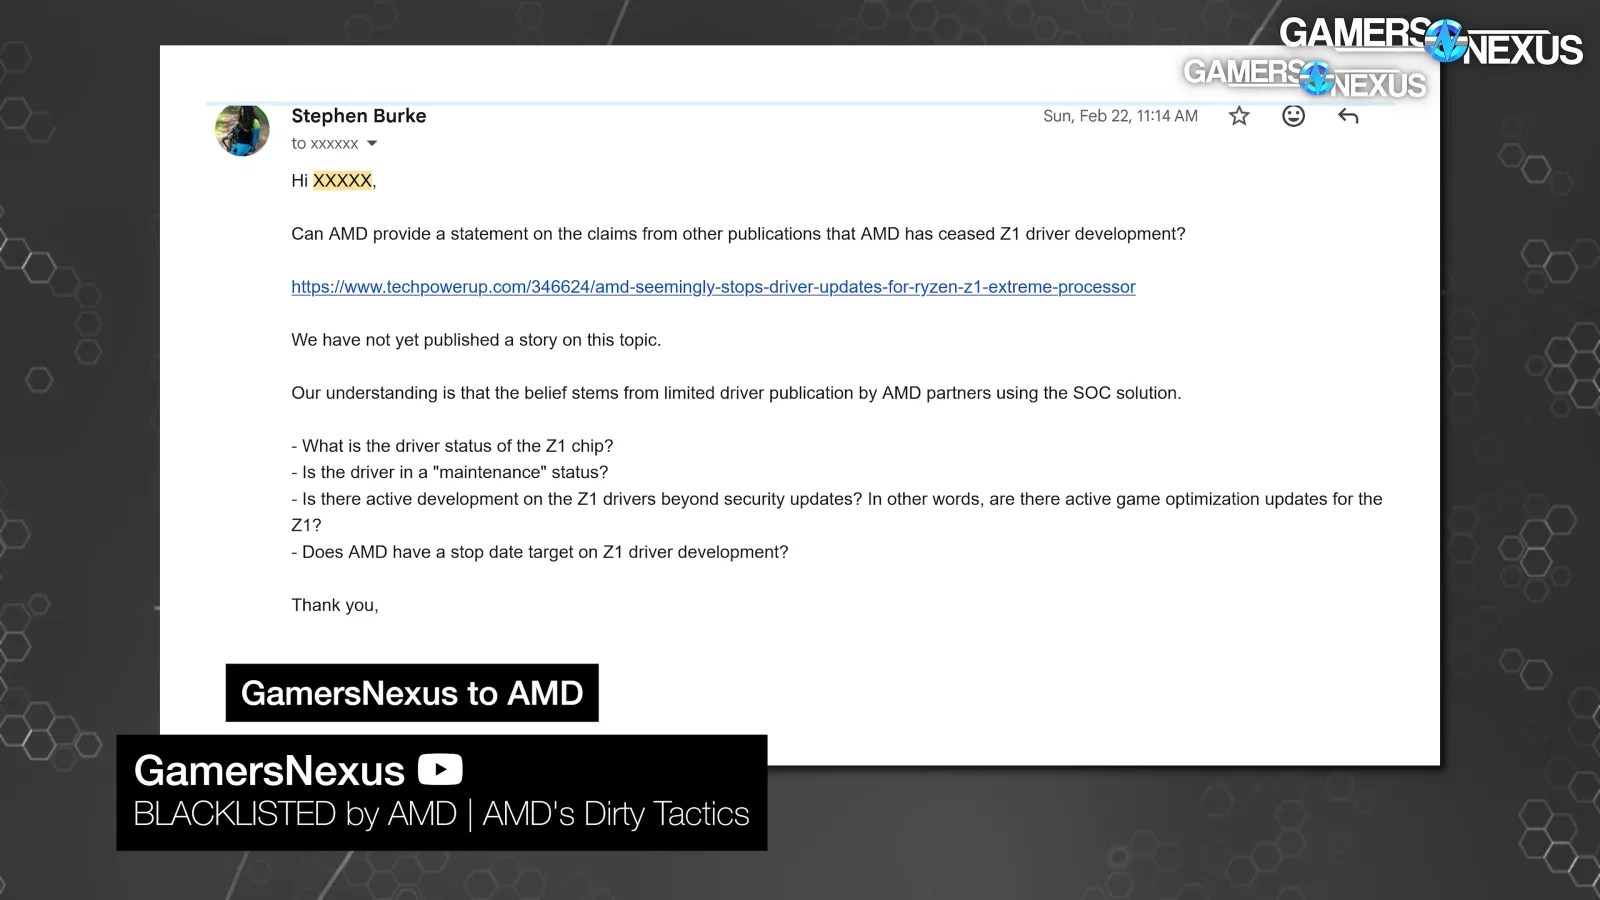
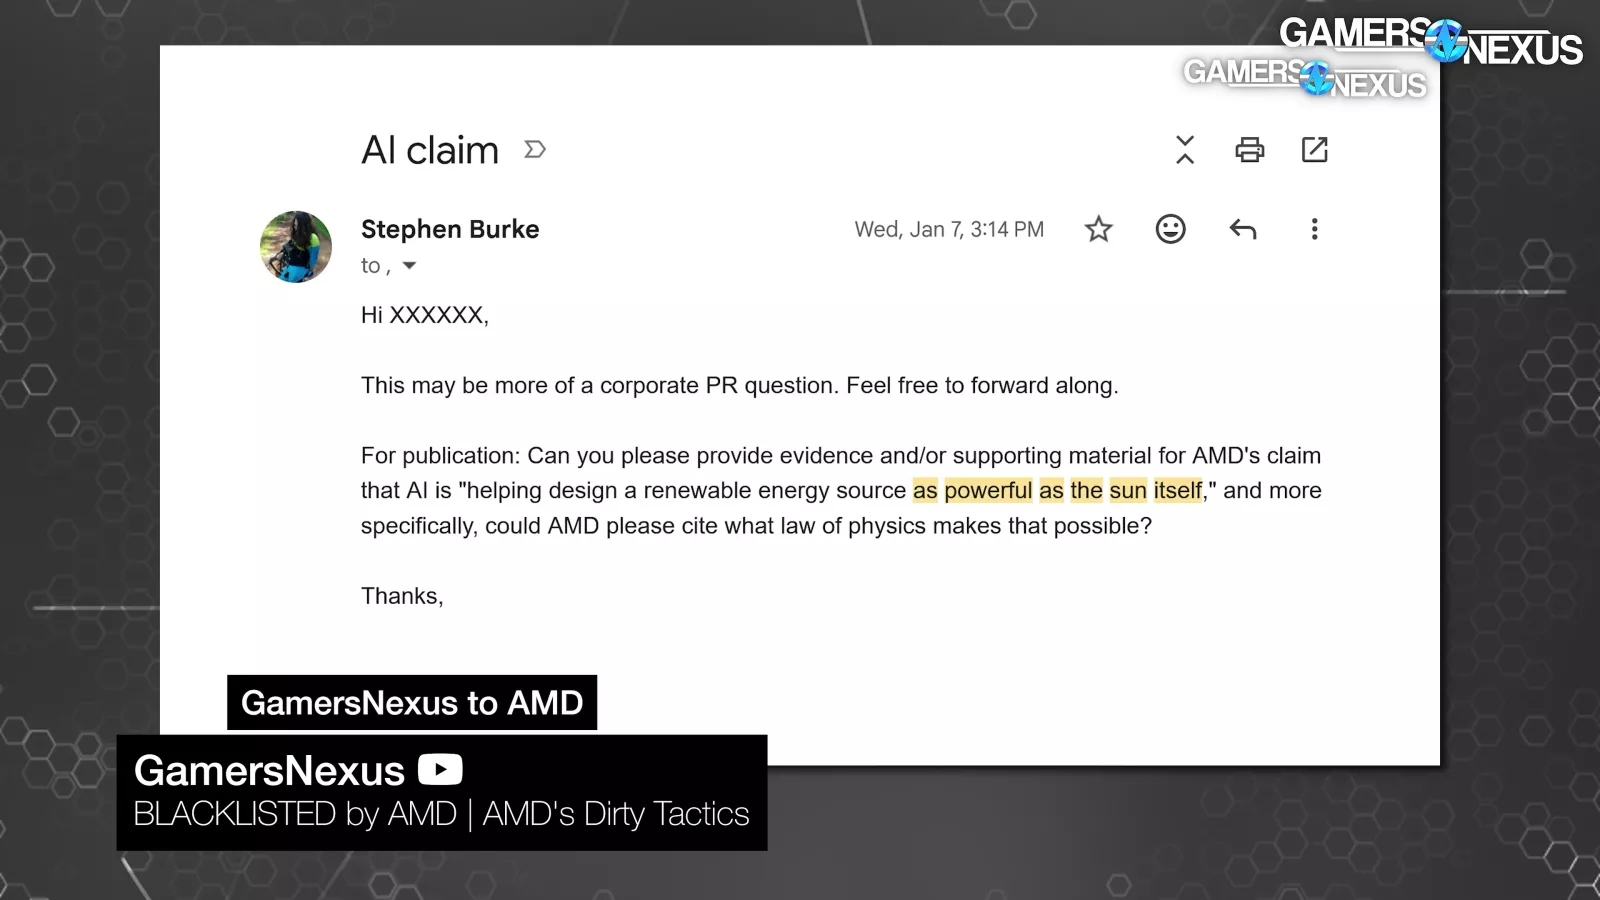
AMD, as we said in a video, has not responded to us for actual queries about any of the stuff we're asking about for content for months now. So, we are testing this as consumers. Technically, this processor launched on the 22nd, and we're benchmarking it just like an end user would. We got nothing from AMD because it doesn't seem to talk to us anymore. As soon as the CPU arrived, we dropped it into a test bench and got it running. And, 24 hours later, we've got a super dense review.
Specs
The specs are simple on this:
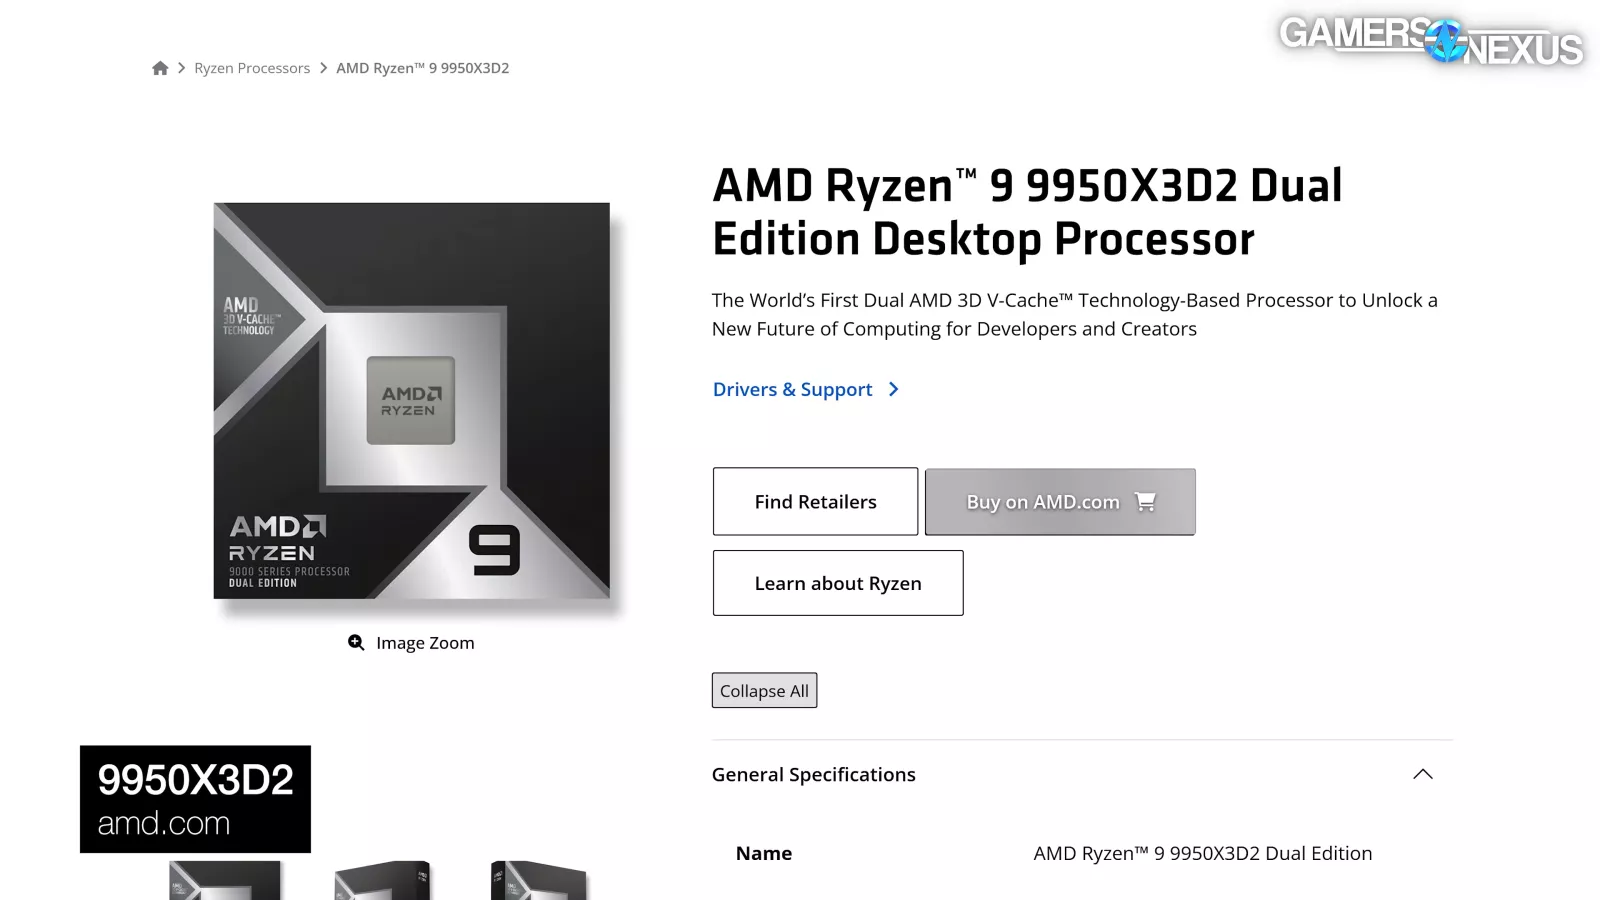
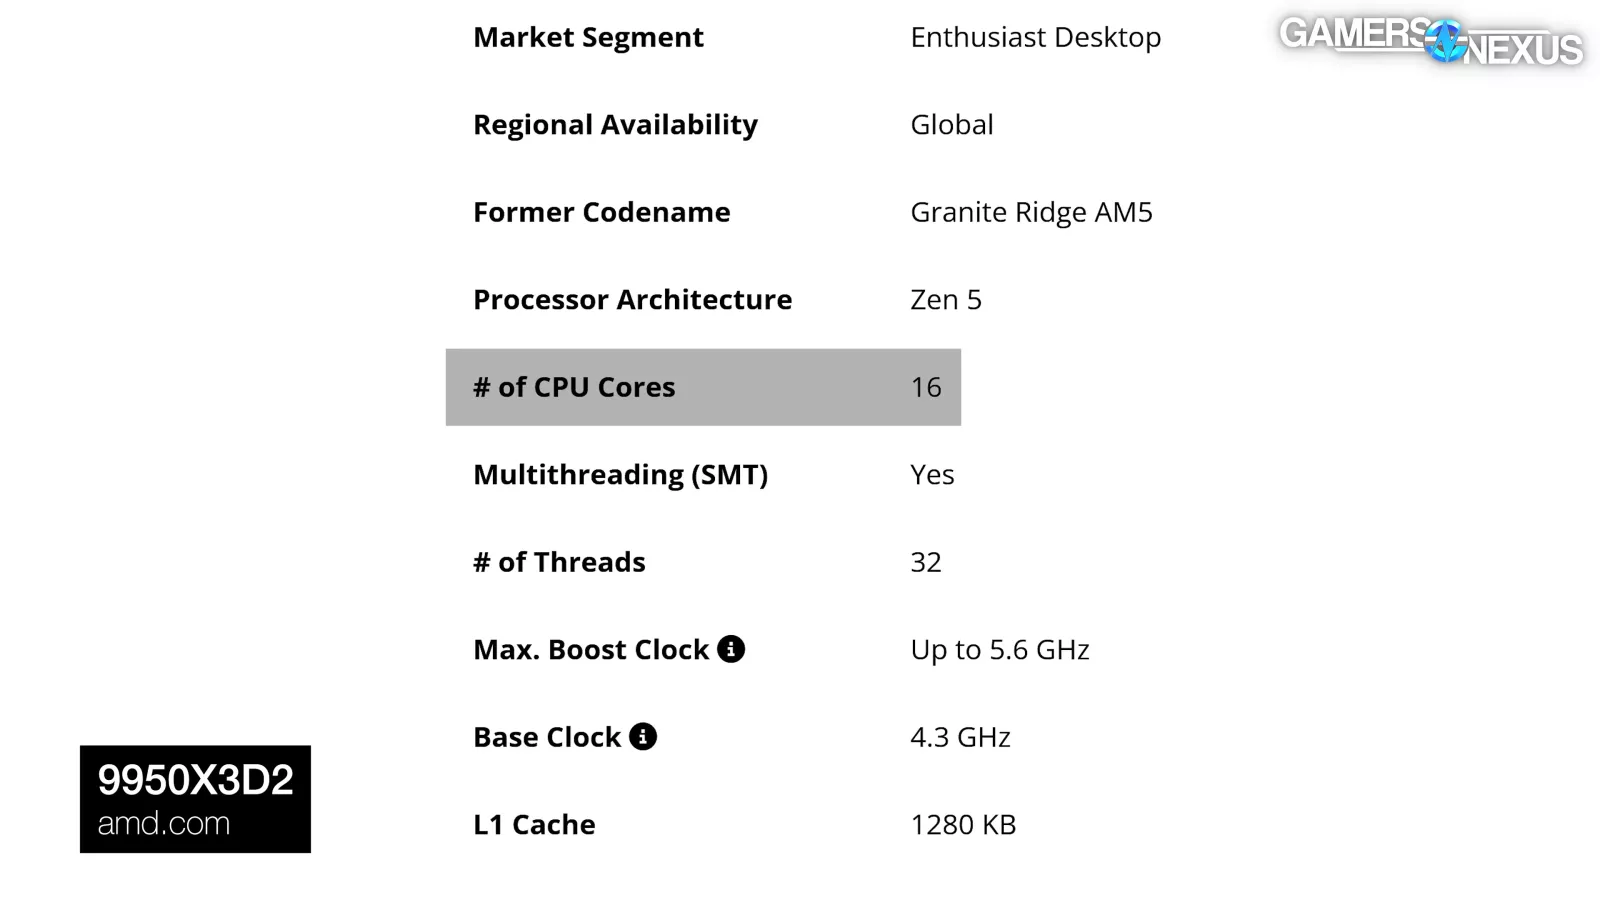
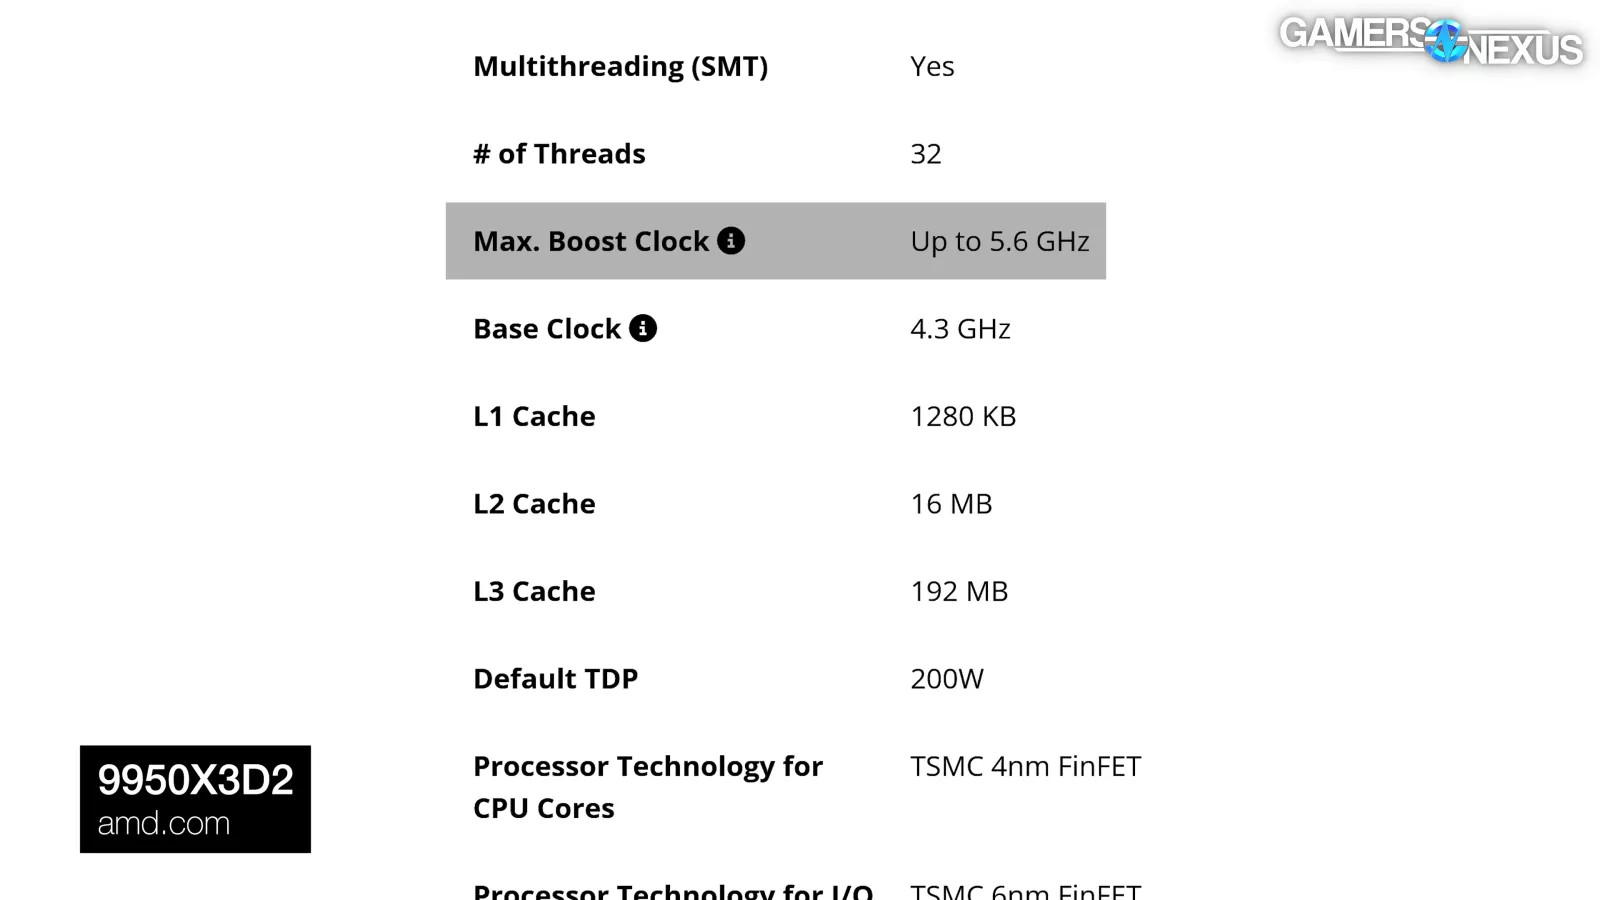
The AMD 9950X3D2 is a 16-core, 32-thread CPU on Zen 5 architecture and uses the AM5 socket. The CPU has a maximum advertised boost of 5.6 GHz, which we’ll validate, and a base clock of 4.3 GHz. Other specs include 192 MB of L3 Cache due to the V-cache stacking on both non-IO chiplets. TDP is at 200W claimed for this part.
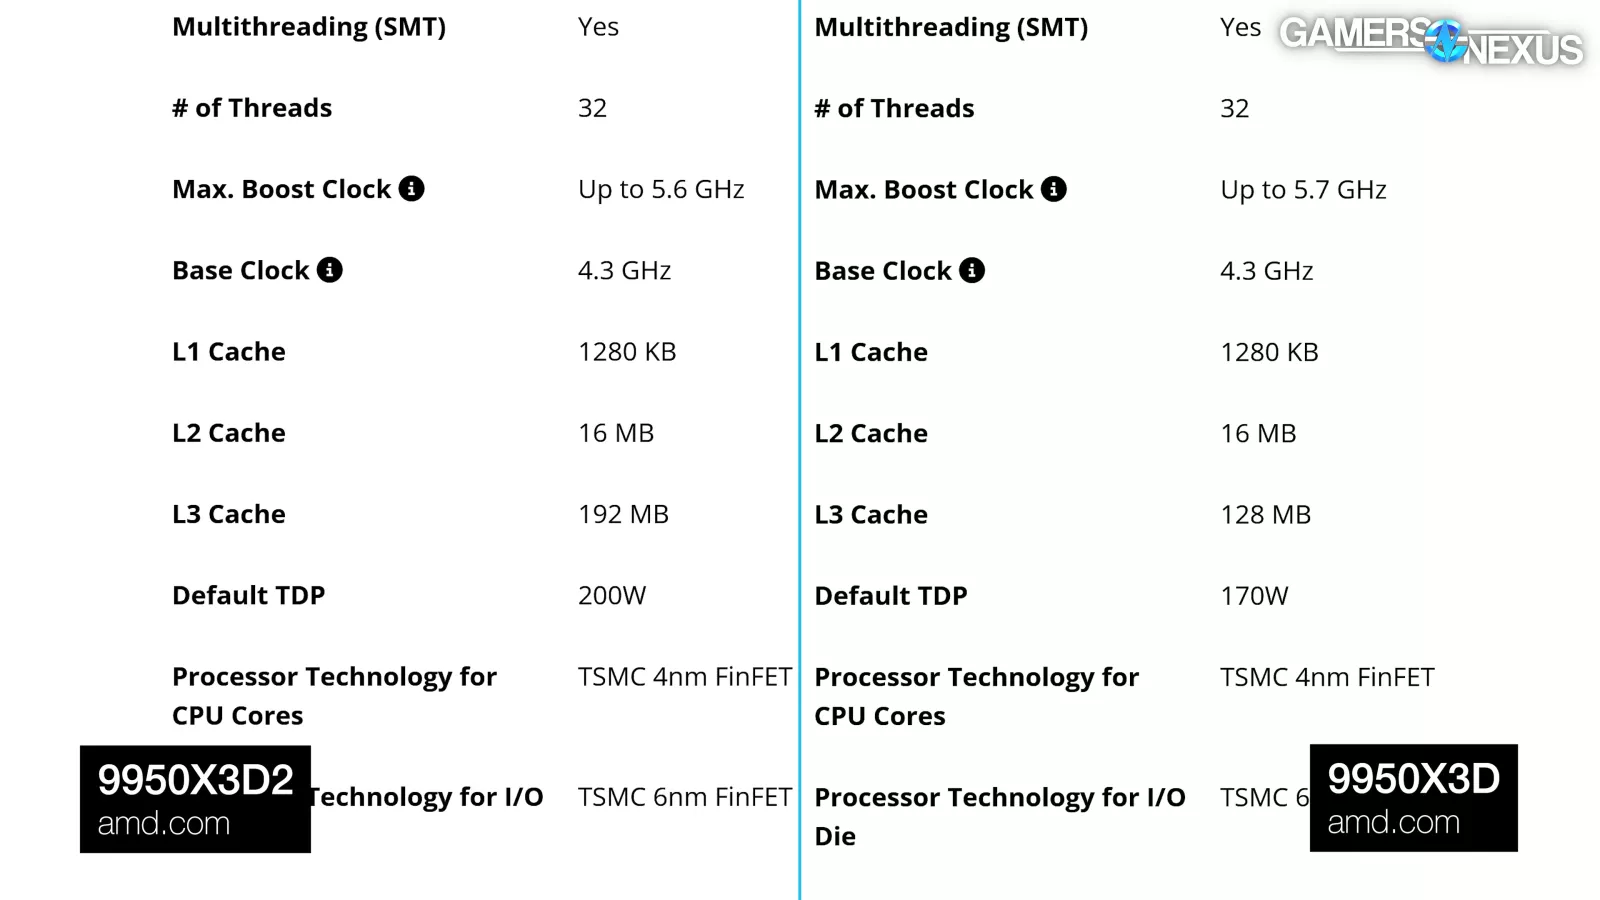
Compared to the 9950X3D, the new X3D2 has a lower clock (down 100 MHz from 5.7 GHz), the same base clock, and of course, the X3D2 has more cache, at 192 MB vs. 128 MB for the prior 9950X3D-non-2. TDP is also higher on the new part, at 200W instead of 170W, which gives the 9950X3D2 more power budget that it’ll need.
Those are the main differences.
CPU Price Update
It’s time for a CPU market pricing update.
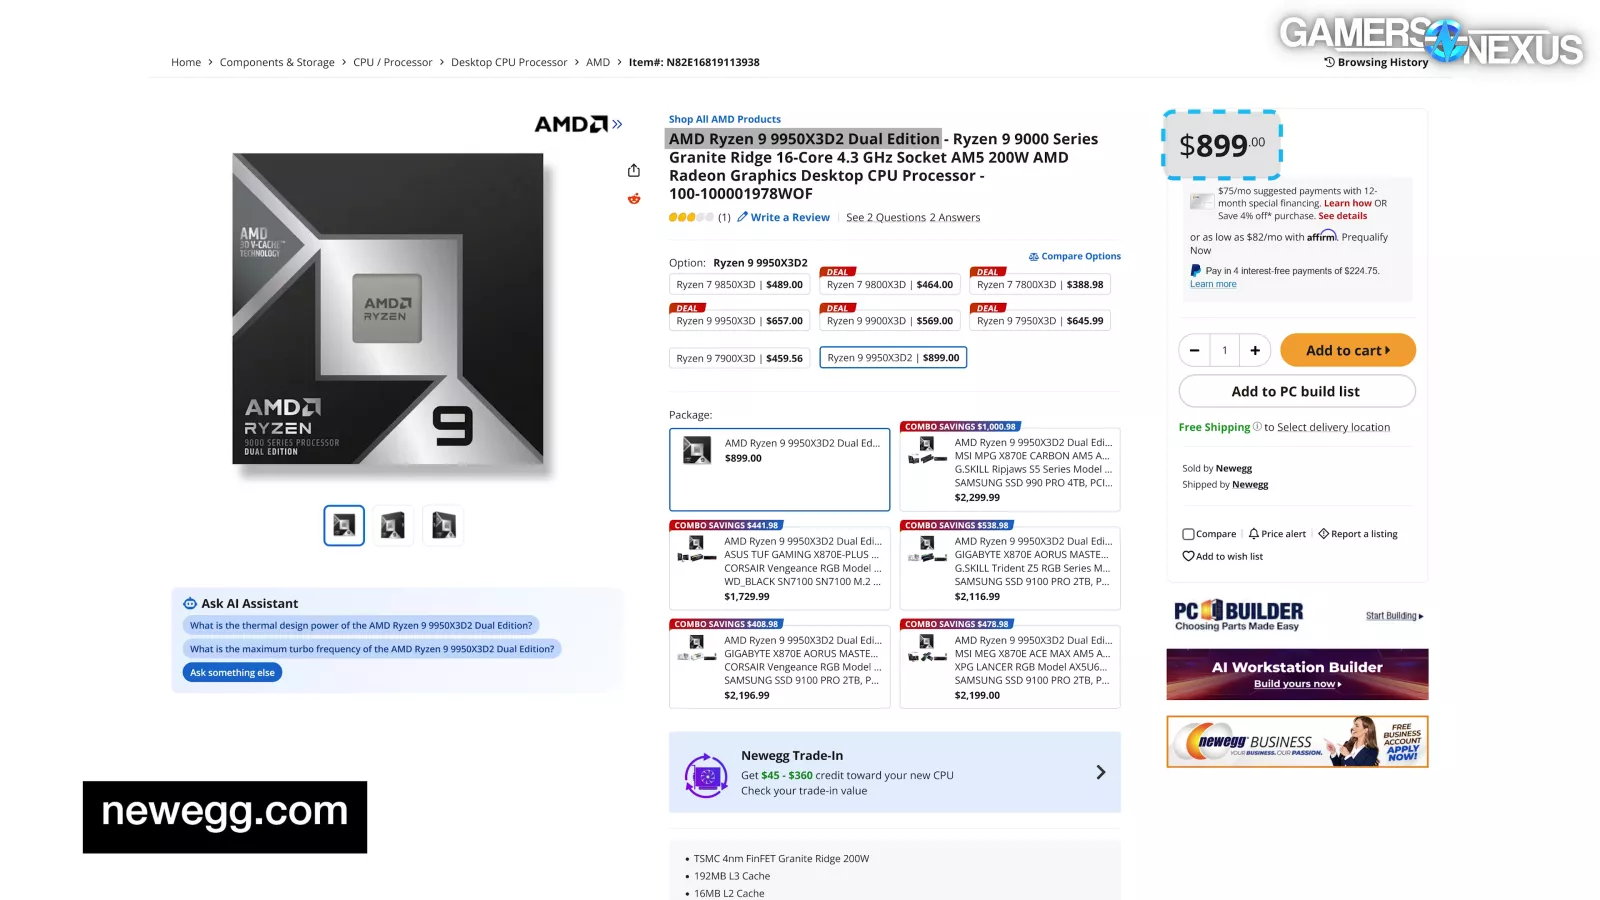
The 9950X3D2 is a $900 CPU, which is astronomical and in the high-end of the market. That’s bordering where HEDT CPUs used to be sold.
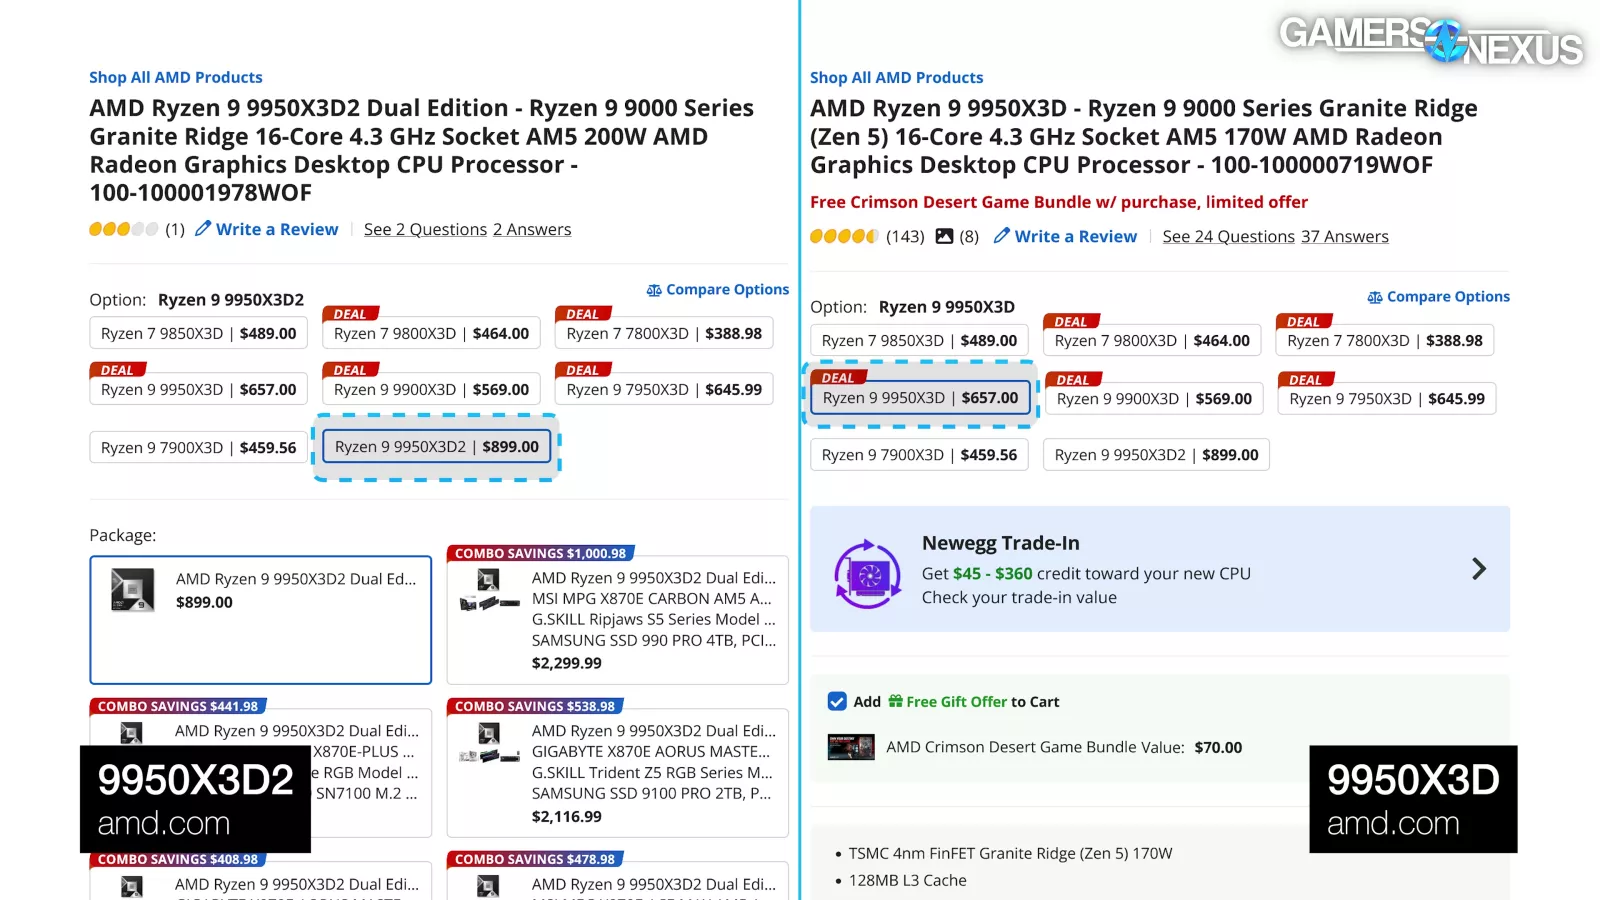
By comparison, the 9950X3D with just one stacked cache die is $657 right now, marked down from $700, for whatever that’s worth. That means the 9950X3D2 is 37% more expensive than the 9950X3D in this comparison, although we’ve also seen them 30% apart.
For gaming parts, the 9800X3D is currently $464 on Newegg, with the 7800X3D way down at $389 -- actually worth considering, assuming you either have RAM already or are just fortunate enough to be able to afford it.
For gaming users, the 8-core X3D parts are substantially cheaper than the 9950X3D2 and 9950X3D and will provide better or the same performance. For workstation users, the 9950X-non-3D makes sense to consider at its $500-$520 price point, as we’ve already seen that the 9950X3D just doesn’t gain much benefit in our production benchmarking.
Intel’s 270K Plus CPUs just launched at $300, but they’re already $350 on multiple retailers. That seems to be the new price, so Intel’s competition in production is a $350 part against AMD’s $900 X3D2 or, more reasonably, AMD’s $500-$520 9950X.
Threadripper CPUs are cool, but they’re priced out of the direct comparisons for the 9950X3D2, with even the 24-core part at $1400. We didn’t retest it for this round, but our review has data if you want it.
Let’s get into the benchmarks.
9950X3D2 Frequency Benchmarks
Frequency Validation - All-Core
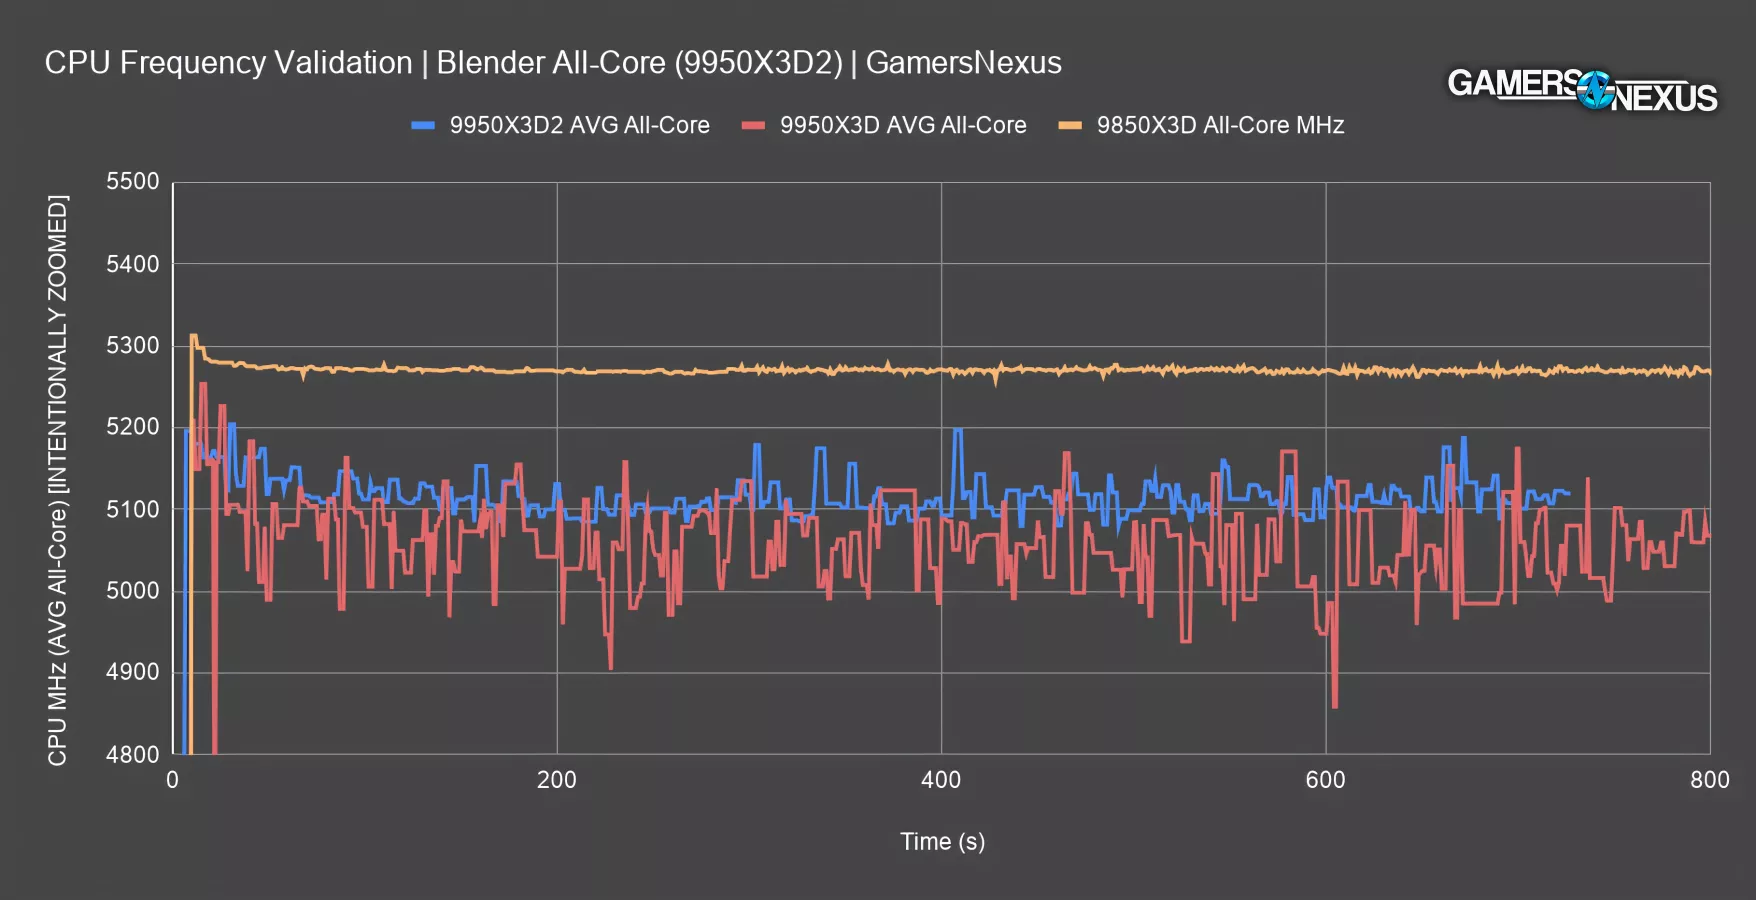
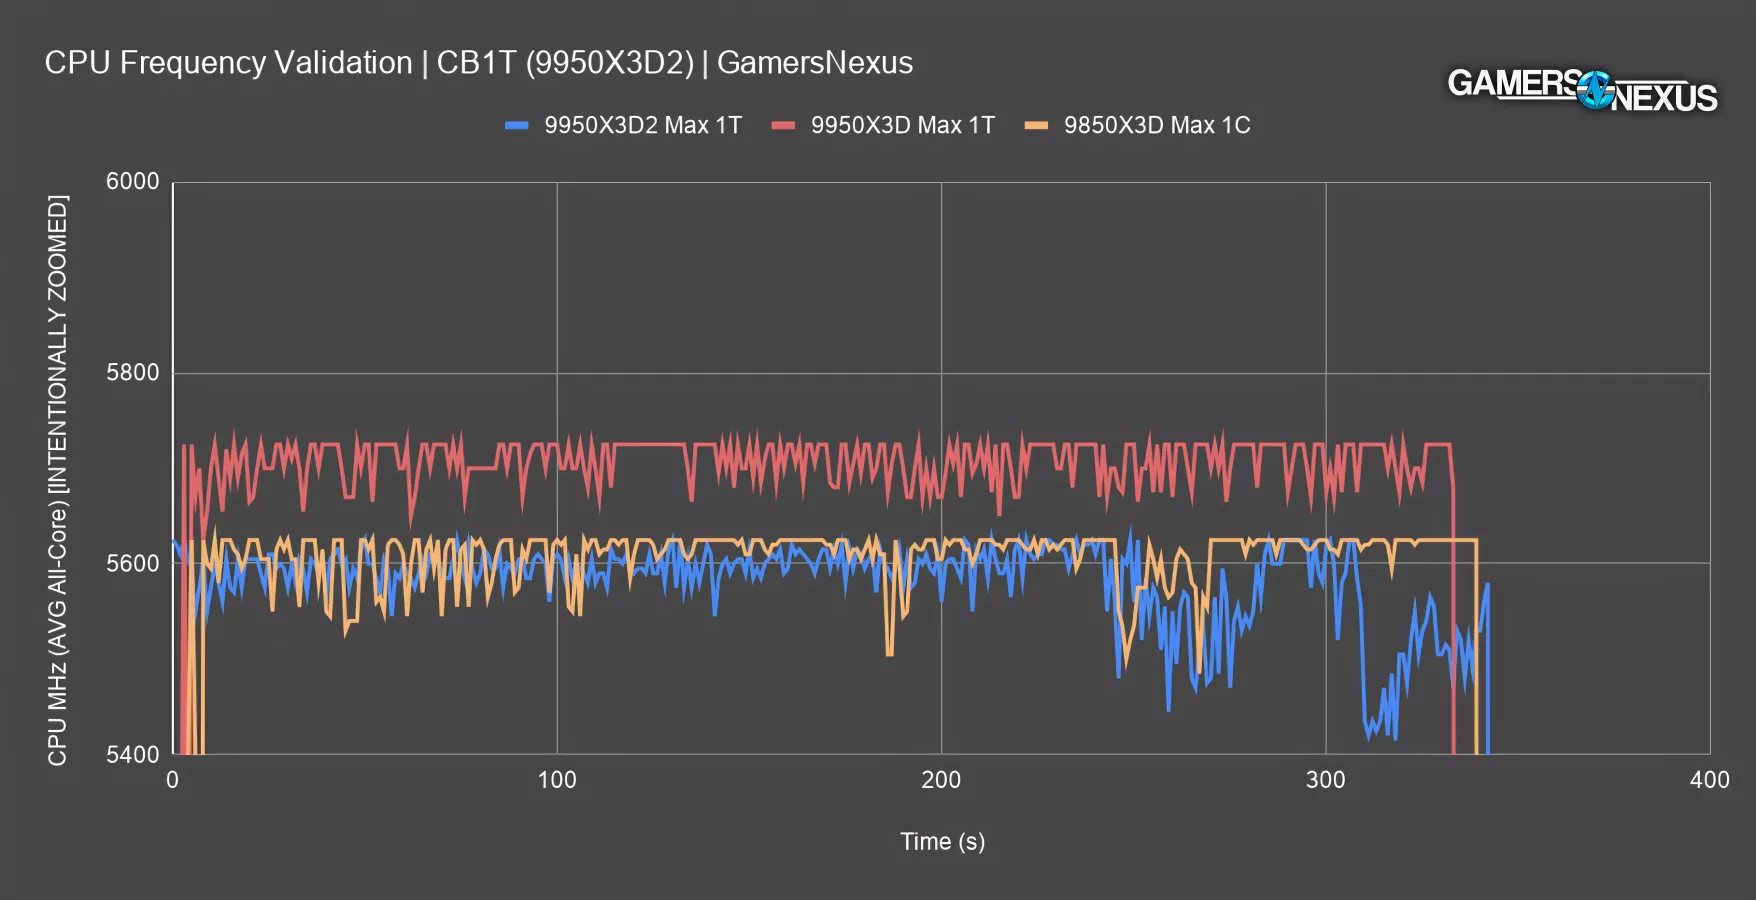
Our first test is frequency validation, which checks the CPU’s clocks against the advertised specs to ensure the processor can hit the claims. We zoomed-in on the vertical axis intentionally, as this makes it easier to see the numerical value of the spikes.
In an all-core workload with Blender, the 9950X3D2 average frequency during the test period bounced around between 5080 MHz and 5196 MHz. Compared to the 9950X3D-non-2, this is an improvement. Our 9950X3D (read our review) test in the same workload had a range of around 4850 to 5170 MHz, with high variability in the clocks. The CPU is bouncing off of power limits as the cores balance the workload.
The 9850X3D (read our review) had a relatively flat frequency, although not as flat as we’ve seen elsewhere. For the 8-core CPU, we saw it typically around 5200-5270 MHz.
Frequency Validation - Single-Core
Next is the single-threaded frequency validation test. This measures against the maximum advertised boost in AMD’s marketing materials, which list a 5.6 GHz clock. The 9950X3D-non-2 has a maximum advertised clock of 5.7 GHz.
In our testing, the 9950X3D2’s maximum clock was typically around 5580-5625 MHz, mostly satisfying the requirement of hitting 5.6 GHz. It’s not always there, but hits the speed enough that AMD is meeting the bare minimum of not lying on its spec sheet.
The 9950X3D-non-2 clocks higher, as the spec sheet suggests: It’s at 5700-5725 MHz in most scenarios, technically overperforming on average.
The 9850X3D is closer to the 5600-5625 MHz mark.
Production: SPECWS
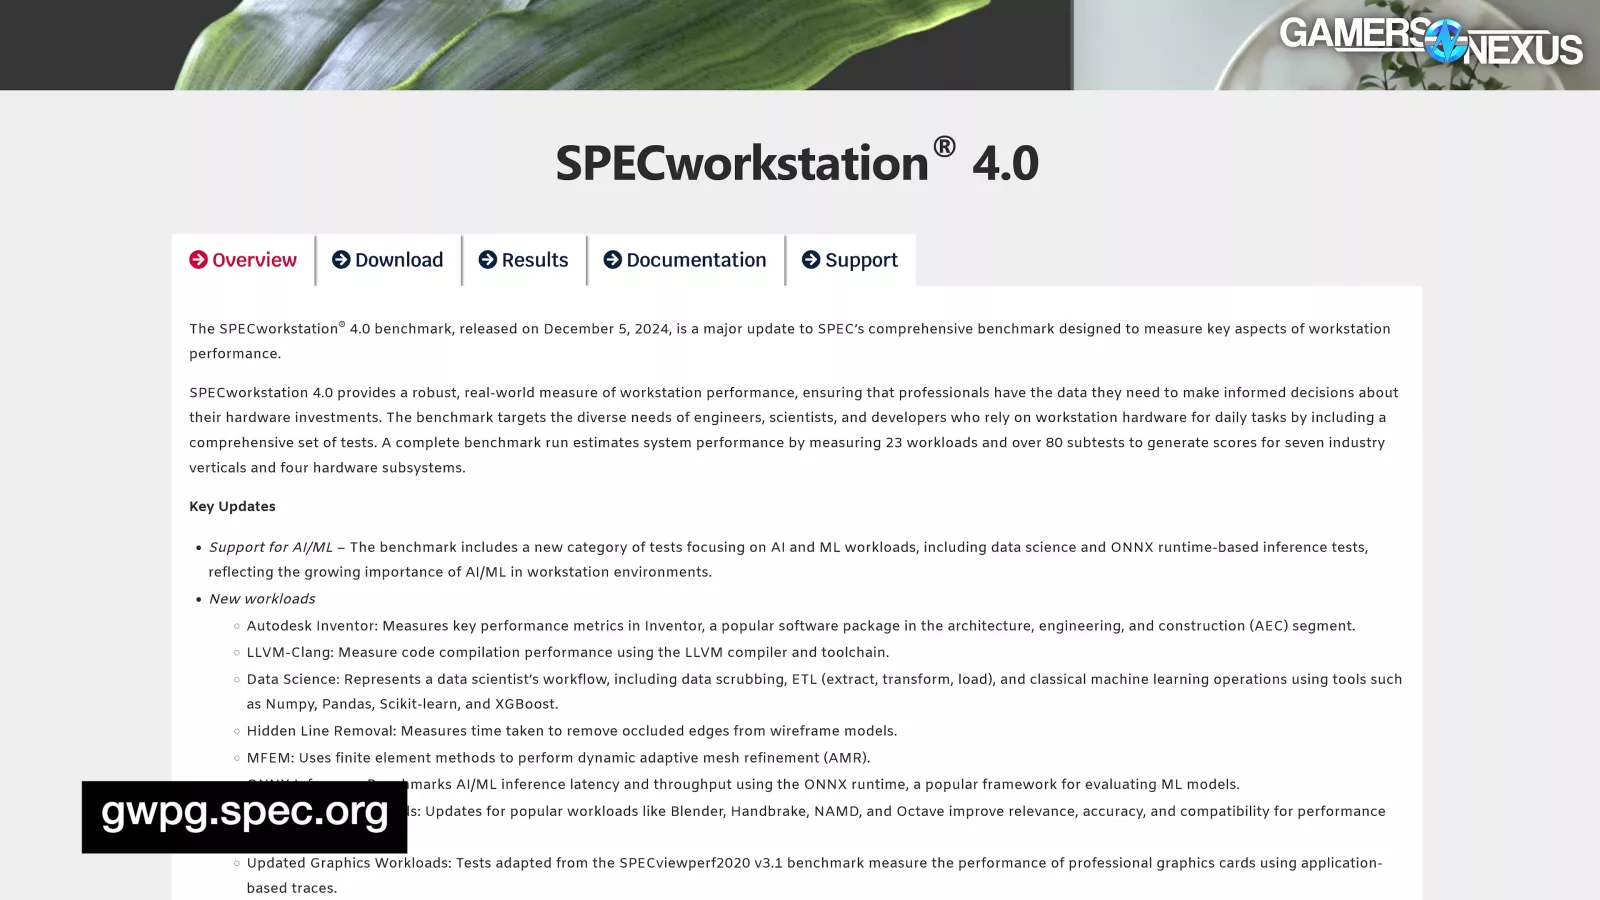
Our production testing will start with our experimental SpecWorkstation charts. We’ve published these in the past sparingly, like for our Threadripper reviews. When we publish experimental charts, that means that we have less experience working with the test and therefore have a higher chance of an erroneous number; however, we still have vetted these and overall have good confidence in them, we just like to maintain that transparency and distinguish between benchmarks we have more experience with.
SPECWS: LAMMPS
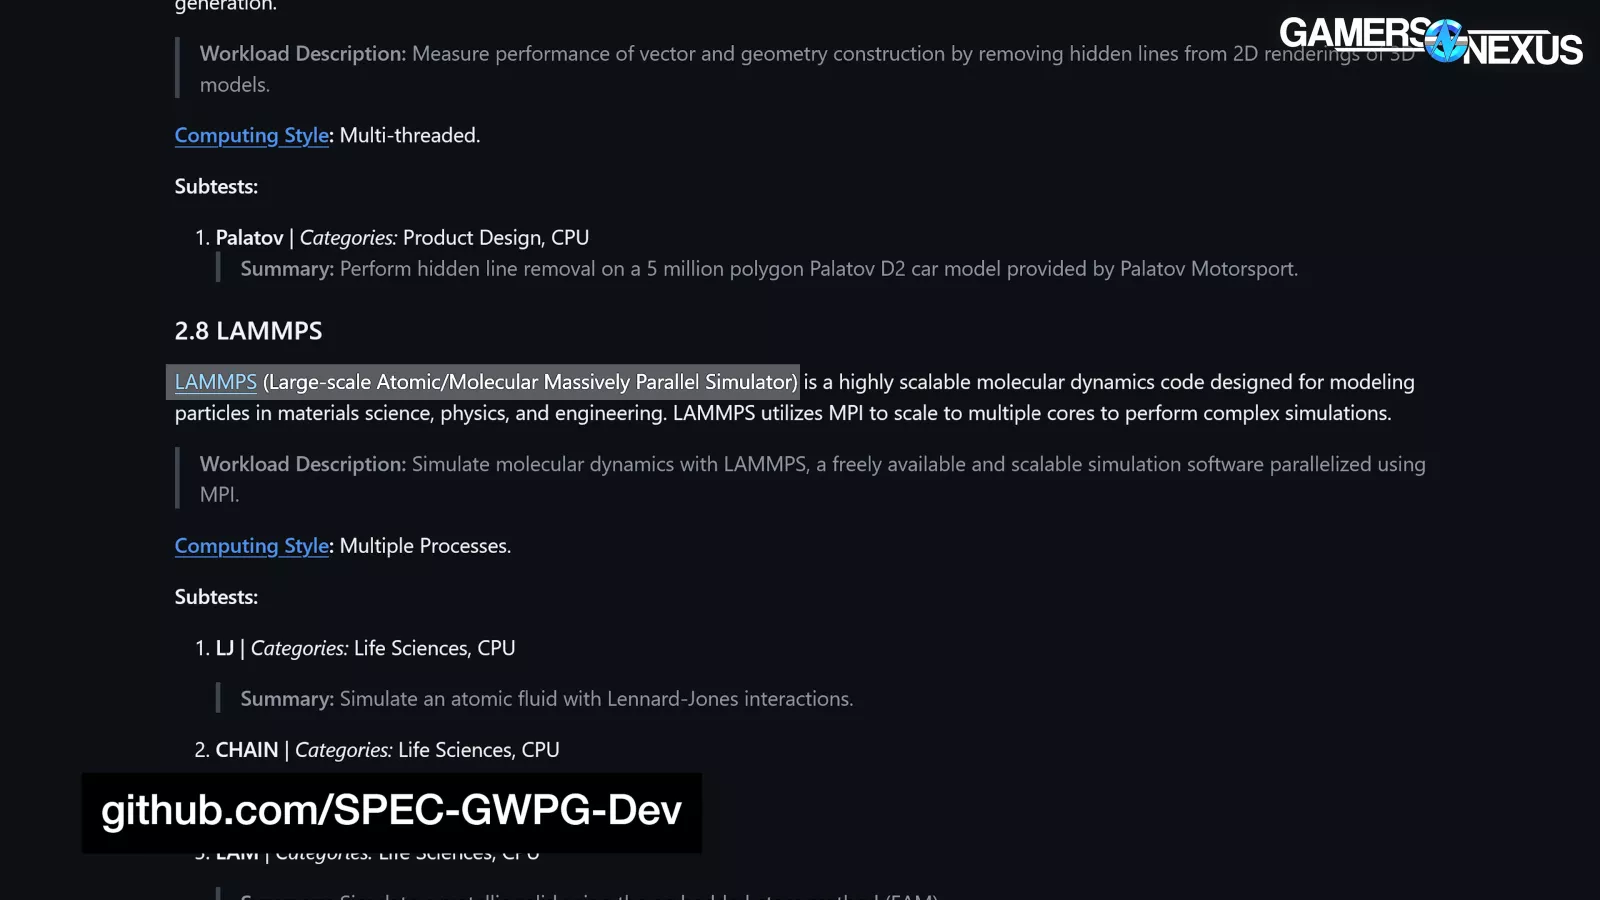
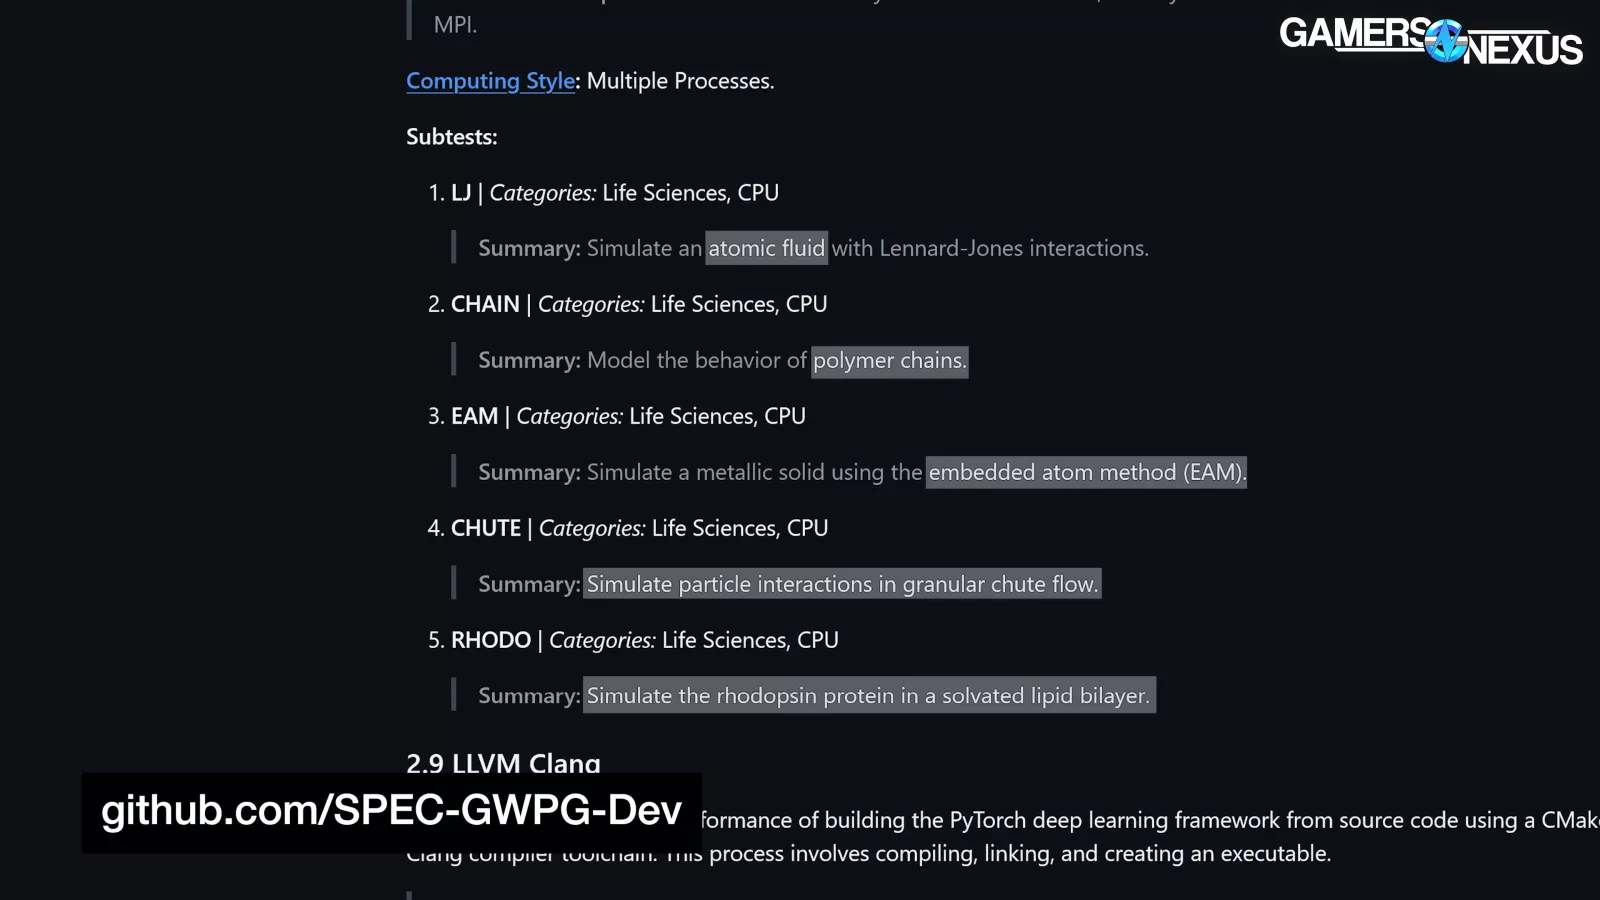
LAMMPS is up first. Quoting SpecWS, LAMMPS testing performs “large-scale atomic/molecular massively parallel simulator” benchmarks. SpecWS says that LAMMPS “simulates molecular dynamics,” referencing atomic fluid, polymer chain, embedded atom methods, and other types of scientific tests.
The 9950X3D2 would be beaten by Threadripper, but we haven’t rerun those since they’re out of the price class. We do have those charts live in our reviews, though.
Here’s the chart.
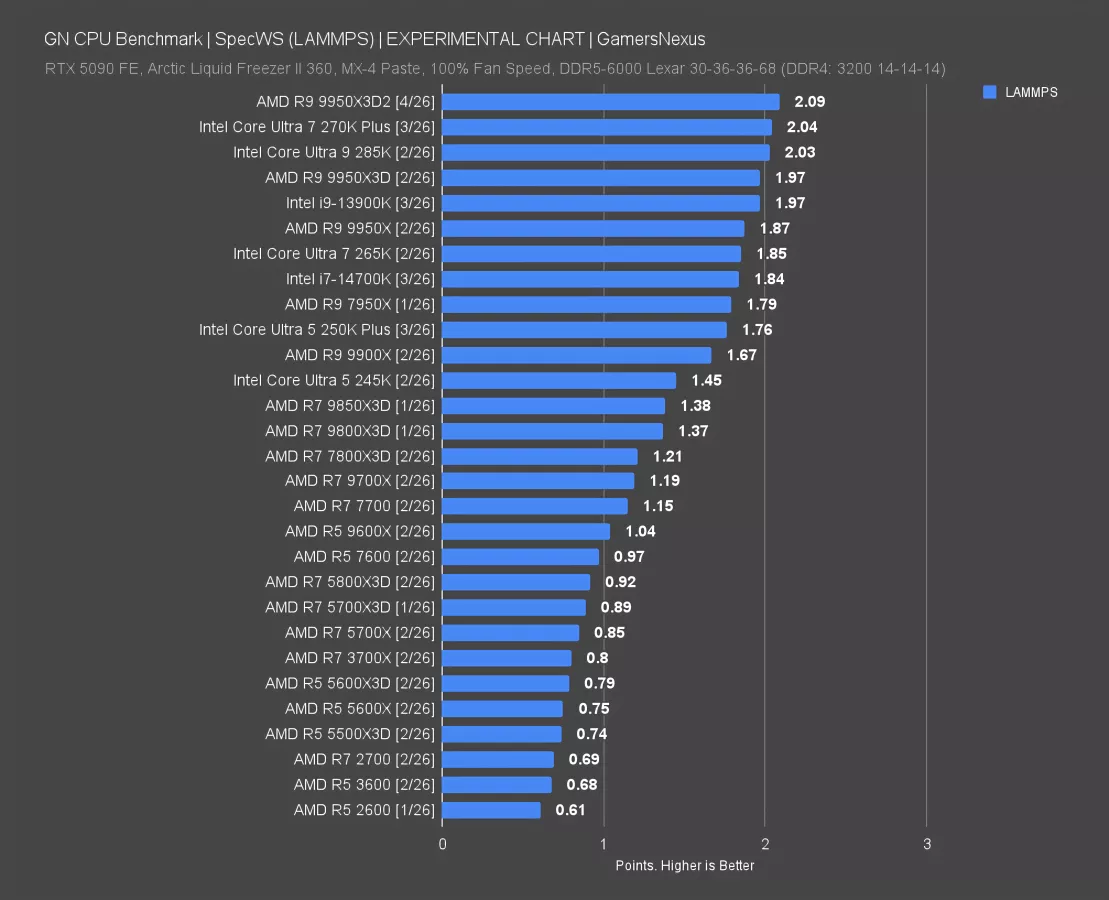
In this test, the 9950X3D2 lands at the top with a 2.09 score. That has it ahead of the 270K Plus’ 2.04 result, which performs admirably, and the 285K’s result. The 9950X3D scored 1.97, so the X3D2 improves by 6%. The X3D-non-2 improved on the 9950X (read our review) base model by 5% previously.
SpecWS: OpenFOAM
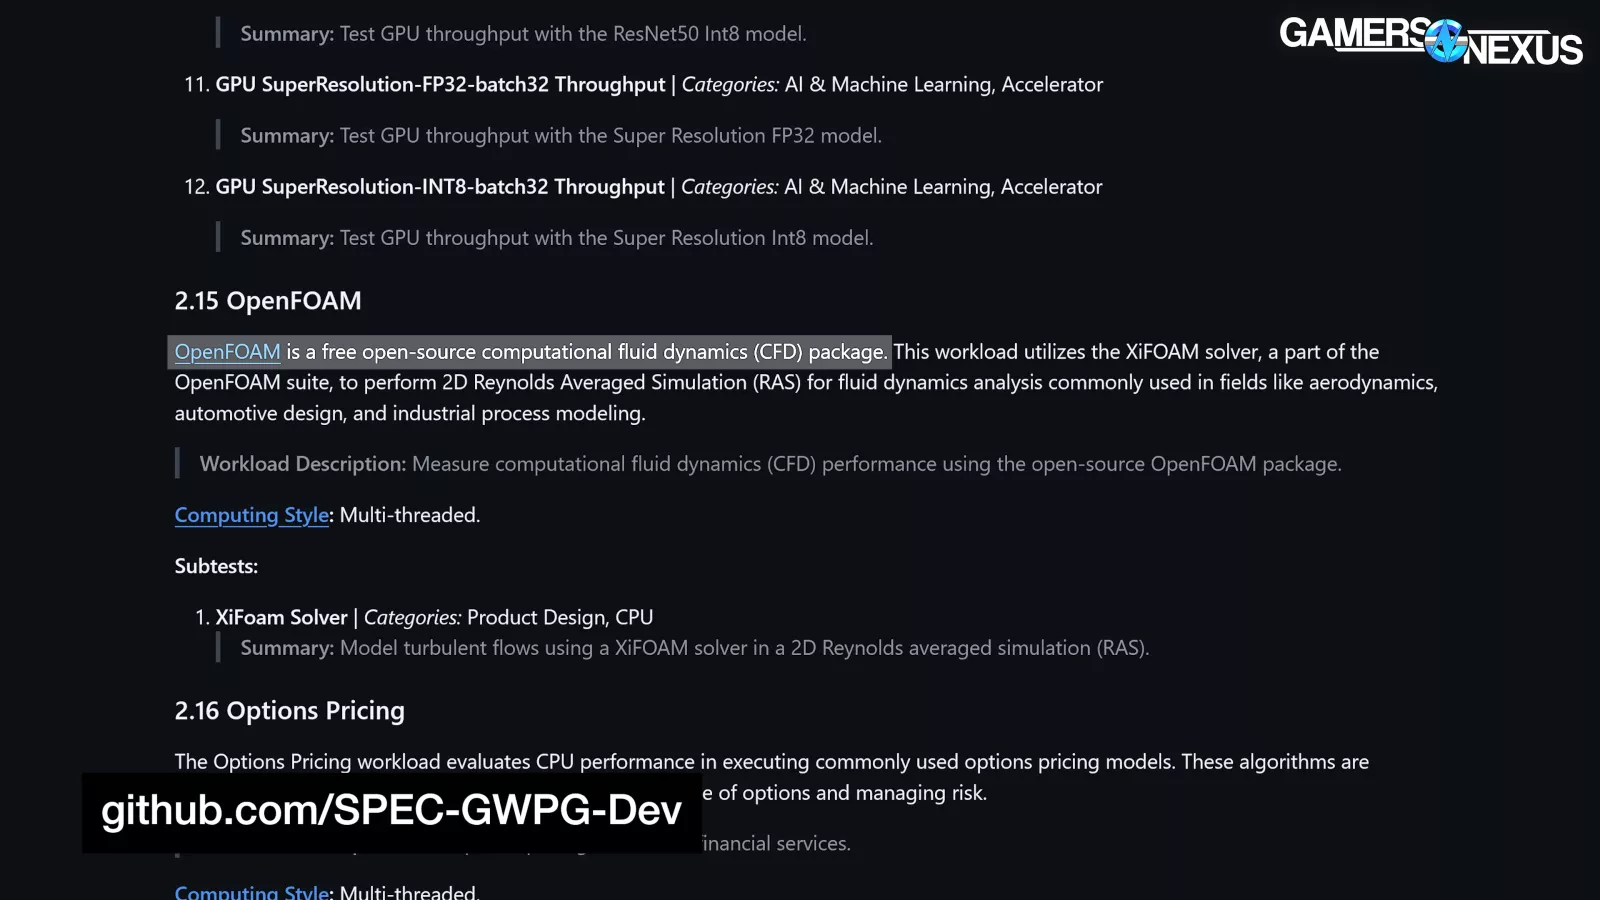
OpenFOAM is up now, which is an open-source computational fluid dynamics utility.
In this test, OpenFOAM via SpecWorkstation has the 9950X3D2 at 9.9 for the score, 24% improved on the score for the 270K Plus and a massive 34% improved on the 9950X3D. The 9950X3D itself improved over the 9950X-non-3D by 21%, which is abnormal. This is a break-out uplift almost entirely from cache on AMD. This does not repeat in any of the other tests that we ran for the review. We also see this behavior with the 9800X3D (read our review) versus the 9900X (read our review) and 9700X (read our review).
This test has the single largest gain we’ve seen out of any tests. We’re not sure how representative this is for CFD utilities or what the real-world implications and use cases are as it’s not our area of expertise. Remember: These are experimental charts and they come from SpecWorkstation.
SpecWS: Convolution
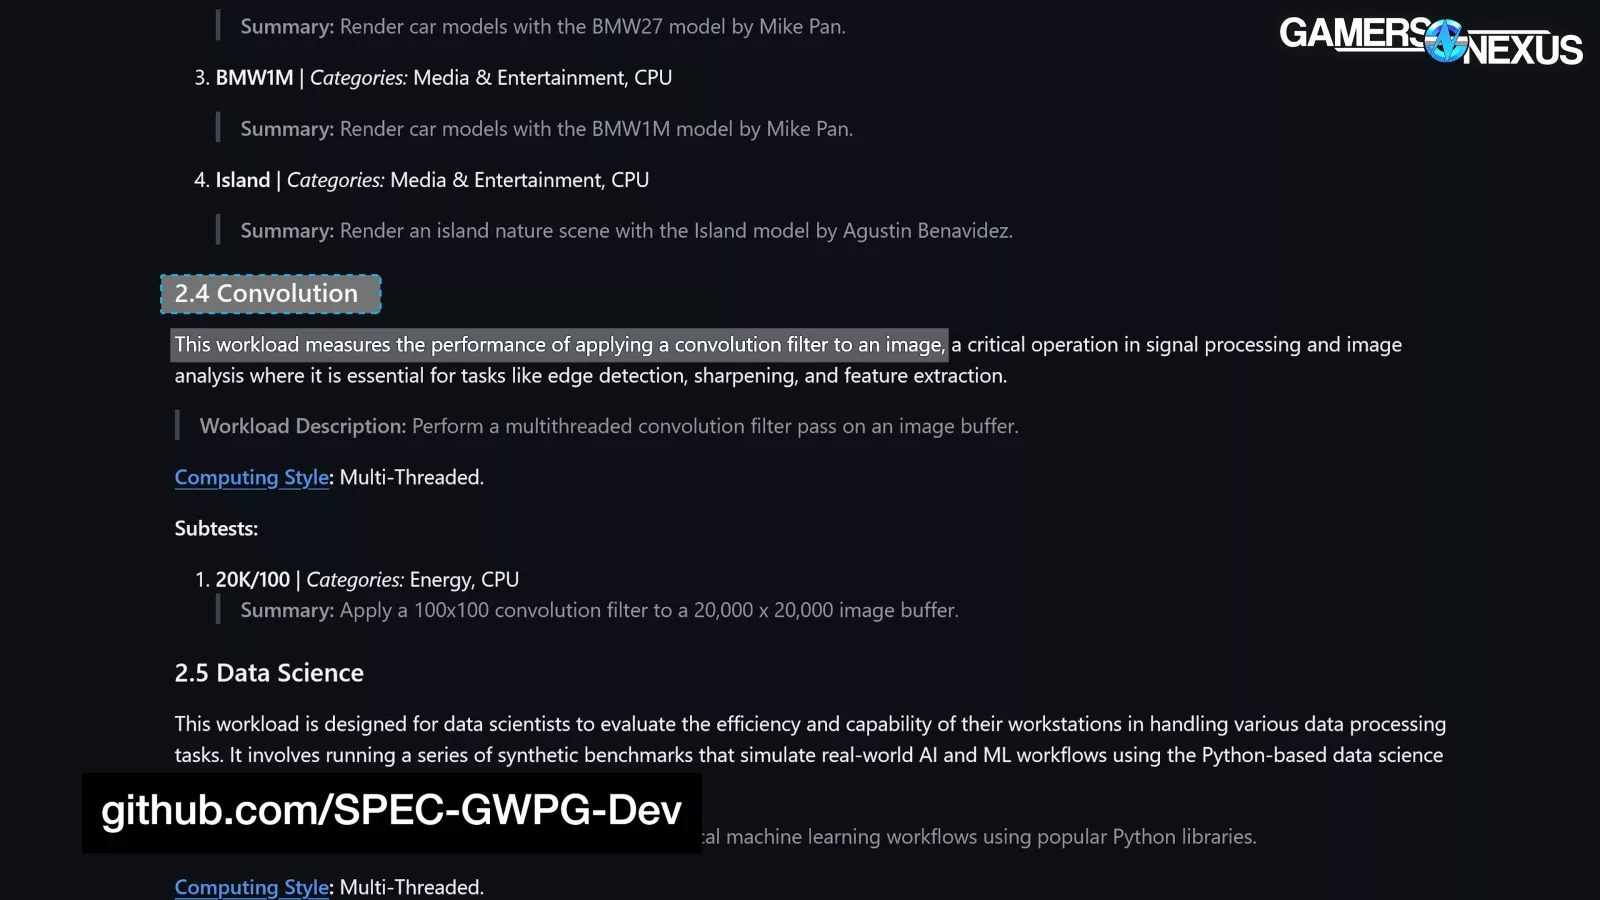
Convolution testing is next. Per Spec, this test: “Performs a multithreaded convolution filter pass on an image buffer, [applying] a 100 x 100 filter to a 20K x 20K image buffer.” Spec says that this is part of signal processing and image analysis, such as in “edge detection, sharpening, and feature extraction.”
In other words, zoom and enhance.
Here’s the chart.
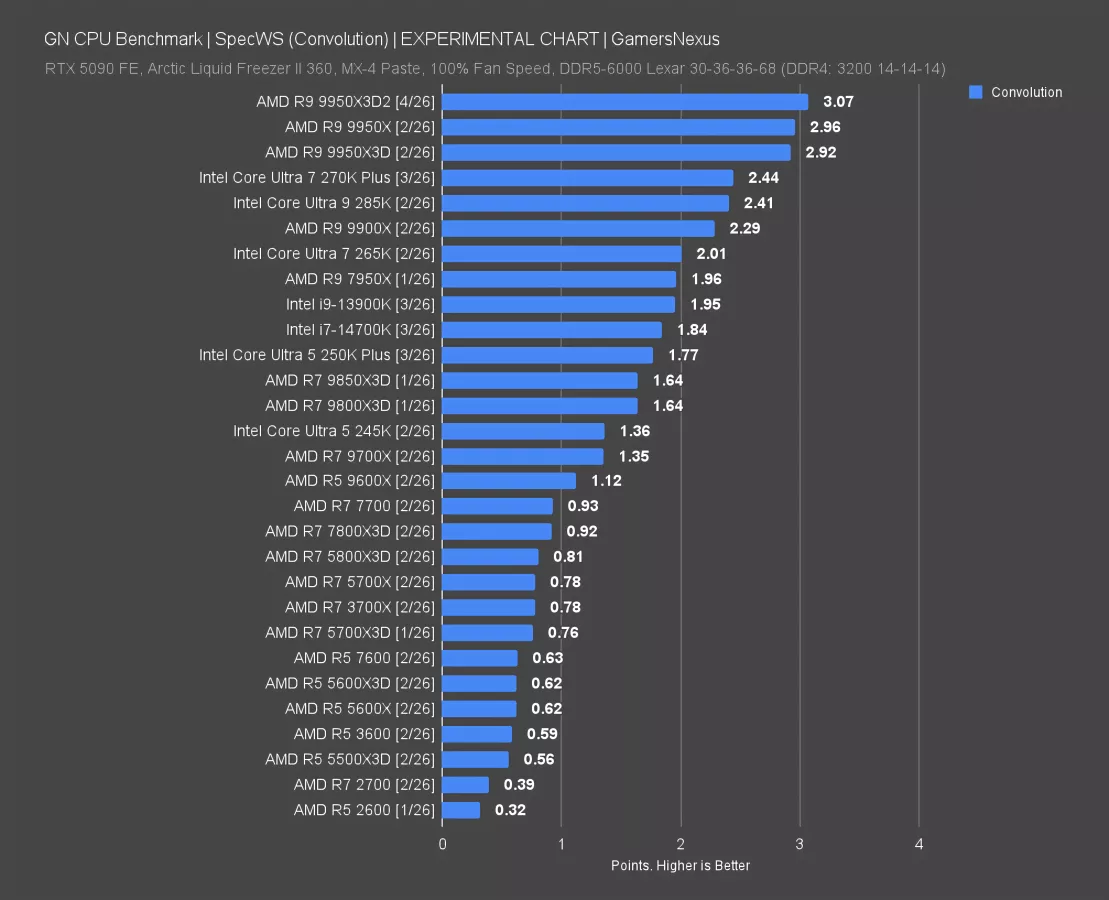
The 9950X3D2 is the best here, at 3.07 for the score. The next closest is the 9950X at 2.96 and 9950X3D at 2.92, which are only about 1-1.4% apart, so these are the same. The X3D2 part scores 5% better than the X3D-non-2 -- is that X3D1? -- and produces one of the better results in our charts compared to smaller gains elsewhere.
Intel’s 270K Plus encroaches on these results, but is still distant: At 2.44, it looks great when compared to the $500-$600 launch of the 285K. The 9950X3D2 is 26% ahead of the 270K Plus, but given the price, it should be more than that.
SpecWS: NAMD
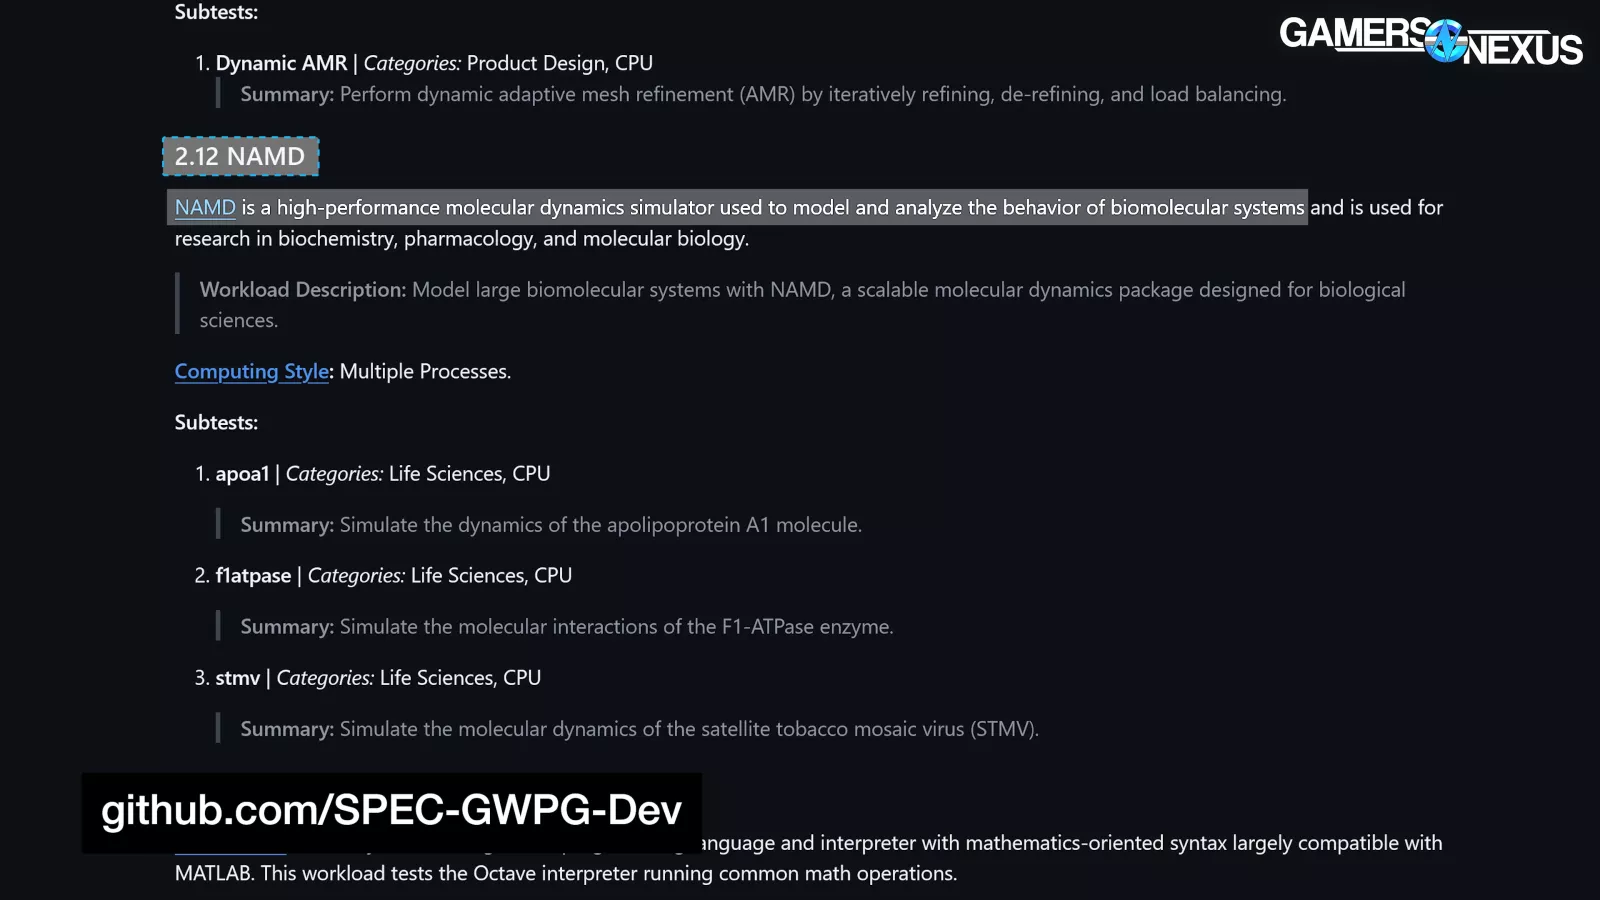
NAMD is next, which performs benchmarks to “model large biomolecular systems with NAMD, a scalable molecular dynamics package designed for biological sciences,” which Spec says is used “for research in biochemistry, pharmacology, and molecular biology.”

In this one -- and remember, we consider this an experimental chart -- the Intel CPUs seem to have a disproportionate advantage. This is likely for architectural reasons.
The 270K Plus is the best here so far, at 2.87 for the result. The 9950X3D2 scored 2.4 in this test, trailed by the 2.28 result of the 9950X3D. The X3D2 has another 5-5.3% uplift here over the X3D part, but Intel is beating it in price and performance -- and by kind of a lot, with a 20% lead in the score. This seems to be heavily scaled by core count on Intel, judging by where the 265K (read our review) and 250K (read our review) land.
9950X3D2 Production Benchmarks

Blender
Moving on to production testing, we’ll start with CPU rendering in Blender for tile-based timing.
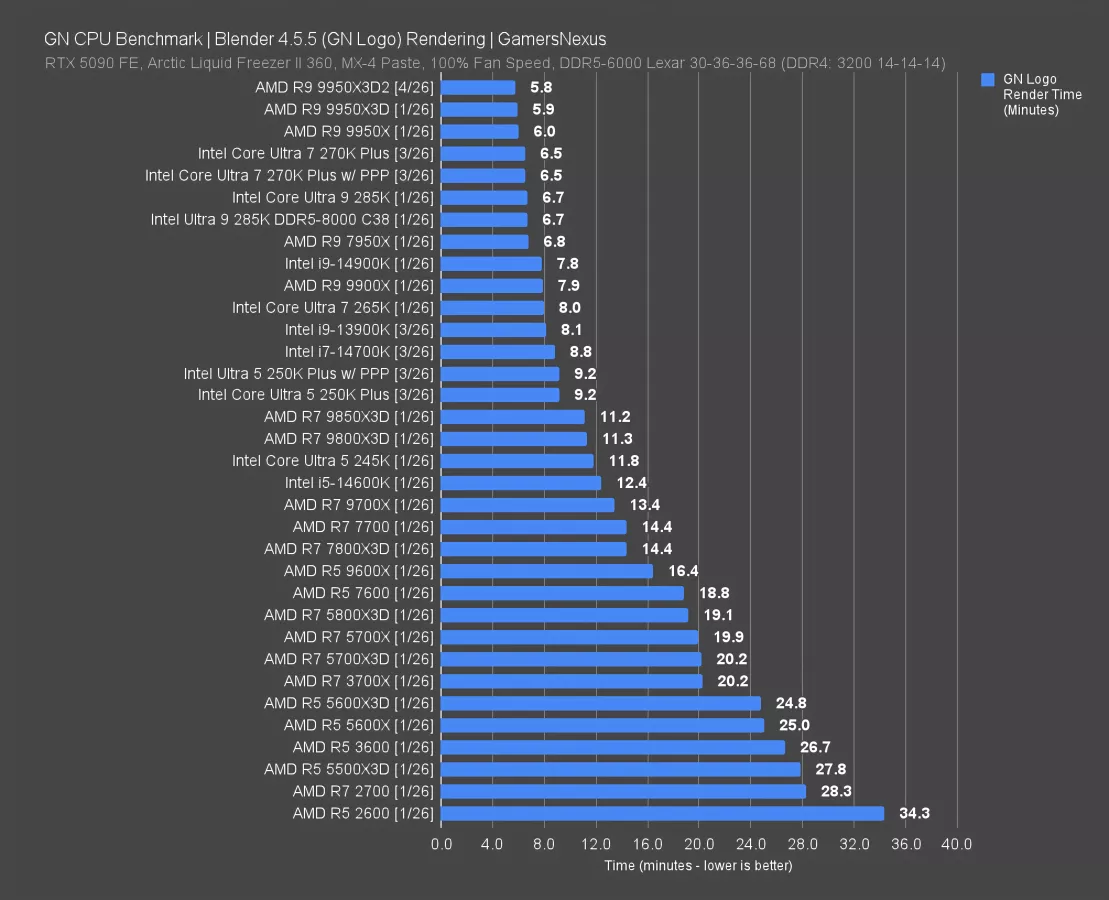
The 9950X3D2 is technically the new best on this chart, but it’s not by more than variance (at a 0.1 minute advantage rounded) and it’s also not due to the cache, as this test doesn’t really use that much of it. The 9950X3D2 completed the render in 5.8 minutes, with the 9950X3D at 5.9 minutes and the 9950X-non-3D-non-2 at 6 minutes. Intel’s far cheaper 270K Plus required 6.5 minutes to complete the render, which is close enough to AMD’s $500 9950X that it’ll need something competitive soon to deal with Intel’s encroaching, cheaper CPUs.
The 9950X3D2 isn’t providing any meaningful benefit in this test, unfortunately for AMD’s production workloads.
Chromium
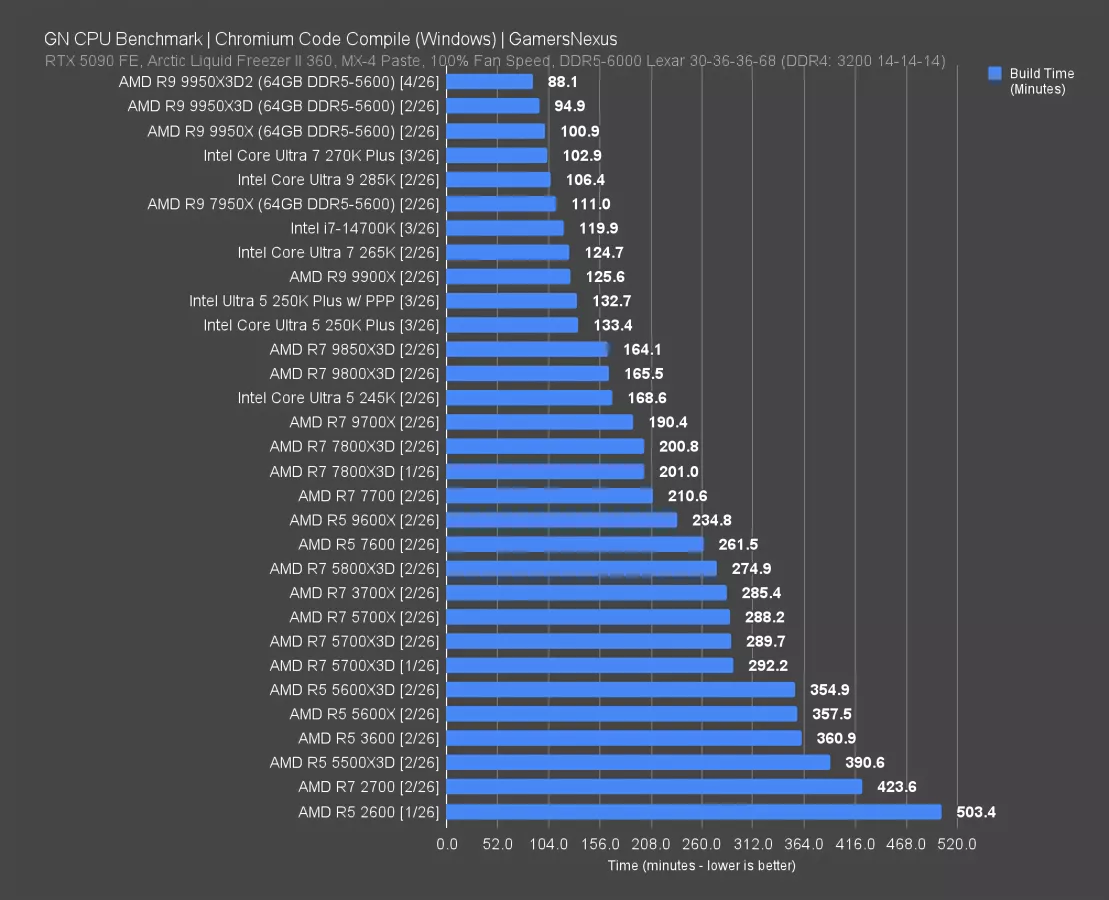
Chromium code compile is up next. In this test, the 9950X3D2 does relatively well, requiring 88.1 minutes to complete the full code compile. That’s one of the largest improvements we’ve seen so far for the new CPU, at a compile time reduction of 7.2% from the 9950X3D’s 95-minute compile time. At least we’re seeing some change here.
The 9950X required 101 minutes, so the 9950X3D2 benefits from a 12.7% reduction in compile time required, with the 270K Plus just behind the 9950X. Really, despite the improvement from the 9950X3D2, the 270K Plus is the impressive one here. At $350 (with the new pricing), it’s about the same performance as the $500-$520 9950X. The biggest problem with these Intel CPUs is the dead-end socket, but hopefully they address that next time.
Anyway, at least in this test, the 9950X3D2 shows some signs of life and uplift.
7-Zip Compression

7-Zip file compression testing is next, measured in millions of instructions per second (or MIPS).
In this one, the 9950X3D2 completed almost 215K MIPS, which puts it squarely at the top of the chart. This is also one of the rare tests that actually shows an advantage for the additional cache. The 9950X3D2 ends up with a 9% improvement over the 9950X3D-non-2. This is one of the only benchmarks where we’ve seen such an improvement.
We still can’t find the justification for $900, though. Threadripper would obviously far outstrip this performance and also give more PCIe lanes, alongside other benefits, so high-end workstation builds have that option available. This lands in a sort of weird middle-ground with limited applications benefiting from it.
Intel did overall well here, with its 270K Plus at 183K MIPS and just behind the 14900K (read our review) while dropping the price substantially. It’s not Intel’s best showing with the new CPUs, but this is a reminder that Intel saw major uplift with its refresh.
7-Zip Decompression
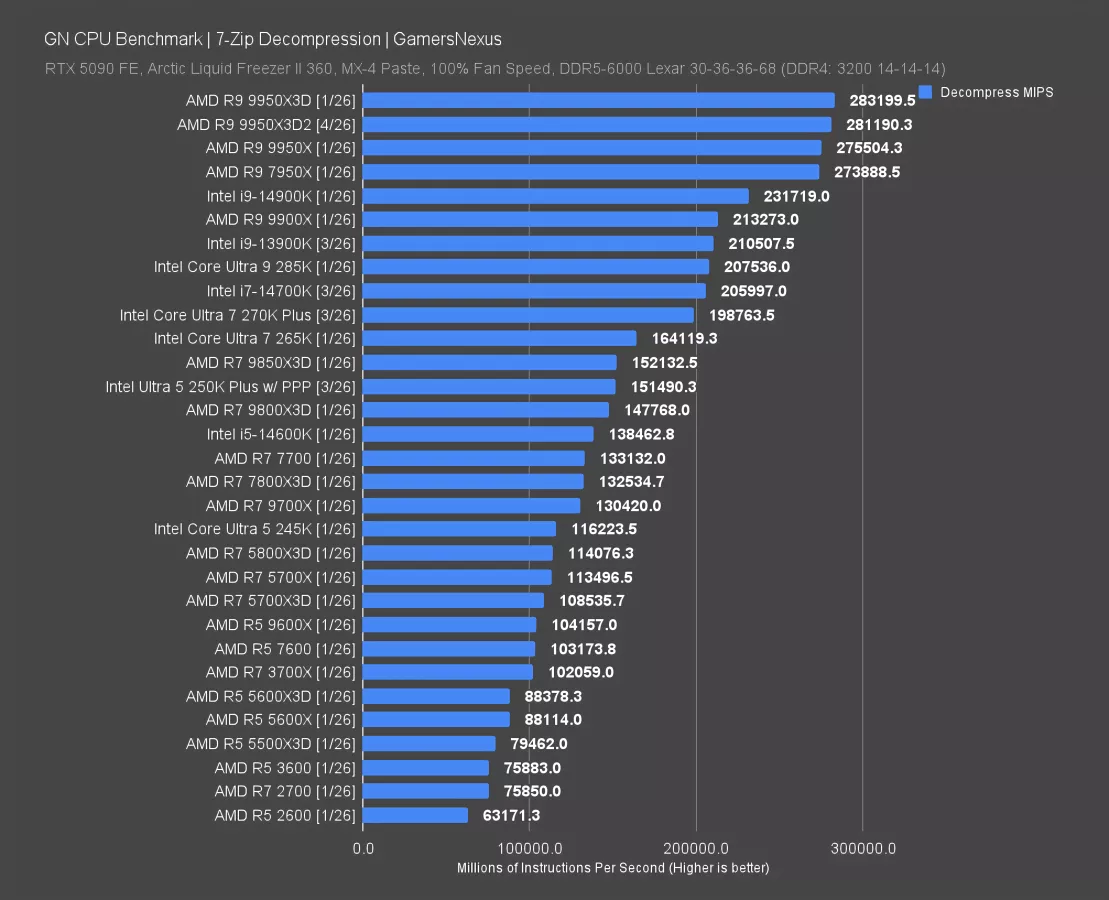
In 7-Zip file decompression, we went back through and pruned some of the excursions from standard deviation with our 9950X3D data set and reran numbers. That pushed the 9950X3D technically ahead of the 9950X. In our previous data set, it was tied. This is because the 9950X3D and 9950X3D2 both have higher run-to-run variance in 7-Zip decompression than we’ve seen in other CPUs for this test, meaning the performance is more variable. That’s not great, but when it runs stably, the X3D parts are at least at the top. They just sometimes dip down and tie the 9950X instead.
The 9950X3D2 doesn’t see any advantage from its extra cache. The X3D CPU ran at 283K MIPS, with the X3D2 part within rerun distance at 281K MIPS. The 9950X was at 275K MIPS.
Intel’s 14900K outpaces its newer 270K Plus and 250K Plus CPUs and is the closest to AMD’s top performers, with the entire top of the chart being given to AMD’s 16-core parts.
Photoshop
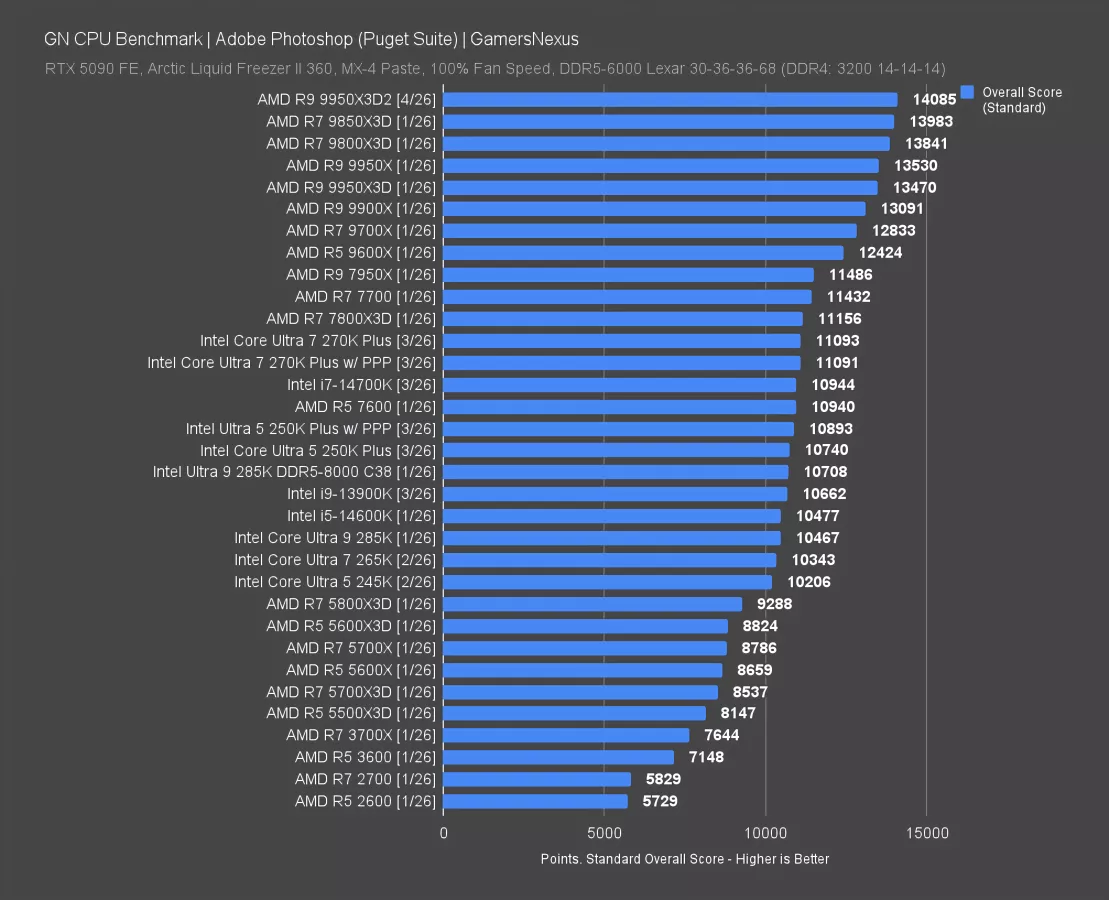
Adobe Photoshop testing is next. In this one, the 9950X3D2 scored 14085 in aggregate from the Puget Suite, which technically puts it ahead of the 9850X3D and 9950X. The 9950X3D2 leads the 9950X by about 4%. The 9950X3D was within 0.5% of the 9950X when we last tested it in Photoshop, meaning it was within error of the 9950X. The X3D2 at least moves up, if slightly.
AMD holds the entire top of this chart, with nearly the entire top-third all going to AMD. This is a big change from many years ago, when Intel held the entire top half of this chart. AMD is doing well with Photoshop testing in Puget these days.
Intel’s 270K Plus is its top performer here, landing just below the 7700 (watch our review) and 7800X3D (read our review) from the last generation of AMD CPUs.
DaVinci Resolve
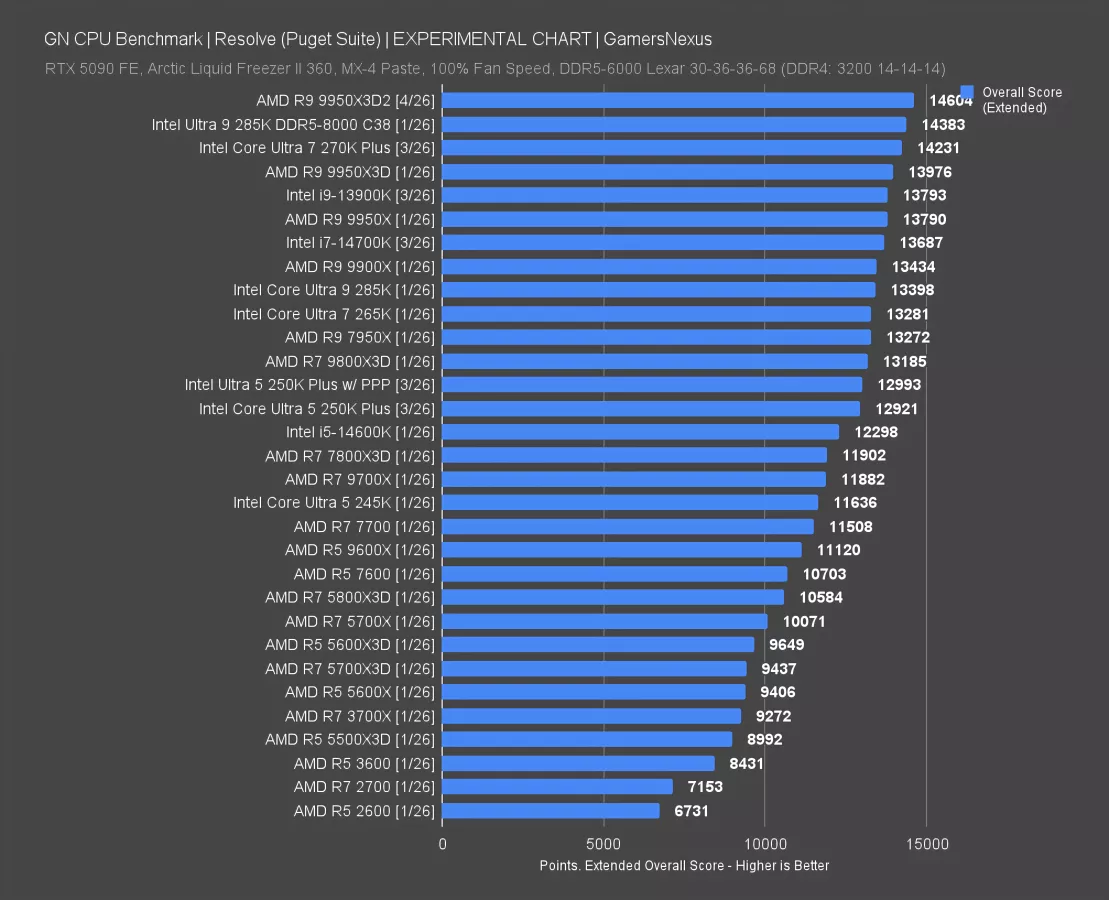
DaVinci Resolve is next. This test uses the Resolve software for video editing and production under the Puget benchmark suite. We consider this test to be in our experimental charts phase, as we’re still learning more about how the CPUs behave with this benchmark.
The 9950X3D2 is at the top of this chart, so at least that’s where it should be given its $900 price. The CPU is trailed closest by the 285K (read our review) with DDR5-8000 memory, with the 270K Plus within striking distance of the 9950X3D2. The X3D2’s 14604 result has it 2.6% ahead of the 270K Plus, yet it’s 157% more expensive at $900 versus $350.
The 9950X3D scored 13976, giving the X3D2 a lead of 4.5%. That’s roughly in-line with other moderate gains we’ve seen.
Let’s move on to the gaming tests.
9950X3D2 Gaming Benchmarks
Baldur’s Gate 3 - 1080p
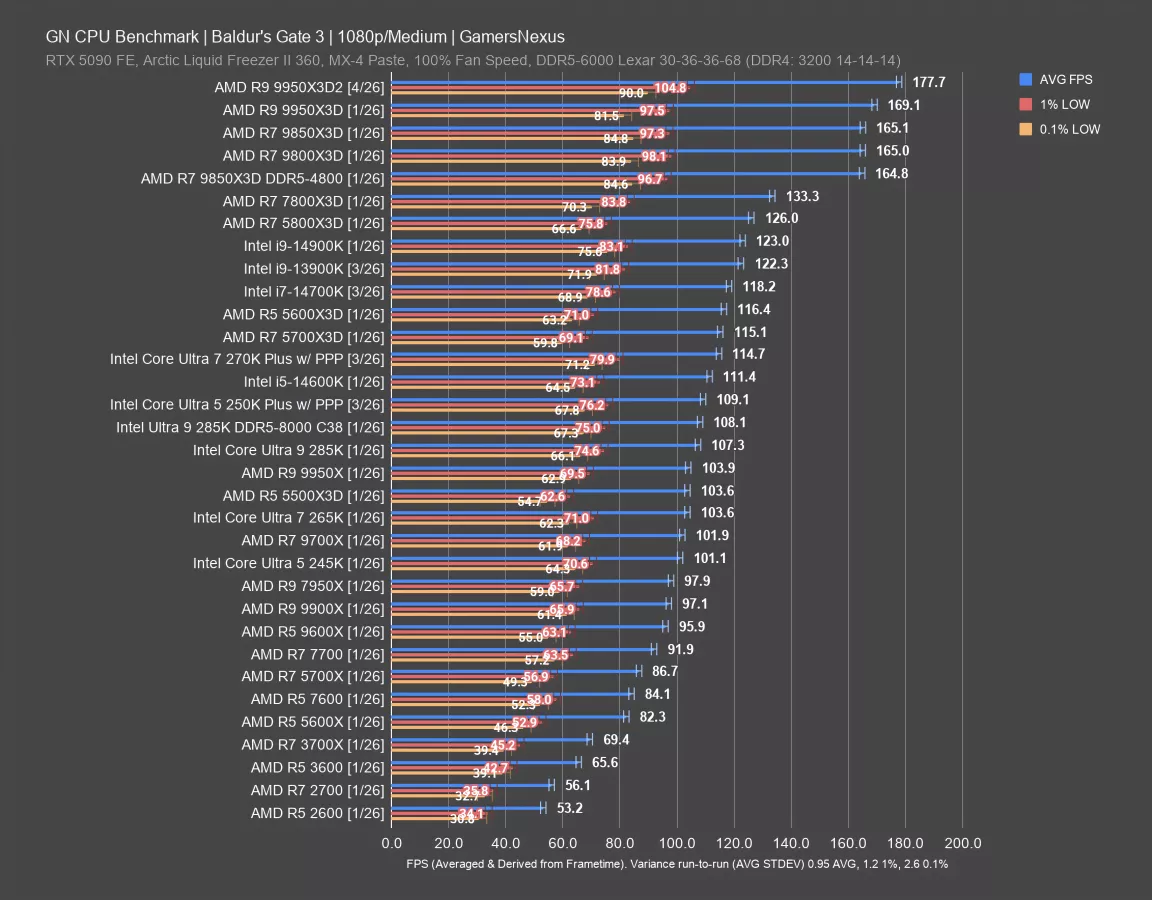
In Baldur’s Gate 3 gaming testing, the AMD 9950X3D2 ran at 178 FPS AVG, improving on the 9950X3D by just 5% while increasing the price by 33% at the high-end. The 9850X3D achieves 93% of the performance of the 9950X3D2 while costing 54% of the price.
Intel’s 270KP and 250KP (read our review) aren’t as impressive in this game as others in our suite, but the two CPUs gave AMD’s 9950X a hard time in production testing. For gaming, AMD remains at the top of this chart, including the GOATed 5800X3D at 126 FPS AVG and rounding-out the top quarter entirely for AMD. Even the 9850X3D with garbage tier RAM, which at this point, is retirement tier RAM, is doing well.
The 9950X3D2 just happens to predictably be not worth it.
Outer Worlds 2 - 1080p
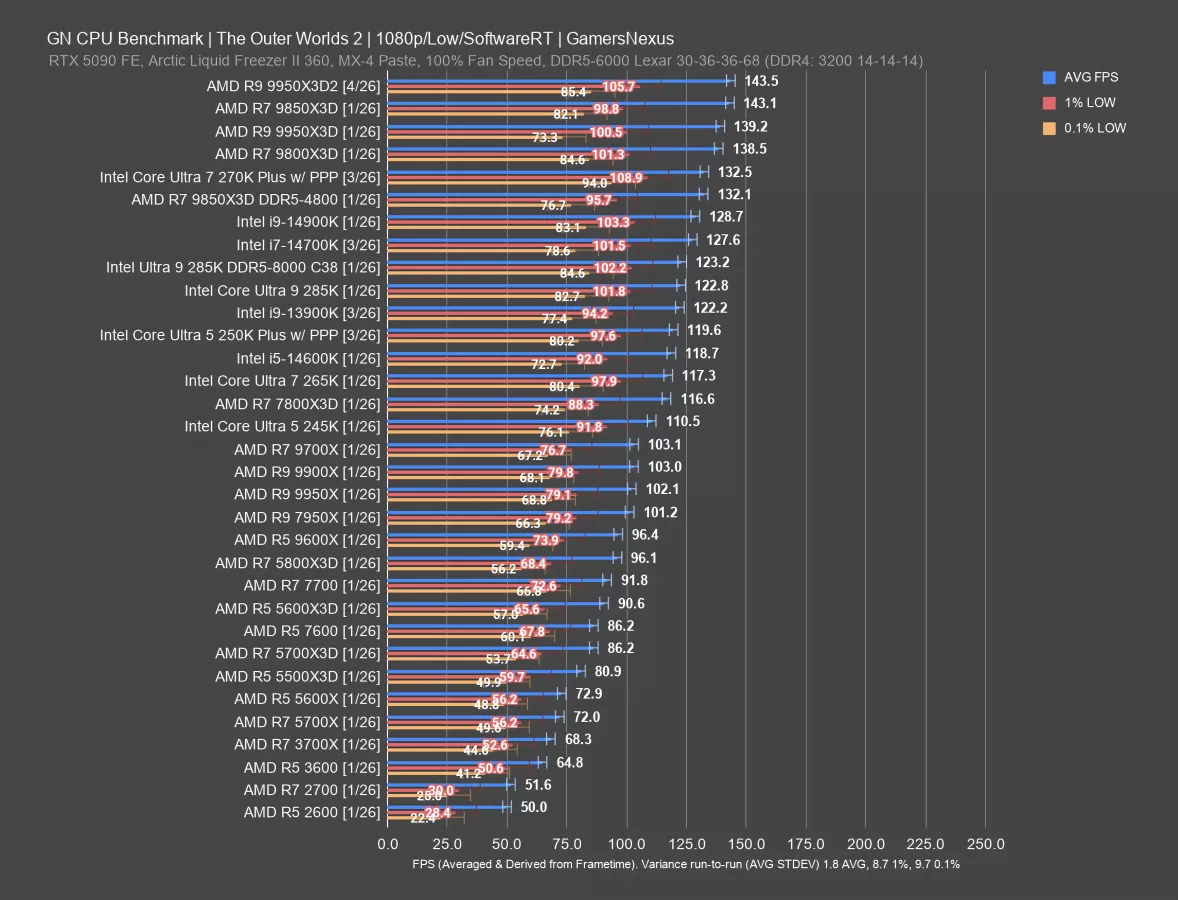
Outer Worlds 2 is up now. With these settings, the 9950X3D2 ran at 144 FPS AVG and held lows at 106 and 85. The 9850X3D functionally ties the score, with both within error and run-to-run variance of each other. The 9950X3D is around the same level as both of these results. There is no benefit to the 9950X3D2 in this game. For around half the price, you can get the same performance with the 9800X3D and 9850X3D CPU.
Outer Worlds 2 - 1440p
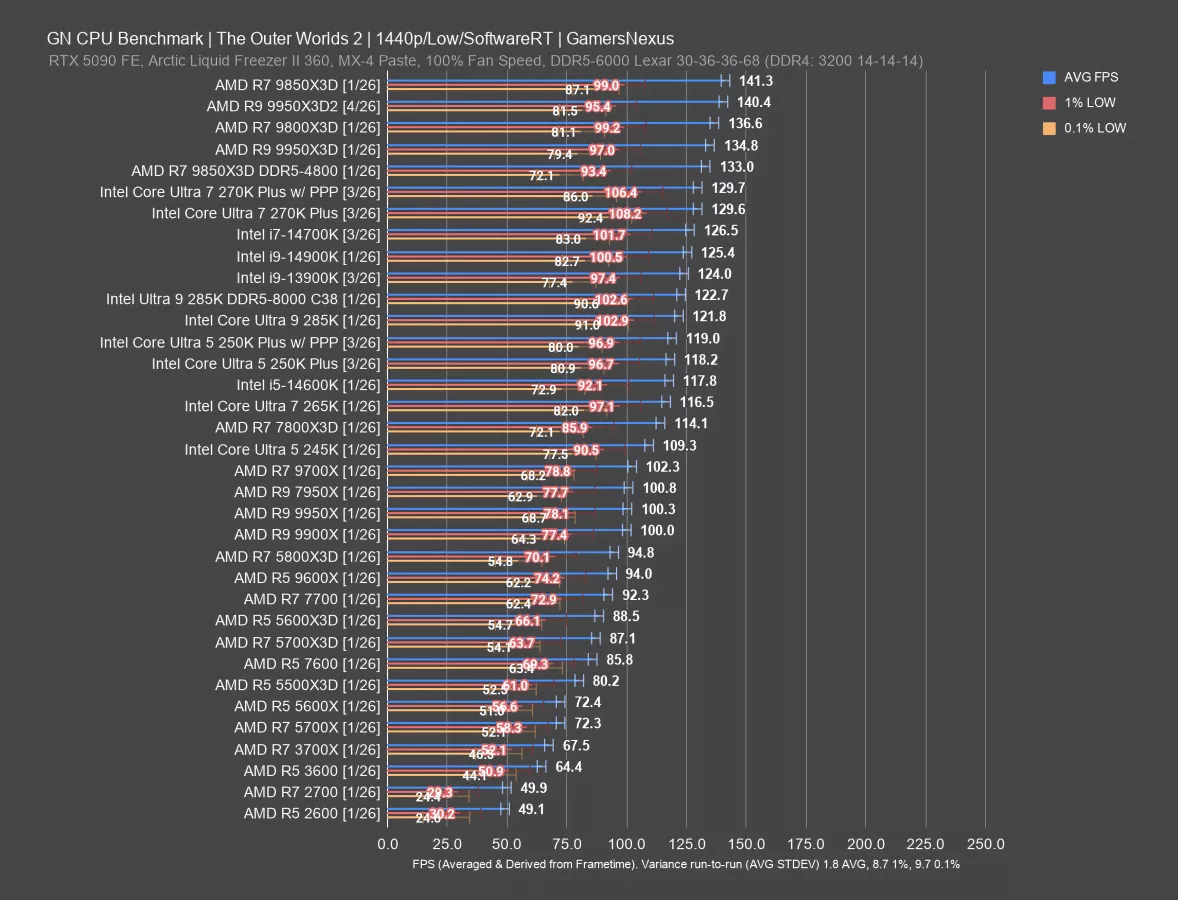
At 1440p, things don’t change much: The 9950X3D2 is technically in the second-place spot, right behind the 9850X3D and ahead of the 9800X3D. Its improvement on the 9950X3D is about 4%. The higher resolution doesn’t trim the top of the results in this test, meaning that both at 1080p and 1440p, we’re CPU-bound -- and that’s the goal with these tests.
Stellaris
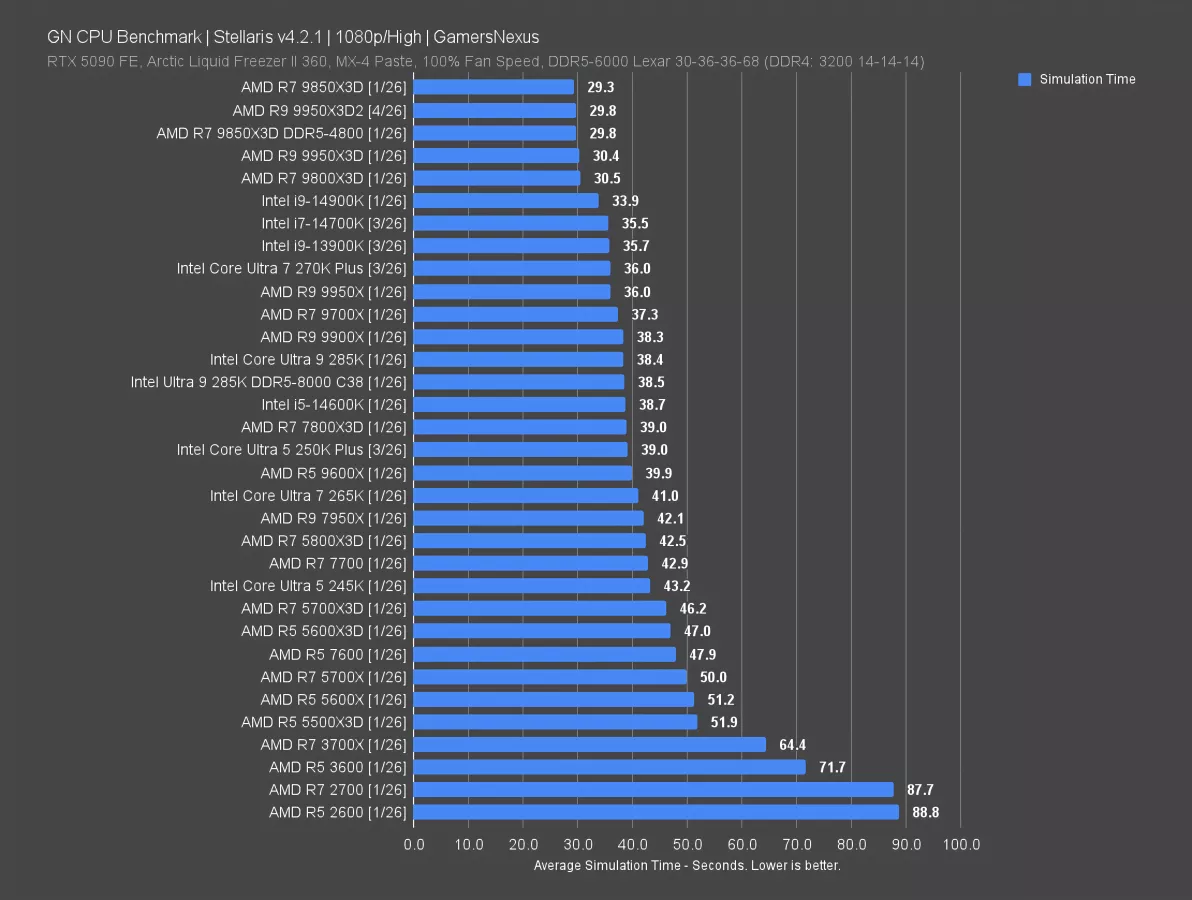
We test Stellaris using simulation time rather than framerate, which tends to be a more interesting benchmark for situations that allow it.
The fastest simulation time we’ve measured in this suite has been the 9850X3D, at 29.3 seconds and leading the pack. The 9950X3D2 is functionally tied at 29.8 seconds, a reduction in time required to simulate of about 2% versus the 9950X3D at 30.4 seconds.
Again, there’s no real benefit here. There is no reason to spend $900 on this part for gaming. AMD’s own alternatives are far better value, and that extra money could better be put toward another component -- or just your bank balance.
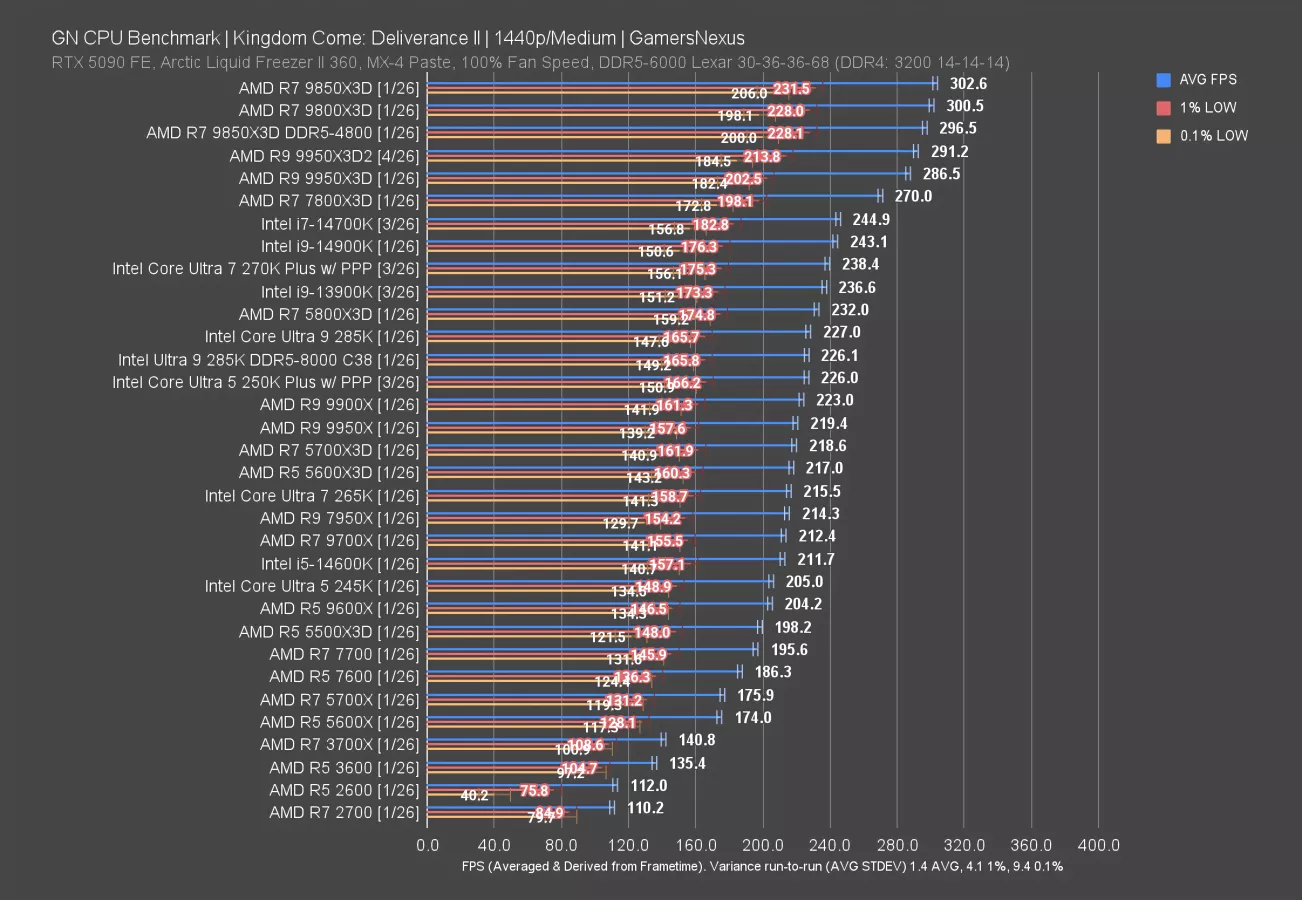
Kingdom Come: Deliverance II - 1080p
Kingdom Come: Deliverance II is next, also new to the suite this year.
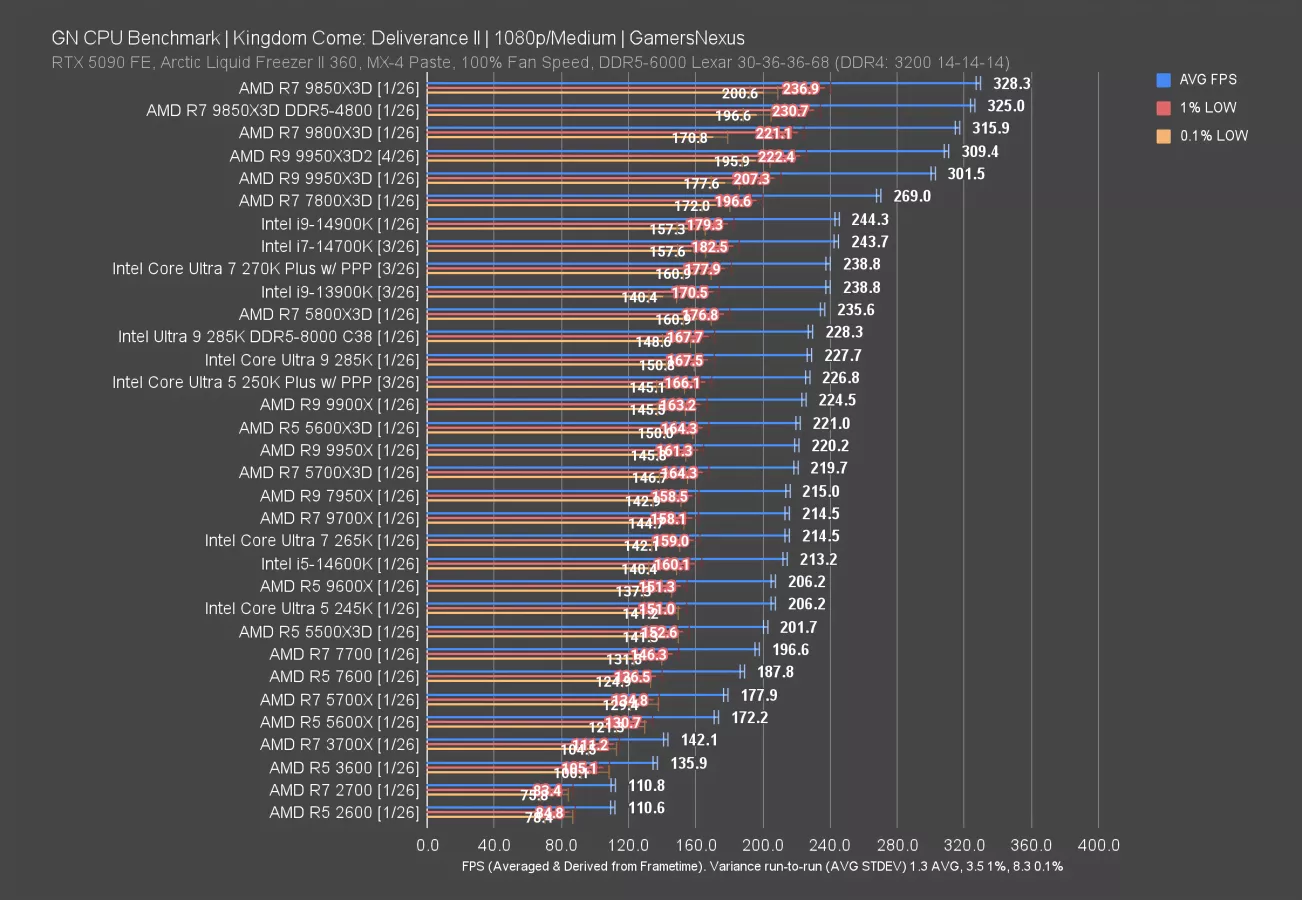
In this game, the 9950X3D2 outperformed the 9950X3D by about 8 FPS AVG, or 2.6%. That’s not much for hundreds of dollars, but worse when factored against the 9800X3D at the higher framerate of 316 FPS AVG. The 9850X3D leads at 328 FPS AVG, an impressive result overall.
Intel’s 270K Plus and 250K Plus do far better here than they did in Baldur’s Gate, but are still behind AMD’s leading X3D CPUs and Intel’s own prior 14th Gen CPUs.
Once again, the 9950X3D2 doesn’t serve value in this gaming use case.
Kingdom Come: Deliverance II - 1440p
Tested now at 1440p instead but with the same game, the 9950X3D2 ran at 291 FPS AVG, or 1.6% ahead of the 9950X3D’s 287 FPS AVG. The 9850X3D and 9800X3D both lead while costing significantly less than the 9950X3D2.
Let’s move on.
Dragon’s Dogma 2
Dragon’s Dogma 2 is up now.
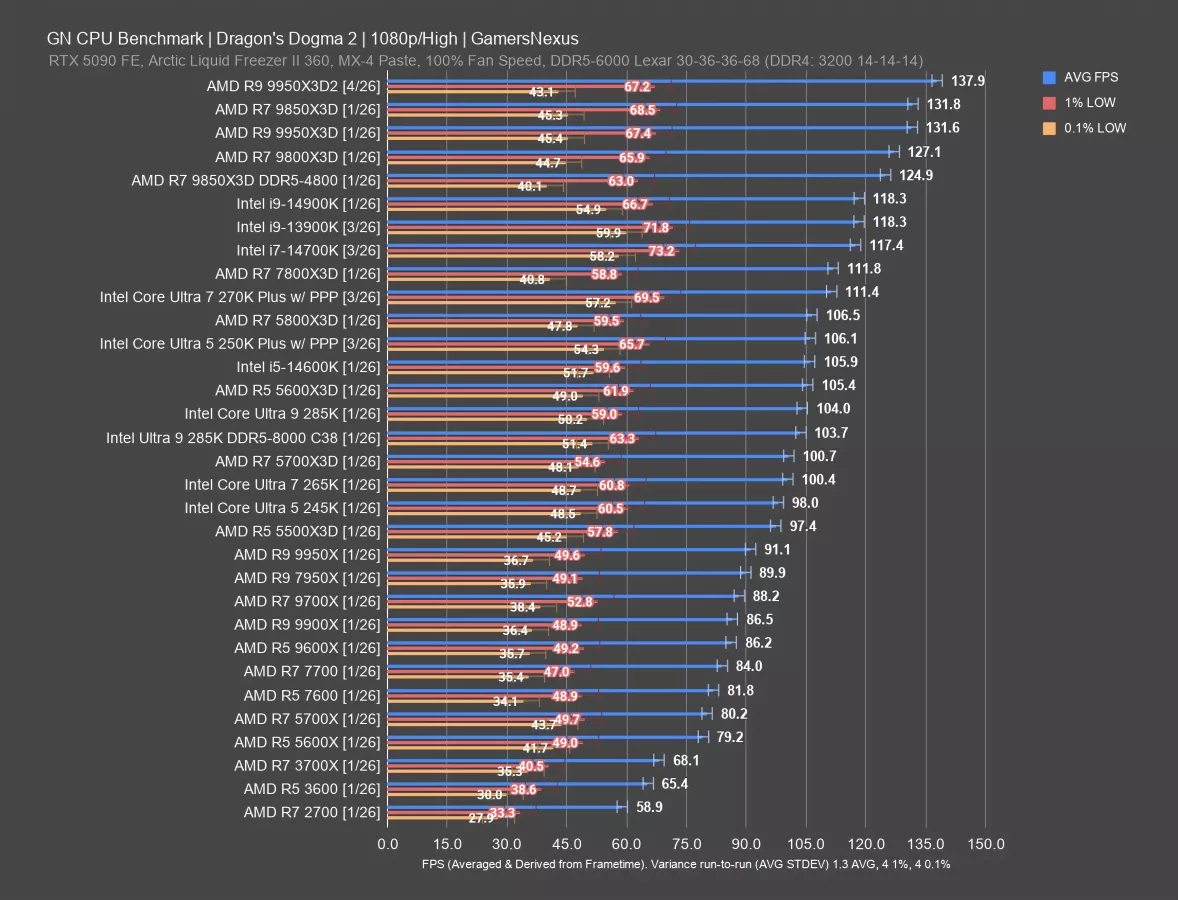
In this one, the 9950X3D2 topped the chart at 138 FPS AVG, a lead over the 9950X3D of 4.8%. The 9950X3D and 9850X3D tied previously, so this is about the most we could expect of the 9950X3D2.
As we’ve come to expect, the CPU is obviously not worth the money when looking at these gaming tests. You’re better off going for the 9800X3D and putting the extra money elsewhere. Even the 7800X3D in these tests has remained one of the best in the chart.
Intel’s new CPUs trailed its last-gen in this one, with the 270K Plus behind the 14700K.
Cyberpunk 2077 - 1080p/Medium
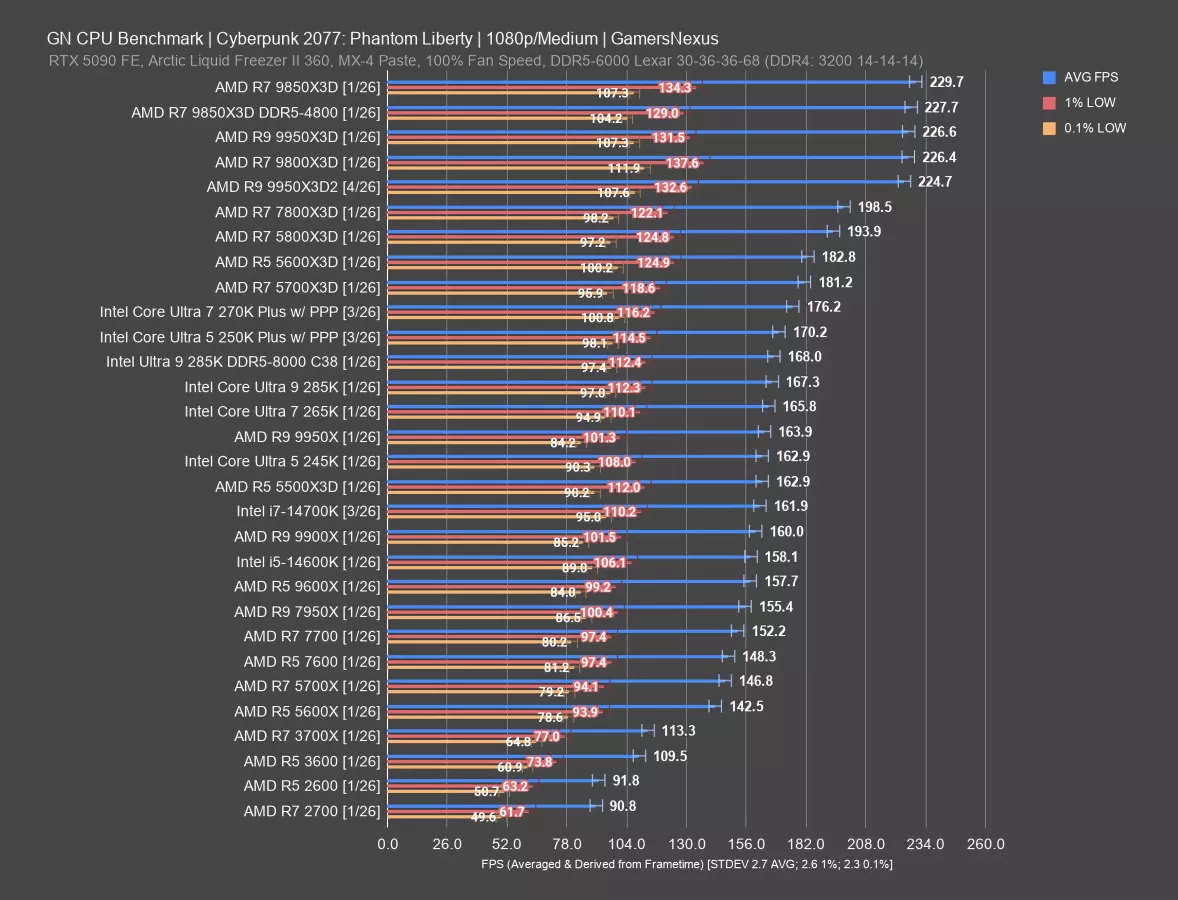
Cyberpunk 2077 at Medium settings is helmed by the 9850X3D at 230 FPS AVG, followed by the DDR5-4800 test at 228 FPS AVG, then the 9950X3D at 227 FPS AVG. The 9950X3D2 is within 1% of the 9950X3D-non-2 benchmark. These are within error of each other and are functionally the same.
AMD’s X3D parts hold the entire top of this chart (once again), this time spanning all the way down to the AM4 5700X3D and 5600X3D CPUs, both trailing the famed 5800X3D. Intel follows this impressive stack of CPUs with its 270K Plus and 250K Plus.
But, as for the 9950X3D2, it’s just a joke here. This CPU is not worth even a fraction of its price in these types of workloads. Do not buy a 9950X3D2 expecting to have the best gaming CPU, because that isn’t what it is.
Cyberpunk 2077 - 1080p/High
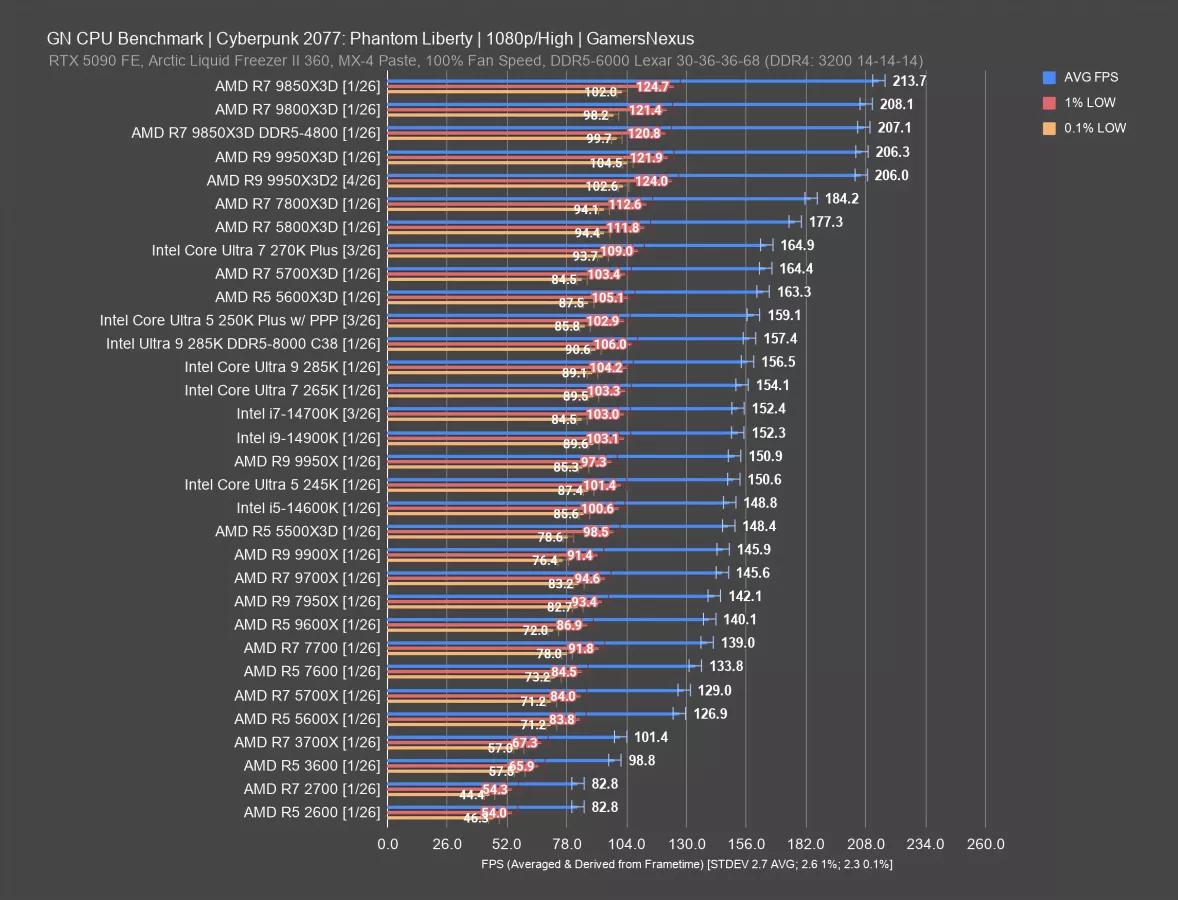
At High settings, the 9950X3D2 tied with the 9950X3D. These are the same. There’s no meaningful difference in the average, 1% lows, or 0.1% lows with these two CPUs, and so the needle hasn’t moved despite the dollar amount moving by a lot.
Even the 5800X3D is achieving 86% of the performance of the 9950X3D2, and that’s in spite of its age.
Intel’s 270K Plus at least did better in this one, comparatively speaking, as it outpaces Intel’s own prior 14th Gen CPUs. The 270K Plus ended up at 165 FPS AVG with good lows, trailing most of the X3D CPUs.
Starfield
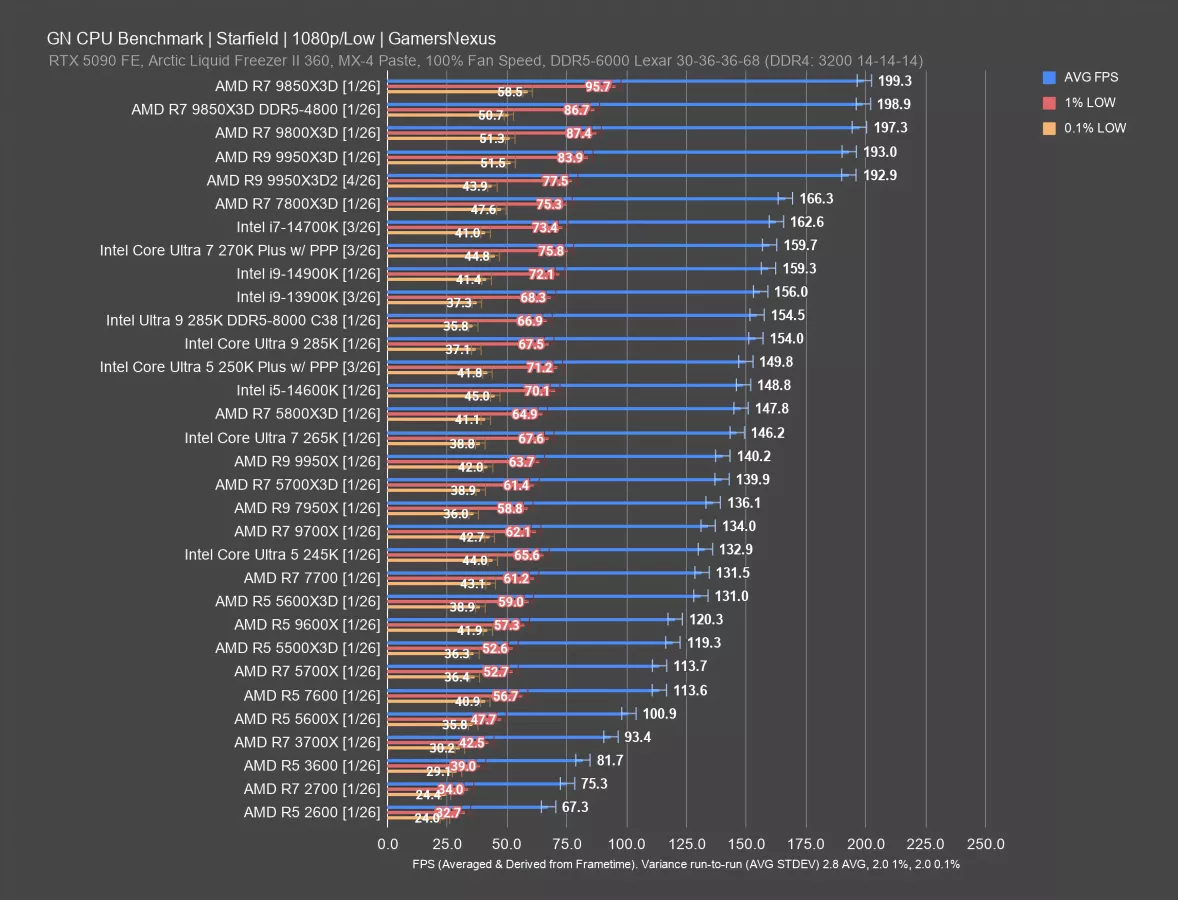
In Starfield, the 9950X3D2 ran at the same performance level as the 9950X3D did. Both held about 193 FPS AVG and are within error of each other, so there’s no difference in the results. The 9800X3D and 9850X3D technically lead both entries.
There’s nothing exciting about this result.
F1 25 - 1080p
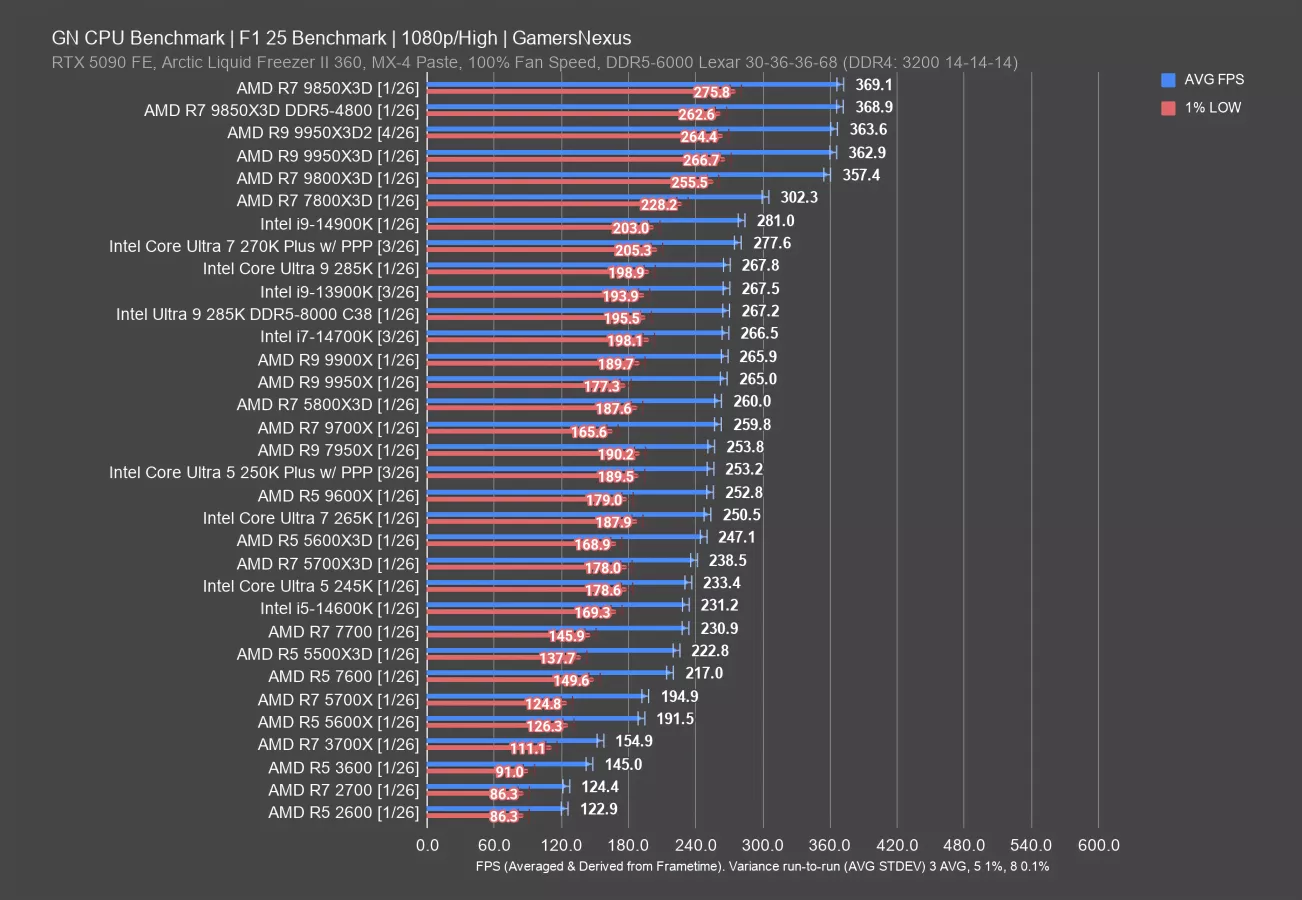
In F1 25, we measured the 9950X3D2 at 364 FPS AVG, which has it tied with the 363 FPS AVG of the 9950X3D. Lows are the same for each. The 9850X3D technically leads these entries, but the top CPUs are all so close at such a high framerate that they are functionally the same.
The 270KP did OK in this one, outperforming Intel’s prior 285K and landing below the 14900K. Overall though, everything from the 7800X3D and up from AMD holds the top of the chart.
Power Consumption Testing
Power Consumption - Blender All-Core
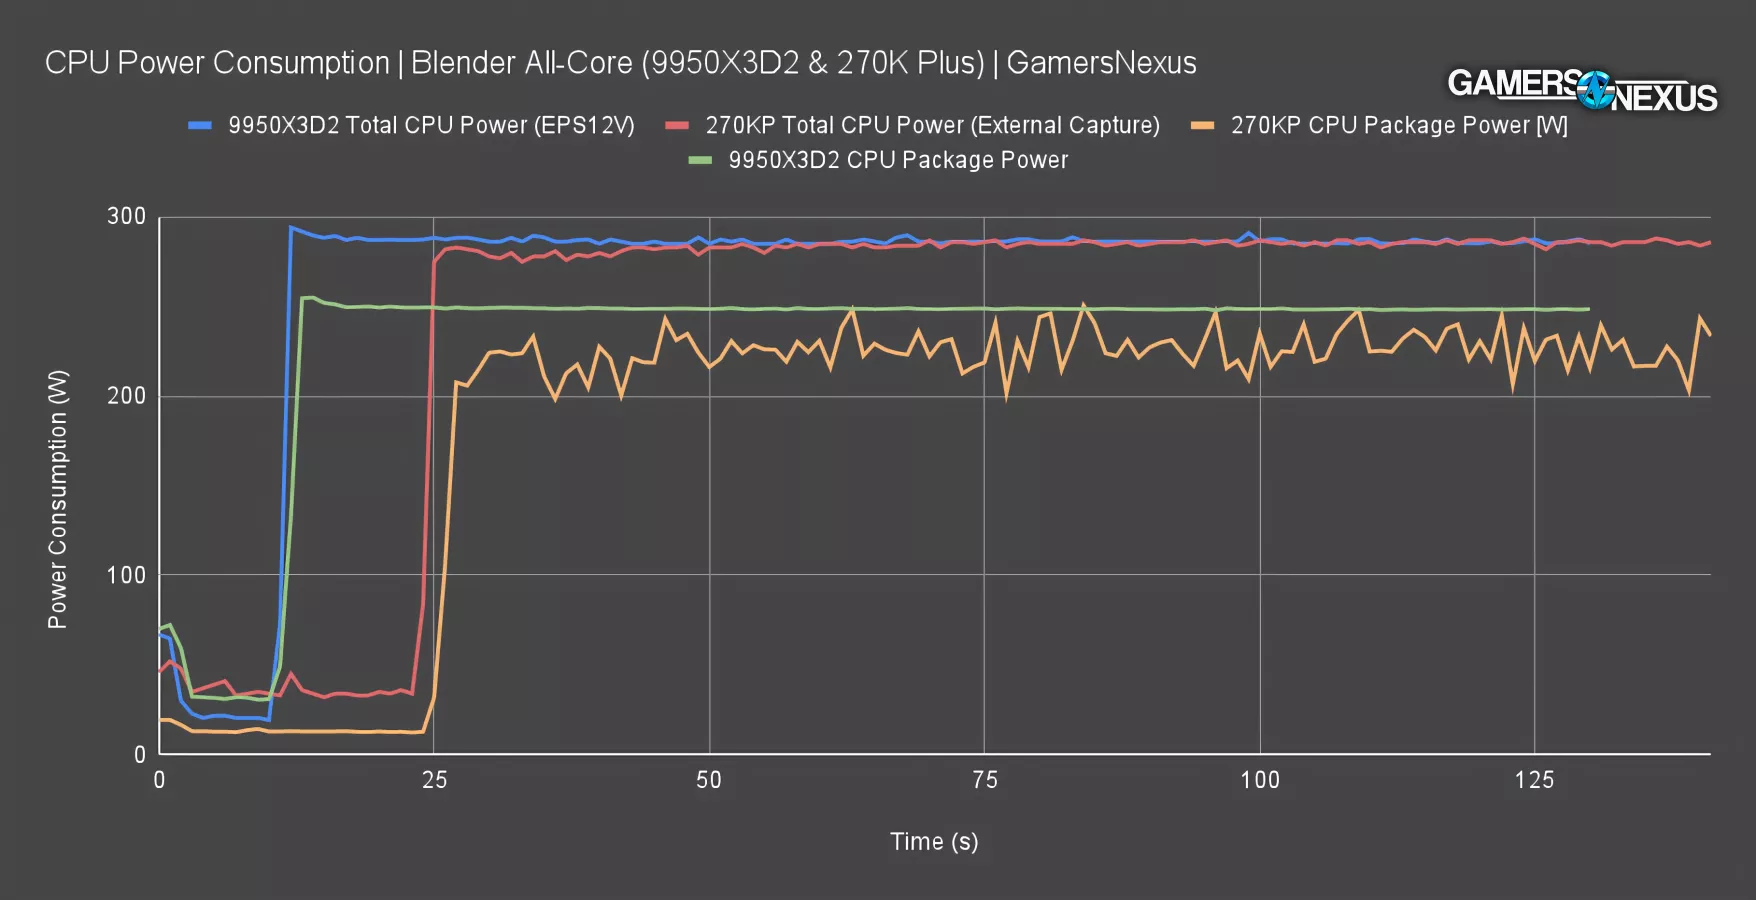
Finally, we ran some quick power consumption testing with the 9950X3D2. For this, we’re relying on an external hardware interposer to capture the power going into the motherboard for the CPU via the EPS12V rails.
In a Blender all-core workload, which is a worst case (but likely) scenario for the 9950X3D2, the CPU pulled about 294W peak and 285W nominal via the EPS12V cables. For the 270KP, which uses a PMD2 to measure the EPS12V cables and ATX12V, isolating away PCIe via ATX12V, we end up around the same power draw; however, this is factoring in miscellaneous ATX12V power due to the motherboard’s weird decision to route some 12V to the CPU. We expect that to be 10-15W at most at any given time.
Software readings via HWINFO64 are also present for both, with the 9950X3D2 at around 250W and the 270KP around 220-250W.
Conclusion
That wraps our 24 charts in 24 hours 9950X3D2 review. Other than OpenFOAM, which is both an outlier and an experimental chart, the conclusion generally is that you’ll see 2-5% uplift in the best production cases, and typically no meaningful benefit in gaming (if any at all).
The main reason this shouldn’t be bought is simply that it’s $900 for, at times, almost 0% gain, and sometimes a gain of 5%.