We put AMD’s new 12-core/24-thread CPU through numerous benchmarks that include productivity, gaming, power, and thermal tests
The Highlights
- The 9900X is a 12-core/24-thread Zen 5-based CPU
- At its current price, it generally makes more sense to purchase something like the 7950X or 7800X3D
- Compared to the 7900X, the 9900X improves performance anywhere from 0% to 10% in our tests
- Original MSRP: $450
- Release Date: August 15, 2024
Table of Contents
- AutoTOC

Intro
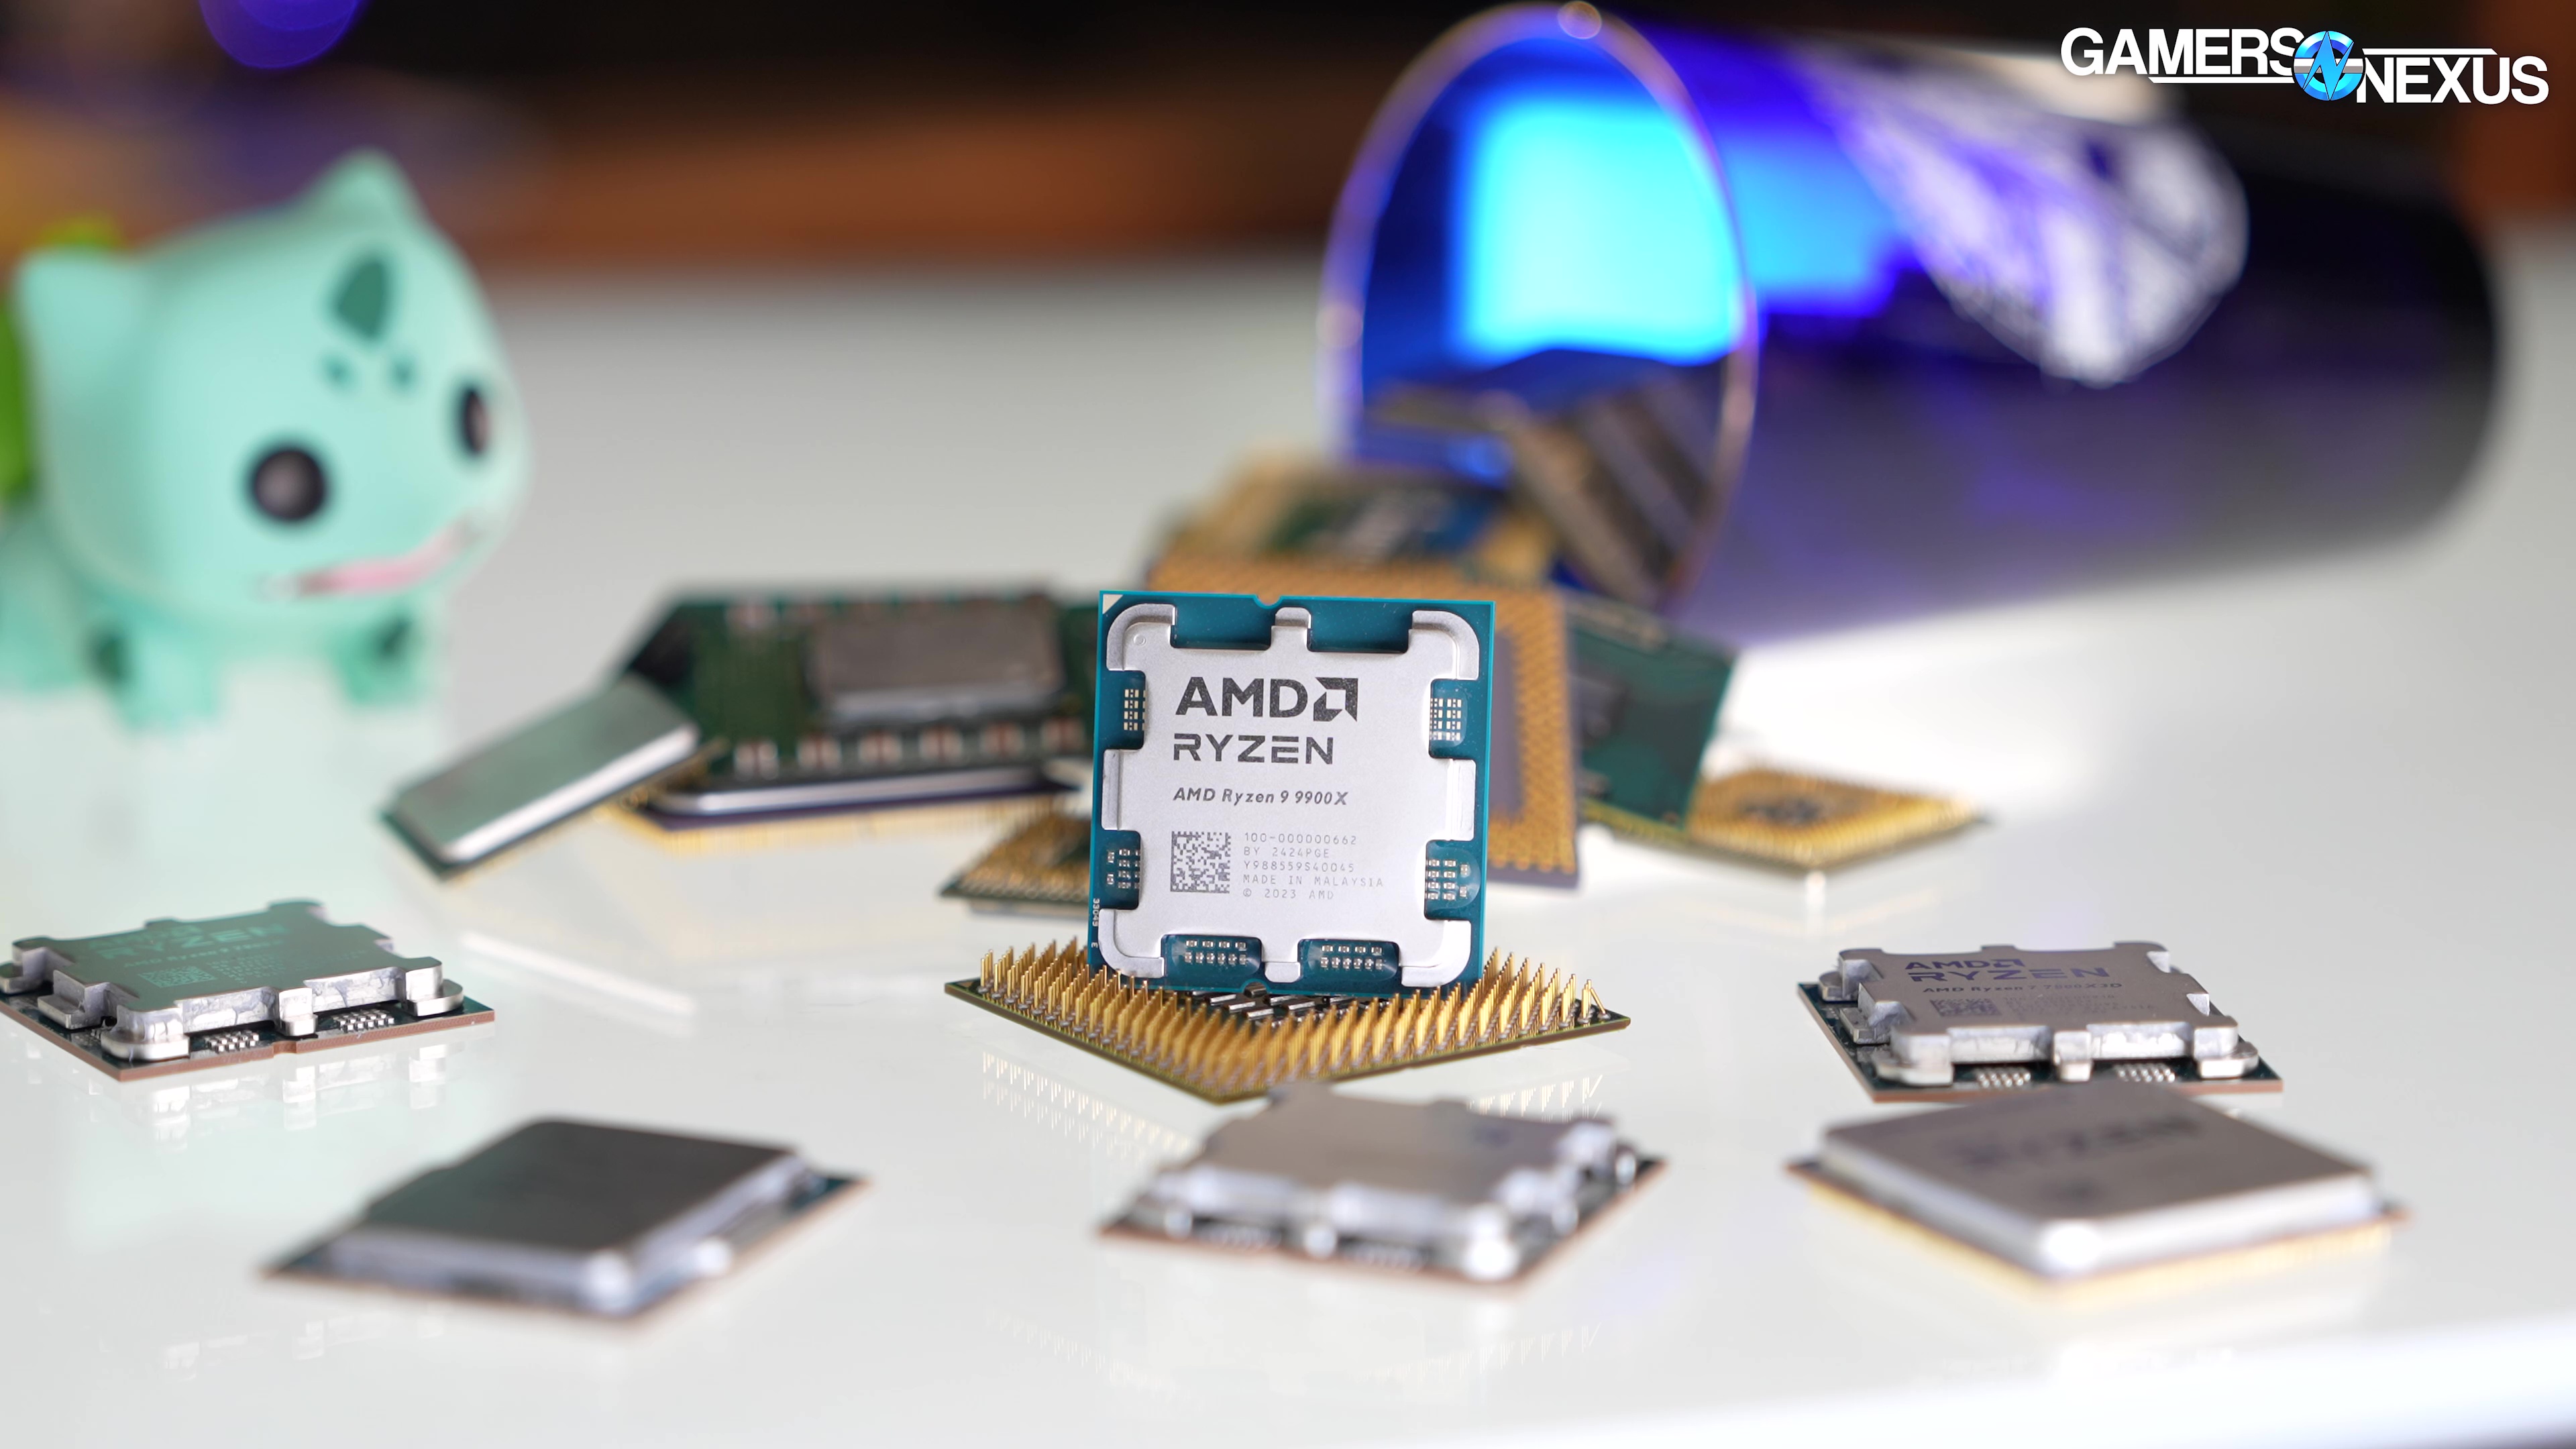
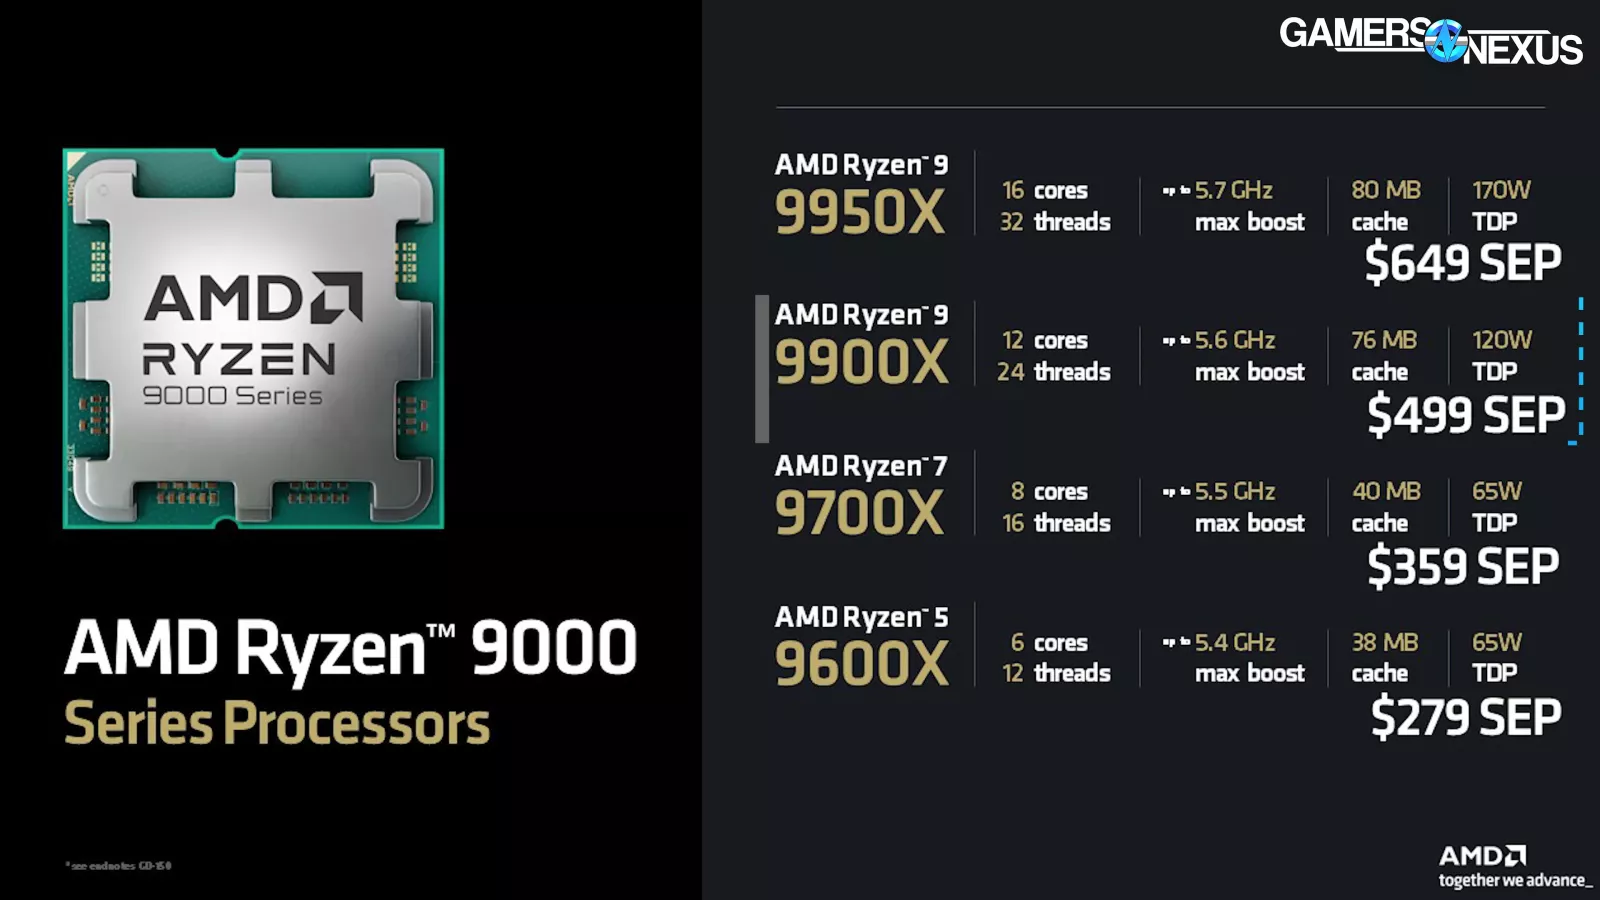
Today, we’re reviewing the AMD Ryzen 9 9900X. This is a 12-core, 24-thread CPU that follows the other Zen 5 launches. We recently reviewed the flagship 9950X, which is a 16-core part. Before that, we reviewed the 9700X. The last one that remains will be the R5 9600X.
This CPU has a current price of $500, flanked by the 9950X at $650 and the 9700X at $360. The 9600X is a $280 part. Competing CPUs include AMD’s own alternatives: The R7 7800X3D is $366 right now, so about the same as the 9700X, the R7 7700 non-X is $289, the R9 7950X 16-core CPU is $525, and the 7900X is $359. The 9900X’s closest competition at $500 would be AMD’s own 7950X or Intel’s 14700K at $400, with the 14900K at $546 or so. The 14700K will be the most direct alternative, pending results of ongoing Intel microcode and customer support issues.
Editor's note: This was originally published on August 16, 2024 as a video. This content has been adapted to written format for this article and is unchanged from the original publication.
Credits
Test Lead, Host, Writing
Steve Burke
Testing
Patrick Lathan
Mike Gaglione
Camera, Video Editing
Vitalii Makhnovets
Writing, Web Editing
Jimmy Thang
As we’re now 3 stories deep in Zen 5 analysis, we’re going to make these progressively simpler and focus increasingly on the product-level and the value. Let’s get into it.
Test Suite
GamersNexus CPU Test Suite 2024 (9900X Review)
| Power & Efficiency | Frequency & Thermal | Production & Workstation | Gaming |
| All-Core Power | Frequency: All-Core | Blender (Rendering) | Dragon's Dogma 2 |
| Efficiency: Blender | Frequency: Single-Core | Chromium (Compile) | F1 24 |
| Efficiency: Compression | Thermal: All-Core | 7-Zip (Compression) | FFXIV: Dawntrail |
| Efficiency: Decompression | 7-Zip (Decompression) | Stellaris | |
| Efficiency: FFXIV | Adobe Photoshop | Baldur's Gate 3 | |
| Efficiency: Stellaris | Adobe Premiere | ||
| Efficiency: Phantom Liberty | SpecWS: Financial Modeling | ||
| SpecWS: RodiniaCFD | |||
| SpecWS: LAMMPS Biomed |
The 9900X review and 9950X review both contain more production benchmarks than gaming. This is because gaming is well represented in our 9700X review, but also because for these CPUs, we firmly believe that the only real reason to test them in gaming is to ensure that they work. The gaming benchmarks are basically just to validate that there are no major unforeseen issues as a result of the core count; once they pass that barrier, we move on.
Tested, Unused
| Power & Efficiency | Frequency & Thermal | Production & Workstation | Gaming |
| Efficiency: Baldur's Gate 3 | N/A | Cinebench NT & 1T(Only for validation, see Blender) | Starfield(Pattern represented) |
| Efficiency: F1 24 | SpecWS: 7-Zip(Represented by separate test) | Total War: Warhammer III(Pattern represented) | |
| Efficiency: Starfield | SpecWS: CalculiX CFD(Still validating) | Rainbow Six Siege(Game update & new data needed) | |
| Efficiency: Rainbow Six | SpecWS: Handbrake(Still validating) | 1440p Tests(Represented in 9700X review) | |
| SpecWS: Kirchhoff(Still validating) | |||
| SpecWS: LuxRender(Represented) | |||
| SpecWS: NAMD(Still validating) | |||
| SpecWS: Octave(Still validating) | |||
| SpecWS: Python36(Still validating) | |||
| SpecWS: RodiniaLifeSci(Still validating) | |||
| SpecWS: CalculiX CFD(SRMP) |
We also have a list of unused tests. These are tests which we conducted, but haven’t put in the review for one reason or another.
As a reminder, we have over 50 CPUs benchmarked right now, and frequently have 20-30 on the charts. Each of those CPUs undergoes multiple test passes per benchmark, so there are over 4,000 averaged data points that we have collected in the last month for all of these tests. These test suites currently require a few days of testing and analysis per CPU. While we are trying to continually add tests for the audience, we are also eliminating tests which either are redundant and show the same thing as another one.
GN CPU Review Game Tests
| Game | Year Released |
| Final Fantasy XIV: Dawntrail | 2024 |
| Dragon's Dogma 2 | 2024 |
| F1 24 | 2024 |
| Baldur's Gate 3 | 2023 |
| Starfield | 2023 |
| Cyberpunk: Phantom Liberty | 2023 |
| Total War: Warhammer III | 2022 |
| Stellaris | 2016 |
| Rainbow Six Siege | 2015 |
And as one other quick update, this is our current list of games and their release dates for our test suite.
As a note, we are aware that there is a new line of commentary along Windows and administrator permissions. Our testing is applied equally to all products and we’re evaluating these as users would use them. If AMD or Microsoft make any changes that affect CPU performance, we will re-evaluate at that time.
Frequency
Frequency - All-Core
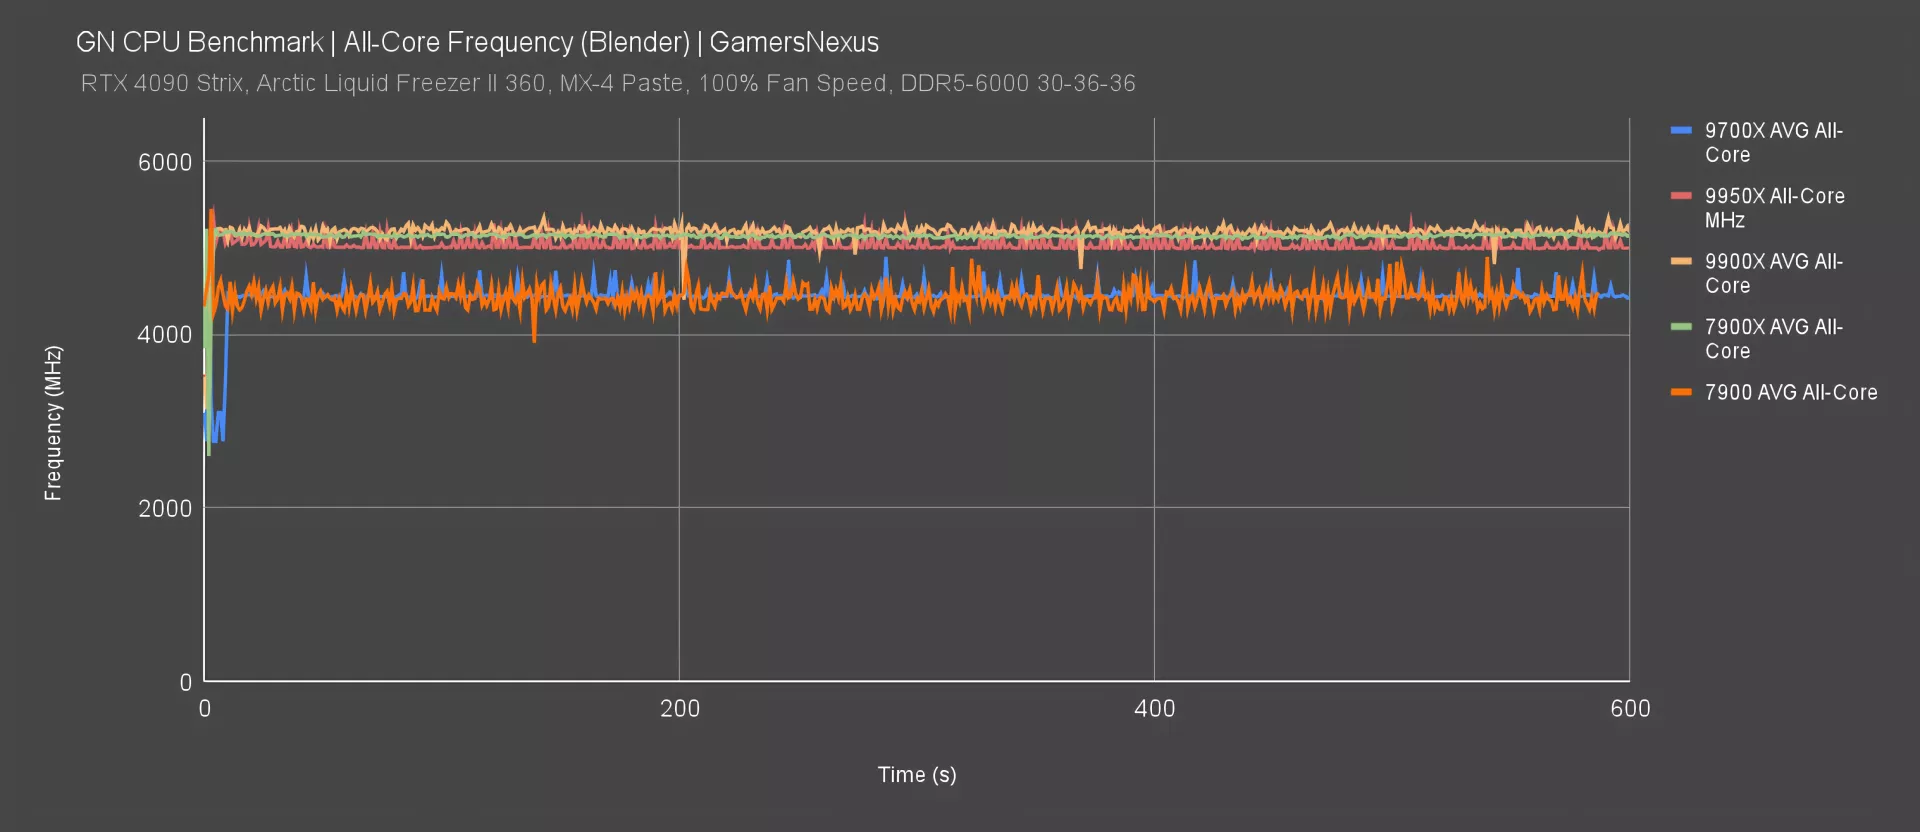
All-core frequency starts us off to validate that the CPU is performing as expected. To first re-establish the other recent numbers: With all threads loaded rendering, the 9700X was averaging around 4440-4480MHz all-core, mostly limited by its power budget. The 9950X measured around 5000-5100MHz, commonly around 5000MHz. This was a big jump from the 9700X and is enabled by the higher power budget.
The 9900X plots above all of these so far, typically in the range of 5200-5300MHz. It seems to be striking a balance between the core count and a higher frequency. The CPU has a higher power budget than the 9700X, but less than the 9950X (but it also has fewer cores than the 9950X, which benefits its boosting).
For reference, we’ve provided the results for the 7900X. This one runs around 5150MHz all-core, so reduced from the 9900X. That’ll be good news for the 9900X, as it’s both lower power and higher frequency. The 7900X’s TDP matches that of the 9950X.
Finally, the 7900 non-X runs around the levels of the 9700X, just with more drops in frequency from bouncing off of the barrier more. This is a 65W TDP part, so the behavior is expected.
Frequency - Single-Core
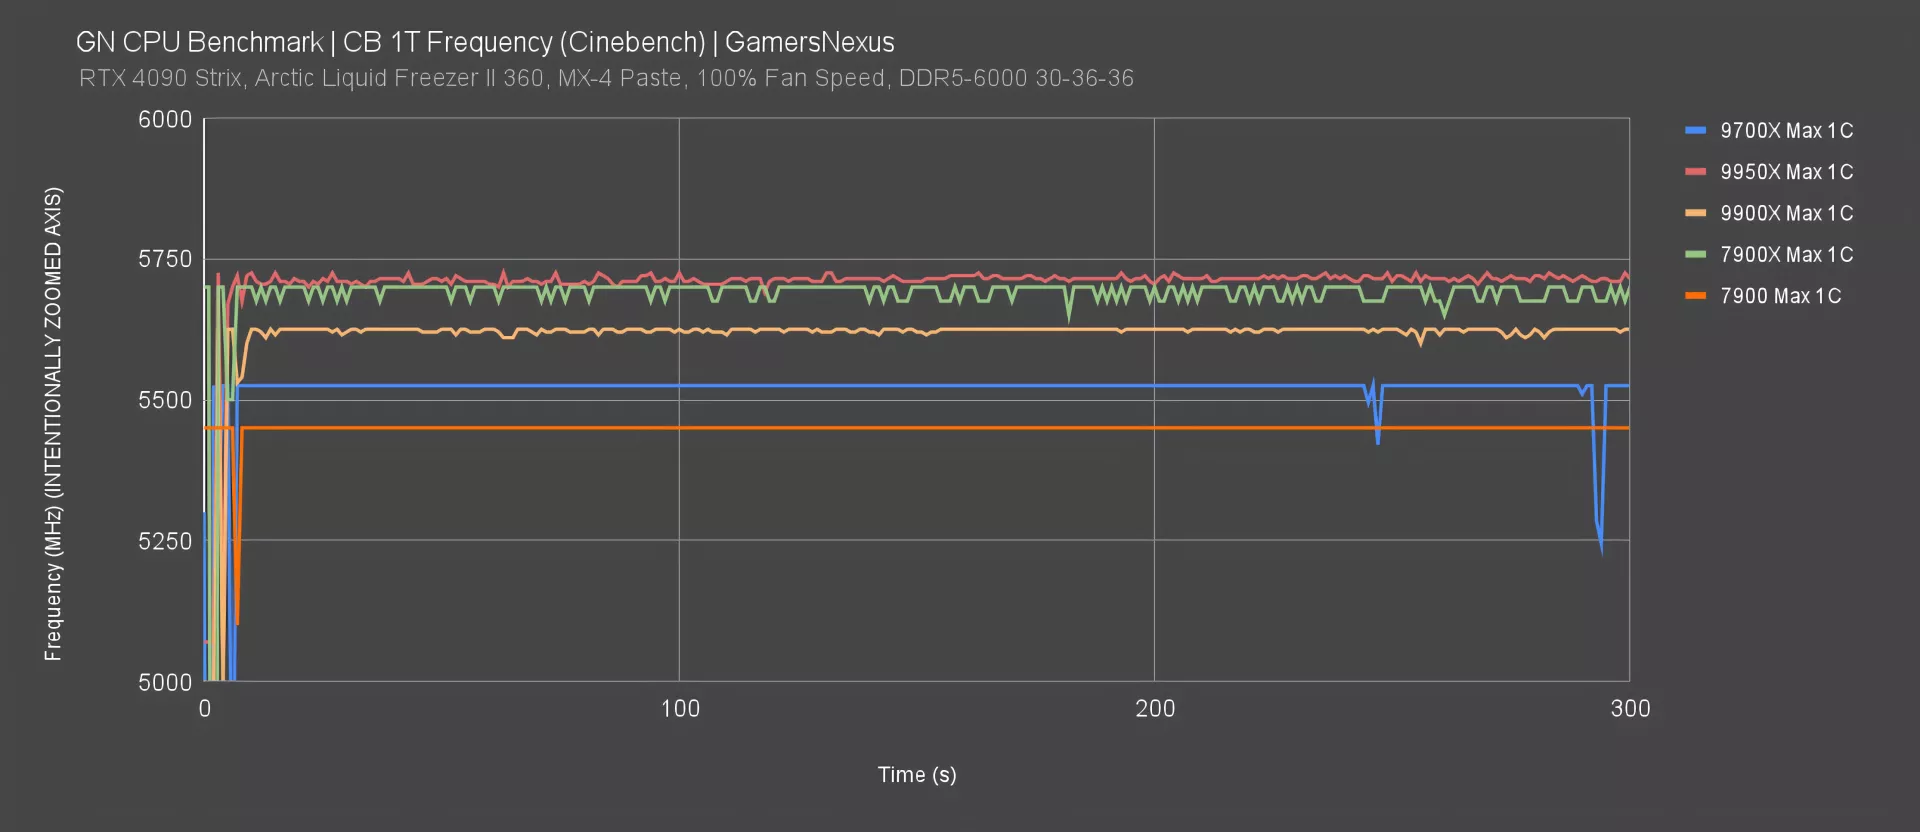
Single-core frequency boosting is next, tested using the Cinebench 1T test. This plots the maximum frequency of any single core during the interval.
The 9700X started this generation at 5525MHz single-core, followed by our 9950X review with a slightly more variable result of around 5700MHz, with some peaks to 5725MHz. This keeps up the tradition of holding a high frequency on modern Zen architectures and is what enabled the 9950X to pull ahead in some gaming tests.
The 9900X holds at 5625MHz single-core, right between the other two that we’ve reviewed so far. The prior R9 7900X ran a higher single-core frequency of 5700MHz and is benefited here by its higher power budget, so expect to see some back-and-forth with the 9900X in scenarios where only a few threads are loaded. This may be the case in gaming, where sometimes the higher frequency can claw back ground. It’ll depend on architectural improvements, IPC, and what AMD gets done per clock on Zen 5.
Finally, the 7900 maxed-out at a flatlined 5450MHz, below everything.
Thermal Results
We’ll briefly look at thermal results with the same all-core workload. We’re using a Liquid Freezer II 360 at 100% fan speed for all of this testing. We try to emphasize this regularly because temperature is probably the one result with the absolute most confusion and misinformation around it, and always has been.
Temperature is ultimately a manifestation of the power we push through a chip. Because of that, indirectly, one of the best indicators of the temperature is always going to be power. Temperature can be a tough metric to use when basing off of internal CPU sensors because they are not comparable: We see reviewers and users comparing Intel and AMD CPU thermals all the time, and you really can’t directly compare them. It’d make more sense to compare the power draw head-to-head, but not thermals. The thermal sensors are in different places; in fact, just this generation, AMD moved its Tdie sensor in a way that makes the 7000 series not directly comparable. We talked about that in the 9700X review.
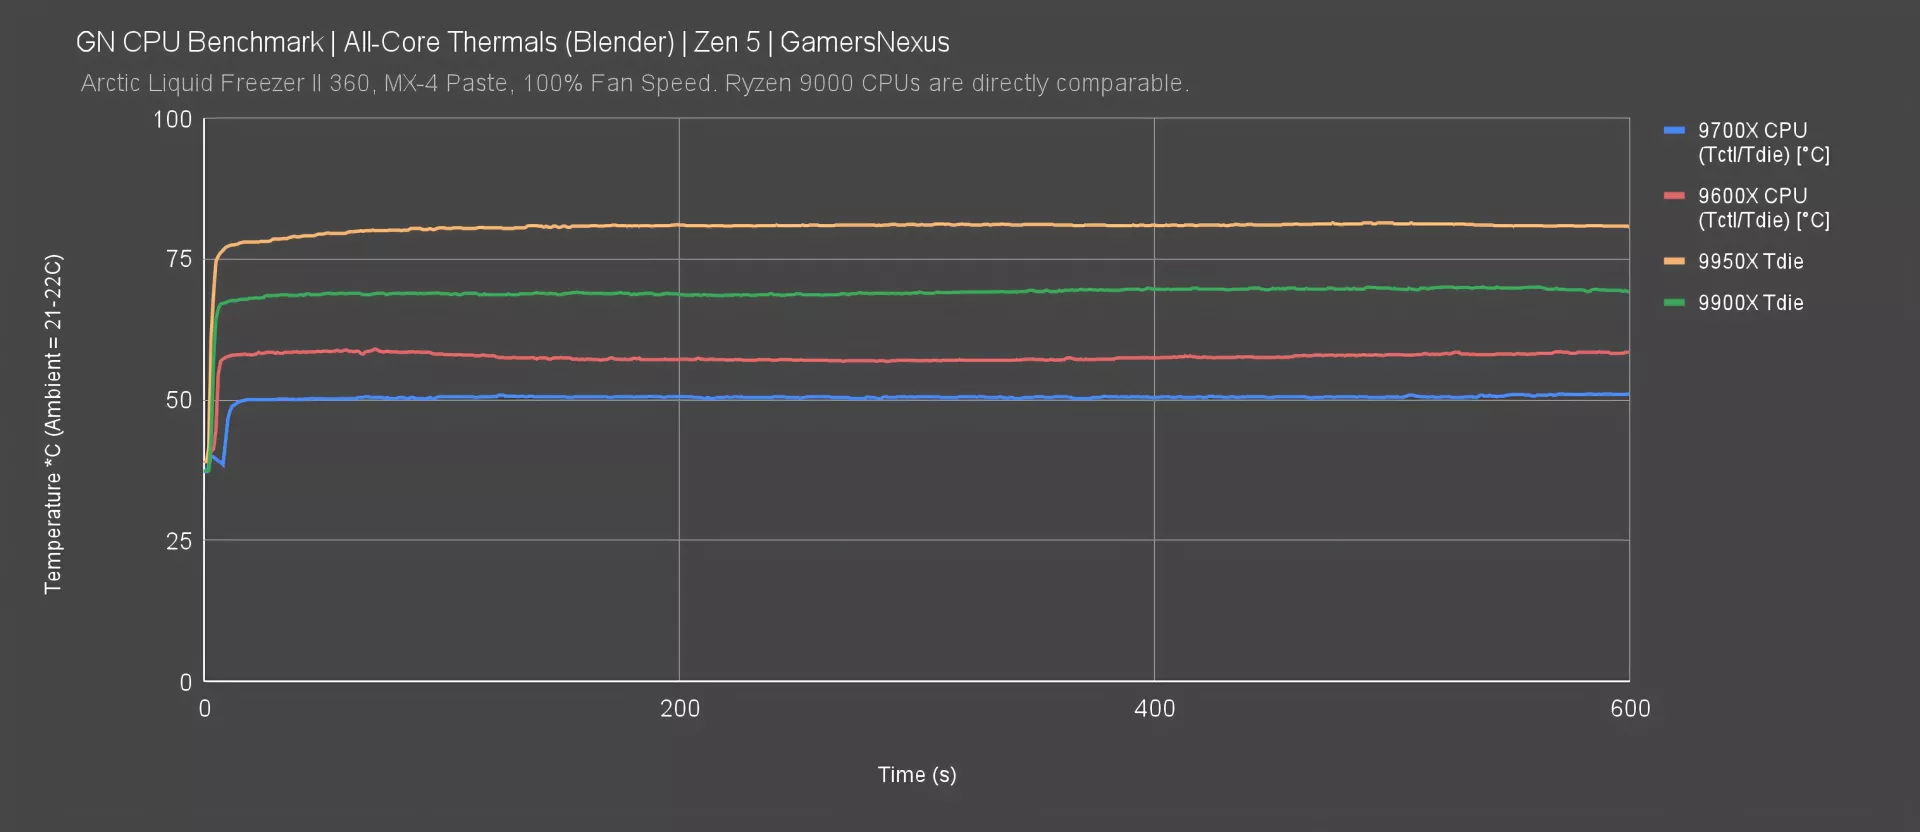
Anyway, here’s the result with the same Liquid Freezer II 360 at 100% fan speed in all tests. The 9700X and 9600X are the lowest power of these. The 9700X ends up cooler on Tdie than the 9600X (that much is like-for-like) because it has more cores to spread the same power and heat across.
The 9700X ran at about 51 degrees Celsius in a 21-22C test environment. The 9600X ran at 58 degrees in the same controlled conditions and at steady state. The 9900X ran at 70 degrees Celsius, with the 9950X at 81 degrees Celsius. Under identical conditions, we’d generally advise a 360mm liquid cooler for a 9950X if you want some room to drop fan speeds for noise levels. The 9900X would do fine with a high-end air cooler or a 280mm liquid cooler. The 9700X and 9600X can use any number of affordable air coolers on the market.
Power Consumption
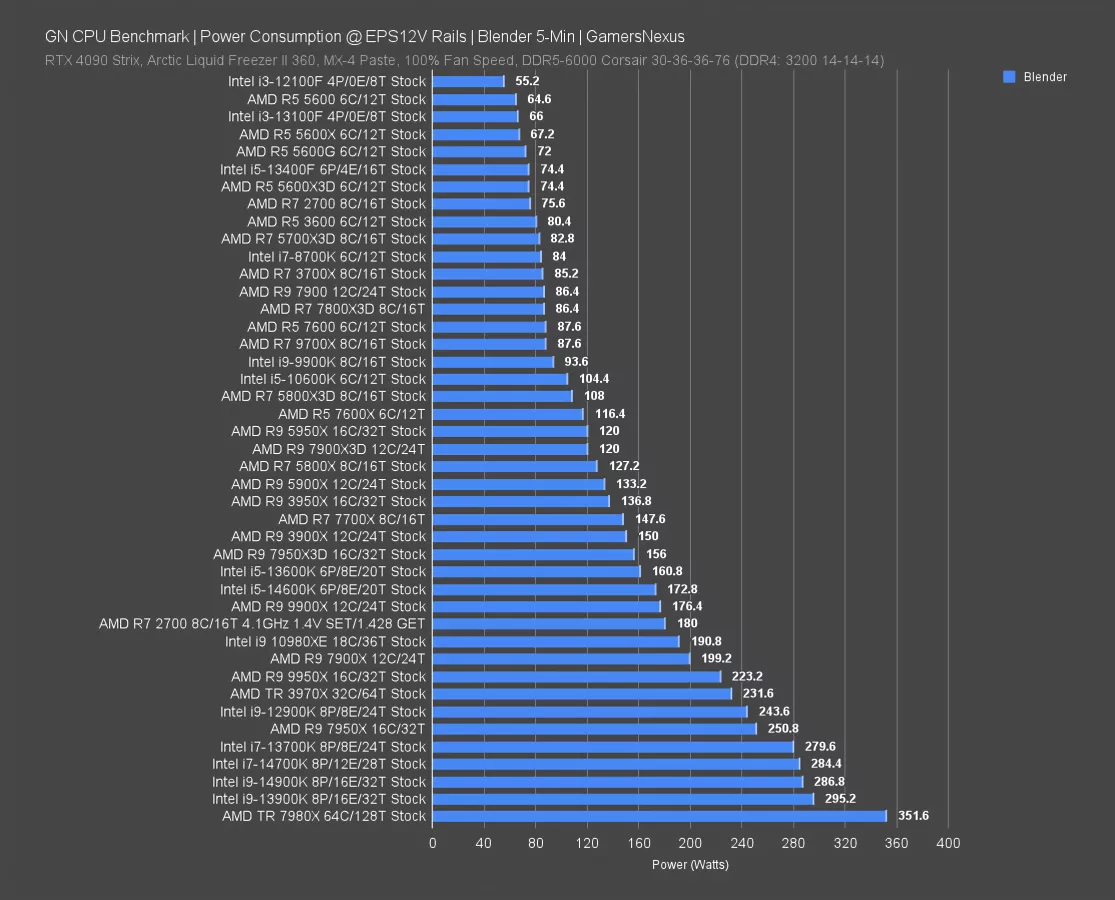
In a worst case, peak power consumption load where all cores are engaged with rendering, the 9900X pulled 176W at the EPS12V cables. The 7900X that it replaces required 13% more power at 199W, so AMD has definitely improved in all-core power consumption for workloads like this.
Here are some generational comparisons: The 5900X pulled 133W in the same test and the 3900X (watch our review) pulled 150W. The 5000 series is when AMD really dropped power consumption in big ways and seemed to have the 12- and 16-core CPUs correlate with better voltage bins.
The 7950X required 251W in this test, with the 9950X improving with its 223W result. Overall, this is an area that AMD has been improving in total power consumption, despite setbacks in gaming power efficiency and total power draw that we looked at in our video from a few days ago.
Also, just for fun, we threw Intel’s own 9900 on here -- except it’s the 9900K from 2018 (watch our review) and it pulled 94W. The company also had a 9900X, but it seemed extreme to buy a 6 year old CPU for one joke.
Power Efficiency
Blender Power Efficiency
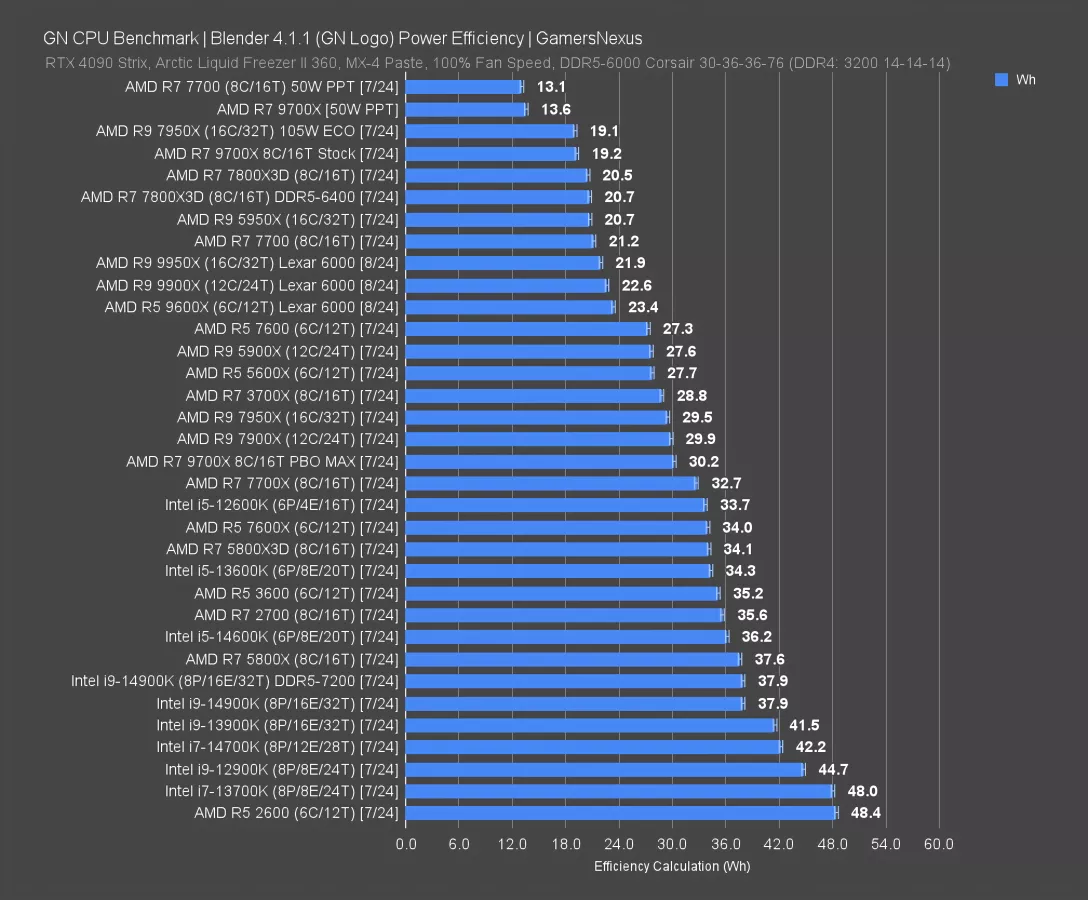
Power efficiency is up now. We’ll start with the best-case scenario that relates to the prior power consumption chart, which is rendering.
For this one, factoring in total render time in Blender of a frame from our GN logo animation, the 9900X ranked at 22.6 Wh. That puts it about equal with the 9950X, so it’s overall more efficient than the 7900X (which had a 29.9 Wh result). The improvement is huge, as we’ve seen consistently in this test: We’re seeing a reduction of 24% in Watt-hours used during the test, with comparable improvements from the 7950X (watch our review) to the 9950X that we looked at yesterday. The 9700X kicked this all off by achieving the top score for an out-of-box CPU (at 19.2 Wh, behind only the 7950X in Eco Mode and the PPT-limited demo tests). This was a big improvement on both the same-TDP 7700 and the higher TDP 7700X. Zen 5 is looking good in this comparison.
The 9900X continues the trend of improving on efficiency in this all-core scenario.
7-Zip Compression Efficiency
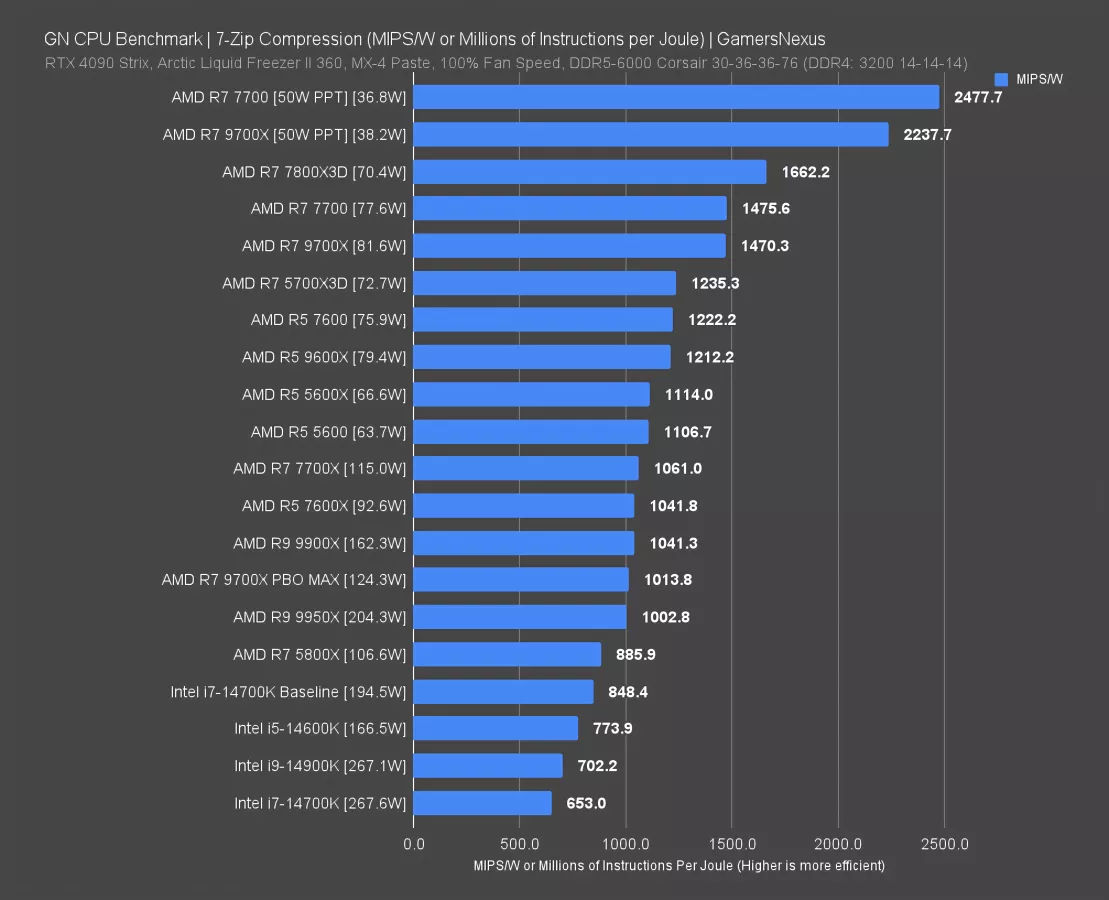
Testing efficiency with 7-Zip, we’re looking at the millions of instructions per second compressed per Watt. This could also be reduced to “Millions of Instructions Per Joule.” Like the others, this measures power during the test, but then calculates it against the MIPS compression score instead of FPS or minutes.
The R9 9900X completed 1041 MIPS/W, which has it equal to the 7600X for efficiency. The 9950X completed 1003 MIPS/W, where it pulled about 204W during the testing. The 7800X3D is remarkably efficient here, with the 7700 (watch our review) also doing well.
We don’t see the same gains as we saw in the Blender test and the Zen 5 CPUs are overall less efficient than their preceding counterparts when analyzing compression, which partly has to do with limited ability to continue pushing the performance higher (since efficiency is a metric including performance). We’re adding decompression efficiency now (a first for this suite), which is about the same power consumption, to help demystify this.
7-Zip Decompression Efficiency
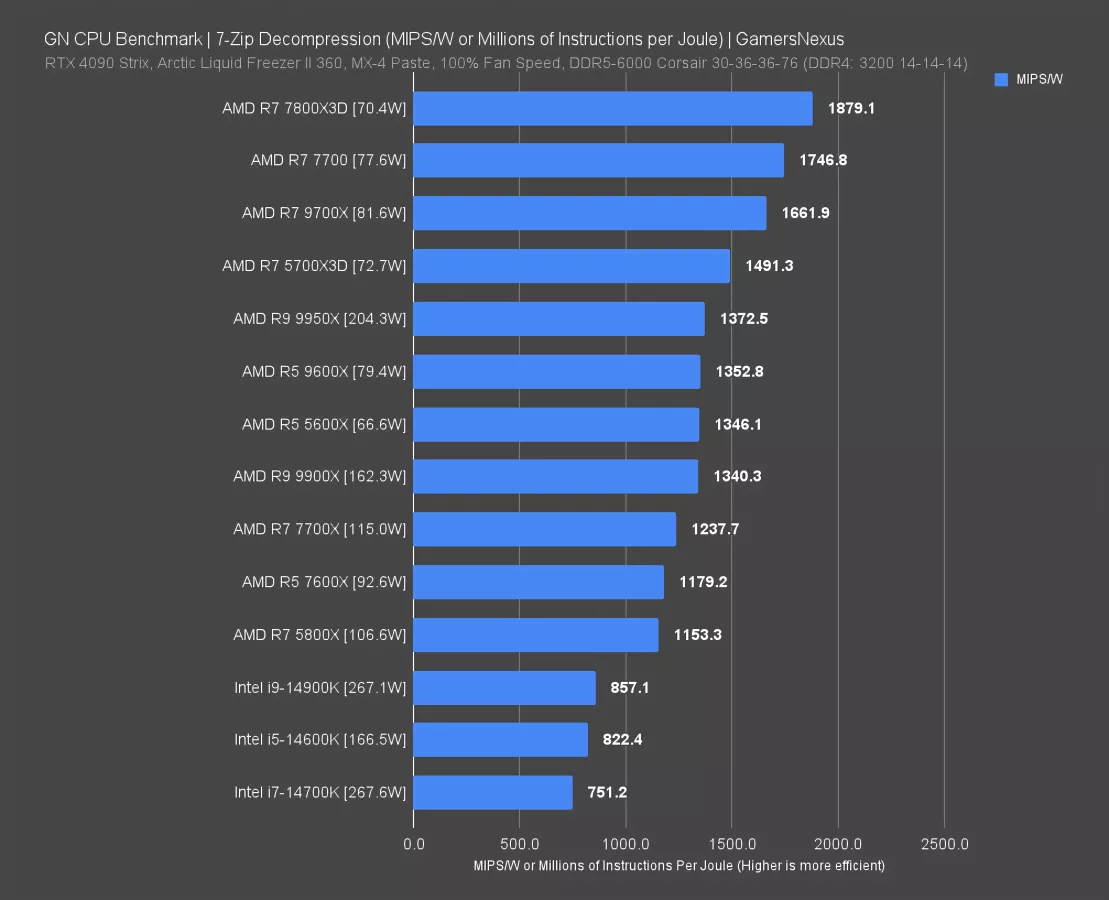
Decompression gives the 9950X incredible performance in MIPS, so it’ll be helped in MIPS/W as a result. The 9950X ends up at the top of the cluster behind the 5700X3D. The 9700X does relatively well here, up at 1662 MIPS/W. It’s still behind the R7 7700 with the same TDP, and both are behind the impressively low-power 7800X3D (watch our review). The 7800X3D’s ability to operate at only 70W here is what lets it lead charts so easily.
This is also a matter of the voltage bin for each CPU, which is a topic we recently talked about in our standalone efficiency video. Check that out for more information.
The new 9900X that we’re reviewing ends up in the middle, about the same efficiency as the R5 5600X and R5 9600X, not distant from the 9950X, and notably better than the 7700X and below. Intel’s CPUs bomb this test thanks to their extremely high power consumption.
Gaming Efficiency - Stellaris
We’ll look at gaming efficiency now, starting with Stellaris.
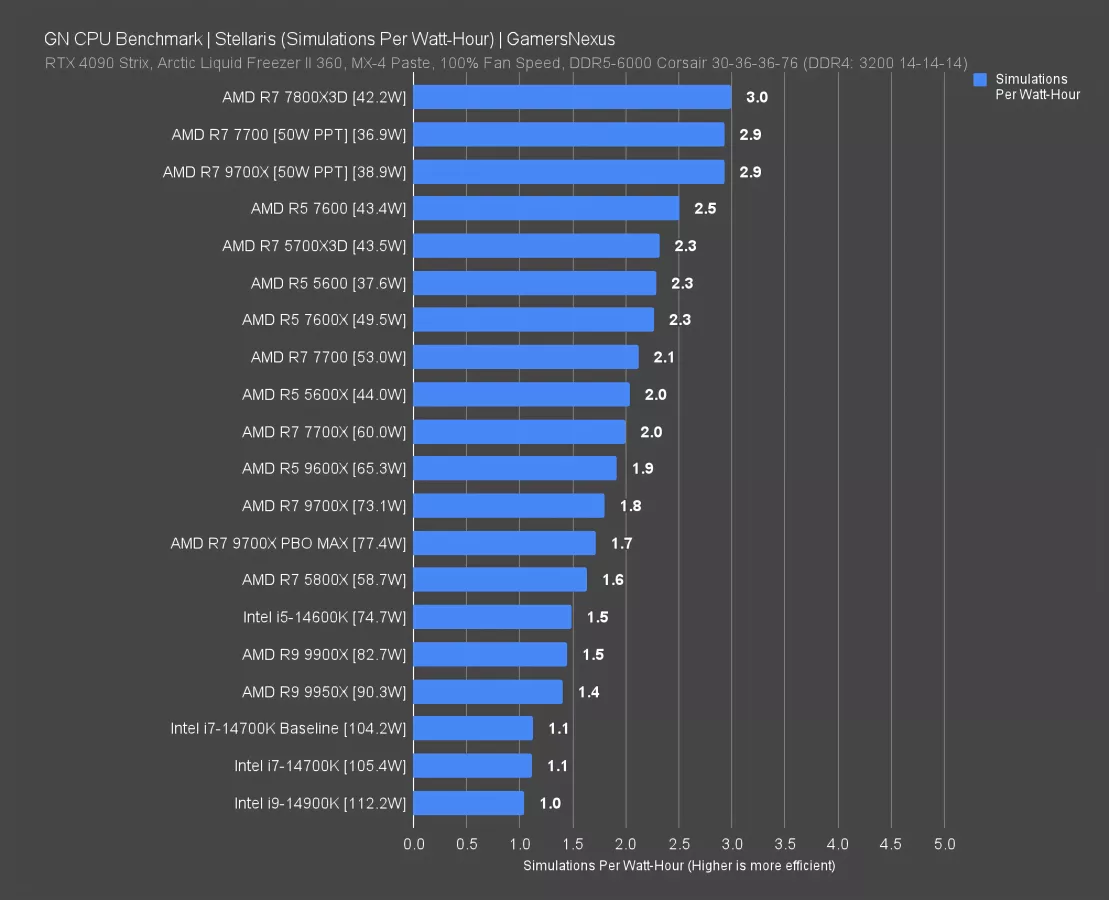
In Stellaris for simulation time, the 9900X ranked at 1.5 simulations per Watt-hour. Predictably, it is less efficient in gaming workloads than the 9600X at 1.9 Sims/Wh and the 9700X at 1.8 Sims/Wh. The 9900X pulls a little more power but isn’t intended to outrun the R5 and R7 CPUs in gaming, and so it’s ranked instead alongside the 9950X. This is expected behavior; the 9900X and 9950X are really only meant to be capable of gaming, not outperform AMD’s other CPUs.
The 7800X3D is once again a feat of engineering and productization, hitting its stride with a 3.0 simulations/Wh score.
Intel’s CPUs mostly cluster around a 1.0 scoring, with the 14600K finding a much better balance at 1.5.
Gaming Efficiency - Phantom Liberty
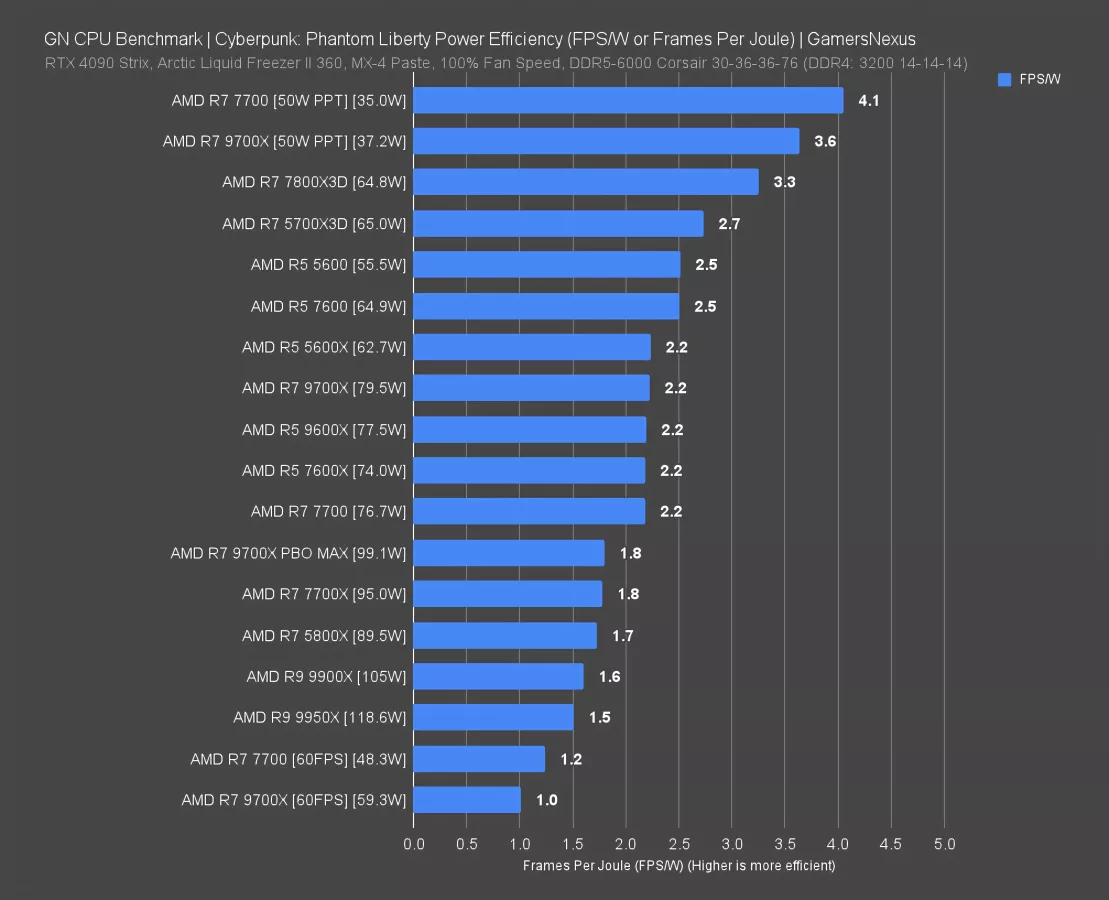
Phantom Liberty had the 9900X at about 105W during the test, which landed it at around 1.6FPS/W. That ranking has it functionally tied with the 9950X, which pulled 119W here, and the 5800X, which pulled 90W. The 9700X is a better balance for Zen 5, up at 2.2FPS/W. The 9700X is tied with the 7700 non-X and outperformed by the preceding R5 CPUs and the X3D CPUs.
We don’t have Intel CPUs on this chart yet.
Gaming Efficiency - FFXIV
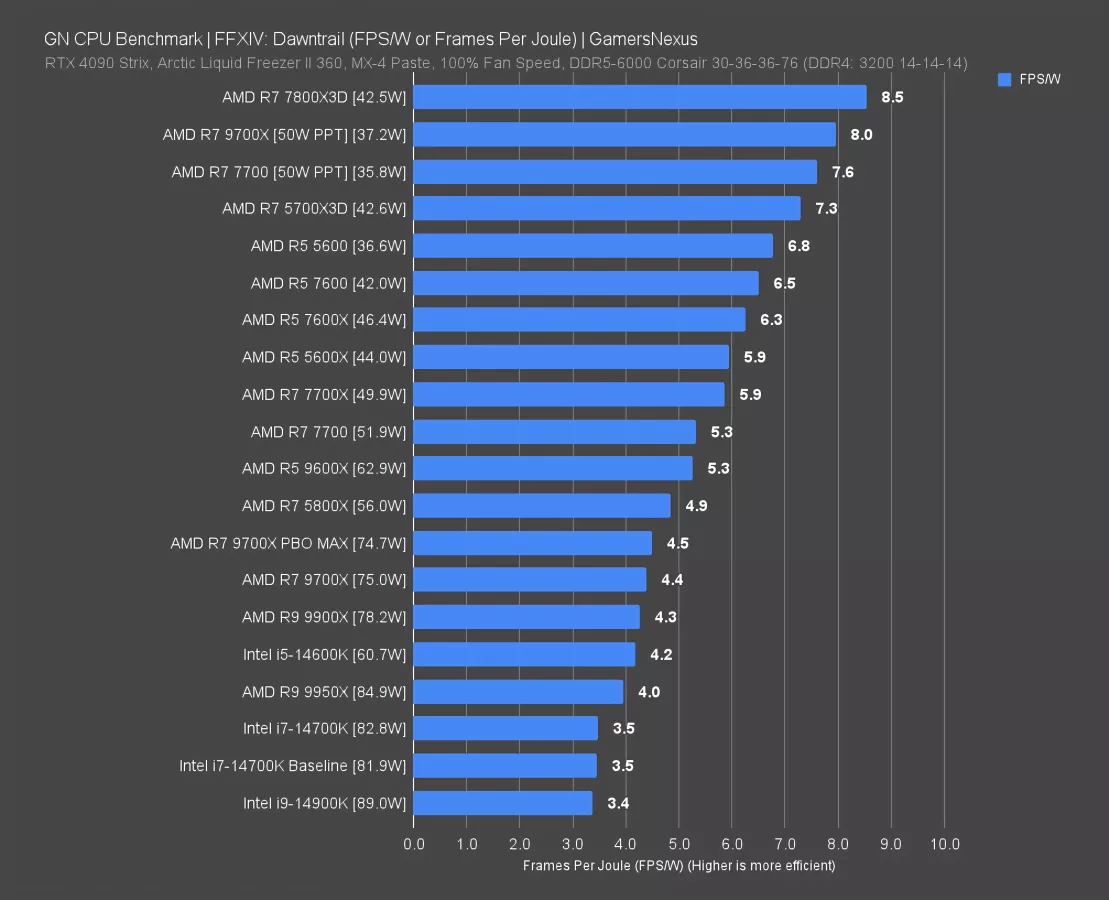
Final Fantasy: Dawntrail had the 9900X at 4.3 FPS/W, which aligns it with the 9700X and 14600K. AMD’s architecture is still more efficient than Intel’s for out-of-box settings, but it has defeated itself with some of its past CPU choices.
AMD R9 9900X Production Workloads
As in our 9950X review, we focus our 12-core and 16-core reviews on production workloads because these CPUs are more likely to be used in those tests. We still test gaming just to make sure things work properly, but we focus on non-gaming scenarios for these “mini-HEDT” parts.
SpecWS: RodiniaCFD
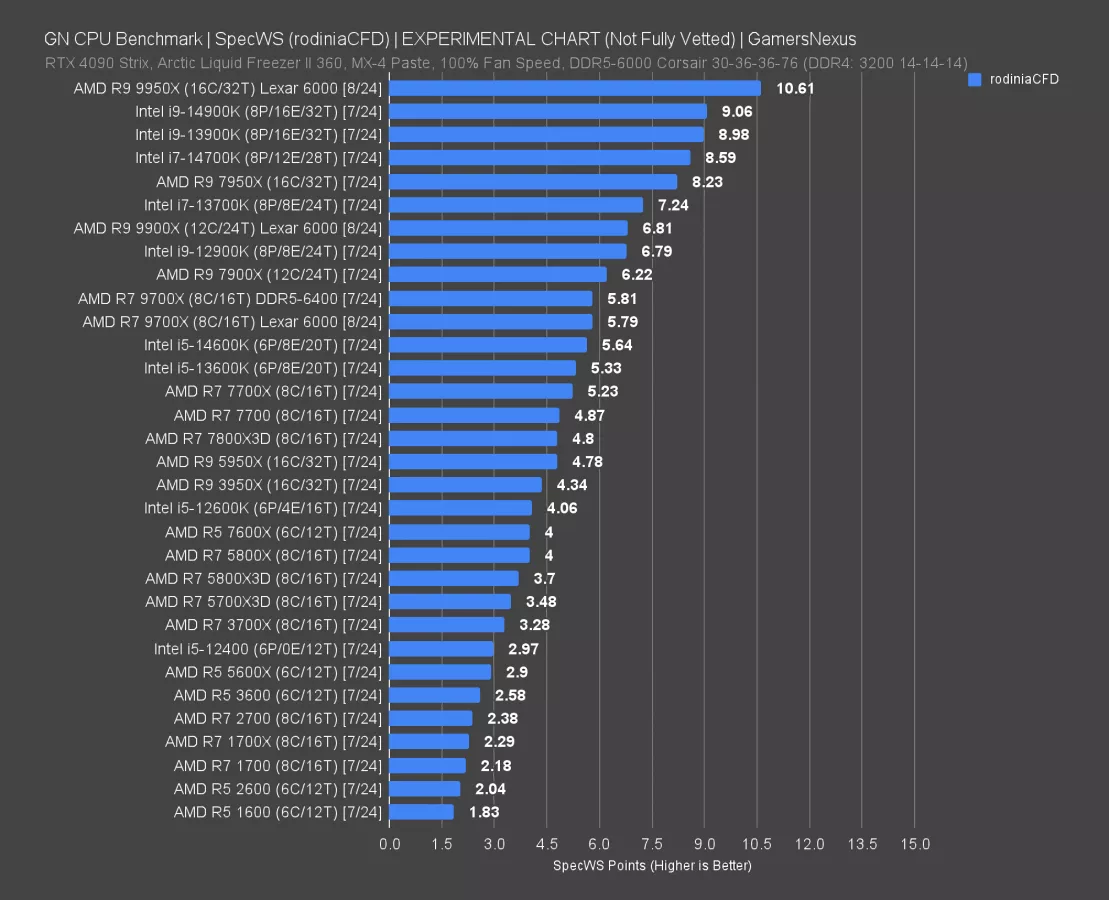
First up is RodiniaCFD, which we added after working with Wendell of Level1 Techs, a neutral third-party, and AMD to validate our findings. We had to get some external help validating our findings before publishing this chart because the numbers were so distant from other charts, and we always want to make sure any outliers are confirmed valid test results. In seeking peer review, we were able to confirm our findings between the 7950X and 9950X shown here, where the 9950X posts an uncharacteristically large 28-29% uplift over the 7950X. This was confirmed by both Level1 and AMD, both of whom sent us their test results for our own verification.
The 9900X sees a smaller uplift closer to 10% over the 7900X here, but consider that it’s at a 50W lower advertised TDP. This would be another situation where the Zen 5 CPUs may offer better efficiency and also better performance. We’ll talk about this chart in more detail in our HW News episode, but we wanted to shove it in here as well since the 9950X does phenomenally as compared to the other 21 or so tests we ran on it. The 9900X is also a good performer here when considering the power drop. Just as one note, this chart is not 100% confirmed yet. It is still what we consider an experimental test, which means we’re leaving some room here for changes in the event we find something related to the benchmark software or how it’s executing that drops below our standards in the future, but we did want to share this because we think it’s an important data point and we did some basic peer review with it and our numbers aligned with theirs.
Blender
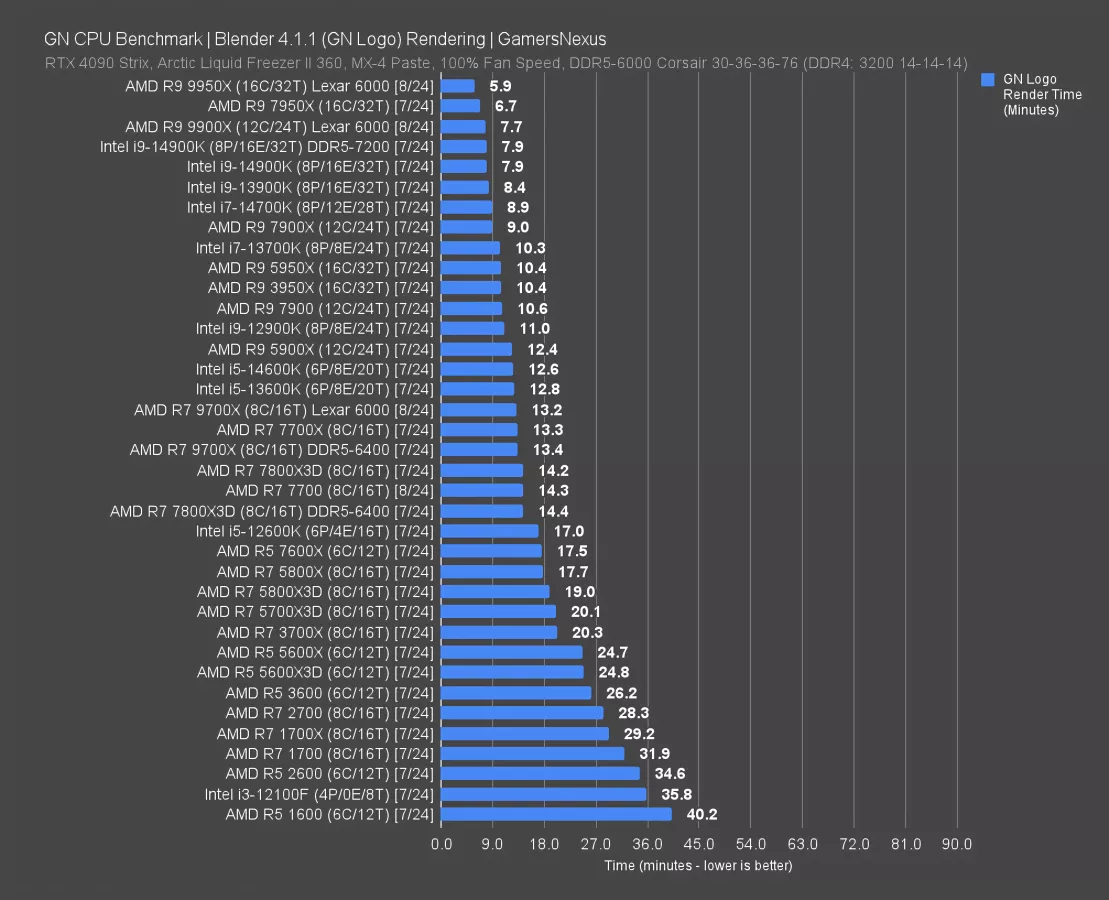
Rendering in Blender is up first. For this, the 9900X completed the work in 7.7 minutes. That has it just ahead of the 14900K’s 7.9-minute result for our intro animation and benefiting from a 14% reduction in time required from the 7900X’s 9-minute result. The 7900 (watch our review) is slower still, at 10.6 minutes, with the 9700X at 13.2 minutes. That allows the 9900X a render time requirement reduction of 43% against the 9700X, which makes sense with the core count increase.
Generationally, the 5900X required 12.4 minutes, giving the 9900X a reduction of 38% in total render time for this one frame.
The 9950X and 7950X both lead the 9900X, with the 9950X offering a render time reduction of 23% total time required. If you’re debating whether the extra cost is worth it, that should help form a decision.
Chromium Code Compile
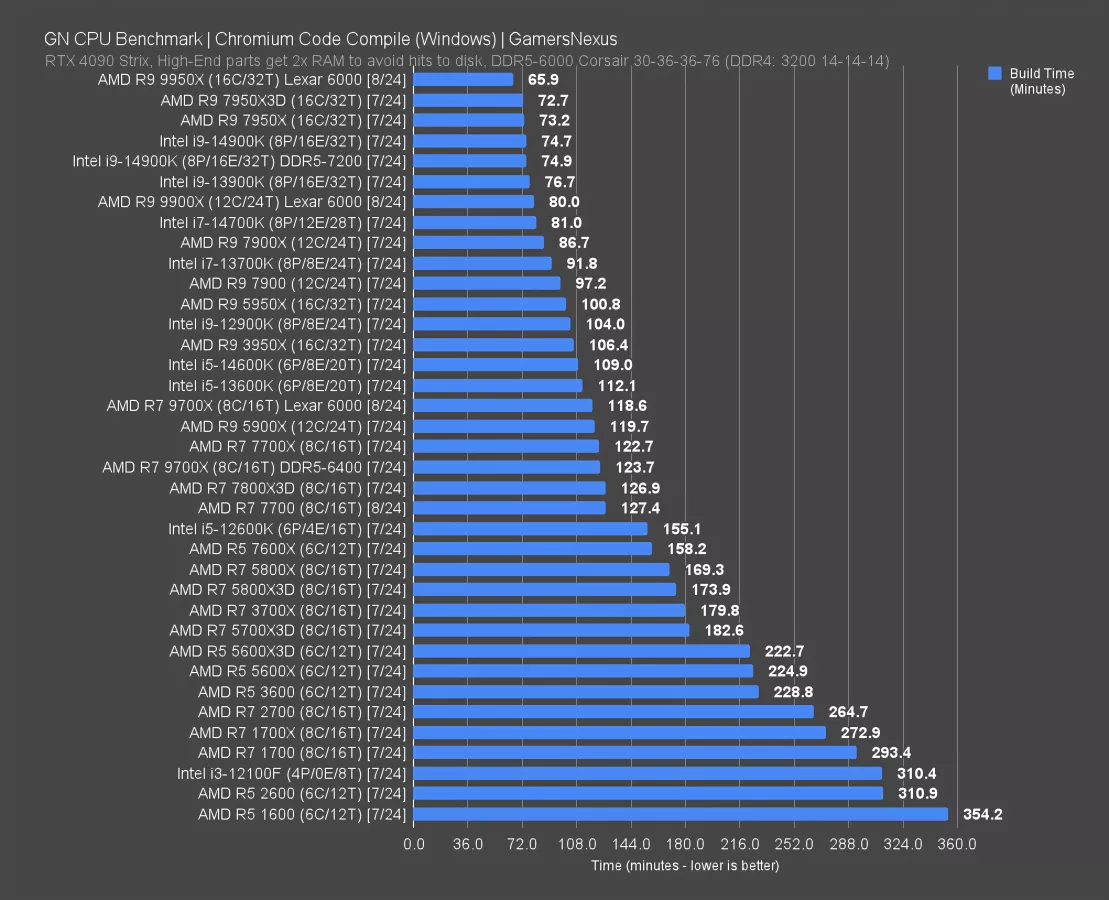
Up next is Chromium code compile. As with all tests, a single benchmark of a workload can only truly represent that workload. This is what we use for compile testing right now. Other compile workloads can and do differ.
The 9900X required 80 minutes to complete this code compile, which has it tied with the 14700K (watch our review). The 9950X completed the compile with a total time reduction of 17.6% with its 66-minute result, with the 7950X leading the 9900X with a reduction in total time of 8.5%.
The 7900X required 87 minutes for this work, giving the 9900X a 7.7% time reduction. That gap grows with the 7900 non-X and its lower power budget.
Generationally, the most interesting improvement is a 33% time requirement reduction against the 5900X (watch our review), dropping from 120 minutes to 80 minutes.
The only Intel CPU ahead of the 9900X is the i9 lineup of 14900K (read our review) and 13900K options.
7-Zip Compression
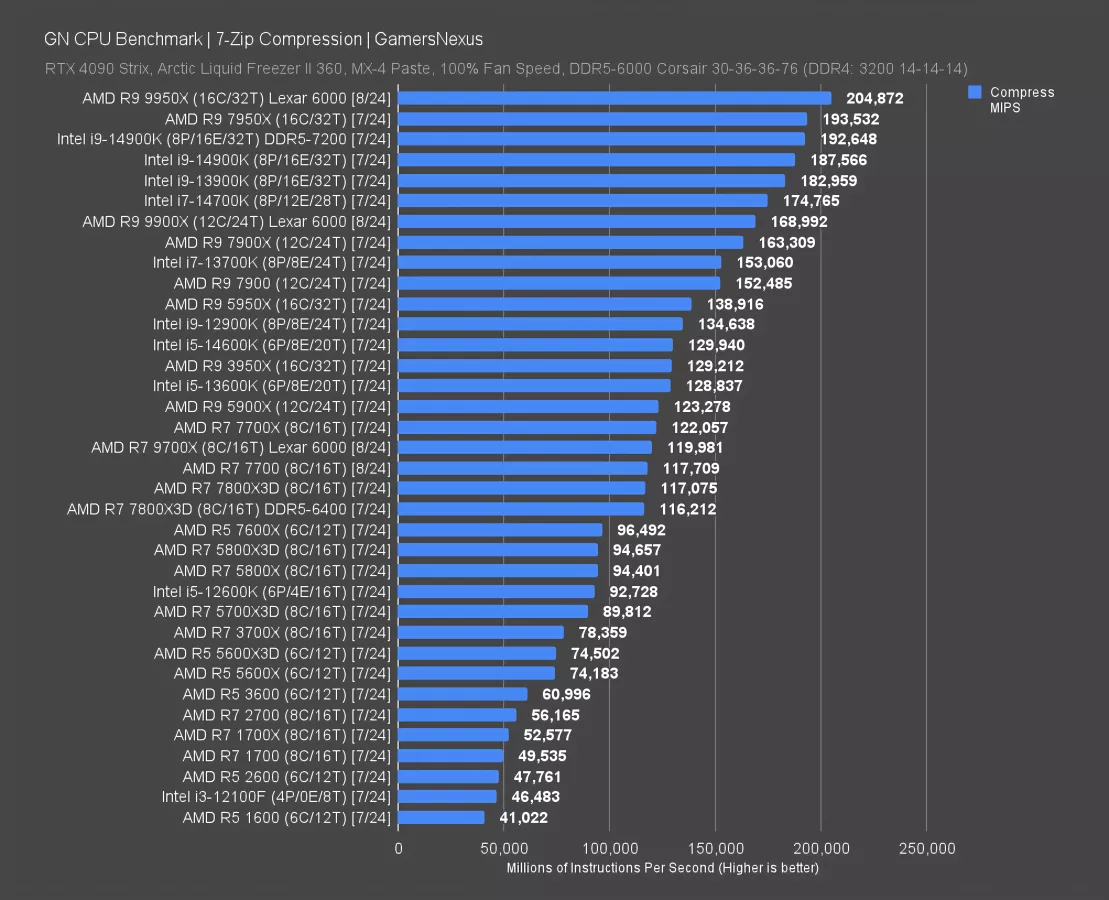
In 7-Zip file compression, the 9900X completed 168.9K MIPS, landing it between the 7900X (3.5% improved) and the 14700K (itself 3.4% ahead of the 9900X). The 14700K looks to be the direct competition to the 9900X, assuming Intel resolves its issues without collateral damage.
There aren’t many upgrade options without going to true HEDT: The 9950X would grant a further uplift of 21% in MIPS, just ahead of the 7950X. The 14900K at 188K MIPS would improve about 11%.
Generationally, the jump over the 5900X is large: The 9900X moves to 168,992 from the 5900X’s 123,278 MIPS.
7-Zip Decompression
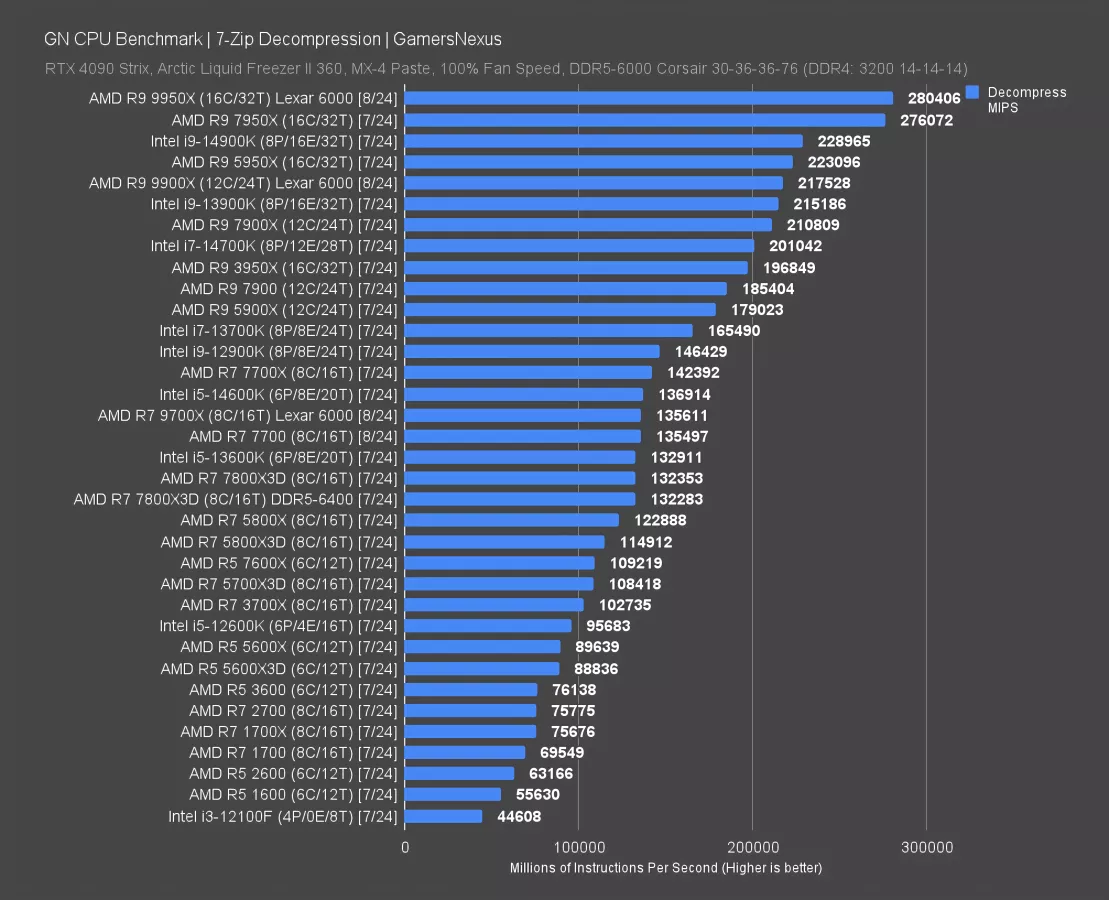
In file decompression, the 9900X completed 217.5K MIPS and landed between the 13900K and the 14900K CPUs. It’s actually below the 5950X here, so we’re seeing more benefit from just raw core count in this particular benchmark than some others. Another example is the 5800X outperforming the 7600X, or the 3950X outmatching the 5900X, which is just a prior generation representation of the same thing.
The 9950X and 7950X set a high ceiling in this test, with the 9950X leading the 9900X by 29%.
The 14700K remains a good competitor, but it allows the 9900X to gain a lead of 8% in this benchmark.
Adobe Photoshop
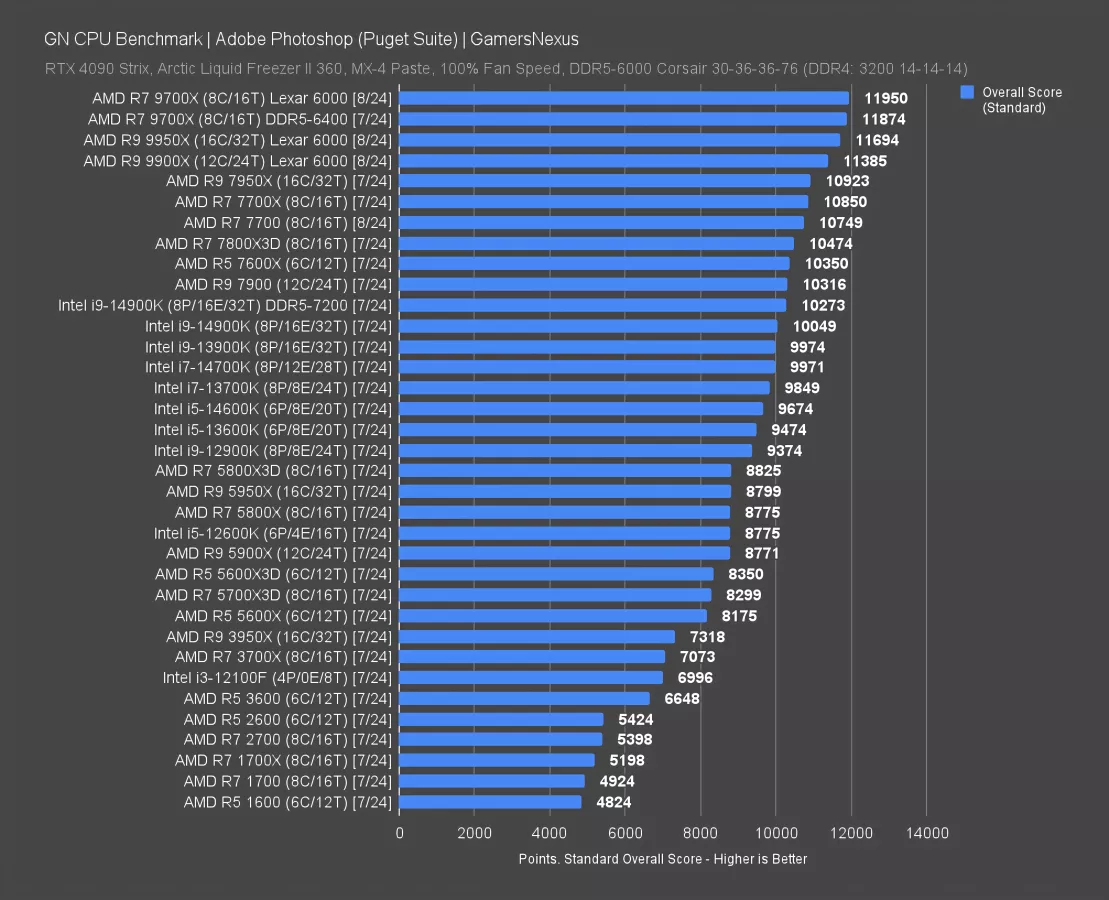
In Adobe Photoshop with the Puget Suite, the 9900X’s completion of filters, scales, warps, blend modes, blend layers, and other functions gave it a score of 11,385 points. That ties it with the 9950X, where both see a slight loss in performance compared to the 9700X. This test is more thread-limited and will not benefit as much from huge core counts, unlike what we just saw in decompression. That’s OK, but that’s why we run so many tests: It allows us to show all kinds of different software scenarios.
The 9900X still does well if this is a side task you might do on your machine, ultimately remaining among the best. In this test right now, the Intel CPUs fall below about a quarter of the total entries we have, which are AMD. This appears to have shifted from an Intel favor in years past to an AMD favor today.
Adobe Premiere
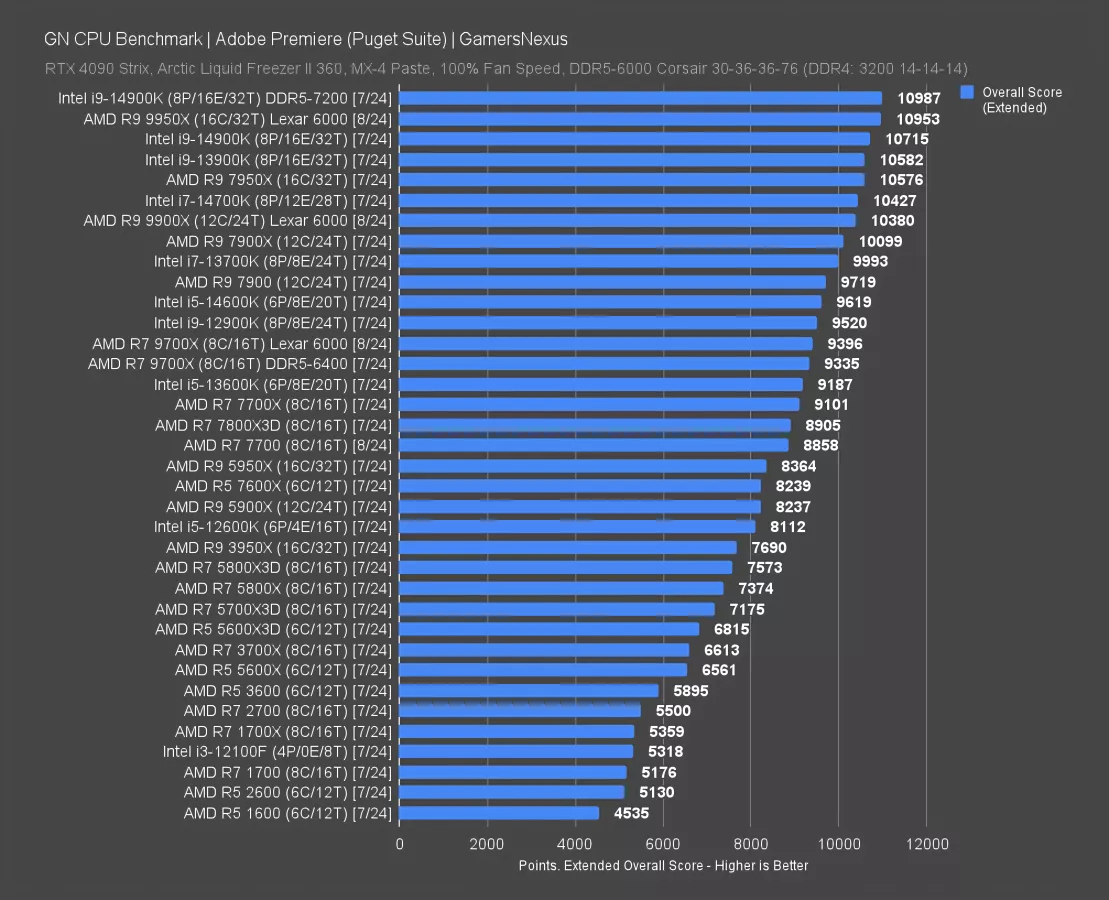
Adobe Premiere is up next, also with the Puget suite. In this one, the 9900X scored 10380 points, again roughly tying it with the 14700K. In Premiere testing with the extended workload, the 9950X pulls ahead by 5.5%. There’s not a big benefit to the cores here, but the lineup makes a little more sense than in Photoshop.
The 9900X outdoes the 7900X only marginally, at 2.8% total uplift. The lead over the prior 5900X is 26%.
SpecWS: Financial Simulations
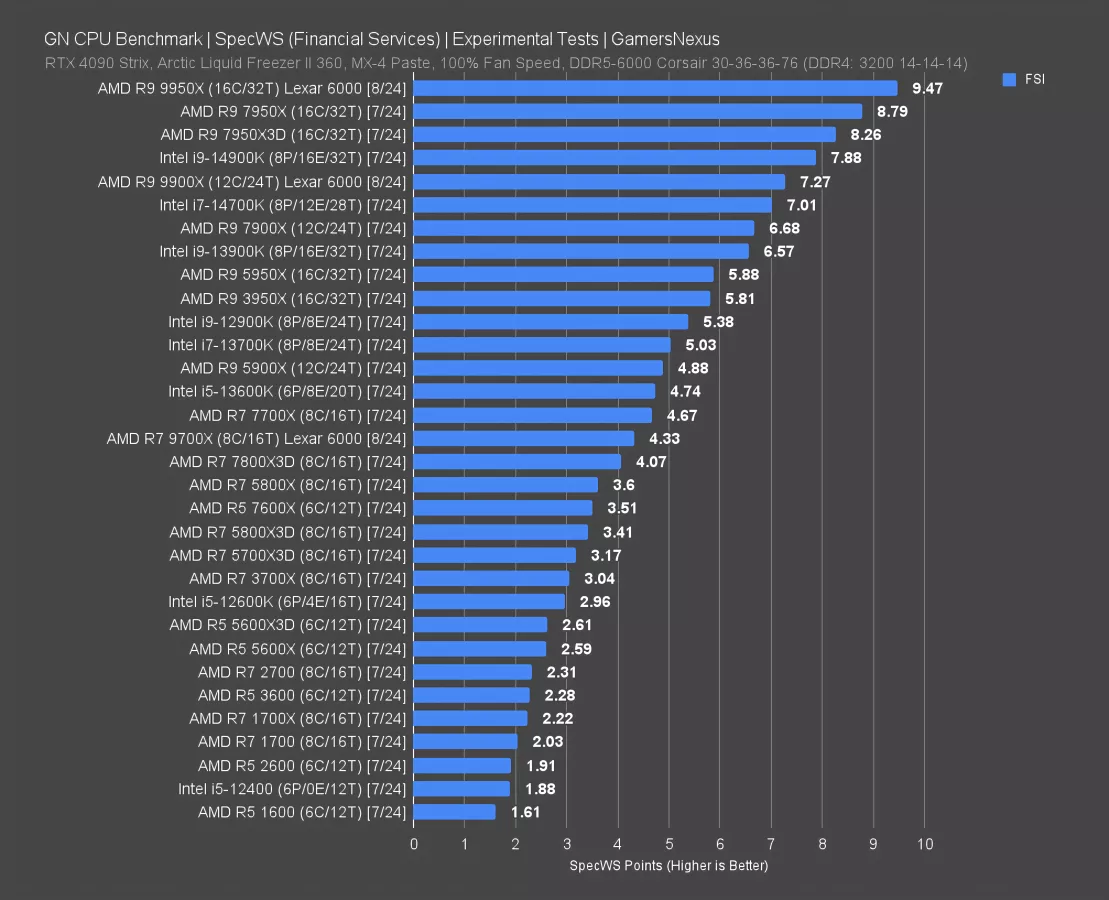
Spec Workstation is up now. This is testing financial simulations like probability calculations, options modeling, and similar tests. This is a workstation task scored in aggregate.
The 9900X scored 7.27 in the Open Spec testing, which improves it upon the 7900X by 8.8%. The 9950X leads this chart currently, at least until we run Threadripper through again, at 9.47 (a 30% uplift over the 9900X). Intel’s 14700K trails the 9900X here, with the 14900K ahead of it.
SpecWS: LAMMPS
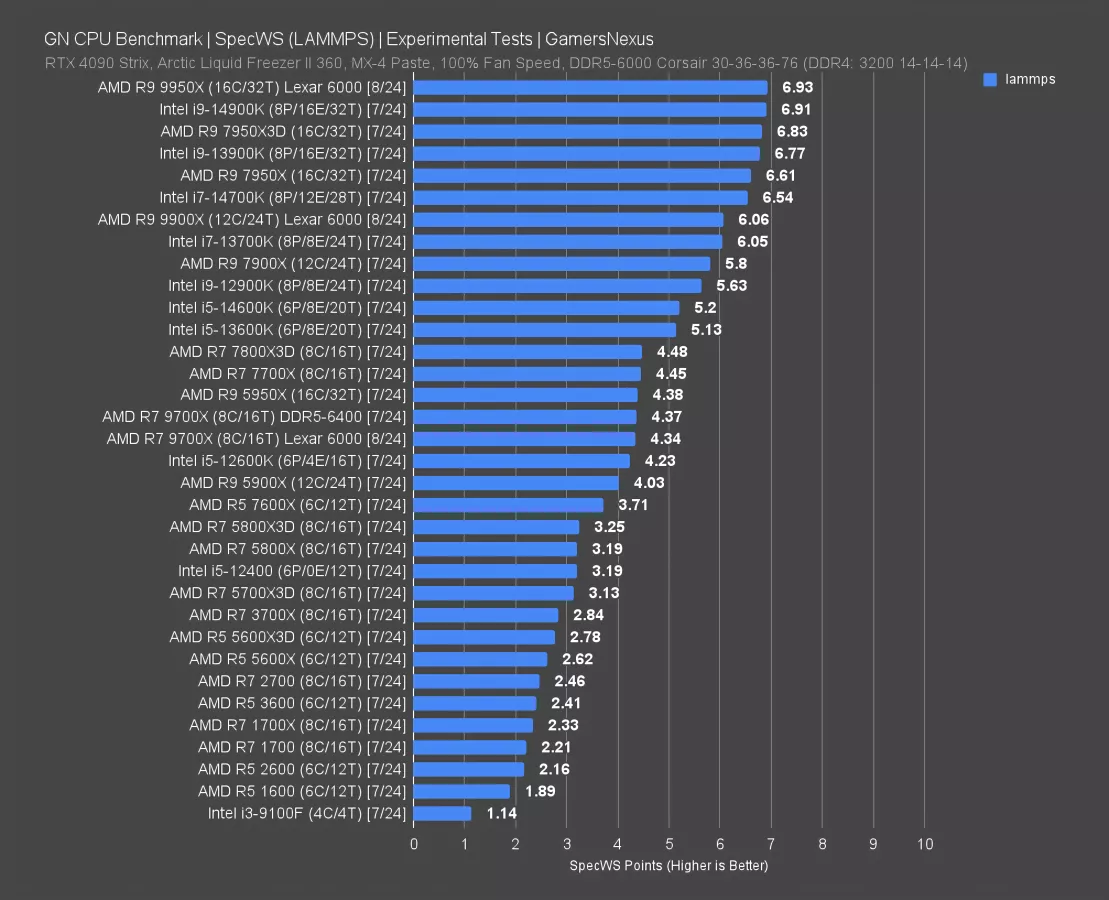
The next Spec test is for LAMMPS biomedical modeling. In this benchmark, the 9900X scored 6.06, which ranked it as tied with the 13700K. The 14700K leads by 8%. If you’re considering the 9900X vs. the 9950X, then the improvement of the 9950X would be about 14.4%.
Uplift of the 9900X over the 7900X is 4.5% here. Not bad since the power also went down.
AMD R9 9900X Gaming Benchmarks
We’ll keep the gaming tests short for this one, just like we did for the 9950X. The goal is to verify that it works properly. The 7800X3D will predictably remain the top choice for new gaming machines.
GN CPU Review Game Tests
| Game | Year Released |
| Final Fantasy XIV: Dawntrail | 2024 |
| Dragon's Dogma 2 | 2024 |
| F1 24 | 2024 |
| Baldur's Gate 3 | 2023 |
| Starfield | 2023 |
| Cyberpunk: Phantom Liberty | 2023 |
| Total War: Warhammer III | 2022 |
| Stellaris | 2016 |
| Rainbow Six Siege | 2015 |
Here’s the list of games we’ve been testing this time around. We made it a point to undergo a massive overhaul to our game benchmarks, so most of what we use now is from 2023 and 2024. This has been pretty awesome since some of the newer games are starting to really scale with core counts 8 and above.
Dragon’s Dogma 2
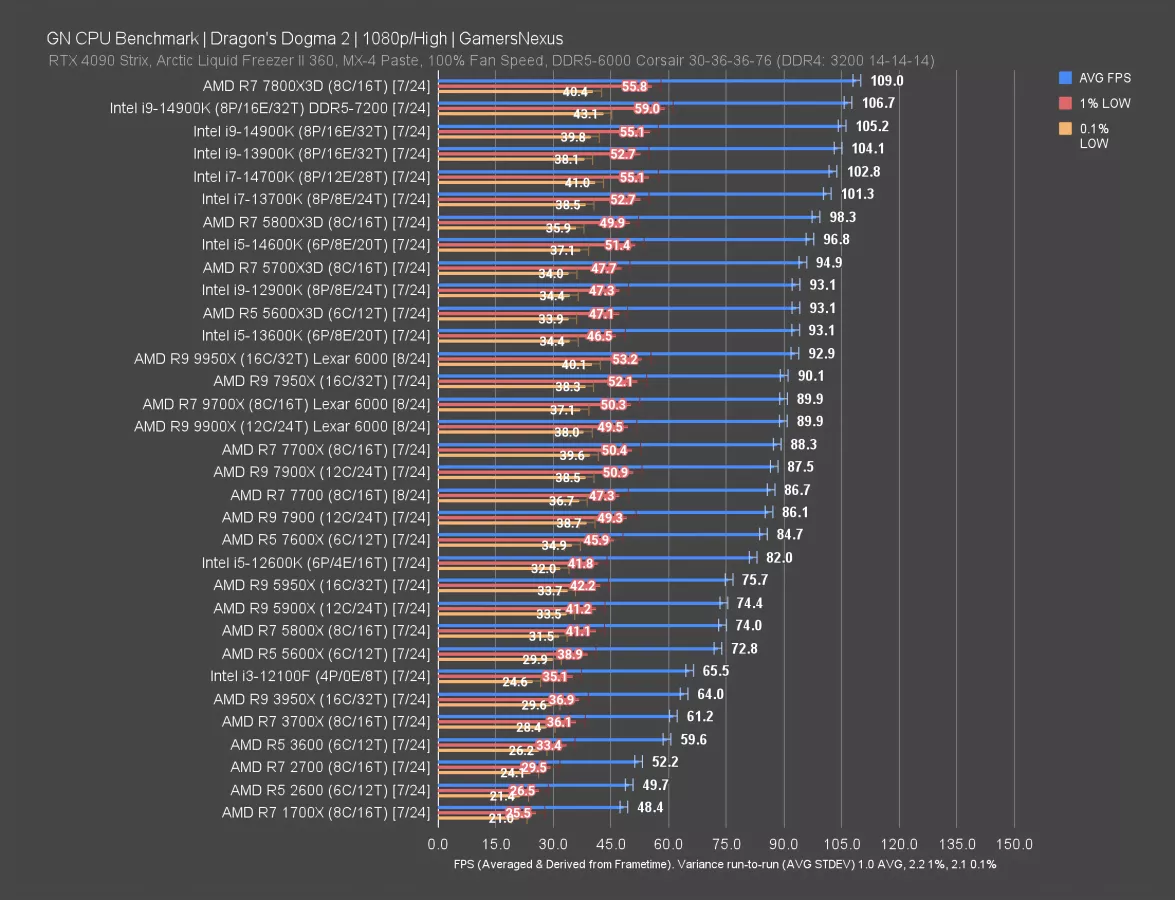
Dragon’s Dogma 2 is up first, a 2024 title.
In Dragon’s Dogma 2, the 9900X ran at 90 FPS AVG with lows spaced proportionally, based on neighboring results. Cores are parked for the 9900X and 9950X, so they’re basically 9700X CPUs -- but with a higher power budget. This has the 9950X ahead of the 9700X as a result, for reasons we showed in our 9950X review. The 93 FPS AVG result is repeatable. The 9900X is tied with the 9700X and 7700X (watch our review). Uplift over the 7900X is 2.7%.
As before, the leader remains the 7800X3D. In a gaming scenario, you can expect an uplift in our custom testing in the big city here amounting to about 21% for the 7800X3D over the 9900X.
The 14900K is also up top, but technically behind the 7800X3D. The 14700K that the 9900X was neck-and-neck with in many production tests is also shown favorable gaming performance.
F1 24
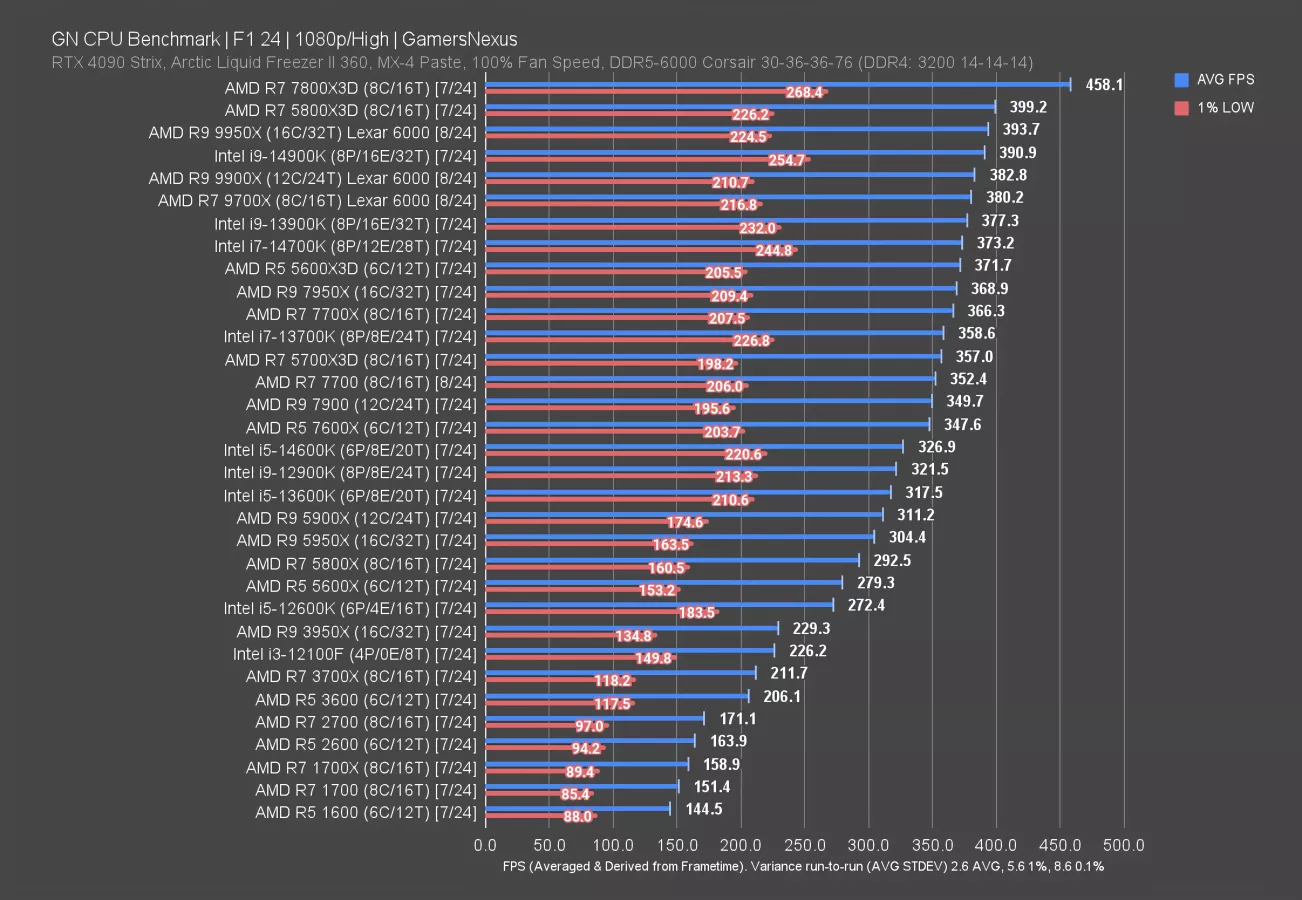
F1 24 is another 2024 title, clearly, and has the 9900X at 383 FPS AVG, just ahead of the 9700X and behind the 9950X. These 3 CPUs are functionally about the same. The 14900K lands alongside them.
Chart leaders include not only the 7800X3D, but the two-generation-old 5800X3D CPU at 400 FPS AVG.
The 9900X is at least running properly and without a performance sacrifice.
FFXIV: Dawntrail
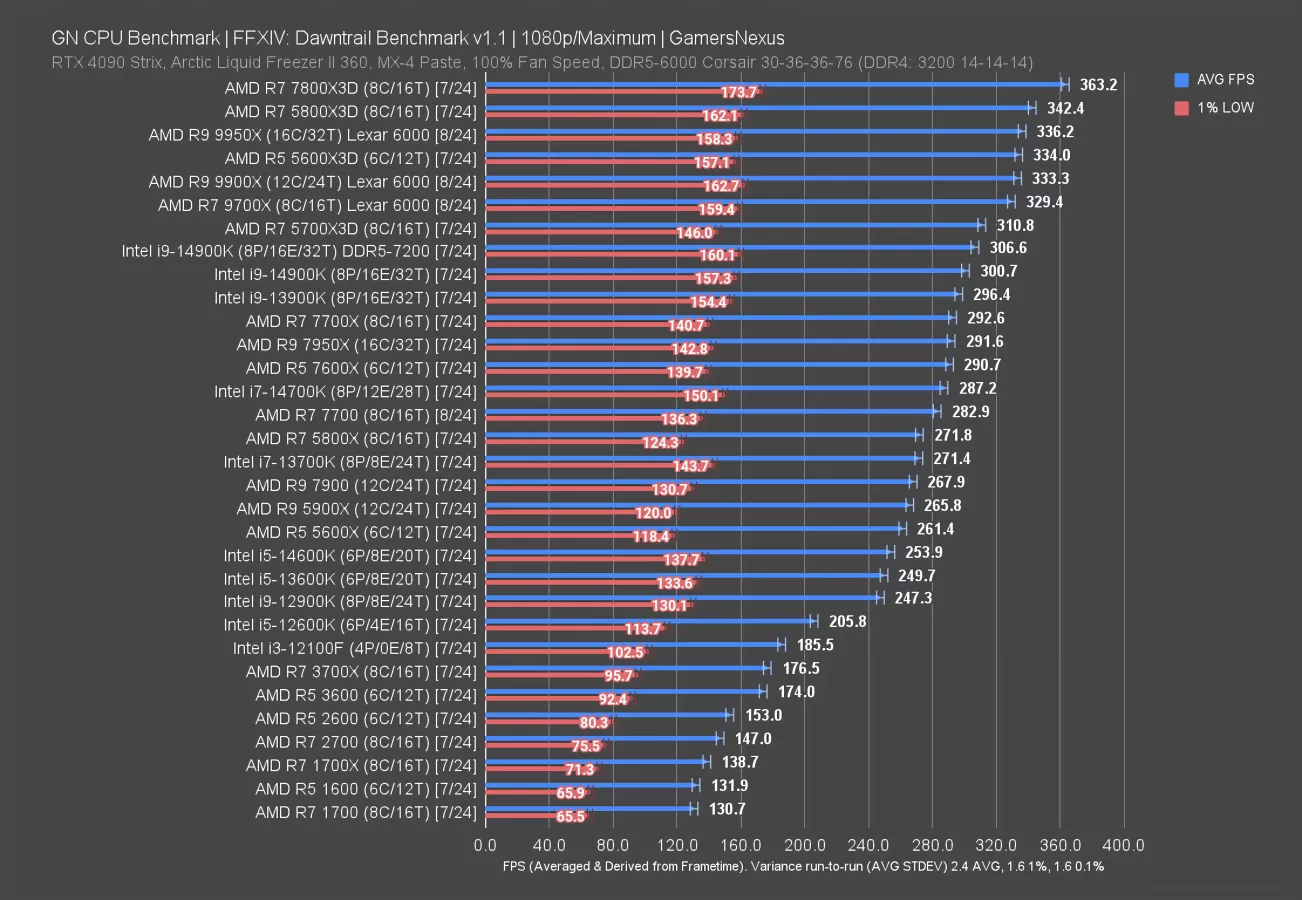
In Final Fantasy XIV: Dawntrail, the 9900X ran at about 333FPS AVG, which roughly ties it with the 9700X and 5600X3D (read our review). The 5600X3D is enough alone to demonstrate that there are better value pure gaming parts, as we’ve been saying, but it doesn’t scale anywhere close to the 9900X in the production strengths we saw earlier. It all depends on your use case.
The 7800X3D sets the ceiling at 363 FPS AVG in this one. The 9950X leads the 9900X on a technicality. The 7900 underperforms here: Its 65W TDP is limiting its power availability to boost, and so the 7700 non-X at the same TDP is better able to leverage that power budget across fewer cores to boost higher, which Dawntrail favors.
Stellaris
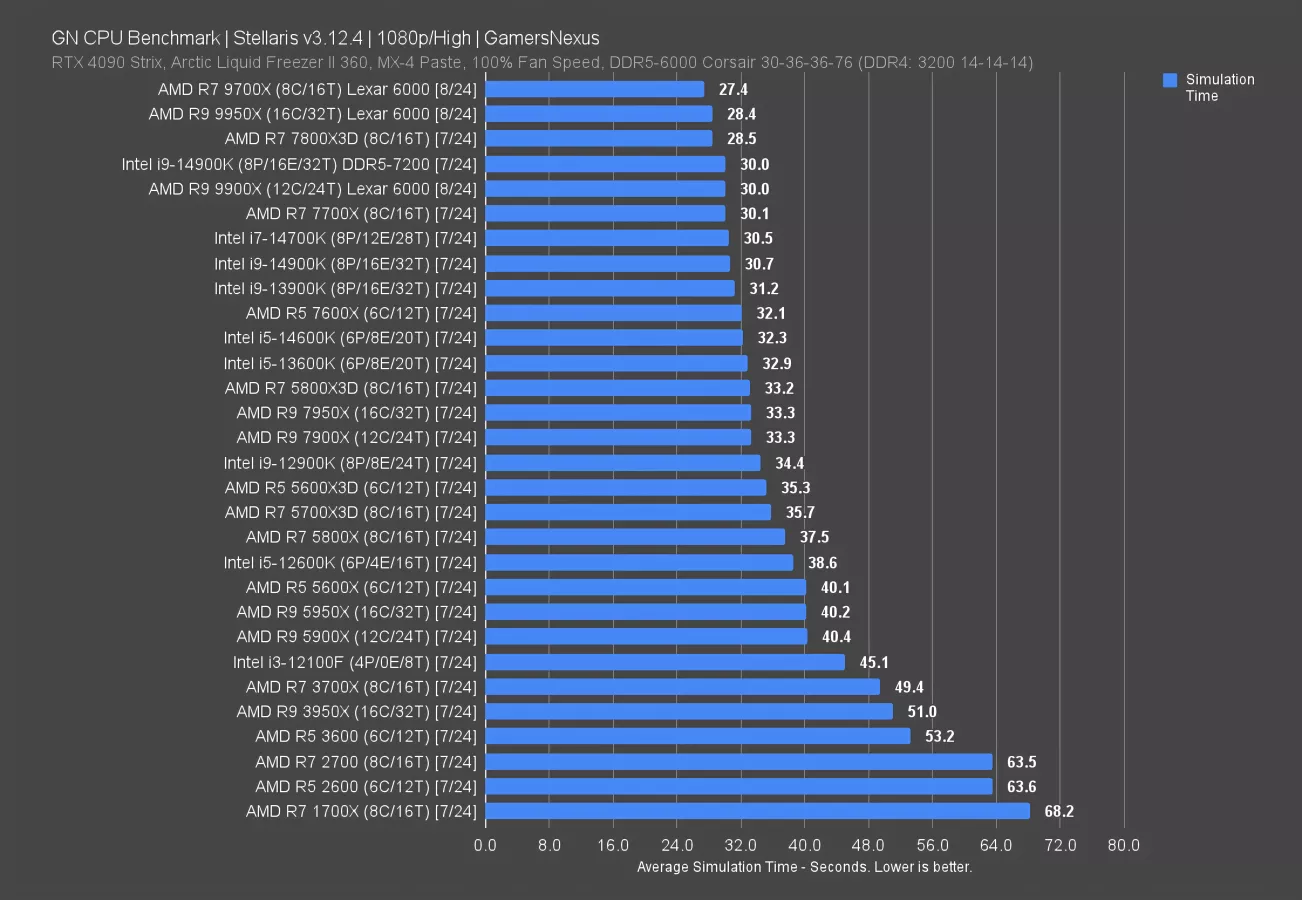
Stellaris simulation time is next. Despite being among the oldest two games in our bench suite, and the only ones that pre-date 2022, Stellaris remains remarkable as we test simulation time rather than framerate.
The 9900X required on average 30 seconds to complete the simulation. Leaders here remain the 9700X, 9950X, and then 7800X3D. Some of these are within error of each other. The 14900K entries are both near the 9900X, though it has a technical lead over both the 14900K with standardized RAM and the 14700K, the two of which are within run-to-run variance of each other. Improvement over the 7900X is about 10% less time to simulate.
Baldur’s Gate 3
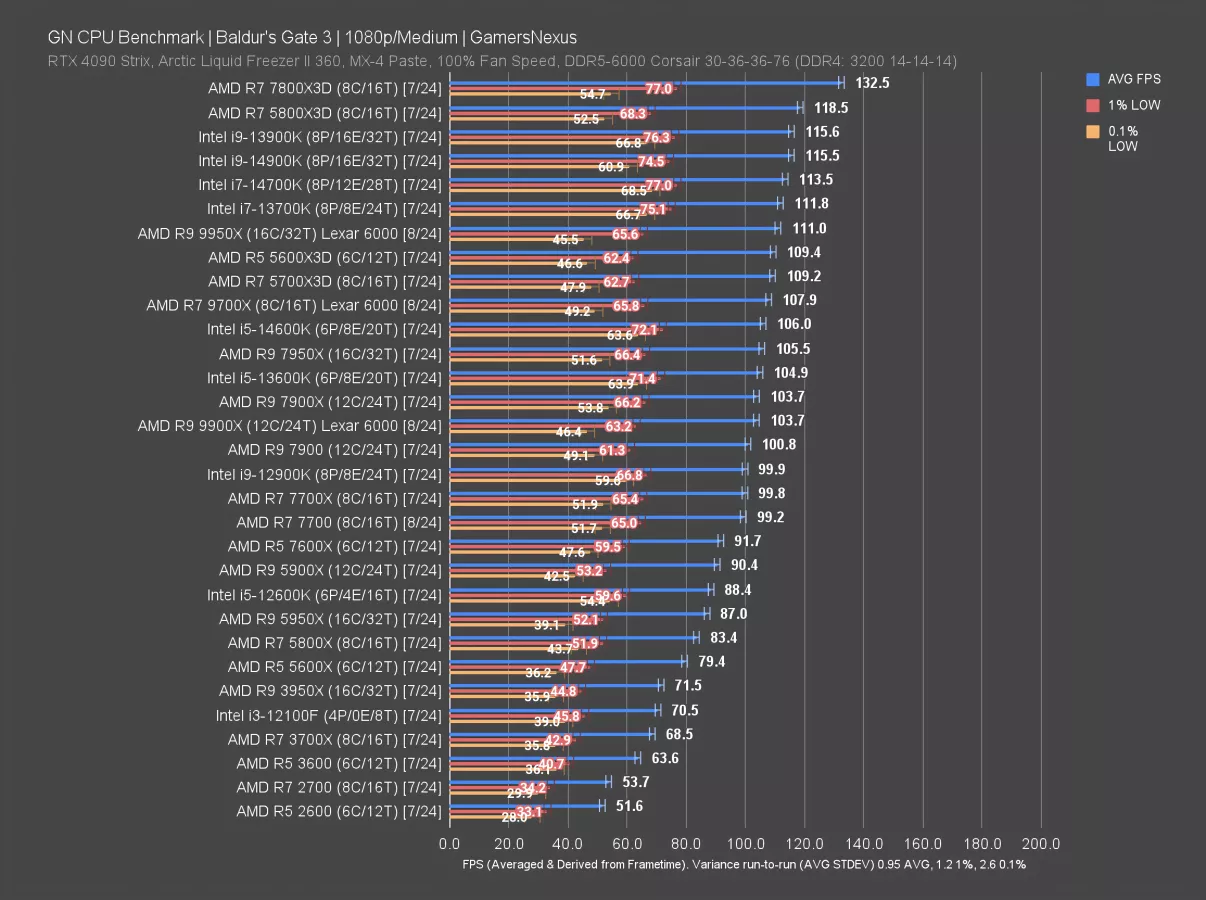
Baldur’s Gate 3 is last for games. Tested at 1080p, we found the 9900X to run at 104 FPS AVG, which is 2.9% ahead of the R9 7900 and exactly equal with the 7900X. There is no improvement in this situation.
AMD R9 9900X Conclusion

We have other games tested, but we’ll stop there since the focus was on production, power, and thermals. We’ve established that its gaming performance is predictable.
For the 7900X vs. 9900X, performance across the board illustrates improvements in the range of 0% to 10%, depending on the use case. Production applications commonly see 3% to 7% uplift, with some at 10%.
Efficiency was explored in our deep-dive a few days ago and it’d be great if you check it out. That video got buried algorithmically when we posted our 9950X review so close to it, so we want to make sure people are aware it exists. You’ll get a deep-dive on this topic there.
Broadly speaking, currently, it makes more sense to buy AMD’s previous generation CPUs. The 14700K is also worth consideration; however, we are still on pause for our recommendations of Intel pending exploratory testing of its new microcode and support processes.
There are a lot of angles to consider for a new product. Some consumers focus on value and performance for that value, and people who fit that camp will find our reviews the most productive. From a value standpoint, we think that Zen 4 currently offers better value at comparable efficiency in many use cases. While we are aware that some heavier number crunching workloads, like AVX-512 work in Linux, may present higher performance, it is not anything that shows up in our suite that we presented earlier with perhaps 1-2 exceptions.
As a consumer-oriented review outlet with a focus on value, our recommendations would currently be Zen 4 alternatives. This includes the 7950X for core-bound workloads, as its price is extremely competitive with Zen 5, and the 7800X3D for gaming-focused builds. The 14700K is competitive in many cases with the 9900X, but again, we are currently undertaking a full test of Intel’s microcode before resuming recommendations.