
We test the Ryzen 7 9850X3D’s gaming performance, power consumption, thermals, and frequency, and compare it to the best gaming CPUs out now
The Highlights
- The 9850X3D has a higher boost clock than the 9800X3D
- 9850X3D is at best 4% faster than the 9800X3D and is sometimes identical to it
- X3D processors can make-up for awful RAM in ways that lower cache CPUs can't
- Original MSRP: $500
- Release Date: January 29, 2026
Table of Contents
- AutoTOC
Intro
AMD’s 9850X3D releases today for $500 and has a higher boost clock than the 9800X3D. The short version of the results is that the 9850X3D is at best 4% faster than the 9800X3D and is sometimes identical to it. The 9850X3D is 15-24% better than the 7800X3D (read our review), depending on the situation.
Editor's note: This was originally published on January 28, 2026 as a video. This content has been adapted to written format for this article and is unchanged from the original publication.
Credits
Test Lead, Host, Writing
Steve Burke
Testing
Patrick Lathan
Mike Gaglione
Camera
Vitalii Makhnovets
Video Editing
Tim Phetdara
Writing, Web Editing
Jimmy Thang
Price will matter more than performance, as they’re basically indistinguishable in performance (even if there is a measurable difference).
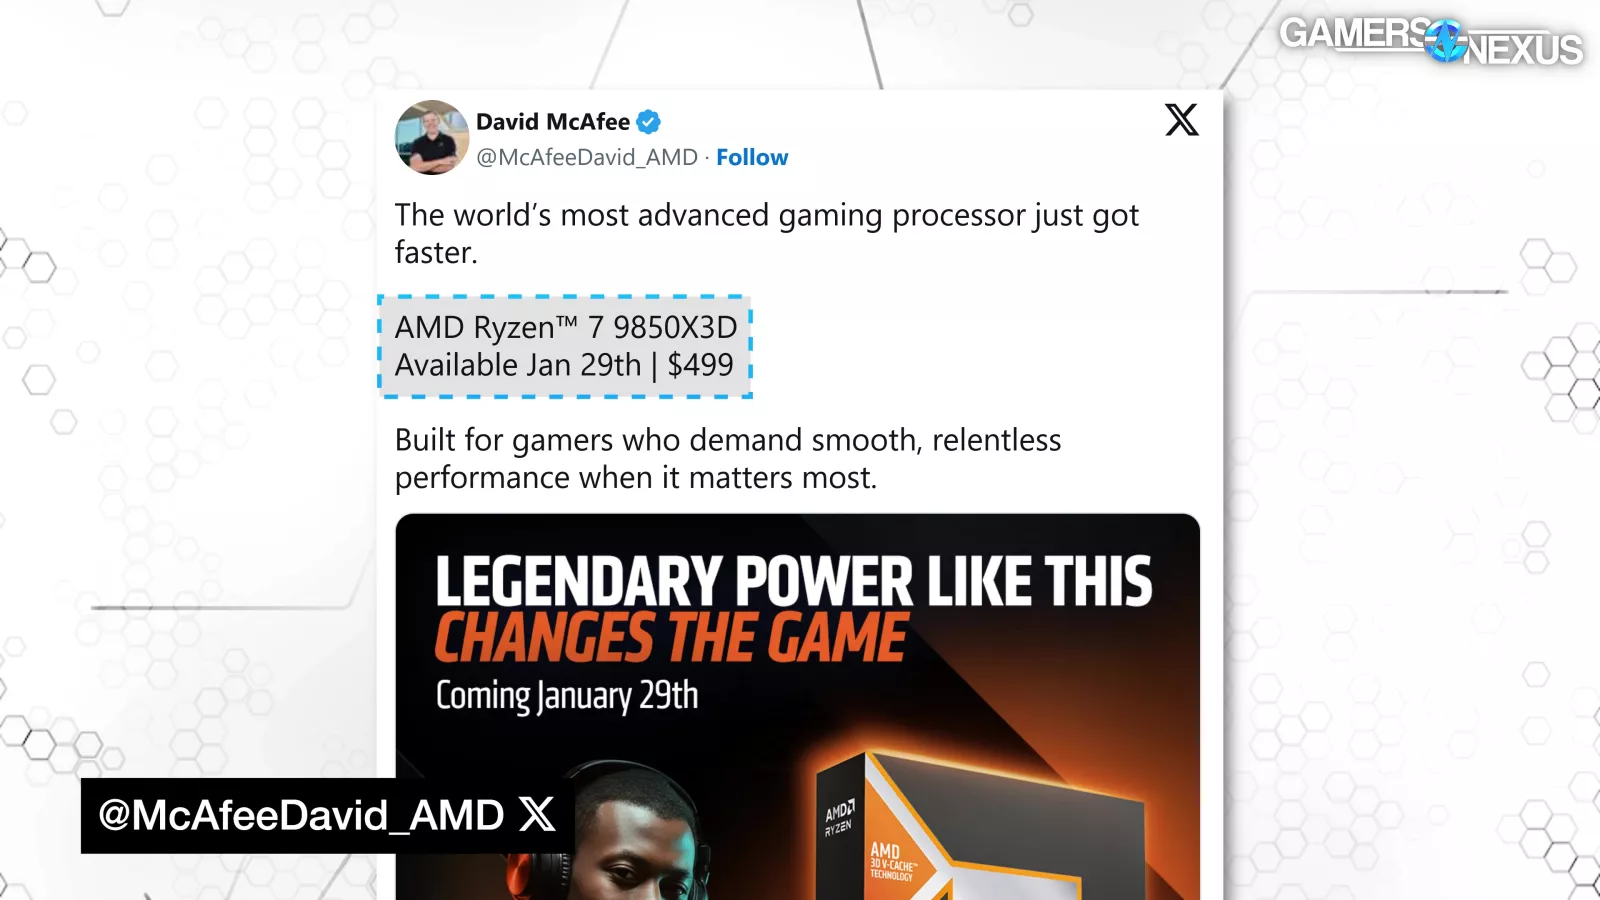
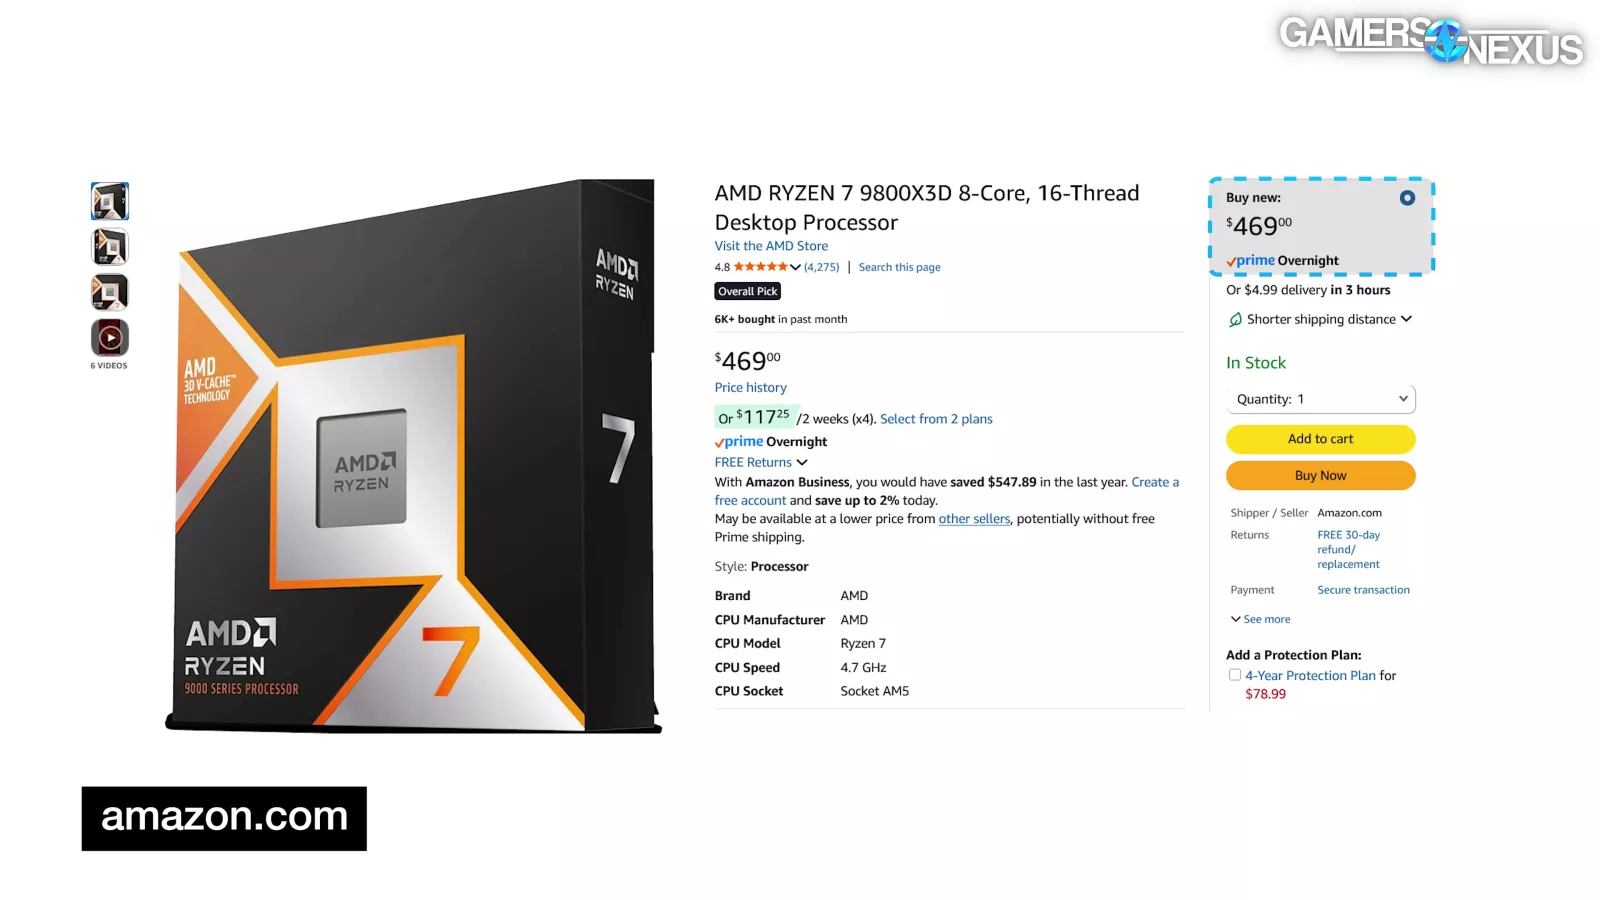
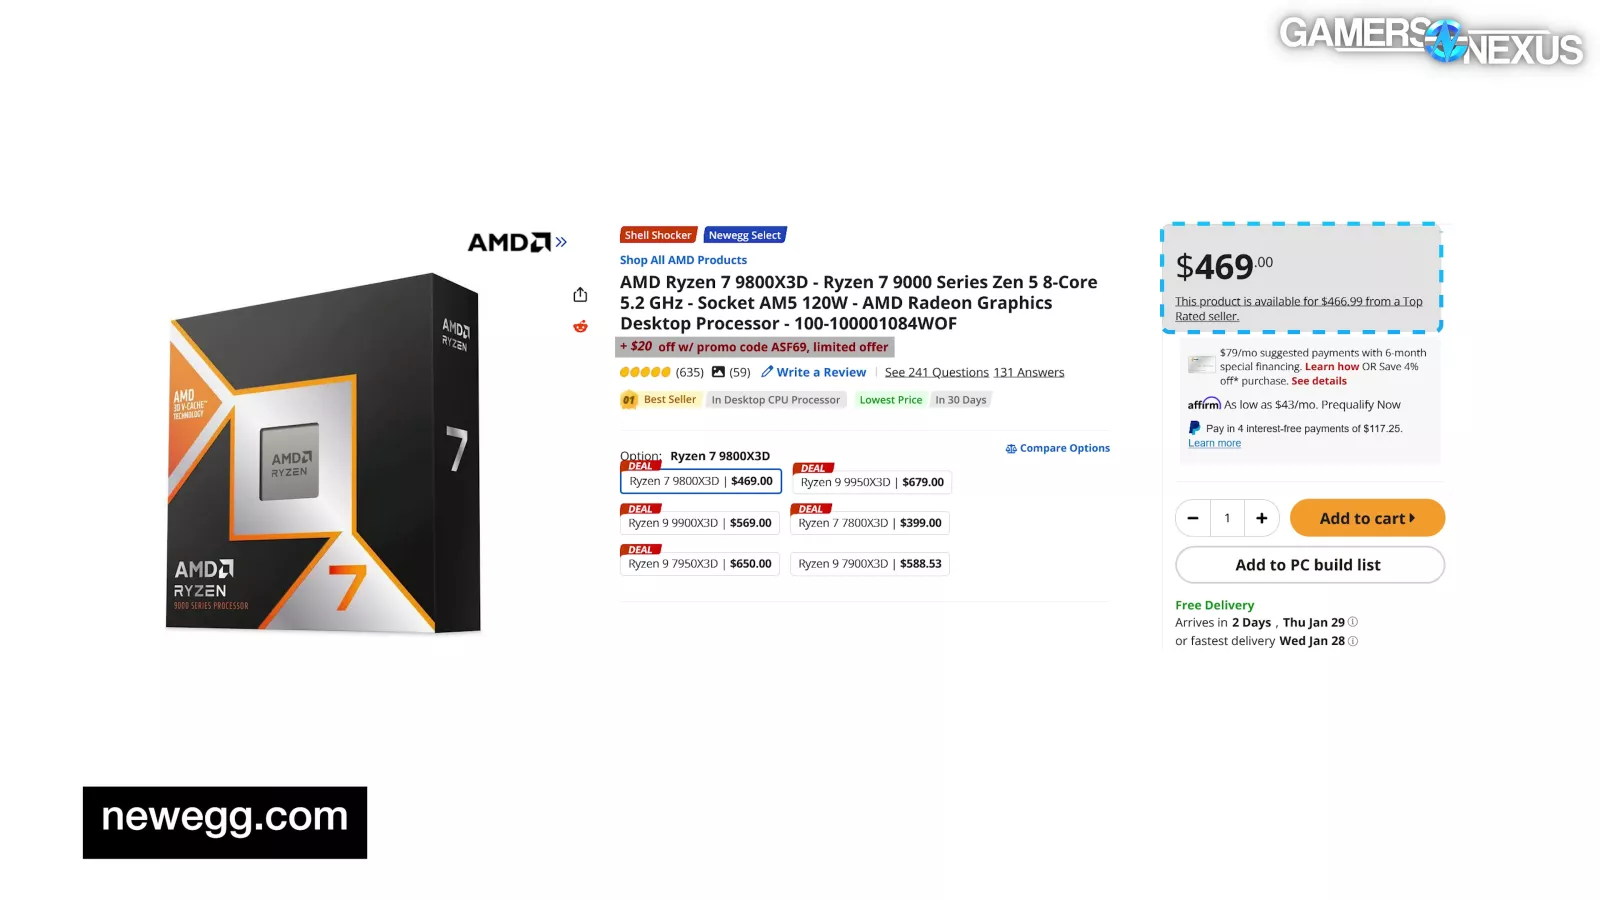

The $500 MSRP puts it $30 over the 9800X3D on Amazon and $100 over the price of the similarly performing 7800X3D. On Newegg, the 9800X3D is $450 after a coupon code, so the 9850X3D is $50 higher. The 7800X3D is $375 after an instant discount.
With differences this small and with the elevated price, the 9850X3D is basically an XT refresh from AMD.
The XT refreshes have never done well on Gamers Nexus. Previously, we called the 3800XT a waste of sand.
The 9850X3D is more similar to an XT refresh than a new CPU. We’ll talk about that more in the conclusion.
One of our more interesting tests today involves using the shittiest possible RAM we could find in our office, which is the Crucial DDR5-4800 kit we got when DDR5 first launched. This thing is basically a collector’s item now, given Crucial’s abandonment of the consumer market. It’ll probably be seen as a collector’s item or something.
But until then, we used this in addition to our usual DDR5-6000 kit for testing. Extra CPU cache can make-up a lot for poor performing memory, so X3D CPUs specifically can get away with far worse memory specs than non-X3D CPUs.
Partly for fun, and partly as a dire reflection of our current reality of memory prices, we tested the CPU with both kits.
For now, let’s get into the full review.
Overview & Specs
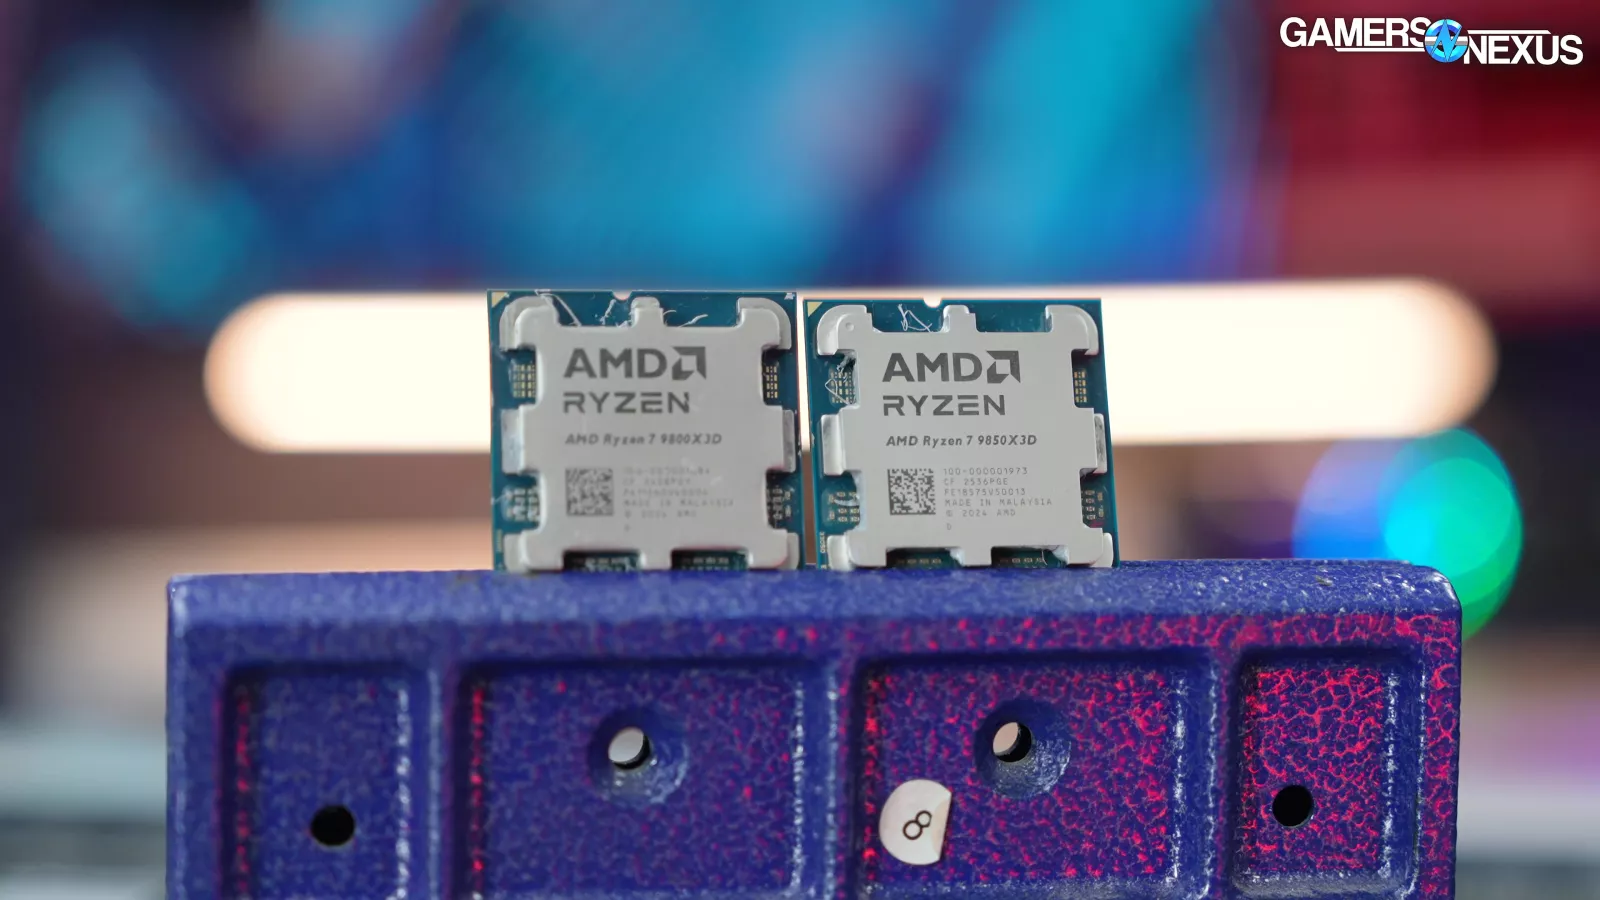
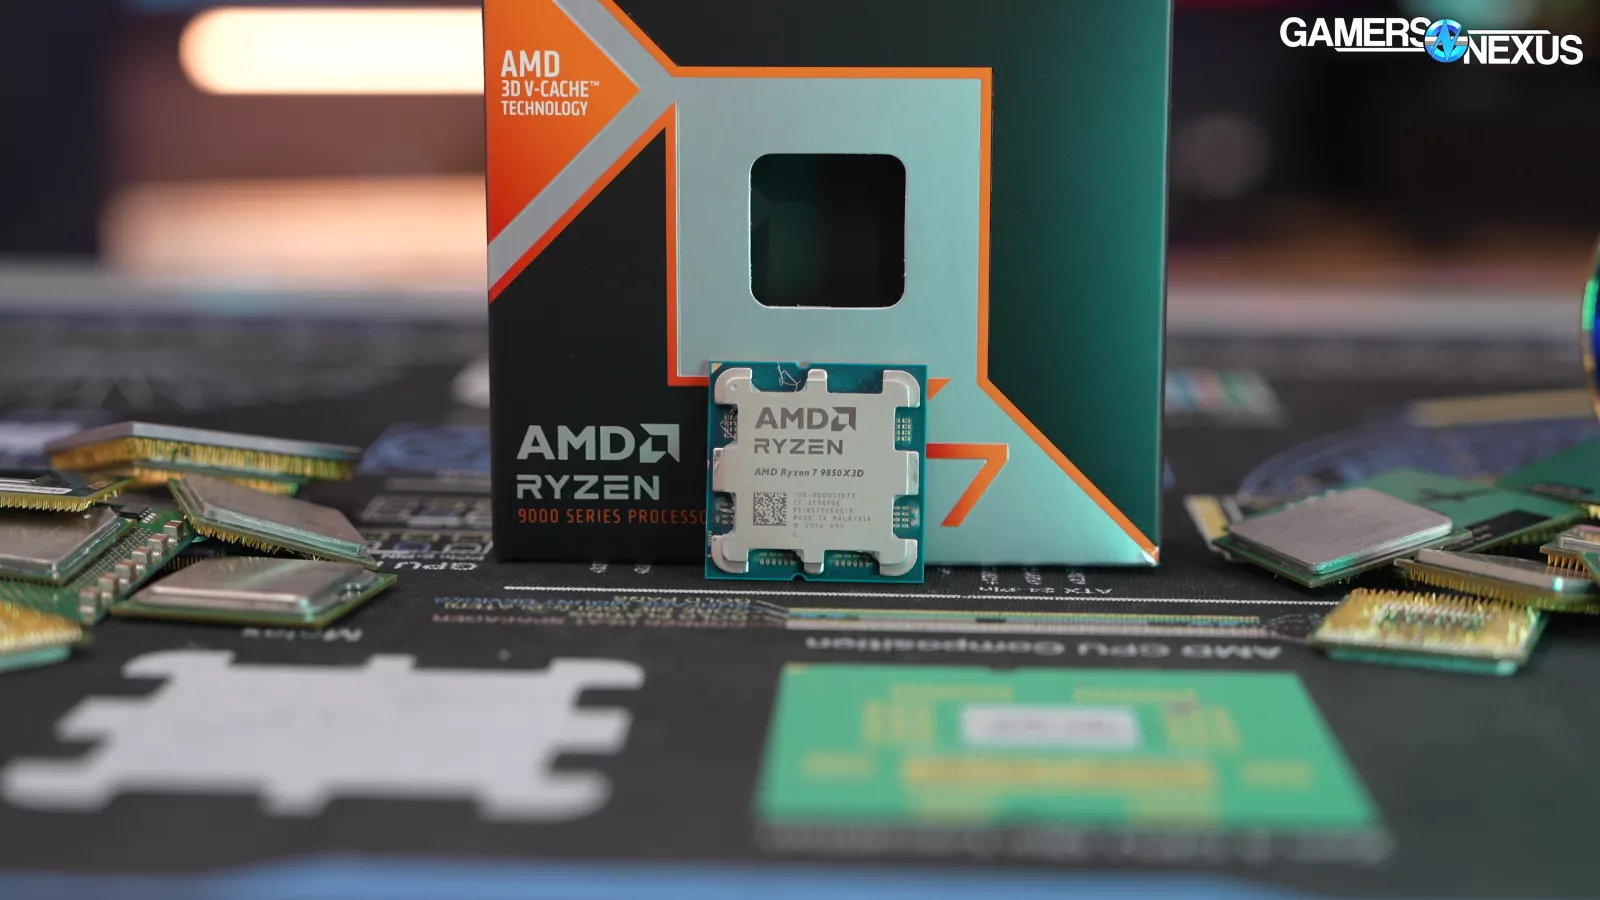
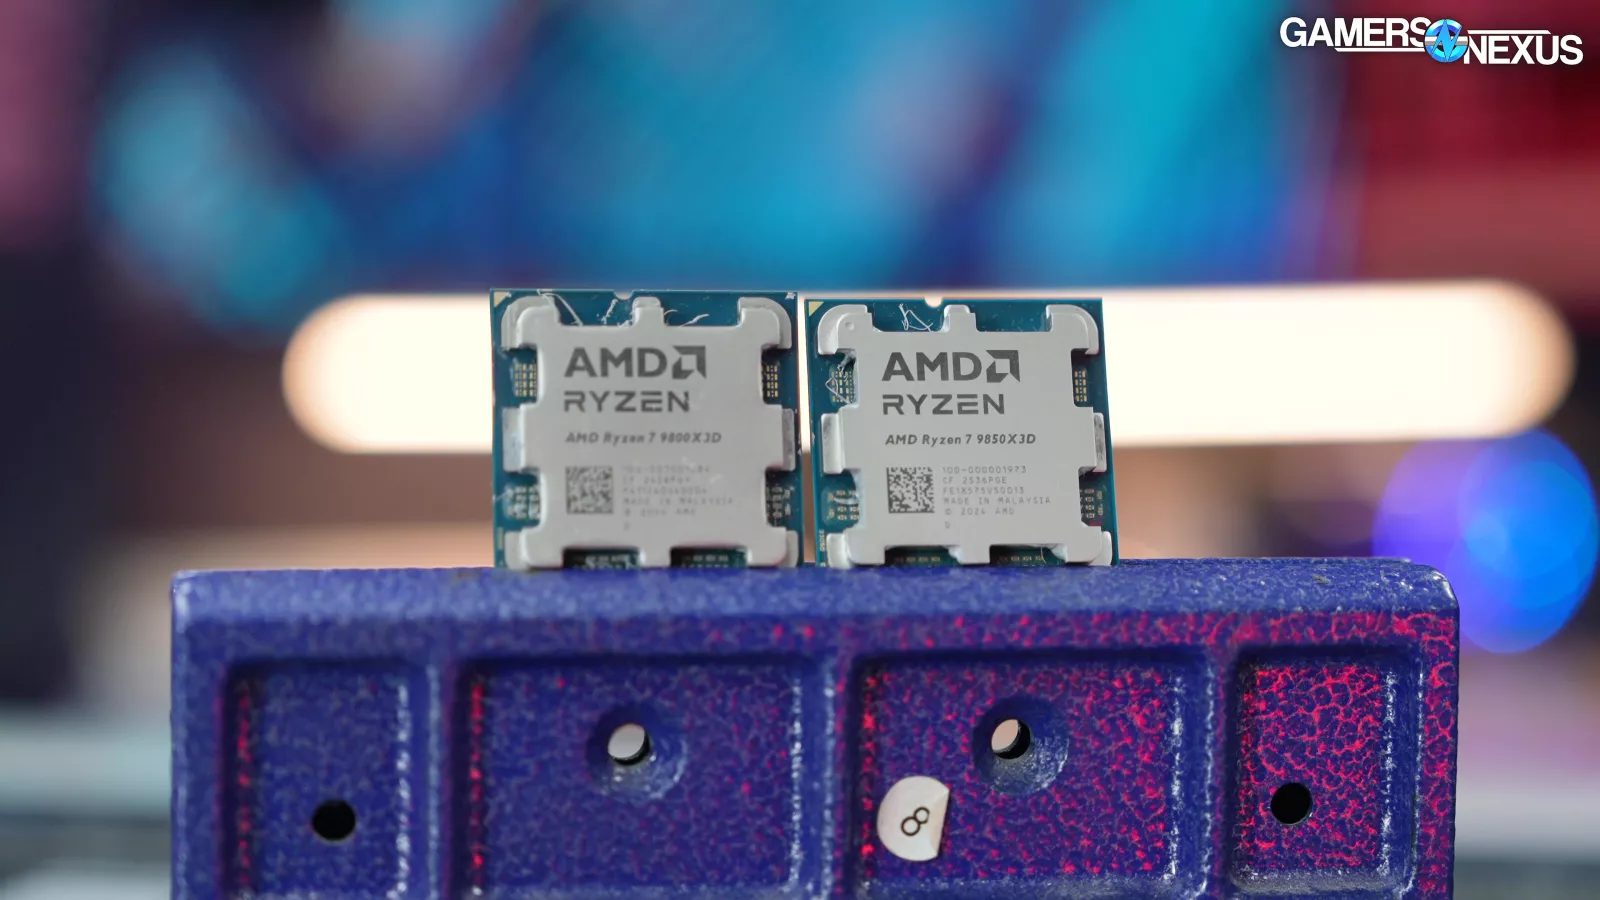
The specs are really simple on these two parts.
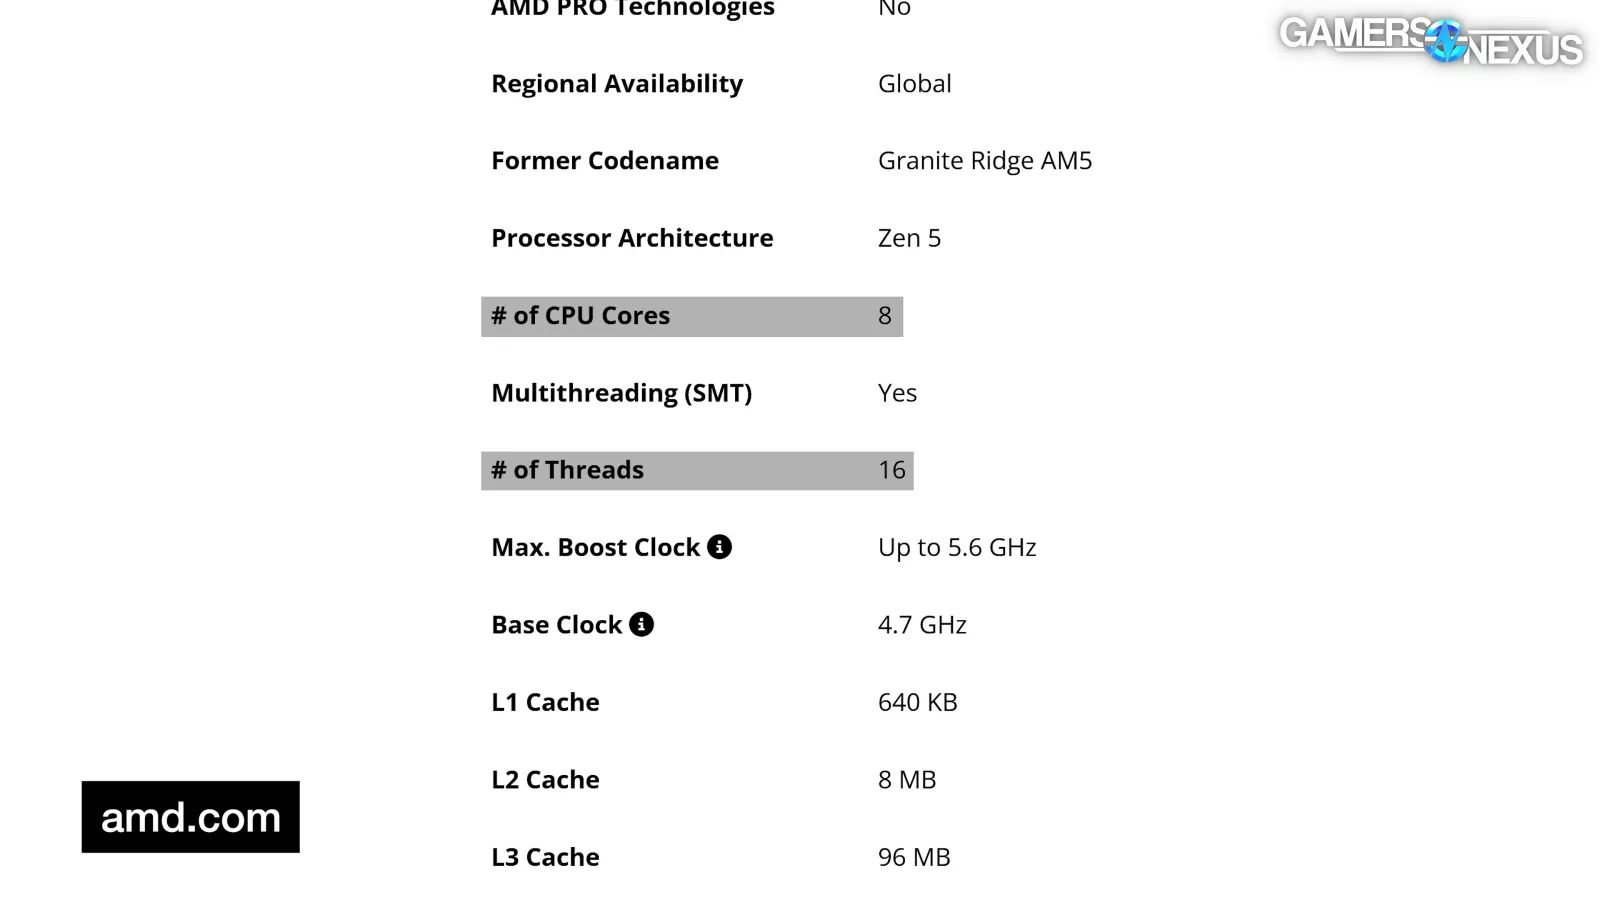
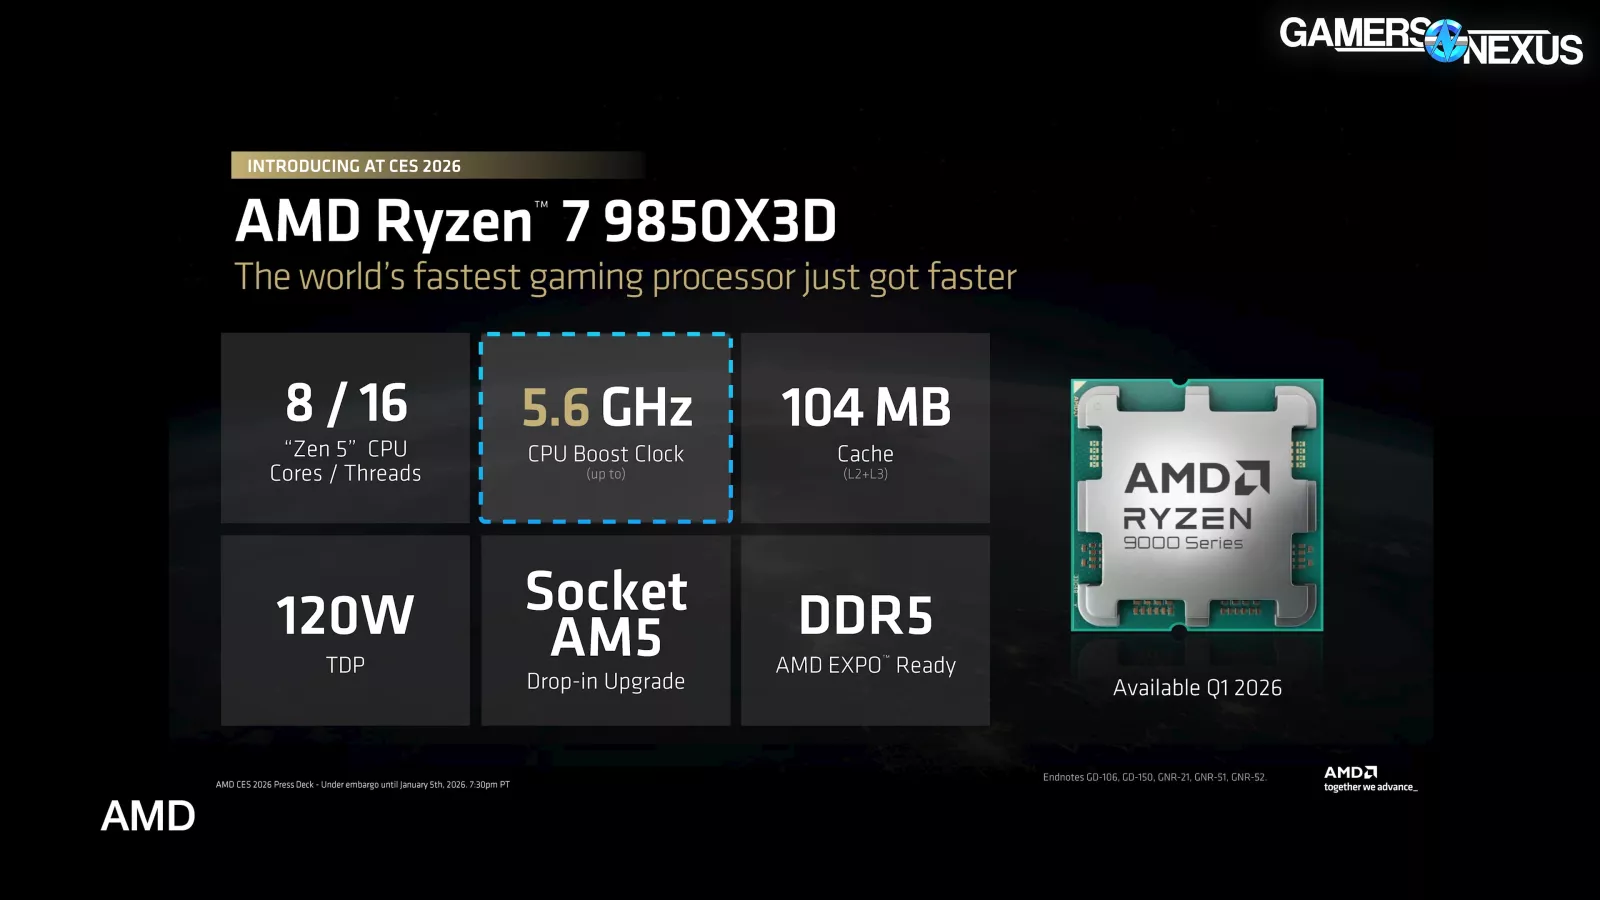
AMD’s 9850X3D is an 8C/16T CPU with a maximum advertised boost of 5.6 GHz, a base clock of 4.7 GHz, and L3 cache of 96 MB. Its labeled TDP is 120W, but this doesn’t necessarily reflect true power draw.
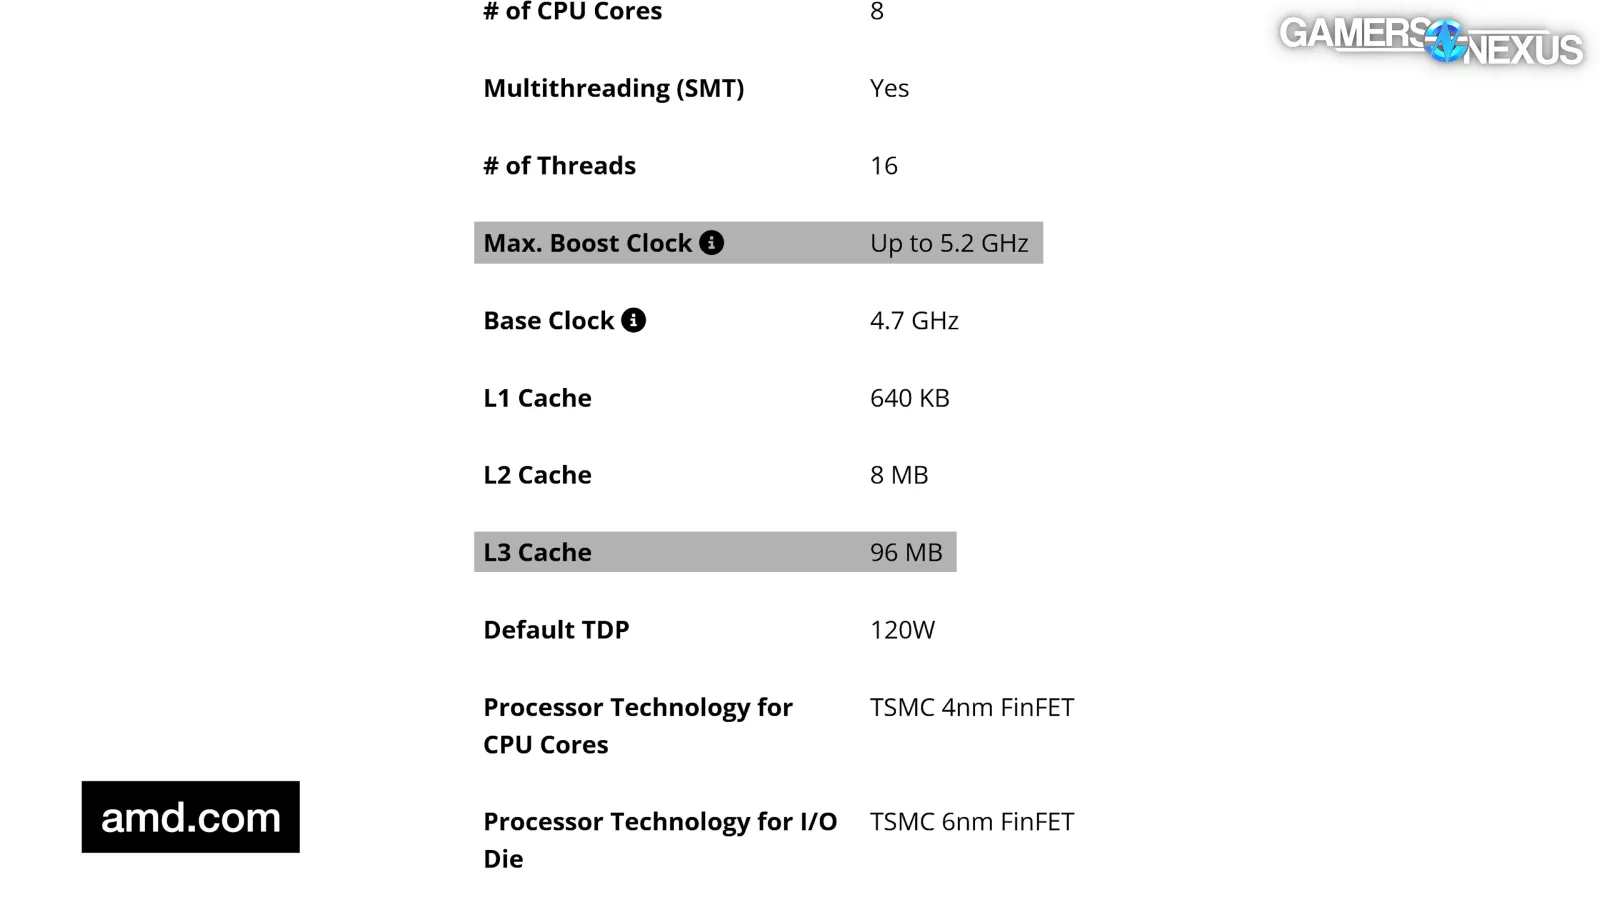
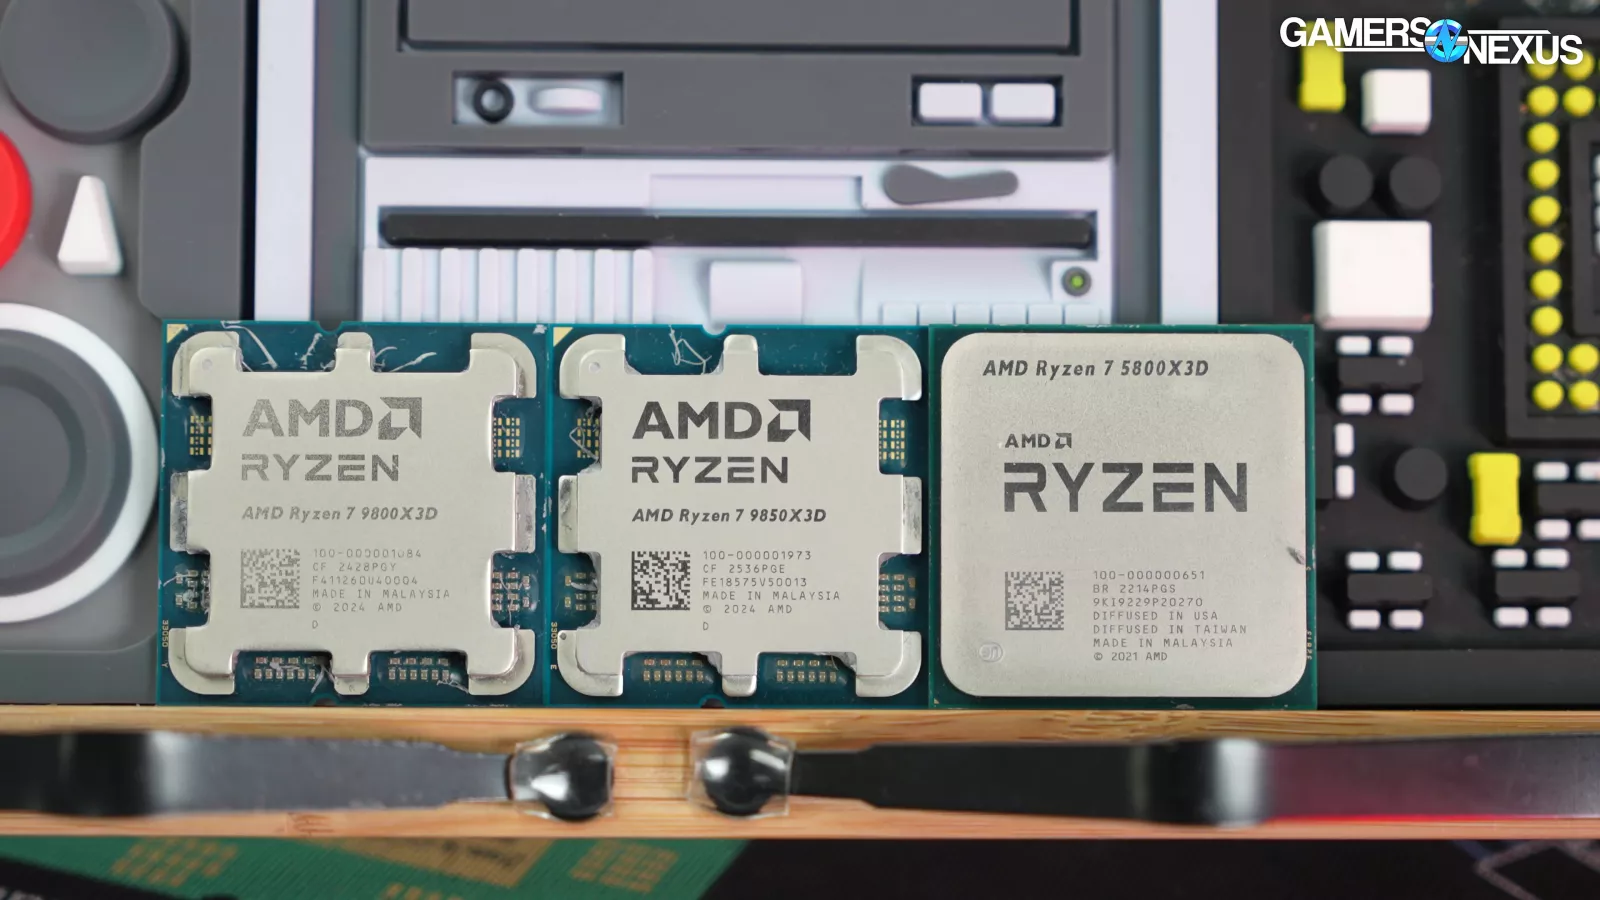
The 9800X3D (read our review) is mostly the same: It’s a Zen 5, 8C/16T part with a 4.7 GHz base and 96 MB of L3 Cache, but its maximum advertised boost clock is 5.2 GHz rather than the 5.6 GHz advertised on the 9850X3D.
Feasibly, with a good 9800X3D, you could overclock up toward that frequency. We’ve found 5.4 GHz relatively easy to hit on our good 9800X3D parts. The TDP is still listed as 120W for both of these CPUs.
As we talked about at the release of the 9800X3D, this uses the flipped arrangement of the cache and core dies, which helps resolve some of the thermal challenges AMD previously faced with X3D parts. We ran some extensive thermal benchmarking in our original 9800X3D review that covers this, if you’d like to learn more about that aspect.
Today, we’re focusing mostly on the 9800X3D vs. 9850X3D comparisons, so if you missed the original deep-dive of the 9800X3D, you can find that in either our video review or in our article adaptation.
We have some new games we’ve added to our test suite this time.
In addition to the usual suspects, we’ve added Kingdom Come: Deliverance II for CPU testing, which has proven a good workload for benchmarks, and we’ve also added The Outer Worlds 2 to benchmarking. Both of these join our other CPU benchmark games.
Frequency Validation - All-Core
First, we’ll start with frequency validation to make sure we understand the CPU’s performance characteristics under different levels of load. This will also allow us to check that AMD is hitting its promised spec.
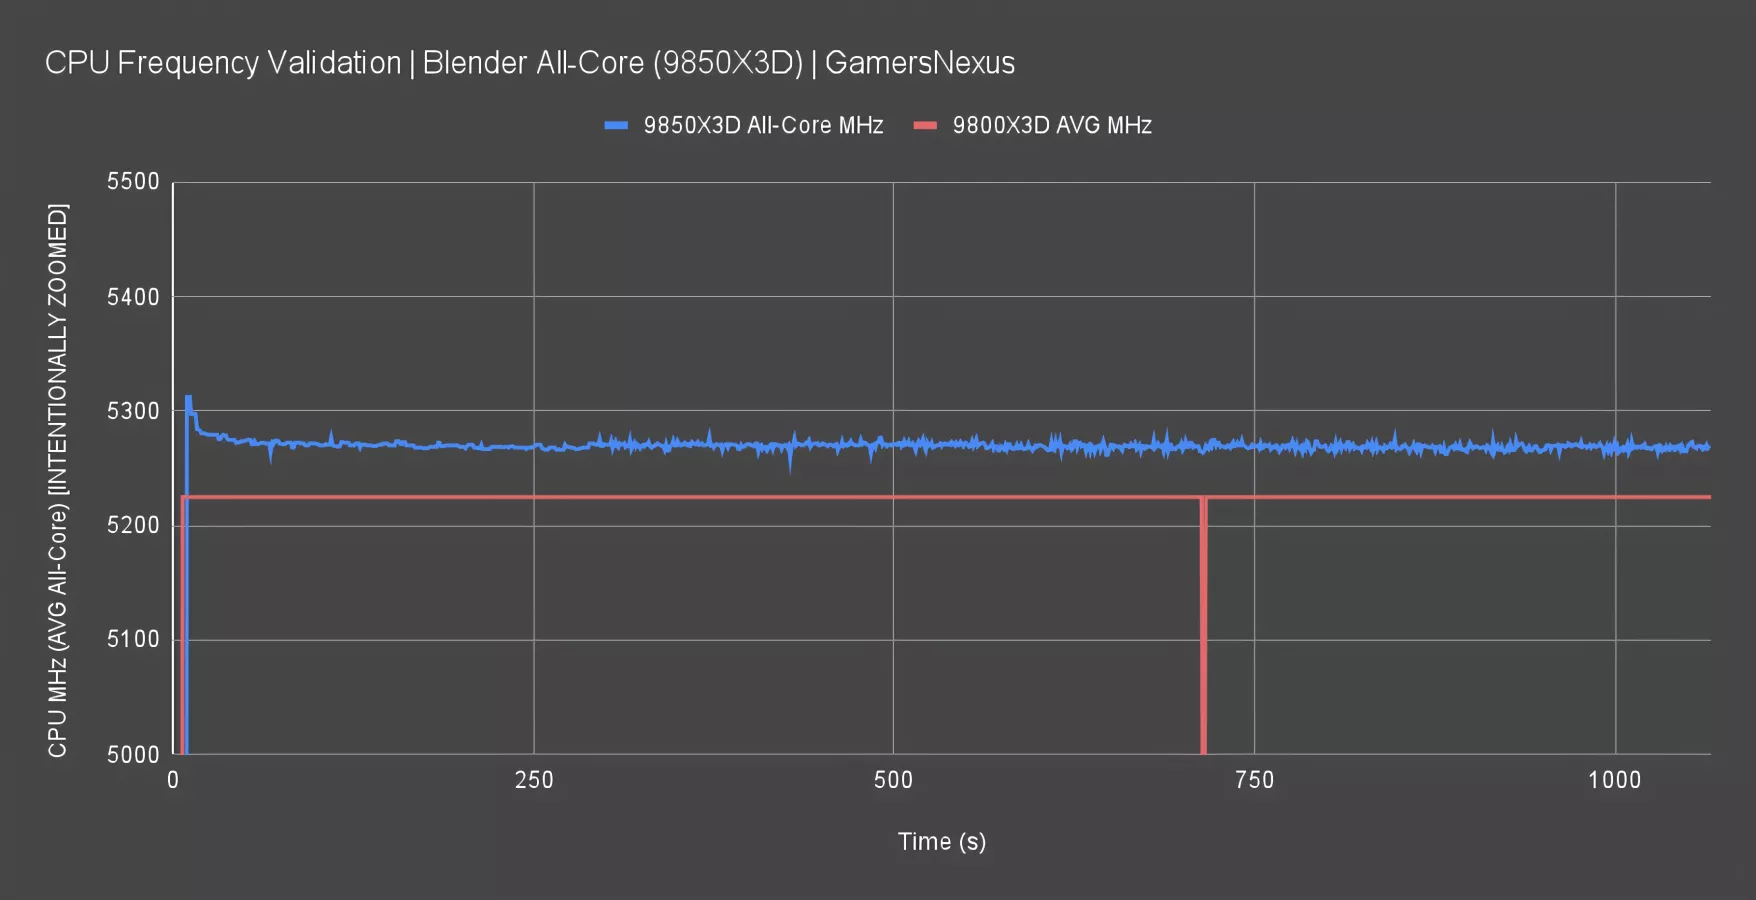
This chart is for the all-core frequency when averaged during Blender, rendering on all cores concurrently. We’ve intentionally zoomed-in the Y-axis of the chart to make it easier to see the spikes in the 9850X3D. The side effect of this, of course, is that it also makes it look like they’re larger than they are, but it allows us to see it better.
The 9850X3D begins its load just above 5300 MHz, then settles to an all-core average of around 5270 MHz. The spikey behavior indicates bouncing off of limits, in this case, those would be power-based limiters.
The 9800X3D ran at 5225 MHz dead for the entirety of the pass. The blip in the middle is from software and unrelated. That has the 9850X3D as about 20-50 MHz higher at any given time for all-core averages.
This means that scenarios which are more heavily core-bound will see almost no uplift.
Frequency Validation - Single-Thread
Single-thread load is next.
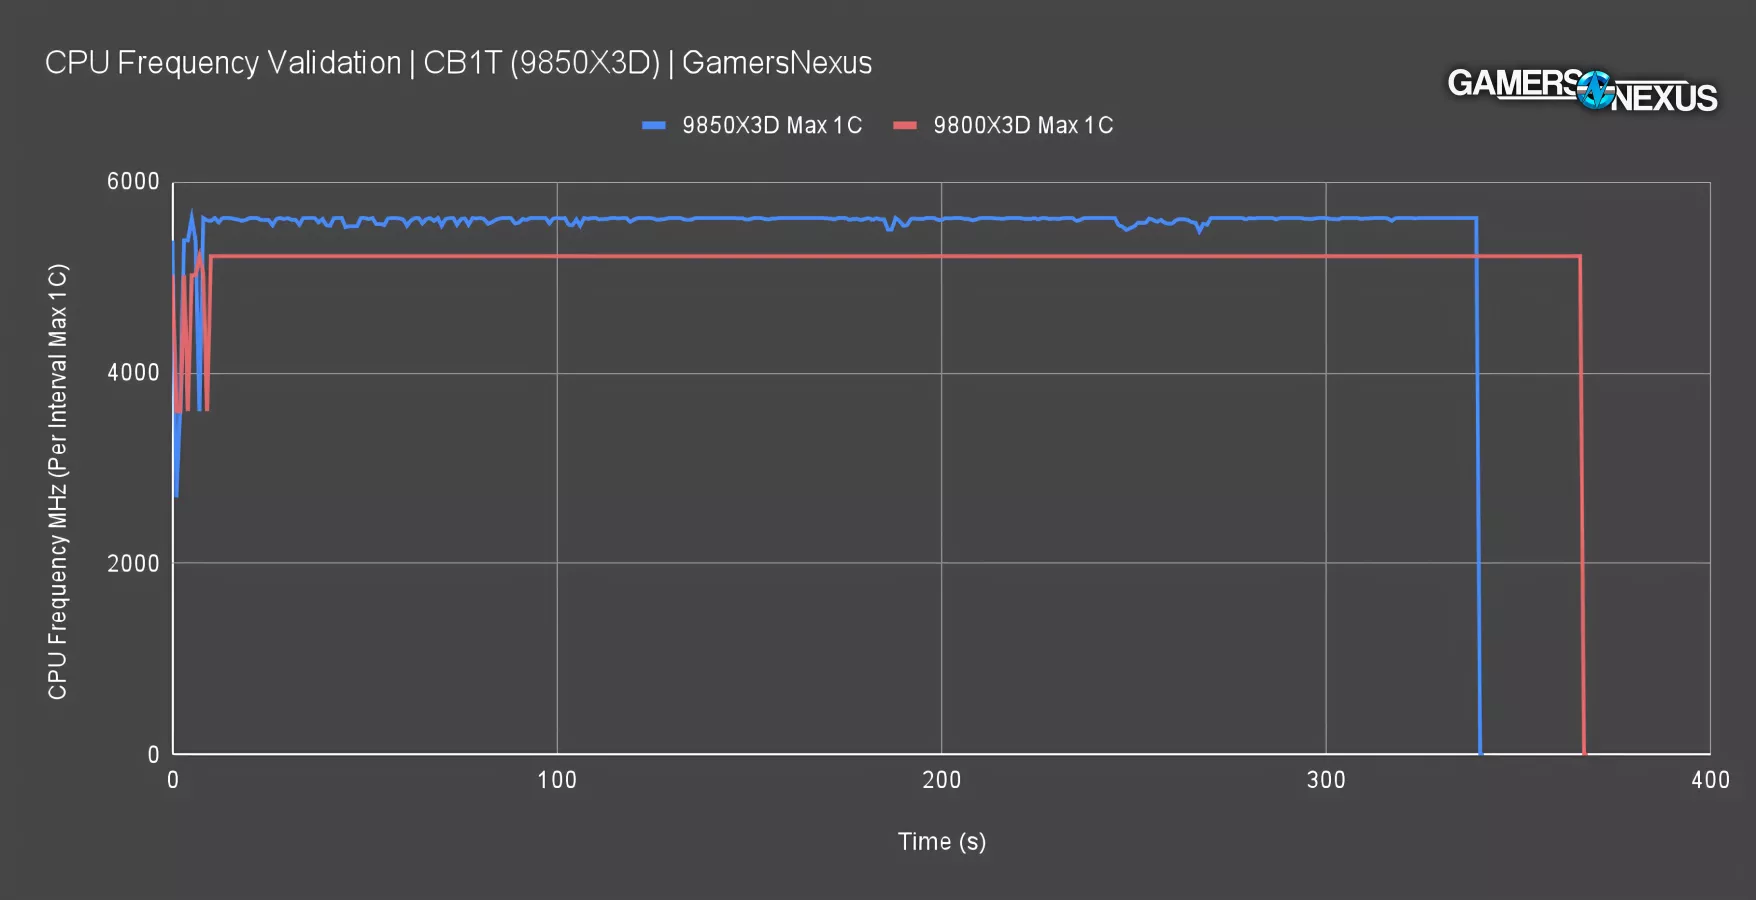
This shows the max single-core boost at any given interval during testing.
The 9850X3D regularly hit 5615-5625 MHz, which is above its advertised 5600 MHz maximum boost. In our tests, AMD is continuing to slightly exceed its advertised clocks -- a big and positive improvement from a few years ago when they were under them.
The 9800X3D has a maximum single-core boost of 5225 MHz sustained in this test, the same as its average all-core boost.
For this reason, the 9850X3D should mostly improve in workloads that don’t fully utilize all cores. Games that are more frequency-dependent will reflect the uplift more, whereas games that fully load all cores will mostly show identical performance between the two parts.
Ultimately, based on these frequency numbers, we don’t expect much change throughout testing.
Voltage Change - Blender
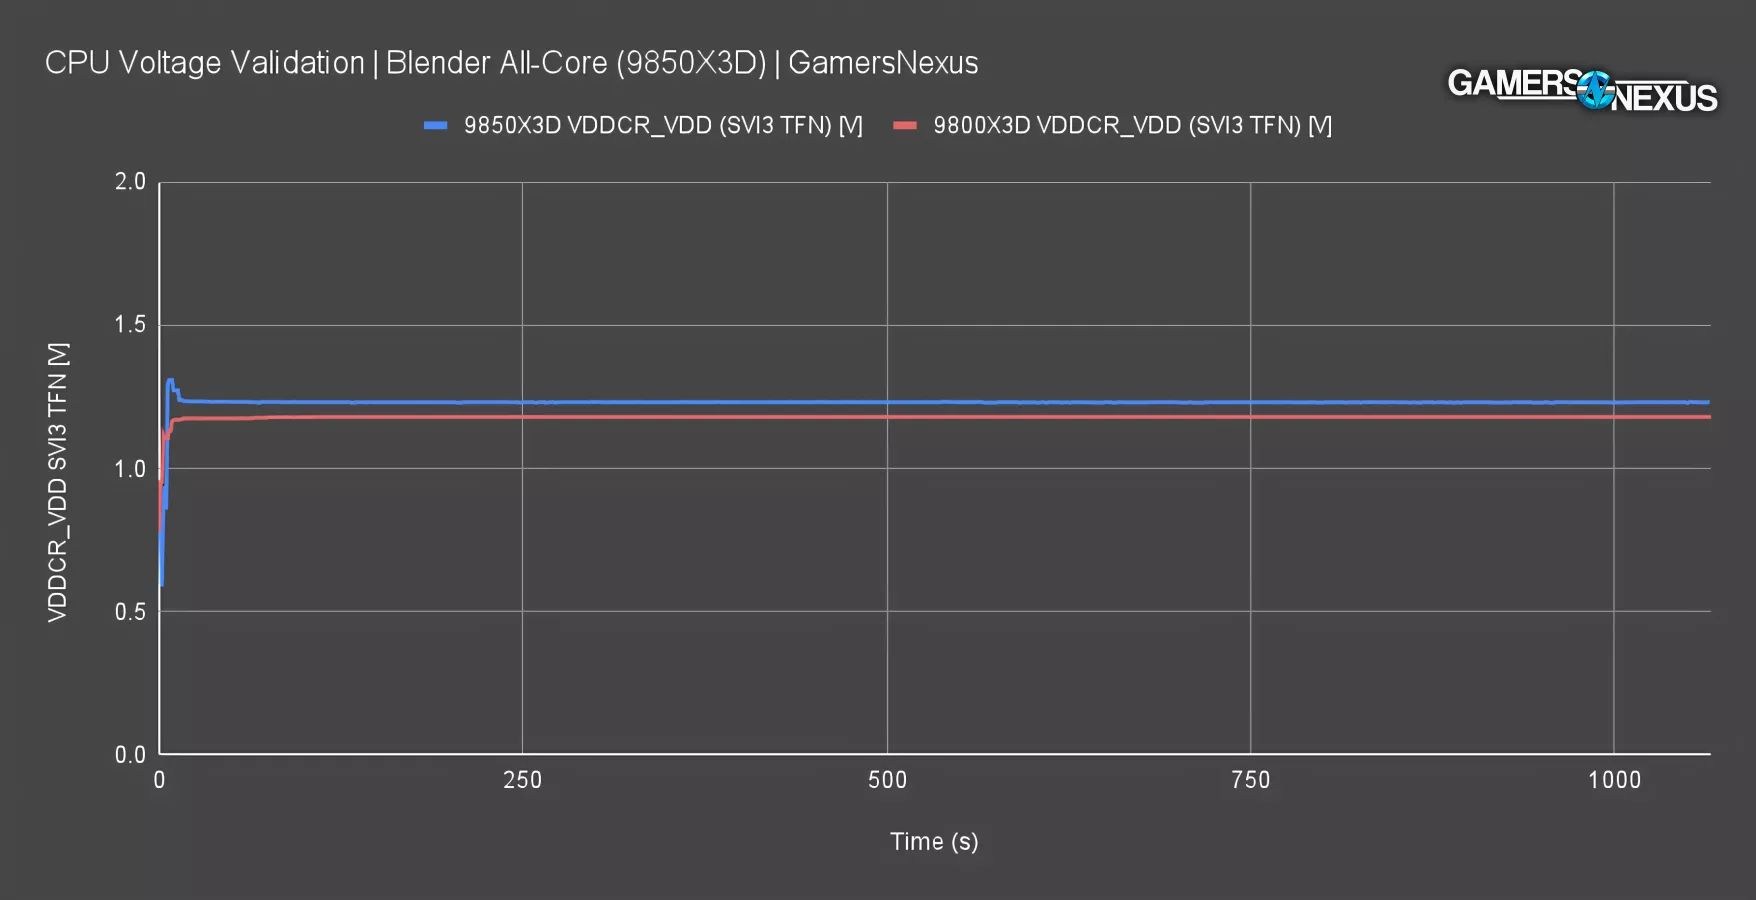
Looking back at our Blender all-core workload, this chart compares the SVI3 TFN VDDCR results for the 9850X3D and 9800X3D.
The 9850X3D ran at an elevated 1.231 V, as compared to the 9800X3D’s 1.18V for the same all-core workload. Not shown here, but measured and plotted separately, VID is showing about the same behavior.
Voltage Change - CB 1T
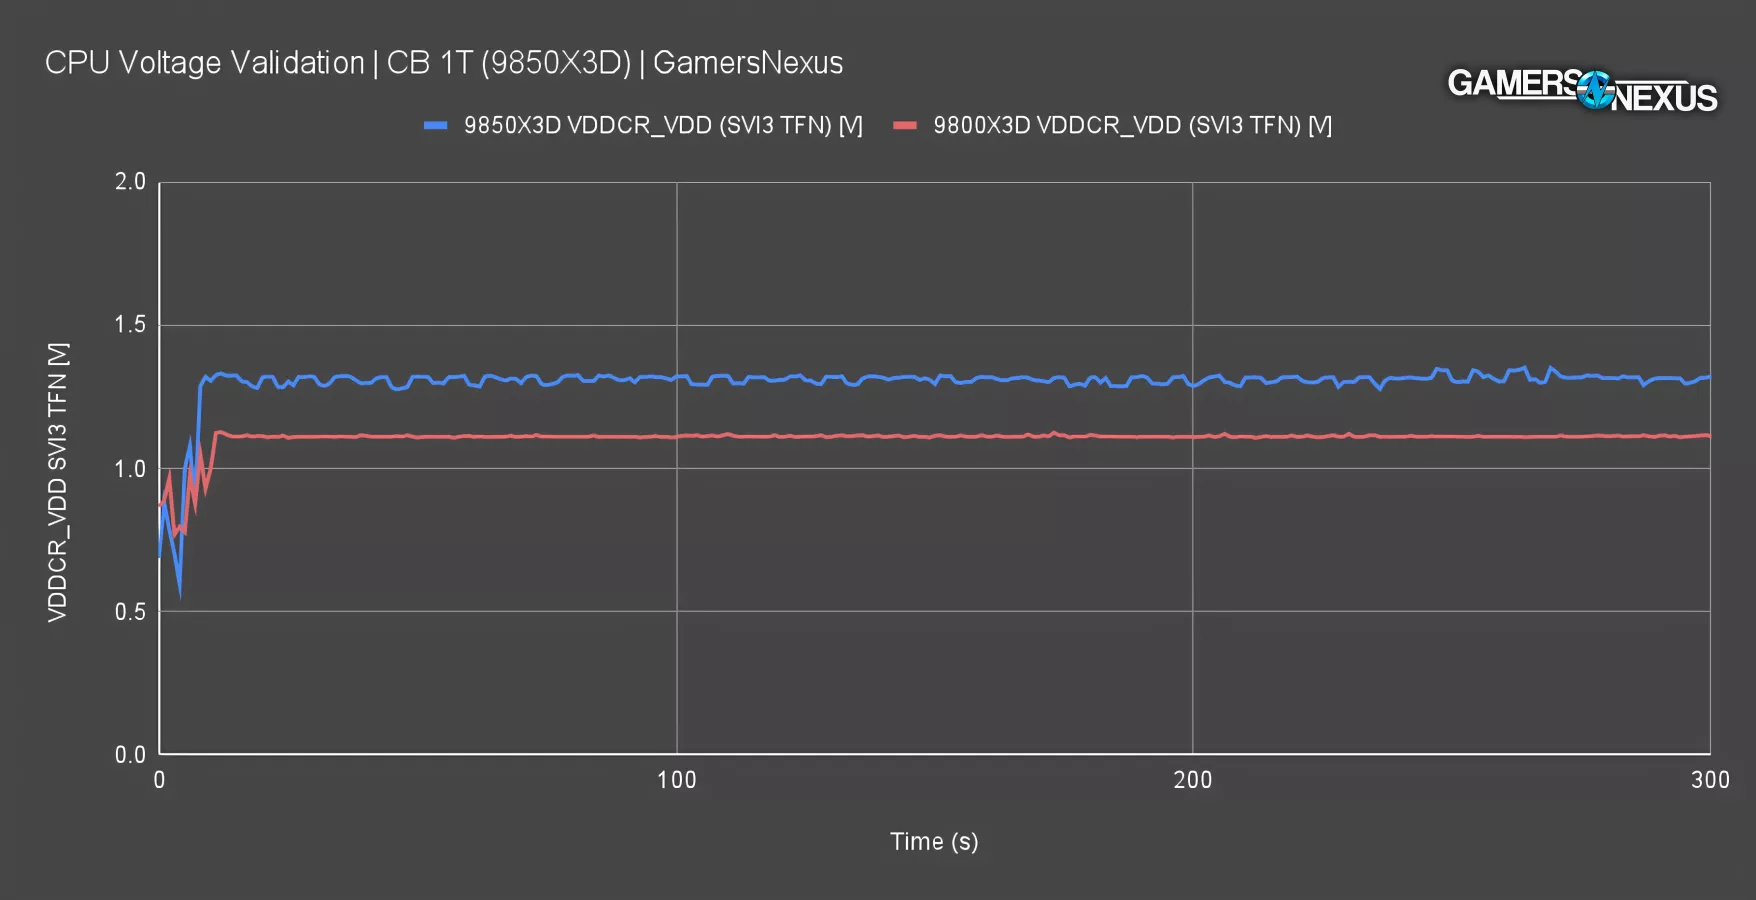
Here’s the SVI3 TFN VDDCR chart for Cinebench single-threaded. In this workload, the 9850X3D’s SVI3 TFN VDDCR result was 1.31-1.32 V, with the 9800X3D at about 1.11V for the same work.
The 9850X3D is running higher voltage. Some of this could be silicon fitness, which is just luck-of-the-draw, but some of it is definitely from pushing higher clocks.
Thermal Benchmark
We don’t typically compare CPUs in thermal benchmarks since that’s getting more into CPU cooler review territory, which we do separately; however, it makes sense here. These are two otherwise identical parts.
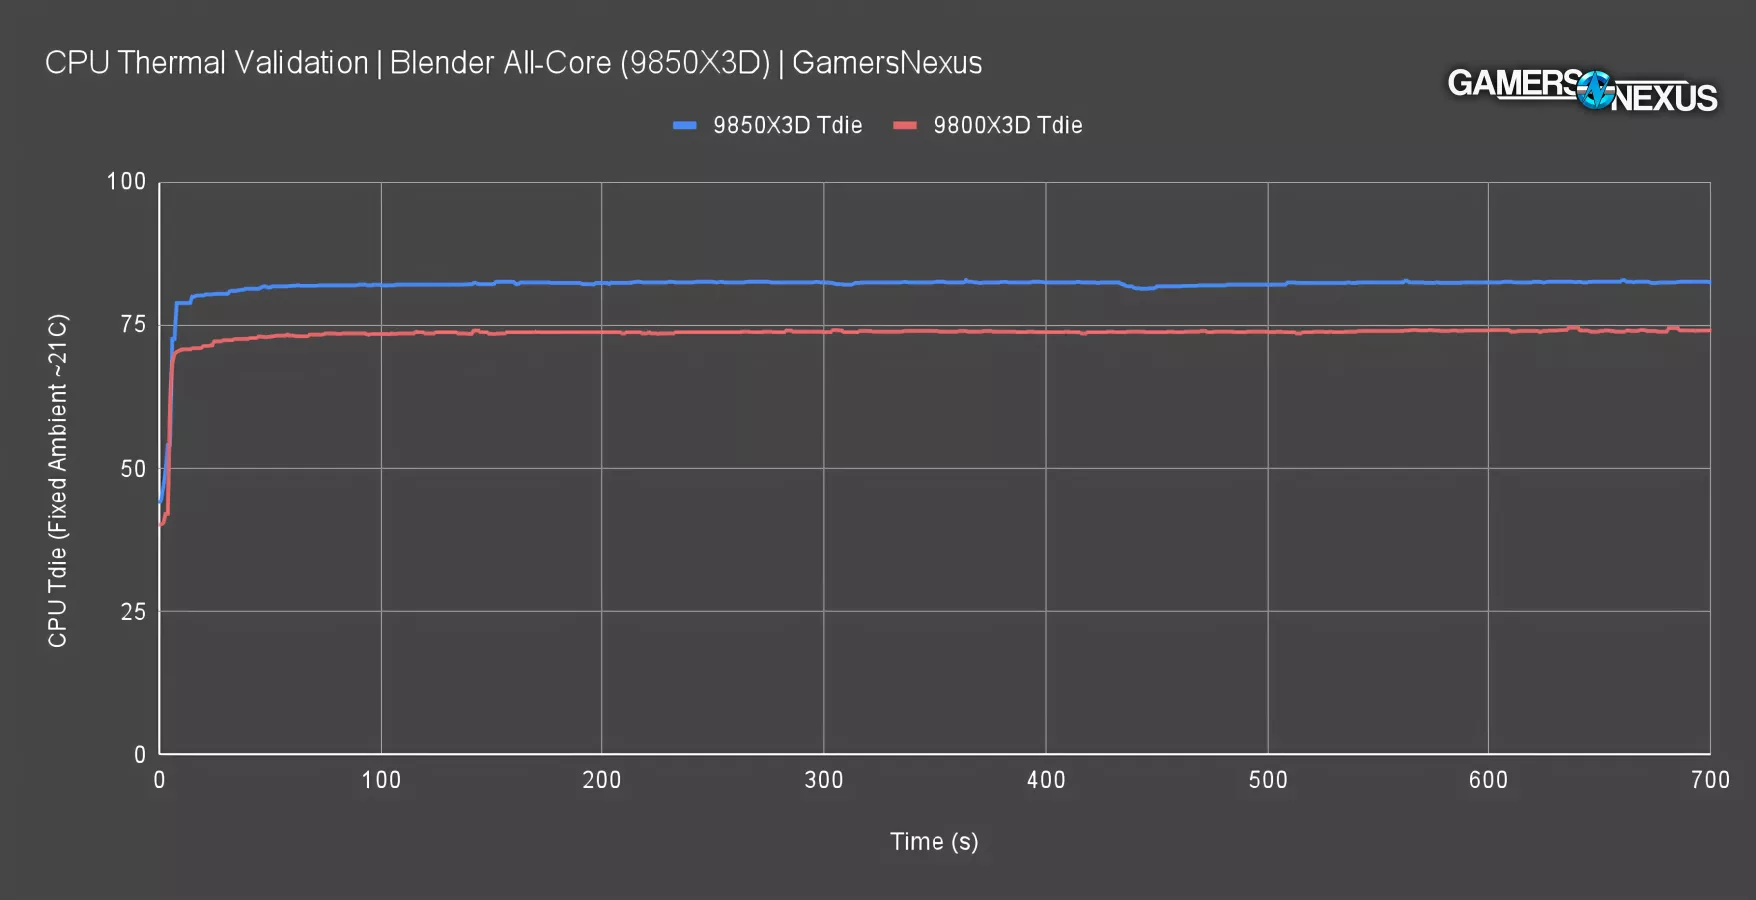
The 9850X3D ran our all-core workload at a steady-state all-core Tdie average of about 83 degrees. In a controlled ambient of the same temperature, the 9800X3D held 74-75 degrees Celsius for the same workload. The 9850X3D is running about 7-9 degrees warmer under the same conditions. Both CPUs were tested using the 360mm Arctic Liquid Freezer II ARGB.
If buying the 9850X3D rather than the 9800X3D, you may want to factor-in a slightly more expensive or higher-end cooler if you had been considering a borderline solution. This also raises the total cost of the build, of course.
Power Benchmarks
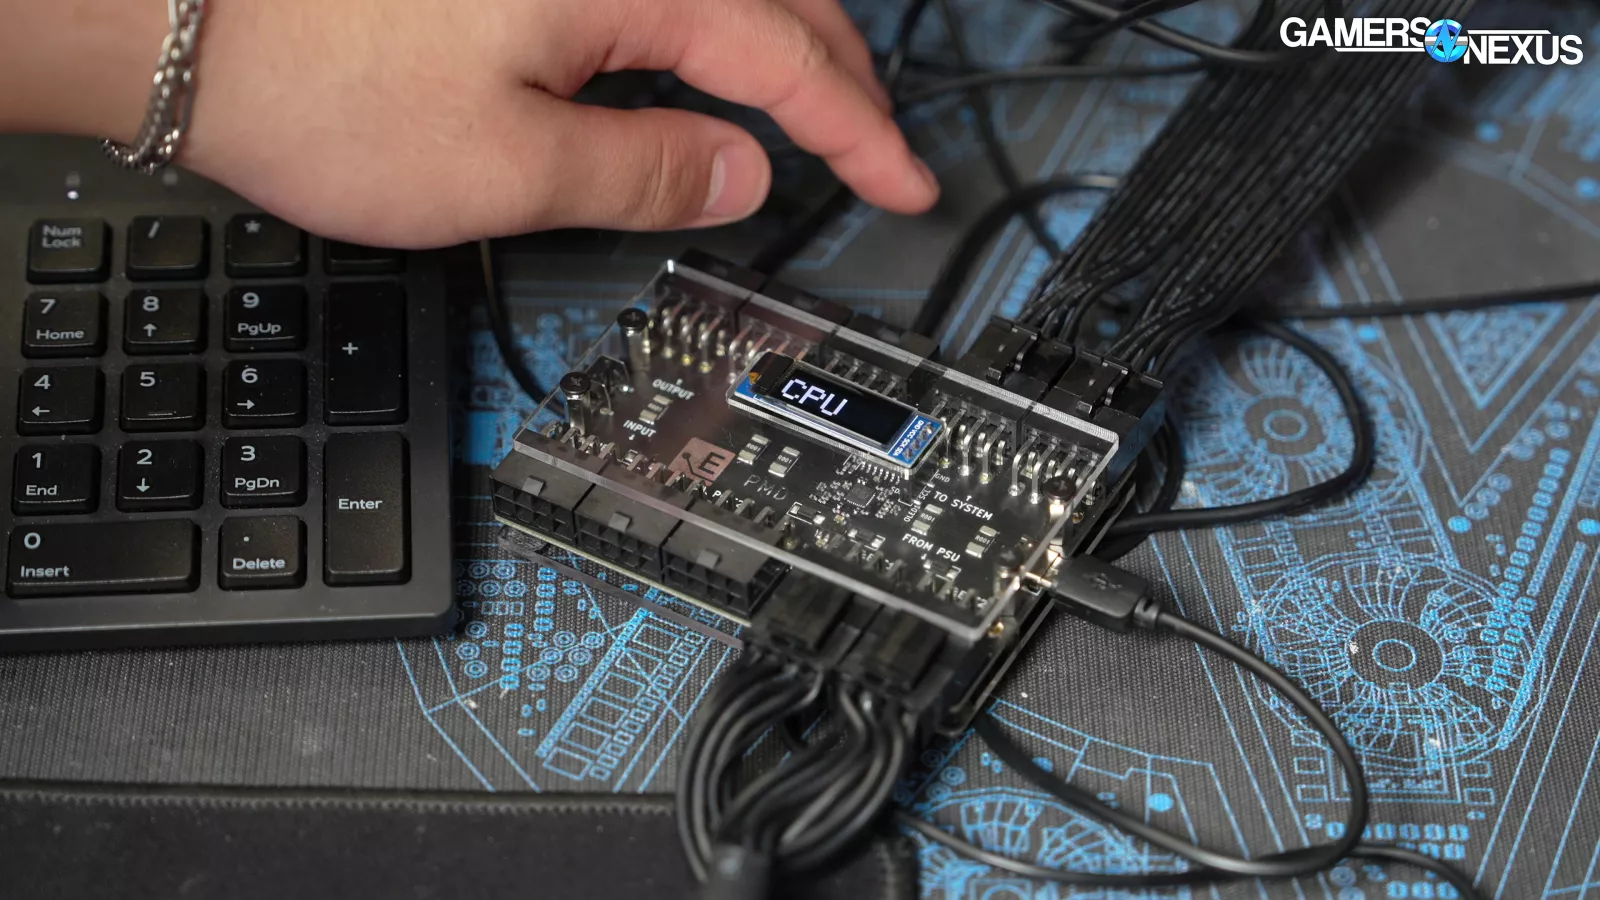
We set up the PMD for a quick power comparison in like-for-like conditions as well while running an all-core load on both CPUs. We’d expect the power to be higher given the temperature results.
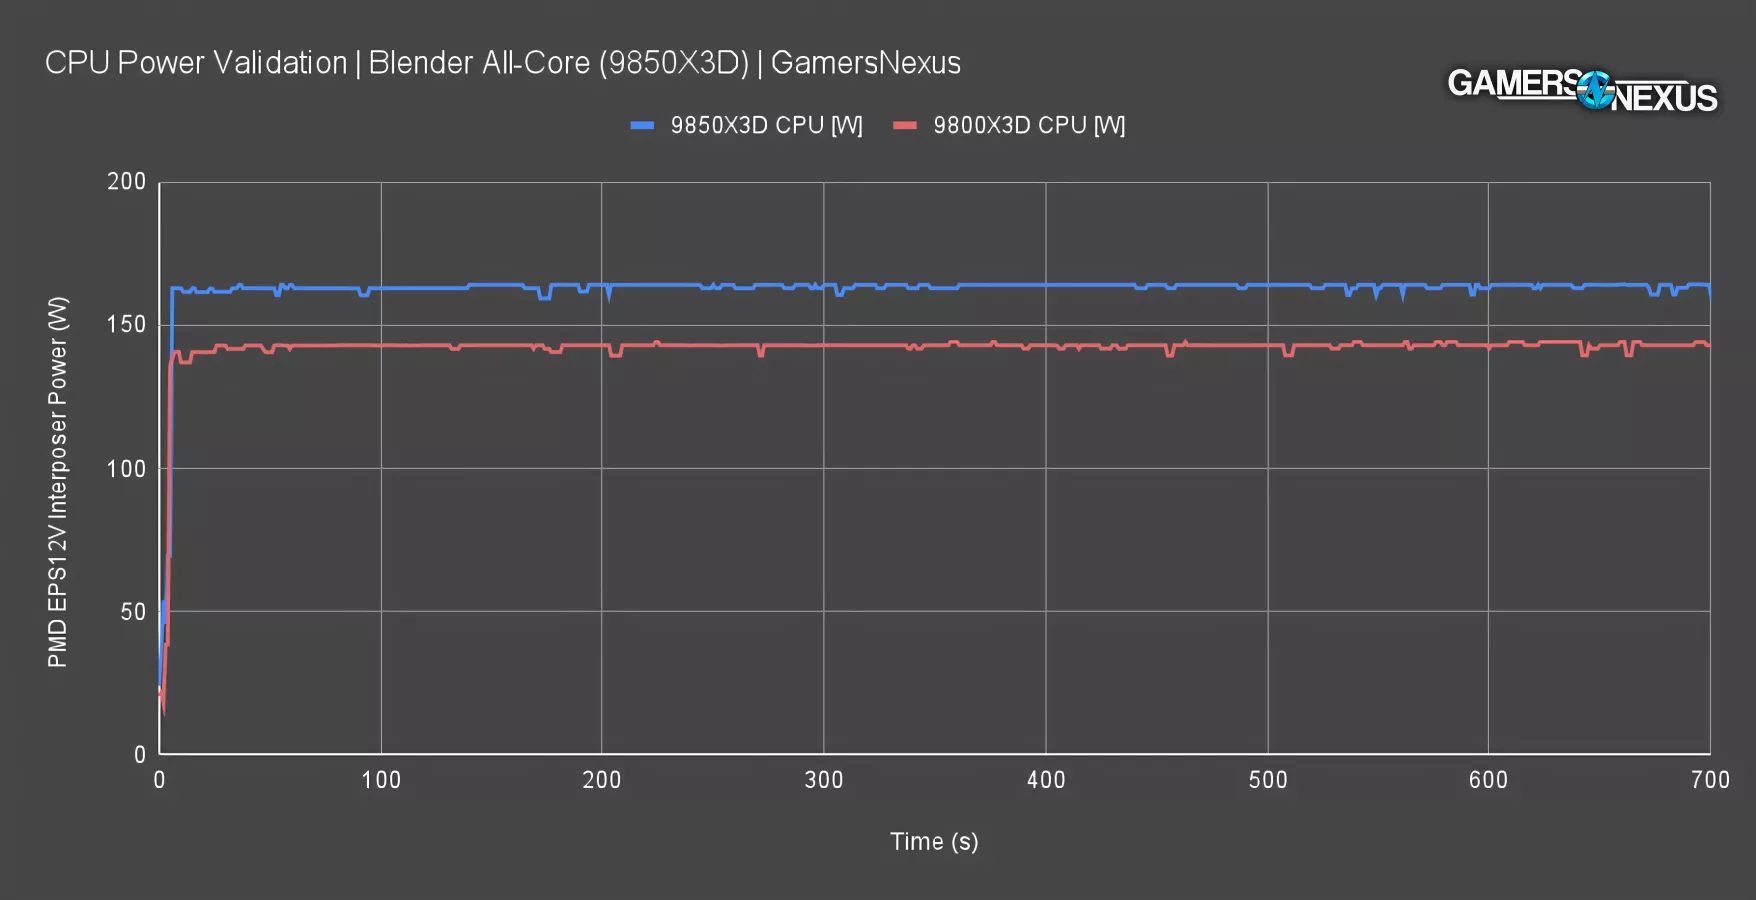
With the PMD interposer between the PSU and the board, so measuring before VRM efficiency losses, the 9850X3D pulled 164W down the EPS12V cables. This is why we always remind people that TDP is not the same as real power. The 9800X3D pulled 143W. We’re at about a 20W increase on the 9850X3D as a result of its boosted voltage to maintain the higher frequency.
This in combination with the price and the Tdie increase contribute to some of the less obvious downsides of the higher-clocked 9850X3D part.
Game Benchmarks

Baldur’s Gate 3 - 1080p
Baldur’s Gate 3 is up now.
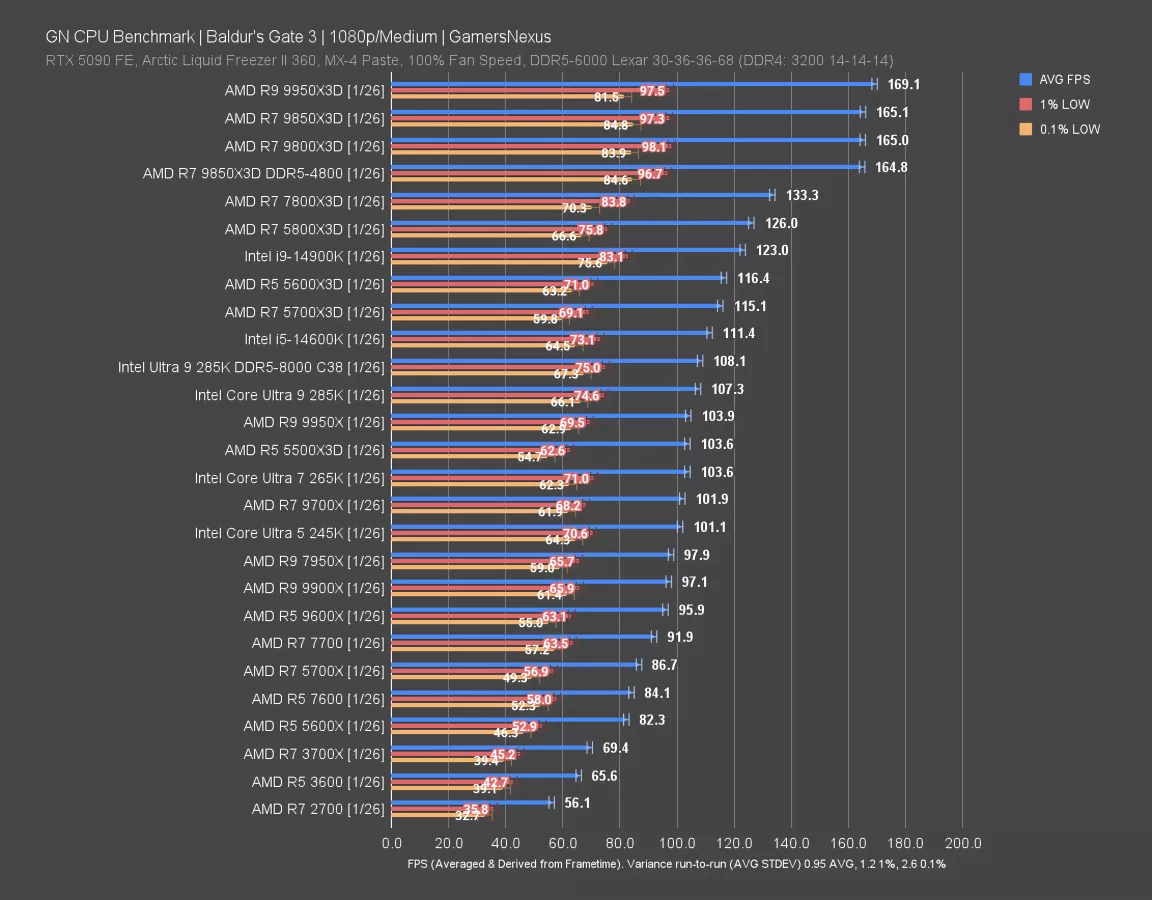
The 9850X3D performs about the same as the 9800X3D in this title, with only the 9950X3D (read our review) outpacing both of them. Both 98-class X3D CPUs are at about 165 FPS AVG. Also of note is the DDR5-4800 result on some of the worst memory we own, which still ties the 9800X3D. The extra cache in this game is making-up for the huge deficit in memory performance. The fall-off would be much worse on a non-X3D CPU from either AMD or Intel.
The performance conclusion for the 9850X3D is the same as it was for the 9800X3D in this game, seeing as they’re the same results. 1% and 0.1% lows are also the same.
The 9850X3D and 9800X3D both are about 24% ahead of the 7800X3D’s 133 FPS AVG and about 31% ahead of the older 5800X3D (read our review). Intel’s prior generation 14900K (read our review) is the closest Intel CPU to the X3D parts, trailing the 5800X3D and just barely leading the 5700X3D and 5600X3D. The 285K (read our review)with DDR5-8000 C38 memory has about the same performance as the 285K with our DDR5-6000 kit and tighter timings.
Outer Worlds 2 - 1080p
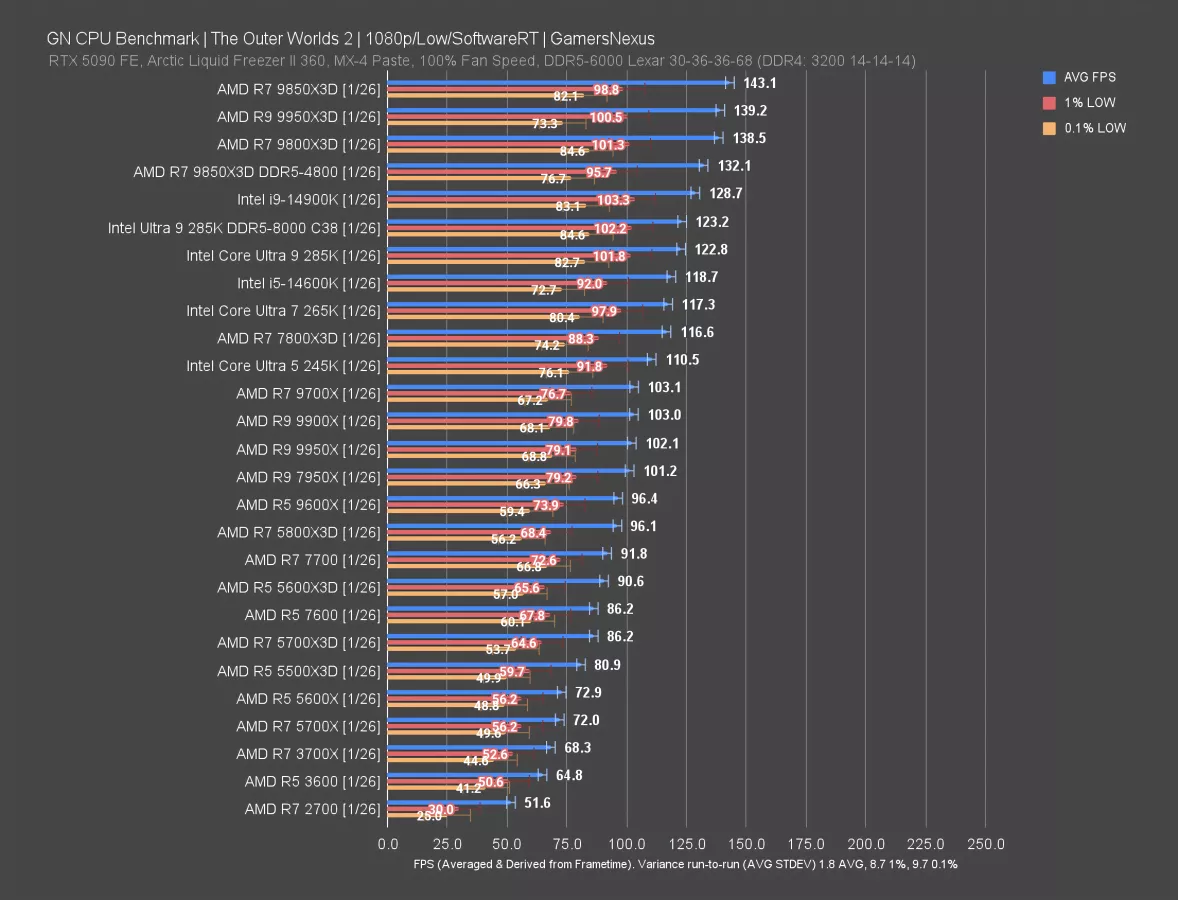
The next test is for Outer Worlds 2 at 1080p, then 1440p. This game is brand new to our test suite and hasn’t been used before. It’s an October 2025 release title, making it one of the newest on the bench.
The 9850X3D ran at 143 FPS AVG here, outpacing the 9800X3D by 3.3%. The lows are about the same between them. The 9950X3D is ahead of the 9800X3D, but behind the 9850X3D marginally. Ultimately though, these top 3 are close enough that they’re basically the same.
Running the 9850X3D with memory that Crucial would love to sell you for $900 if they still existed, the CPU hit 132 FPS AVG and still leads the 14900K and 285K. That’d have our standard memory kit-equipped 9850X3D at 8.3% ahead of the pairing with worse memory.
The 285K with fast memory hit 123 FPS AVG, as did the normal test. Lows are the same between them.
The 7800X3D had a 117 FPS AVG result, putting the 9850X3D 22.7% ahead of the 7800X3D, with the 9800X3D about 19% ahead of it. The 5800X3D trails significantly, down at 96 FPS AVG and following the 9600X and 9700X (read our review) CPUs. The 9000 series is benefitted from better single-core performance and IPC, both enabling the superior performance here. The 5800X3D still does well with its 96 FPS AVG.
Outer Worlds 2 - 1440p
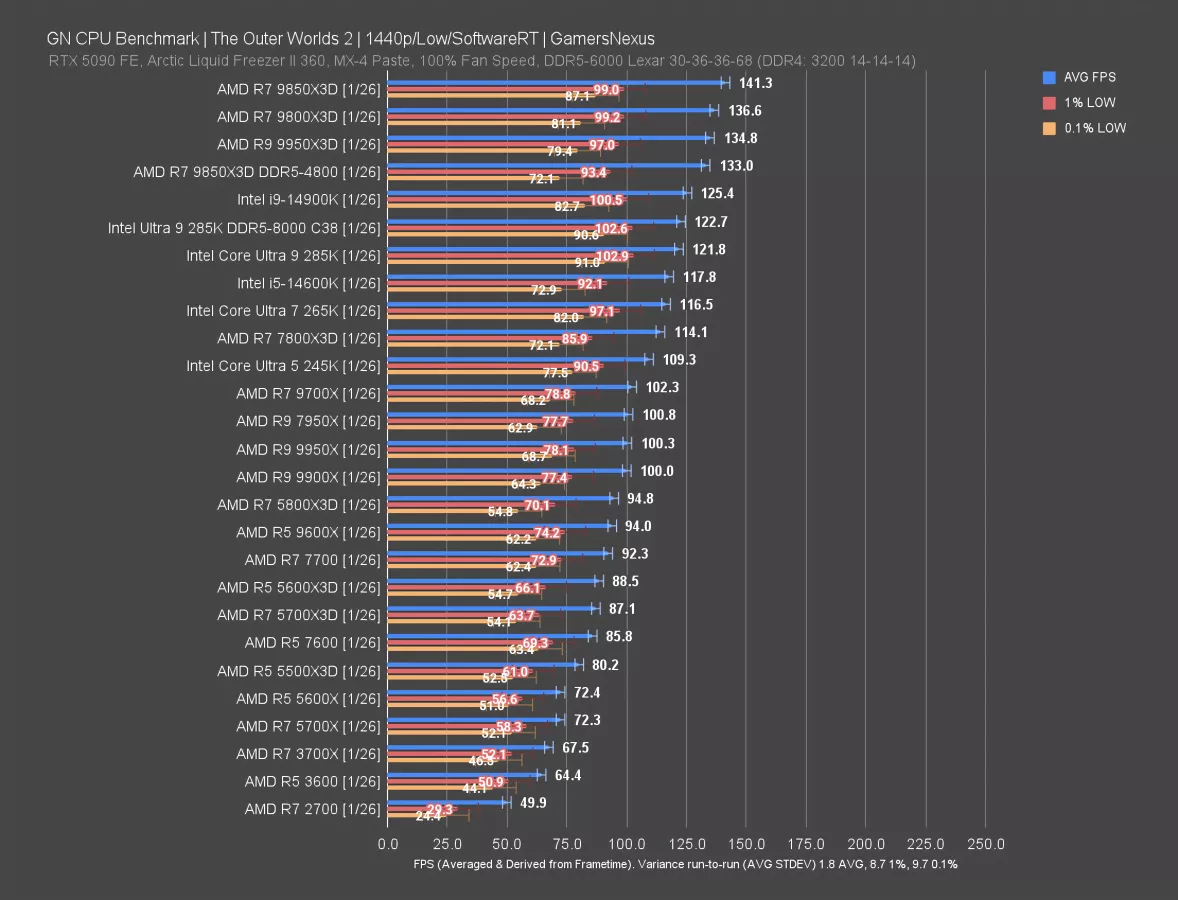
At 1440p, the results don’t change much. We’re entirely CPU bound with these settings and test processes, so even at 1440p, we remain limited by the CPU and not the GPU. As a result, we only lose a little bit of the top-end of framerate. Otherwise, things are in about the same spot as they were at 1080p.
Stellaris
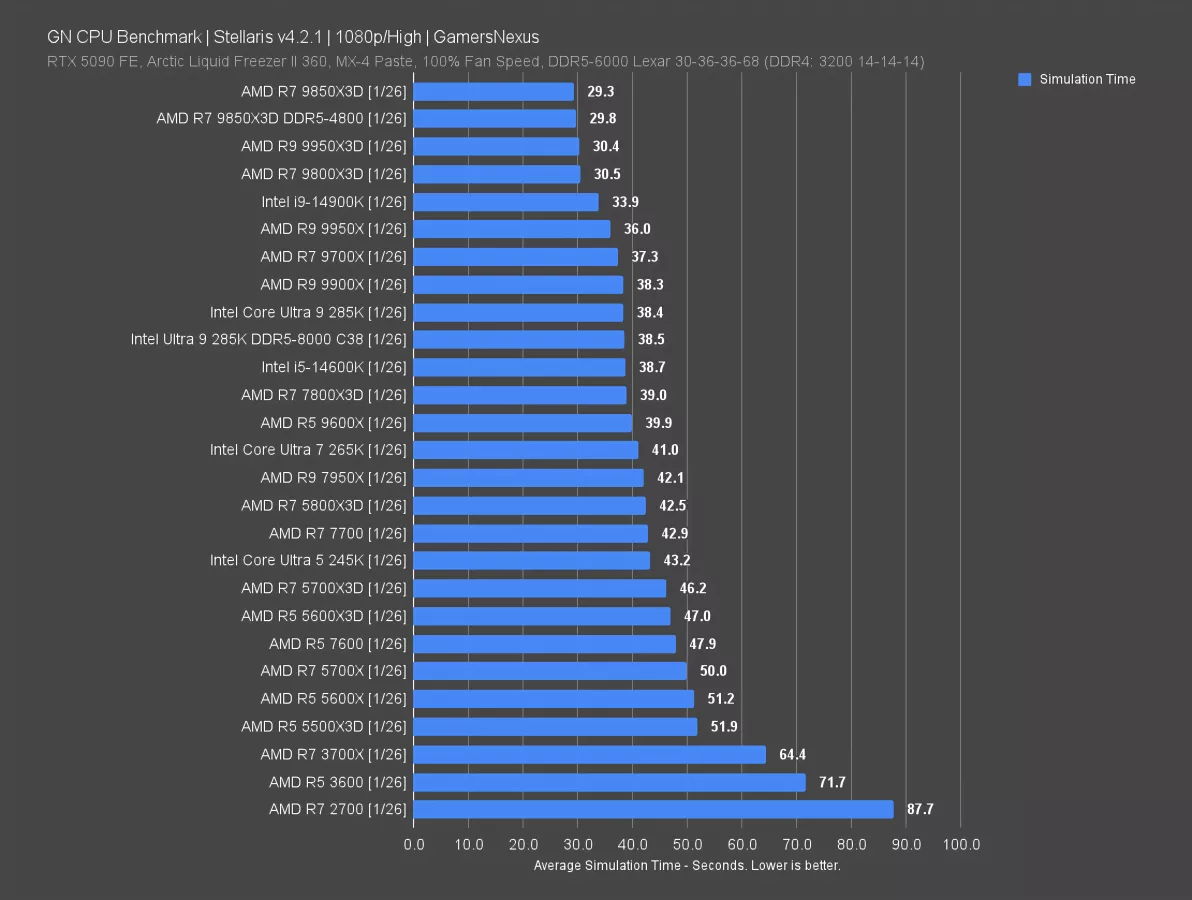
We’ll move on to Stellaris. This is a simulation time test, not a framerate test, and so it’s one of the best possible scenarios for testing a CPU in gaming. Lower is better.
The 9850X3D completed the simulation in 29.3 seconds for this one, slightly better than the 29.8-second result of the 9850X3D with DDR5-4800 memory. Because this benchmark is so frequency-dependent, the 9850X3D with worse memory outperforms the 9800X3D with better memory. The 9850X3D led the 9800X3D (with both on the same memory spec) with a time reduction for simulation of 3.9%.
Just to refresh on the rest of the lineup while we’re here, Intel’s 14900K is the closest to AMD’s X3D CPUs, but still trails by 3 seconds. The 285K is well below that, with the 285K on faster memory falling within test error and not improving. The 5800X3D is still a great CPU, but tumbles down the ranks as compared to higher IPC and frequency modern parts. Other games that are more cache-dependent keep the 5800X3D in higher positions.
Kingdom Come: Deliverance II - 1080p
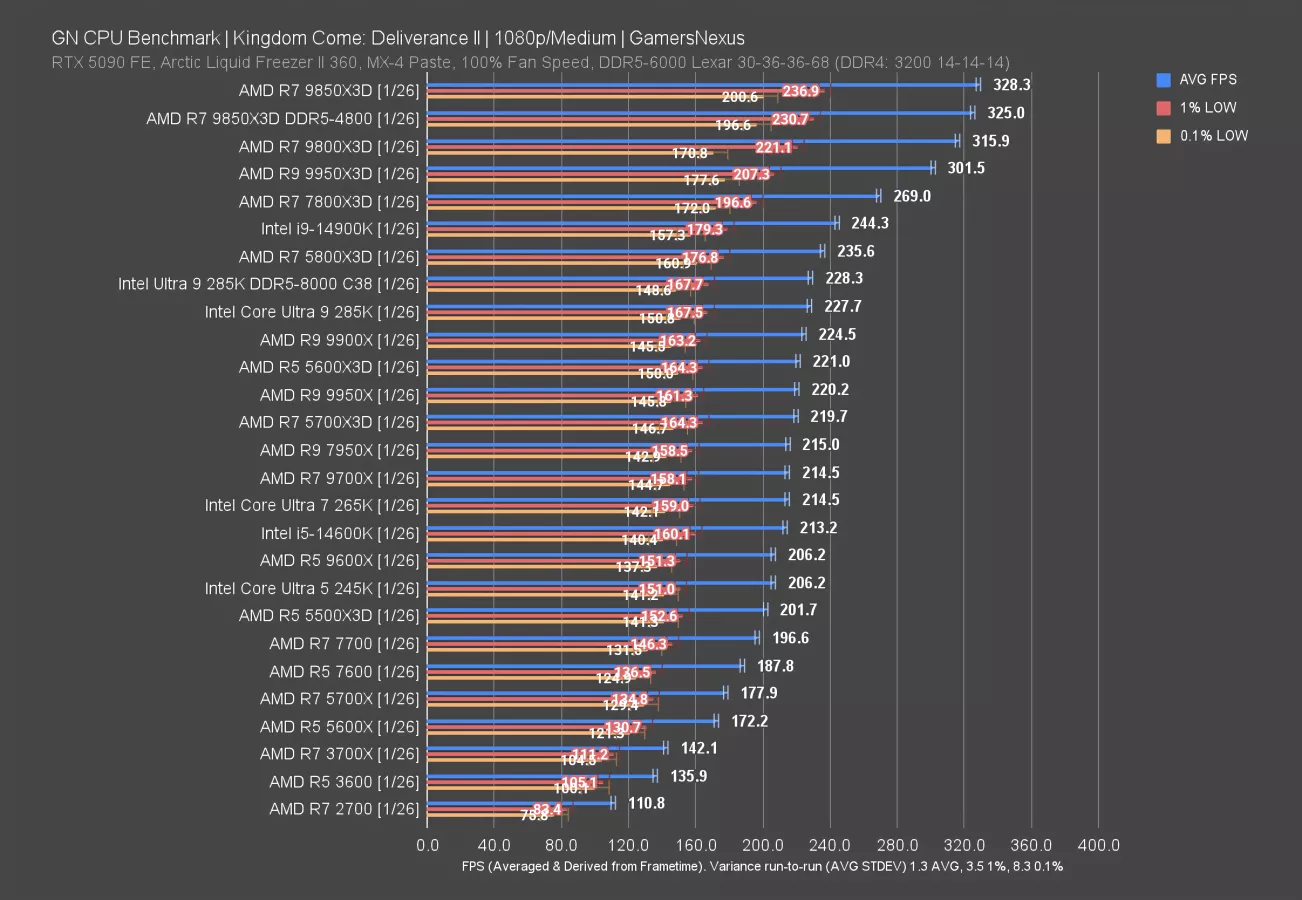
Kingdom Come: Deliverance II is next. This game is a brand new addition to our CPU test bench. We’ll first test at 1080p.
The 9850X3D is at the top again, this time at 328 FPS AVG and with good lows behind it. Even with DDR5-4800, the 9850X3D remains in the second spot at 325 FPS. The better memory kit landed the 9850X3D about 1% ahead.
Below that is the 9800X3D, at 316 FPS AVG. The 9850X3D improved on the 9800X3D by about 4%, which is one of the largest improvements we’ve seen so far. So, yay?
The 9800X3D improved on the 7800X3D by 17%, with the 9850X3D improving on the 7800X3D by 22%.
Intel’s 285K is below the 5800X3D here, with the 14900K being Intel’s best-performer in this game. The 9850X3D improves upon the 14900K by 34%.
Kingdom Come: Deliverance II - 1440p
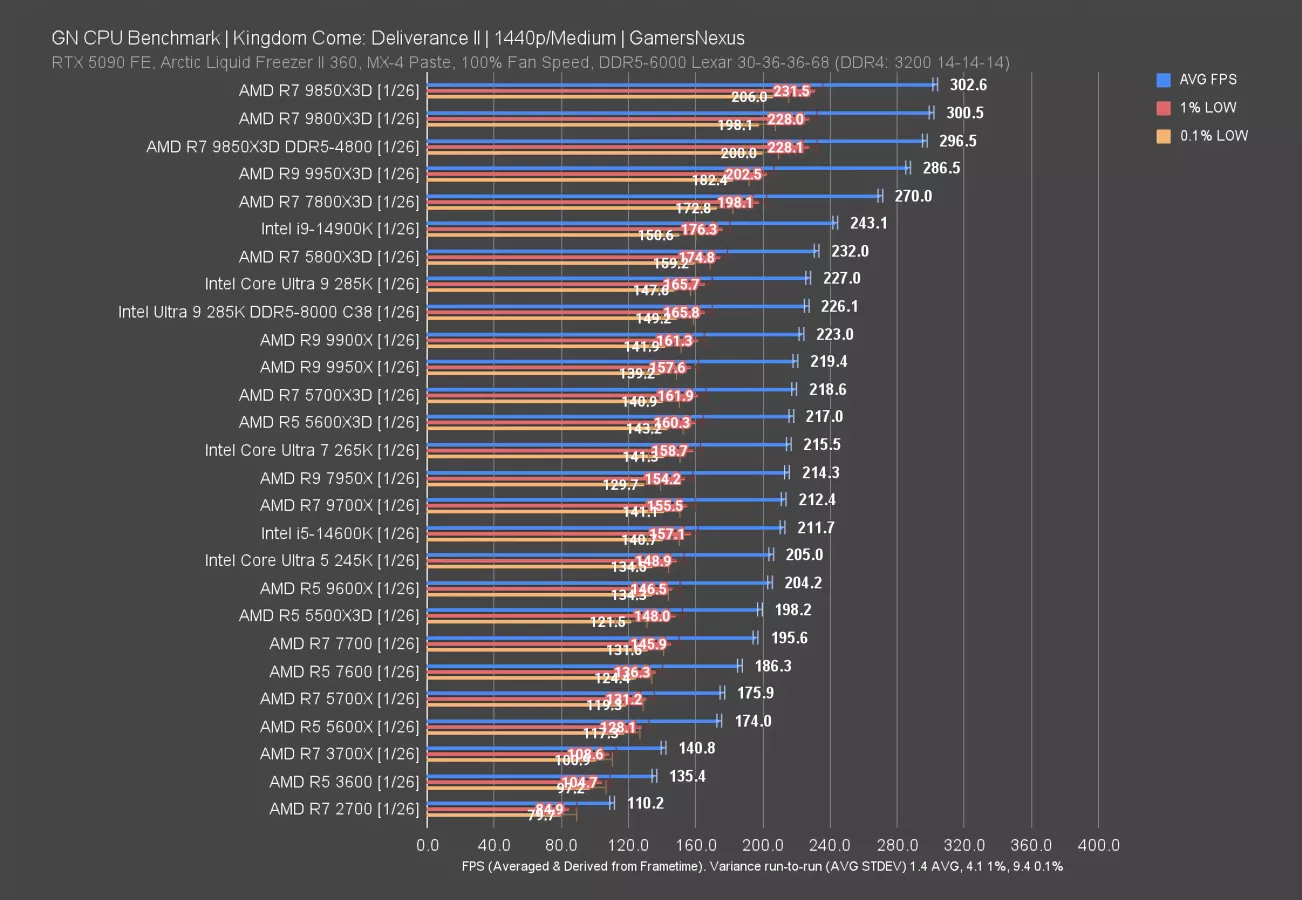
At 1440p, we see the top-end of performance get truncated by the GPU limitation that’s starting to kick in -- even on the RTX 5090 (read our review).
The 9850X3D’s 303 FPS AVG is within run-to-run variance of the 300-301 FPS AVG of the 9800X3D. Dropping memory to DDR5-4800 put the 9850X3D slightly below the 9800X3D with better memory, but still ahead of everything else. The 14900K doesn’t move here, as it’s not GPU-bound and is still loading the CPU just as much as before.
Dragon’s Dogma 2
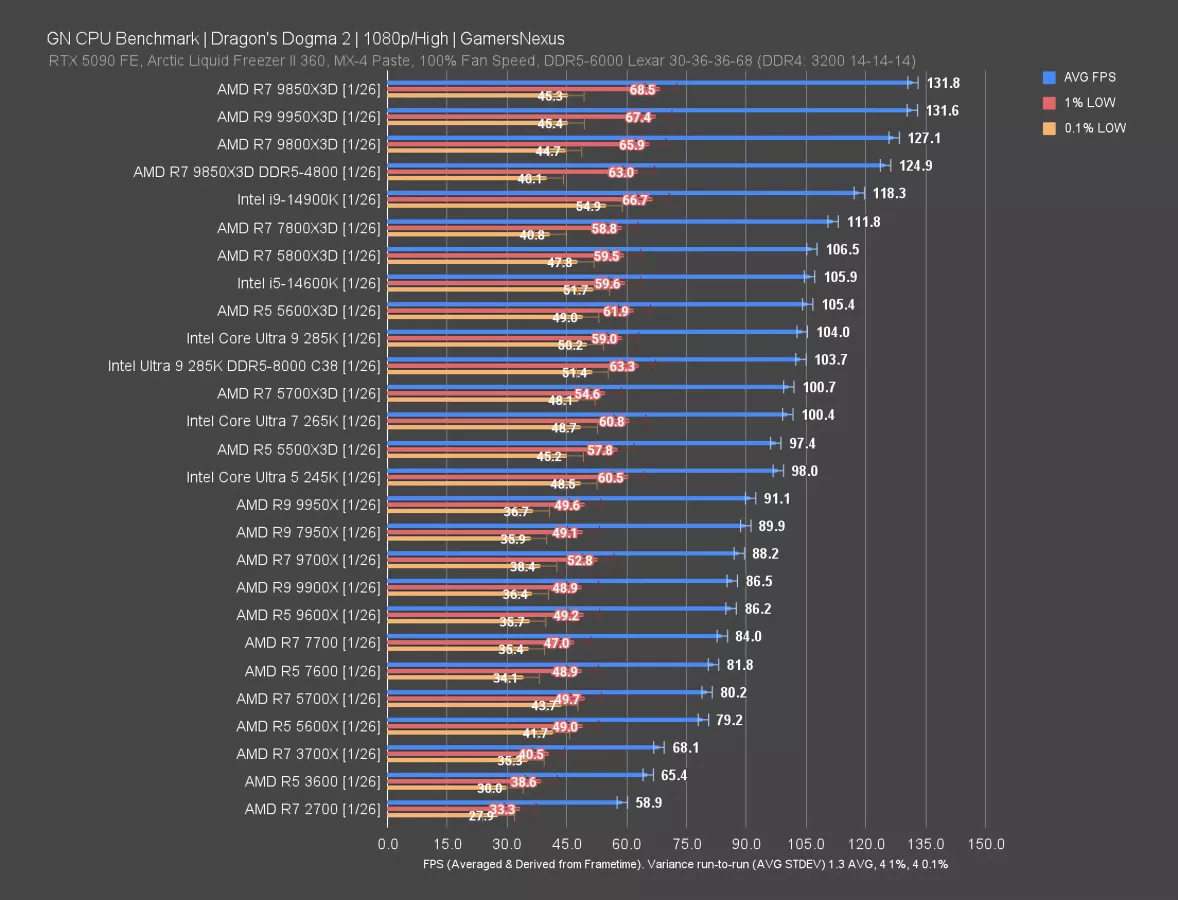
Dragon’s Dogma 2 is up next. In this one, the 9850X3D ran at 132 FPS AVG, tying the 9950X3D. Both outpace the 9800X3D by a few FPS average. The lows are the same for all of these. Technically, the 9850X3D is better than the base 9800X3D by 3.7%. That’s something, but not much to write about.
The lower memory speed had the 9850X3D at 125 FPS AVG, meaning the DDR5-6000 kit was worth about 5.5% more performance. Again, that’d be a bigger gap if it were a CPU with lower cache capacity.
The 14900K sits between the 9800-series X3D parts and the 7800X3D. The 5800X3D isn’t far behind the 7800X3D.
Cyberpunk 2077 - 1080p/Medium
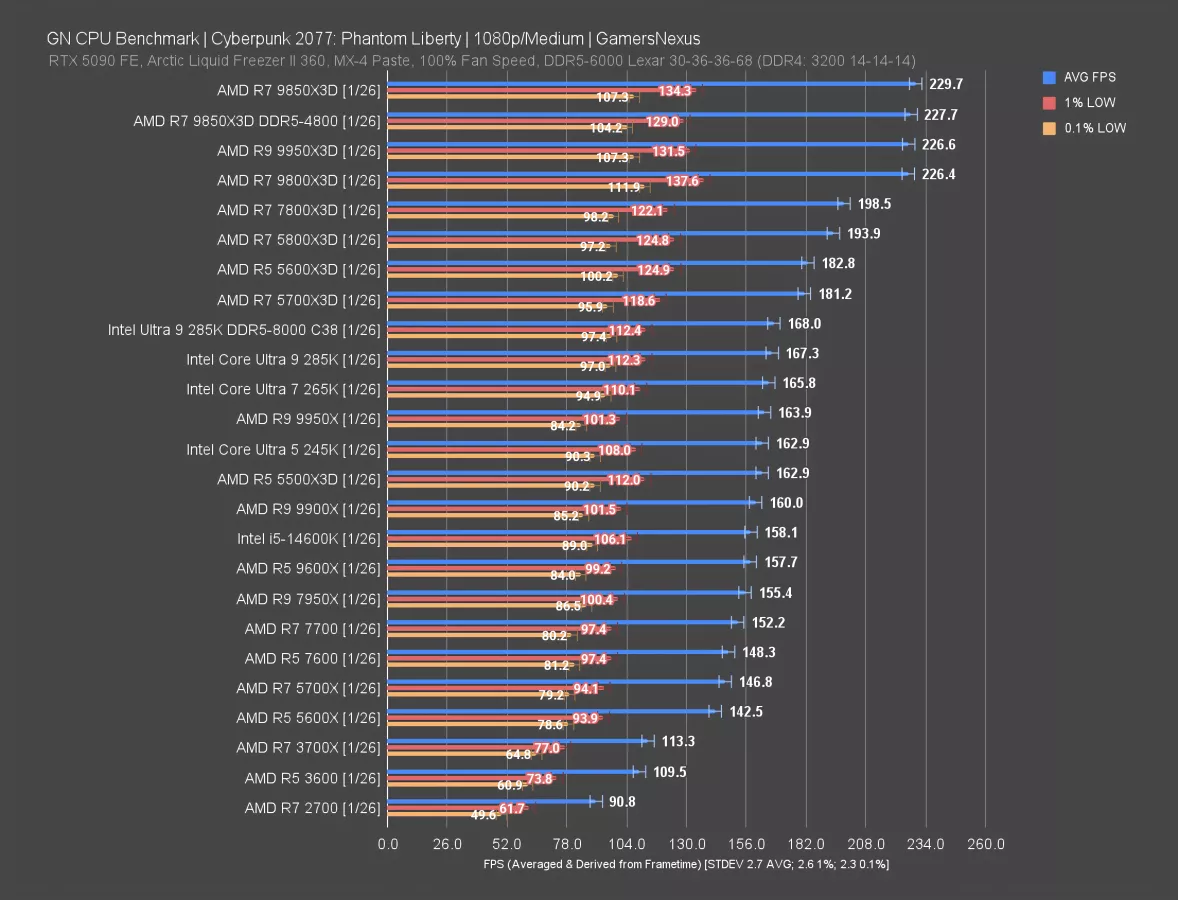
Testing Cyberpunk at 1080p/Medium, the 9850X3D ran at 230 FPS AVG and was less than 1% ahead of the slower DDR5-4800 pairing. The 9950X3D and 9800X3D were tied and trailed both. In other words, adding “50” to the 9800X3D is worth about 1.5% here.
This chart is mostly interesting for the absolute domination of the higher cache parts from AMD. The entire top of the chart is all X3D CPUs. The only X3D part that falls down the chart is the 5500X3D, which we reviewed separately last year.
Intel’s closest competition is the 285K this time, including with the higher spec memory kit (although this is basically the same performance as the baseline CPU).
Cyberpunk 2077 - 1080p/High
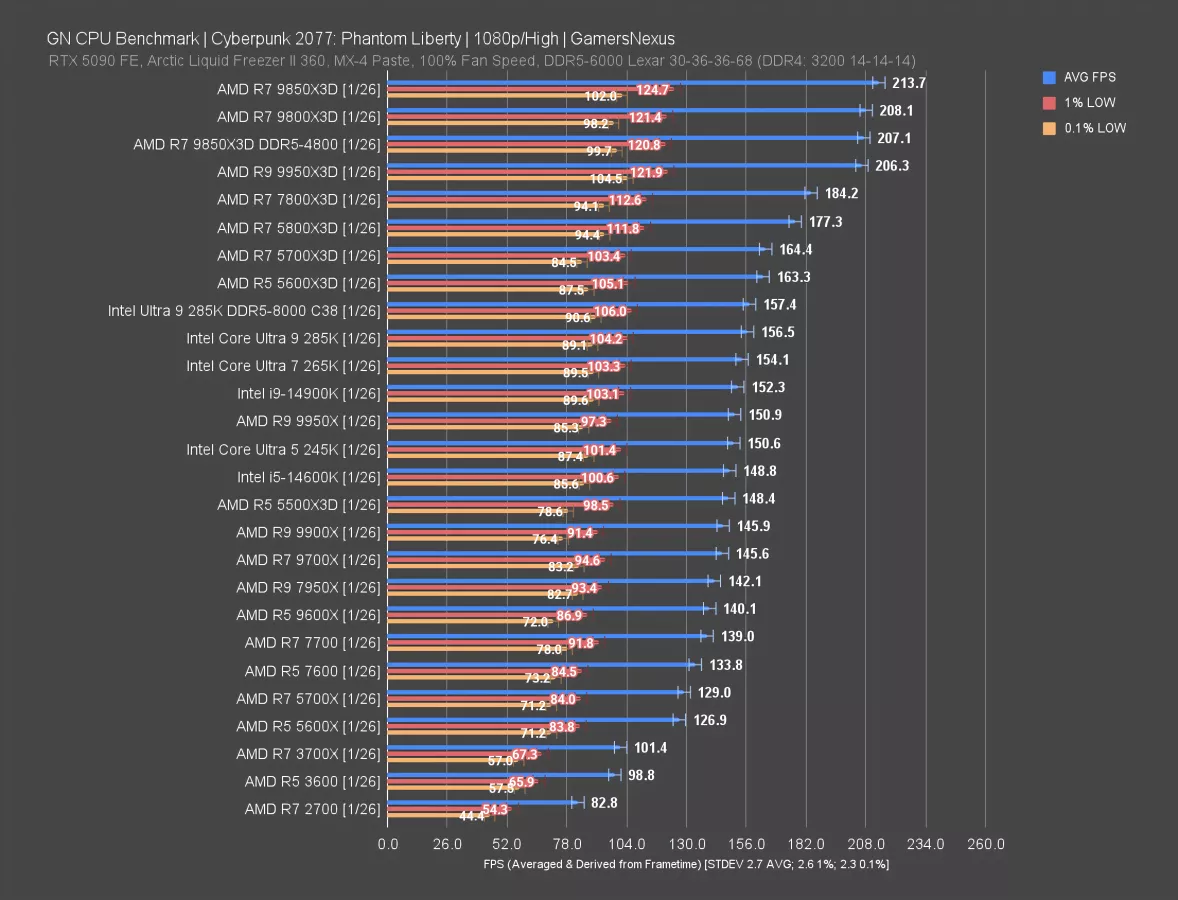
With high settings instead, we lose some of the top-end of performance due to the GPU load, but overall see the same top rank for the 9850X3D. The 9800X3D and lower memory spec 9850X3D also tie here, alongside the 9950X3D, with the 7800X3D being the next real step down.
F1 25 - 1080p
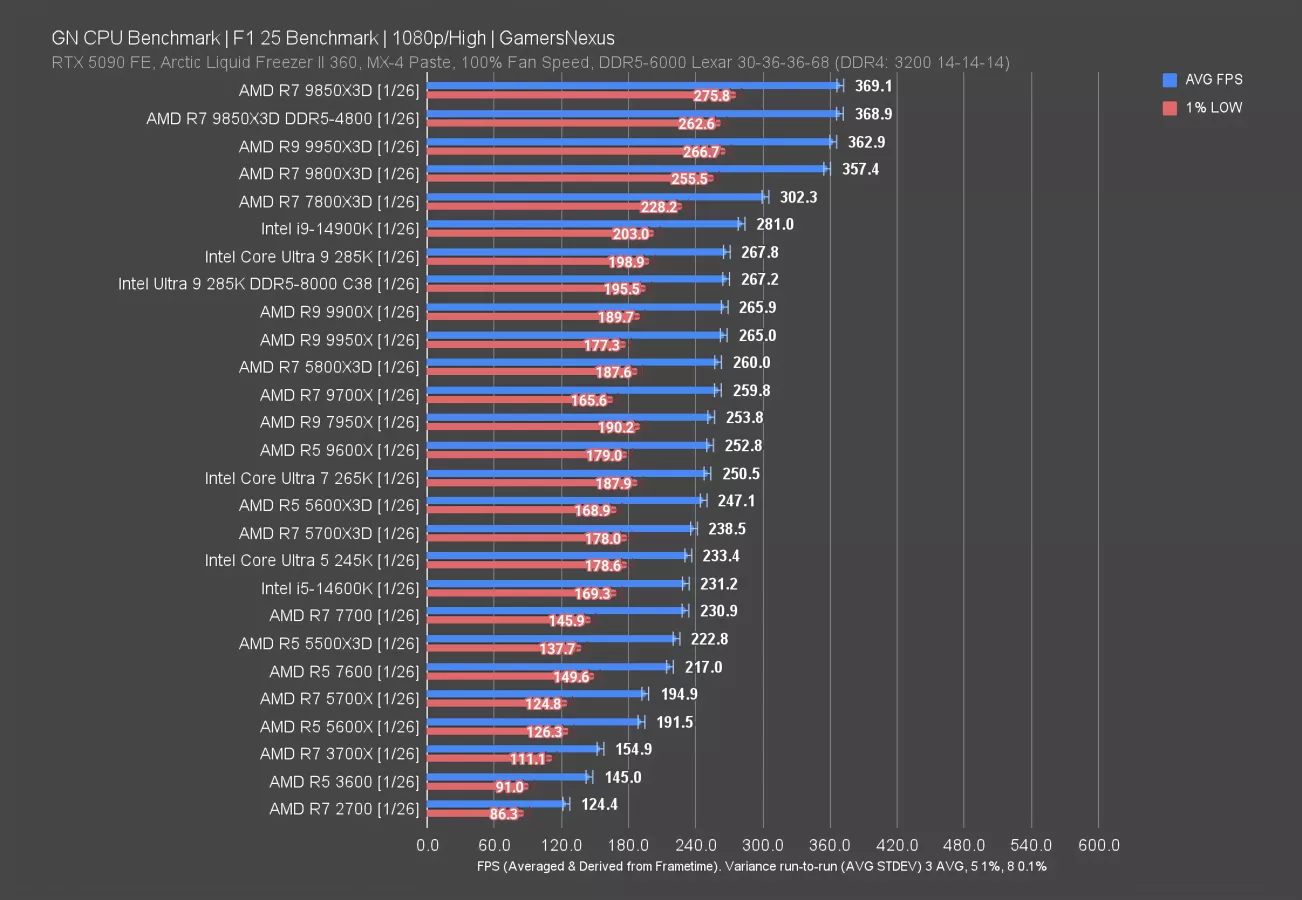
F1 25 is also new to our test suite, replacing F1 24. The 9850X3D topped the charts again, this time at 369 FPS AVG and with lows paced proportionally. The DDR5-4800 result was basically the same. AMD’s 9850X3D leads its 7800X3D by about 22% here, with the 14900K following the 7800X3D as Intel’s top-performing CPU. The 285K sits below that and saw no meaningful change from the alternative memory kit we used.
Against the 9800X3D, the 9850X3D improves by about 3.3%. It seems the average uplift is about 3-4% at best.
FFXIV - 1080p
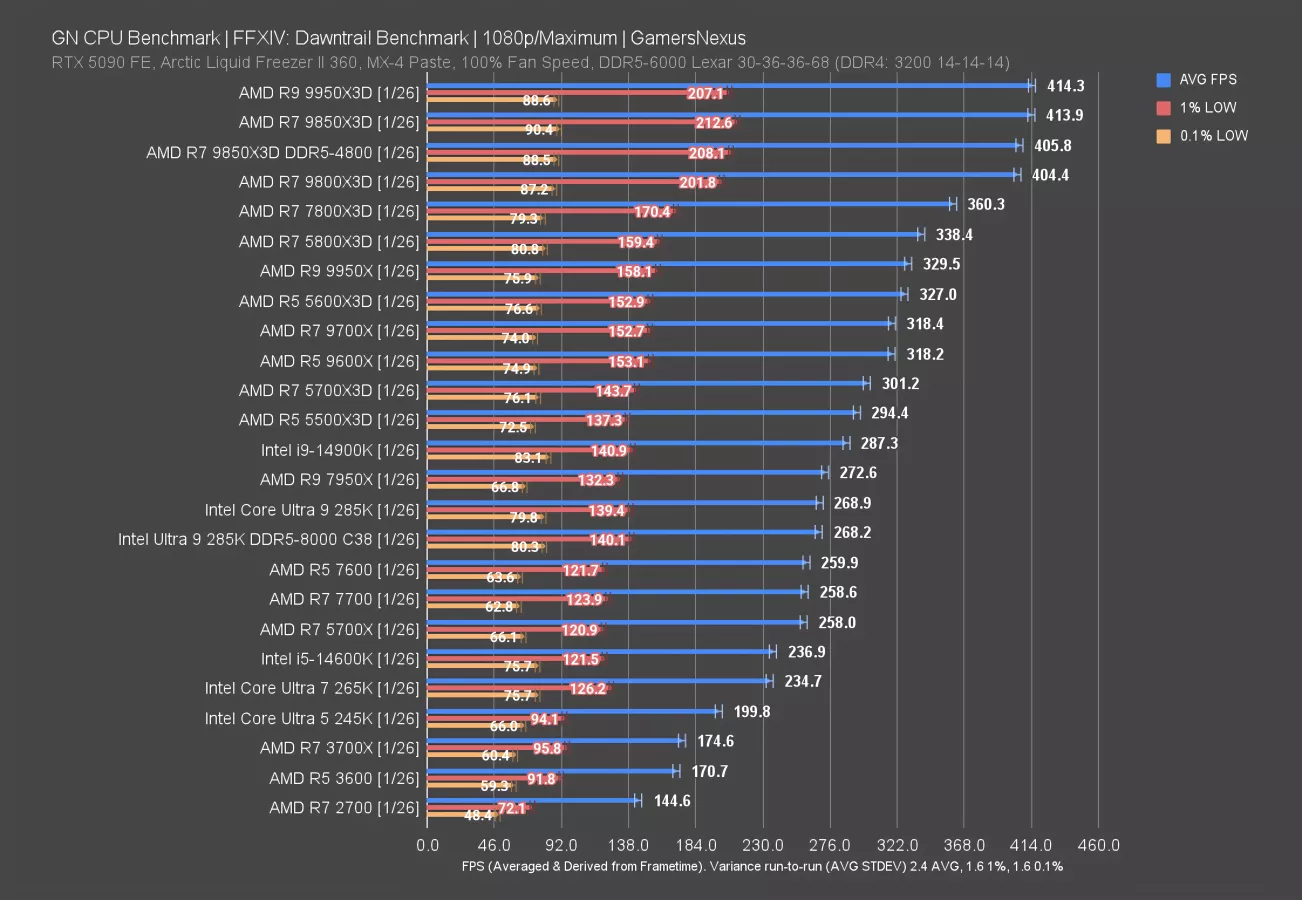
In Final Fantasy 14: Dawntrail benchmarking, the 9850X3D ran at 414 FPS AVG, landing it just below the 9950X3D and within error of it. The DDR5-4800 result dropped to 406 FPS AVG, giving the higher spec memory pairing a 2% advantage.
The baseline 9800X3D is just below that, at 404 FPS AVG. The 9850X3D (with like-for-like memory) is 2.3% ahead as a result. The 7800X3D is next, at 360 FPS AVG and giving the 9850X3D a lead of 15%.
Starfield
Starfield is our last game. It’s been a surprisingly reliable test candidate.
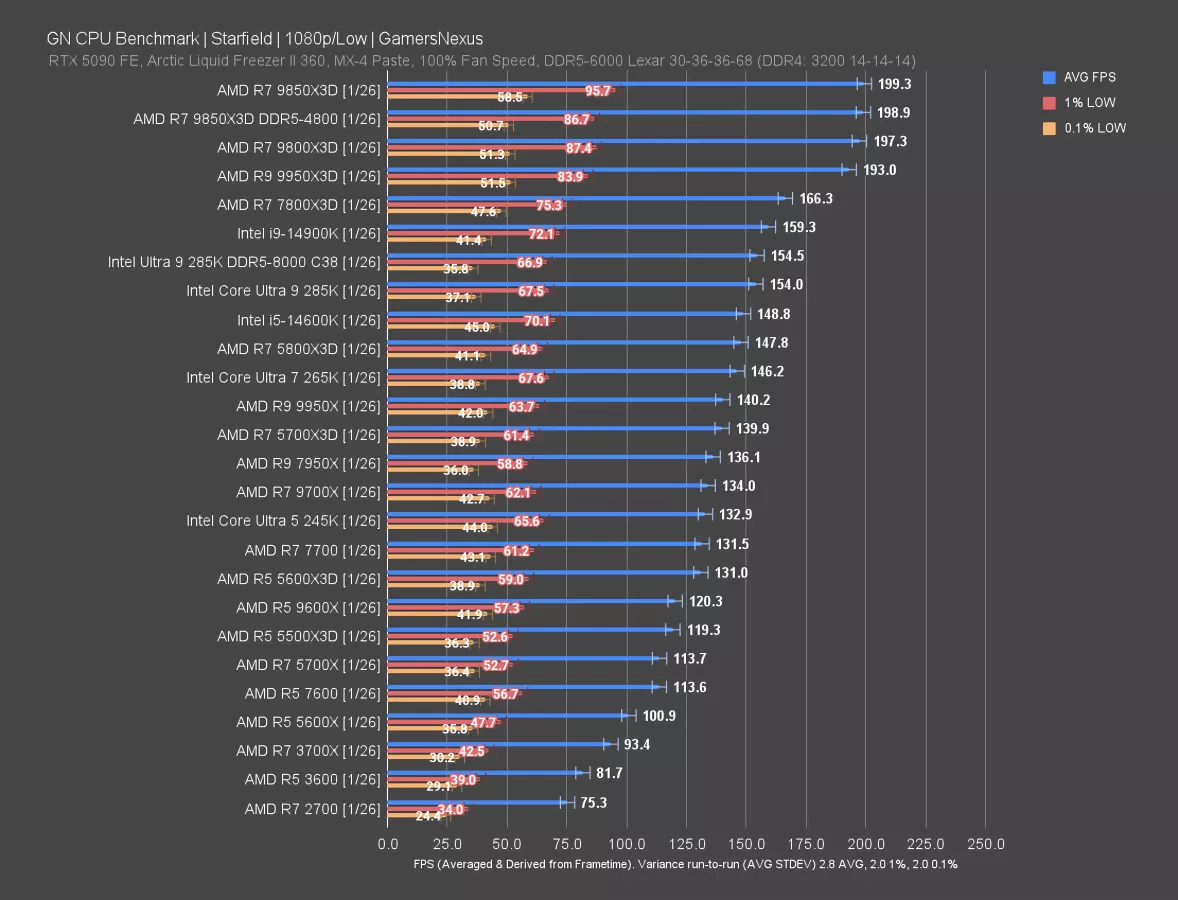
In this one, the 9850X3D ran at about 200 FPS AVG, leading the 9800X3D by basically run-to-run variance differences of about 2 FPS. That’s not meaningful. The 9850X3D and 9800X3D are effectively identical in this test. The slower spec memory is also within variance.
The 9850X3D leads the 7800X3D by 19.8% here, with the 14900K and 285K just below that.
Production Benchmarks
We didn’t do as many production suite benchmarks as typically since this is just a refresh of a CPU. Most of the core-dependent tests will be about the same, so you can check our 9800X3D review for that.
7-Zip Compression
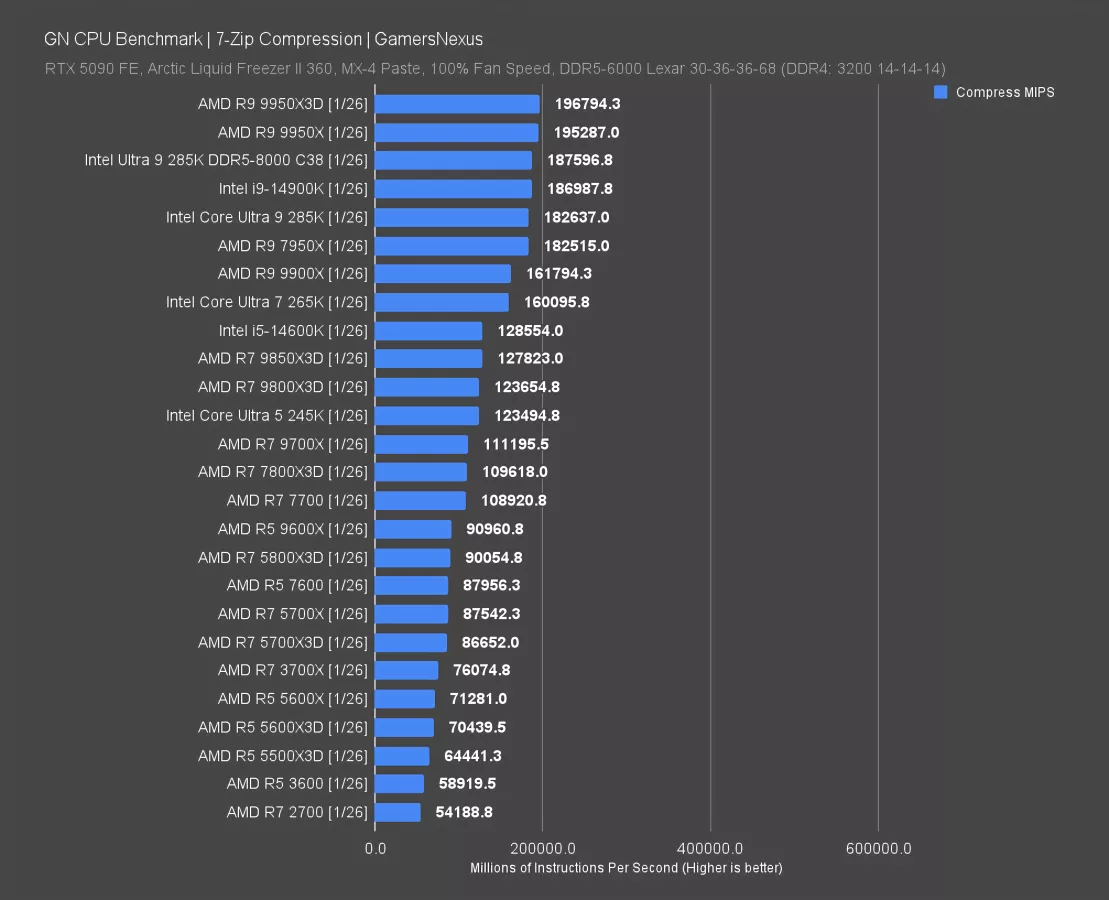
In 7-Zip compression testing, the higher core-count parts are at the top: The 9950X3D leads, followed by the 9950X, then the Intel 285K with the faster memory, the 14900K, and the 285K.
We eventually hit the 9850X3D (just below the 14600K and 265K) at 128K MIPS. Its core count is showing here. The 9850X3D leads the 9800X3D by 3.4% in this, about the same as we saw in gaming. The 7800X3D is at 110K MIPS, so the 9850X3D compresses 16.6% better than the 7800X3D in this test.
7-Zip Decompression
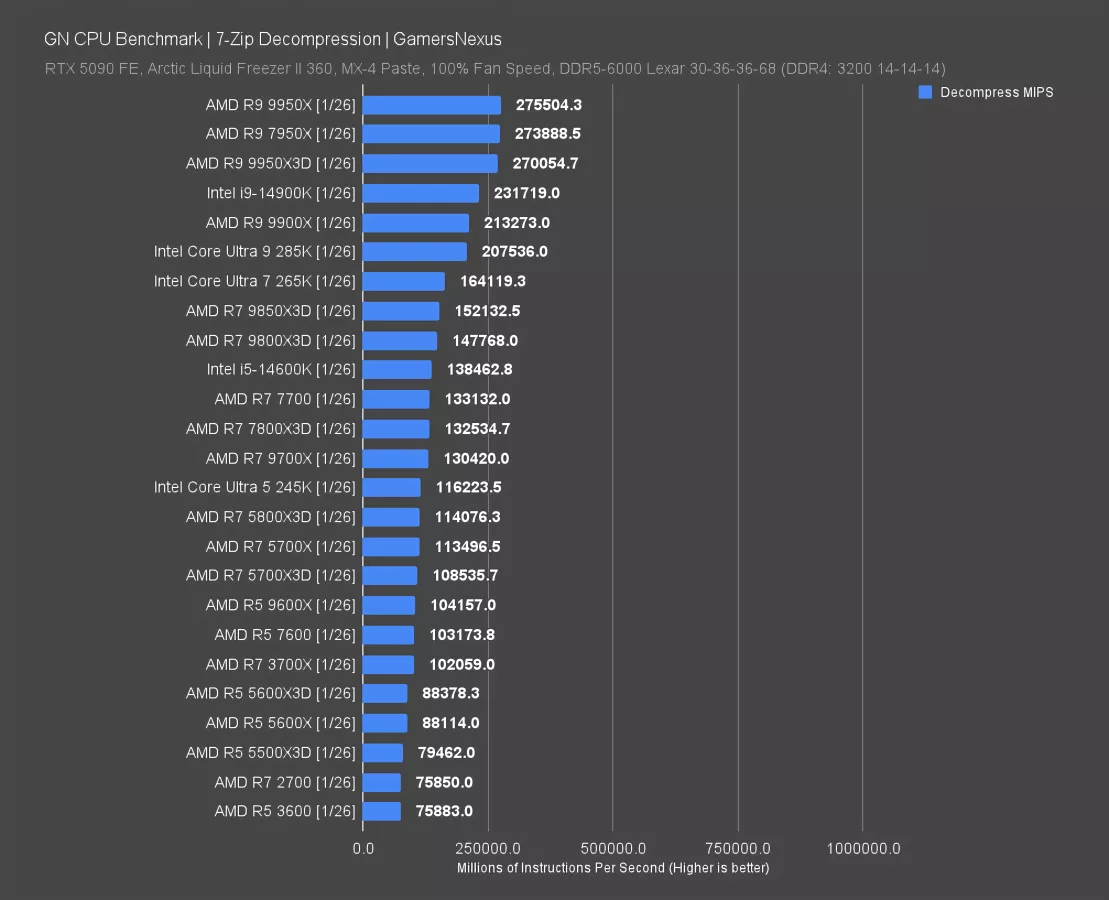
In decompression, the extra cache on the 9950X3D doesn’t really help it. The 14900K is behind AMD’s 16-core parts, eventually with the 9850X3D at 152K MIPS. The improvement over the 9800X3D drops to about 3% from the prior 3.4%, so the frequency has less of an impact in this test than the compression test.
Blender
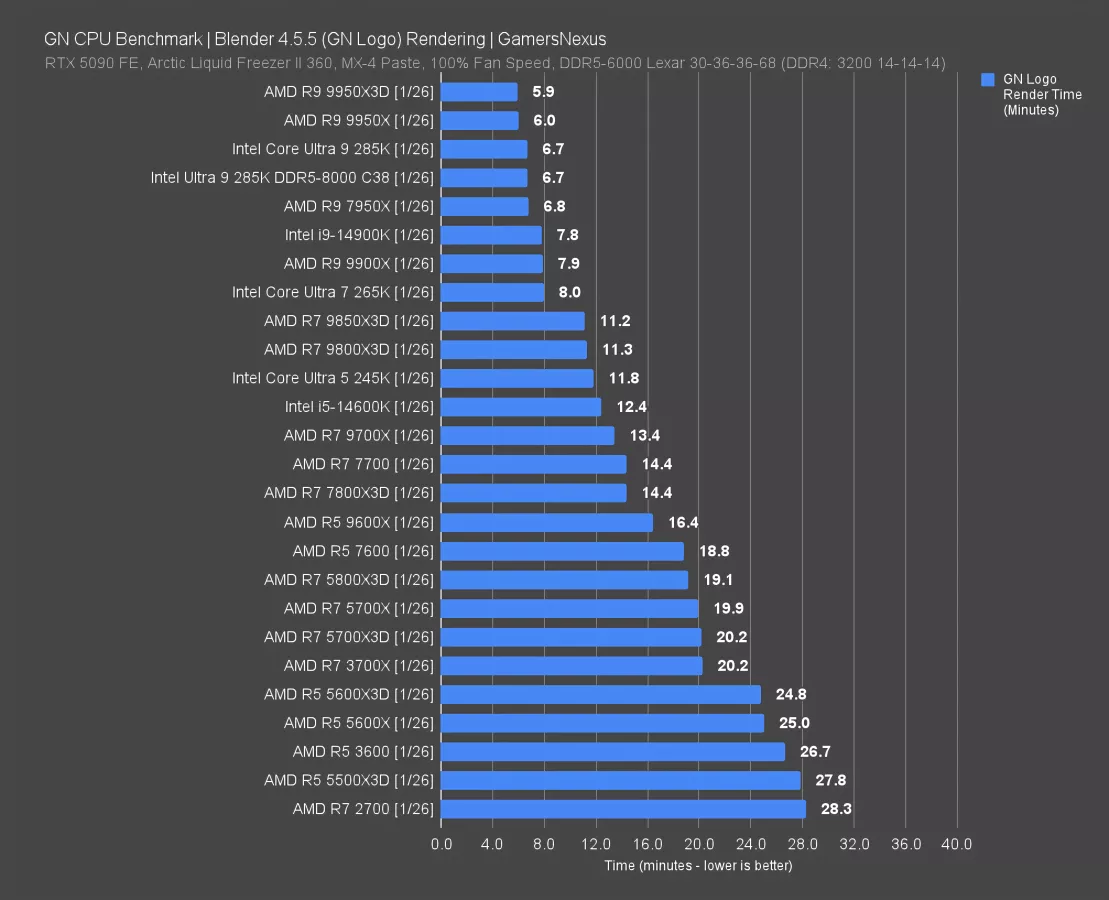
In Blender rendering, which runs tile-based rendering for each thread, the 16-core parts predictably performed the best. Frequency doesn’t have as much of an impact here. The 9850X3D required 11.2 minutes to complete the render, effectively tying with the 9800X3D. Moving to the 265K (read our review) and up has a massive reduction in time required, so as we’ve seen in the past, the 8-core gaming X3D parts have disadvantages in more core-intensive production workloads.
Adobe Photoshop
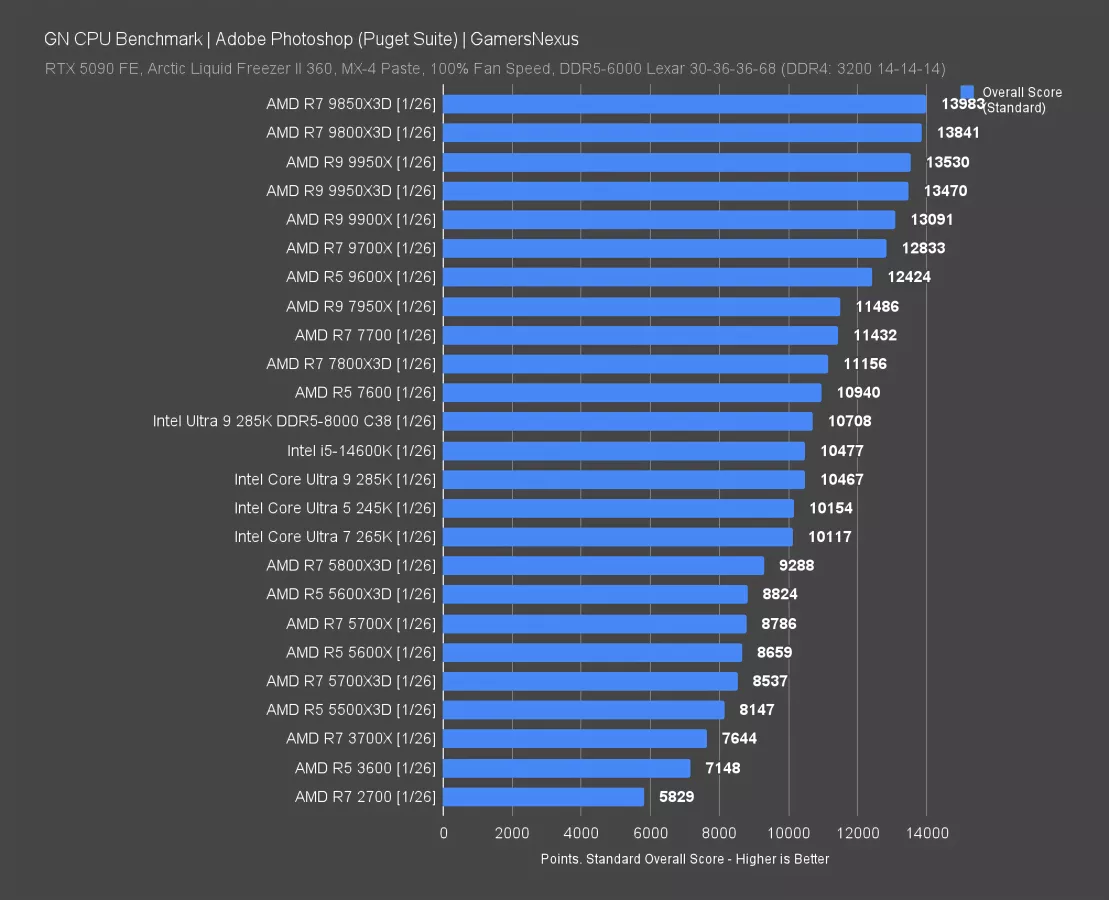
In the Puget Suite with Photoshop, the 9850X3D ends up as the top performer -- although it’s basically tied with the 9800X3D. The higher frequency helps boost it ahead in a situation AMD was already leading.
We had trouble getting the 14900K to complete this one, so it’s absent. It wasn’t immediately clear to us whether that’s because it is rusting from the inside or because Adobe sucks. Both are equally plausible.
Conclusion

The 9850X3D is basically an XT refresh. It’s slightly better than the 9800X3D sometimes, it’s slightly more expensive than the 9800X3D. And it’s a lot more expensive than the similar 7800X3D. With a $125 price advantage for the 7800X3D on Newegg now, it’s tough to justify the performance uplift of the 9850X3D.
As we just ran through in the charts, the 9850X3D is anywhere from 0% better to 4% better than the 9800X3D on average. Gaming performance is technically measurably different in several scenarios, but that doesn’t mean you’ll be able to see it or notice that change. It was interesting though to see that the DDR5-4800 kit didn’t damage performance as much as you might expect. If we were to pair that with a non-X3D CPU, it’d be a different story.
The voltage is a little bit higher on the 9850X3D, which is helping it hit the higher clocks we saw in our single-core and all-core frequency validation testing.

Similar to how Super Series GPUs keep NVIDIA GPU prices elevated by resetting the timer on the time available on the market, this 9850X3D will help push the ASP (Average Selling Price) back up for AMD’s top-end gaming CPU. These CPUs are binned variations of the 9800X3D and support better stock clocks, so there is a real change. It’s just not something you should spend a lot on. Also, technically, you could do a lot of this OC yourself for free.
It’s not that exciting. MSRP is lower than what rumors indicated, which is good, but it’s still higher than the currently available predecessors from AMD. Those include the 9800X3D at $20-$50 cheaper and the 7800X3D at up to $125 cheaper. If anything, this review has brought our attention back to the 7800X3D, as a sub-$400 for that part is very competitive.
Overall, the CPU isn’t exciting. It might be worth considering for the possibility of having a better overclocking chip -- though that’s not guaranteed -- but we don’t think it’s worth spending extra money on something that is this marginal of an uplift. That’s especially true if you’d be willing to buy the 7800X3D instead, but against the 9800X3D, there’s not much reason to get the 9850X3D for an extra $50.
But hey, given that a lot of the coverage of this industry over the past 3 months has been related to its absolute and total top-down corruption involving effectively bribes of the government, a boring CPU isn’t as bad as global surveillance, the boot-licking behavior of Lisa Su when inviting the Federal government on stage at the Consumer Electronics Show to talk about stripping away States’ rights to regulate data centers and AI, and cartel-like behavior from the memory megacorporations.
So, in that sense, we’ll take “meh” over corrupt.
What a damning indictment of where we are today.