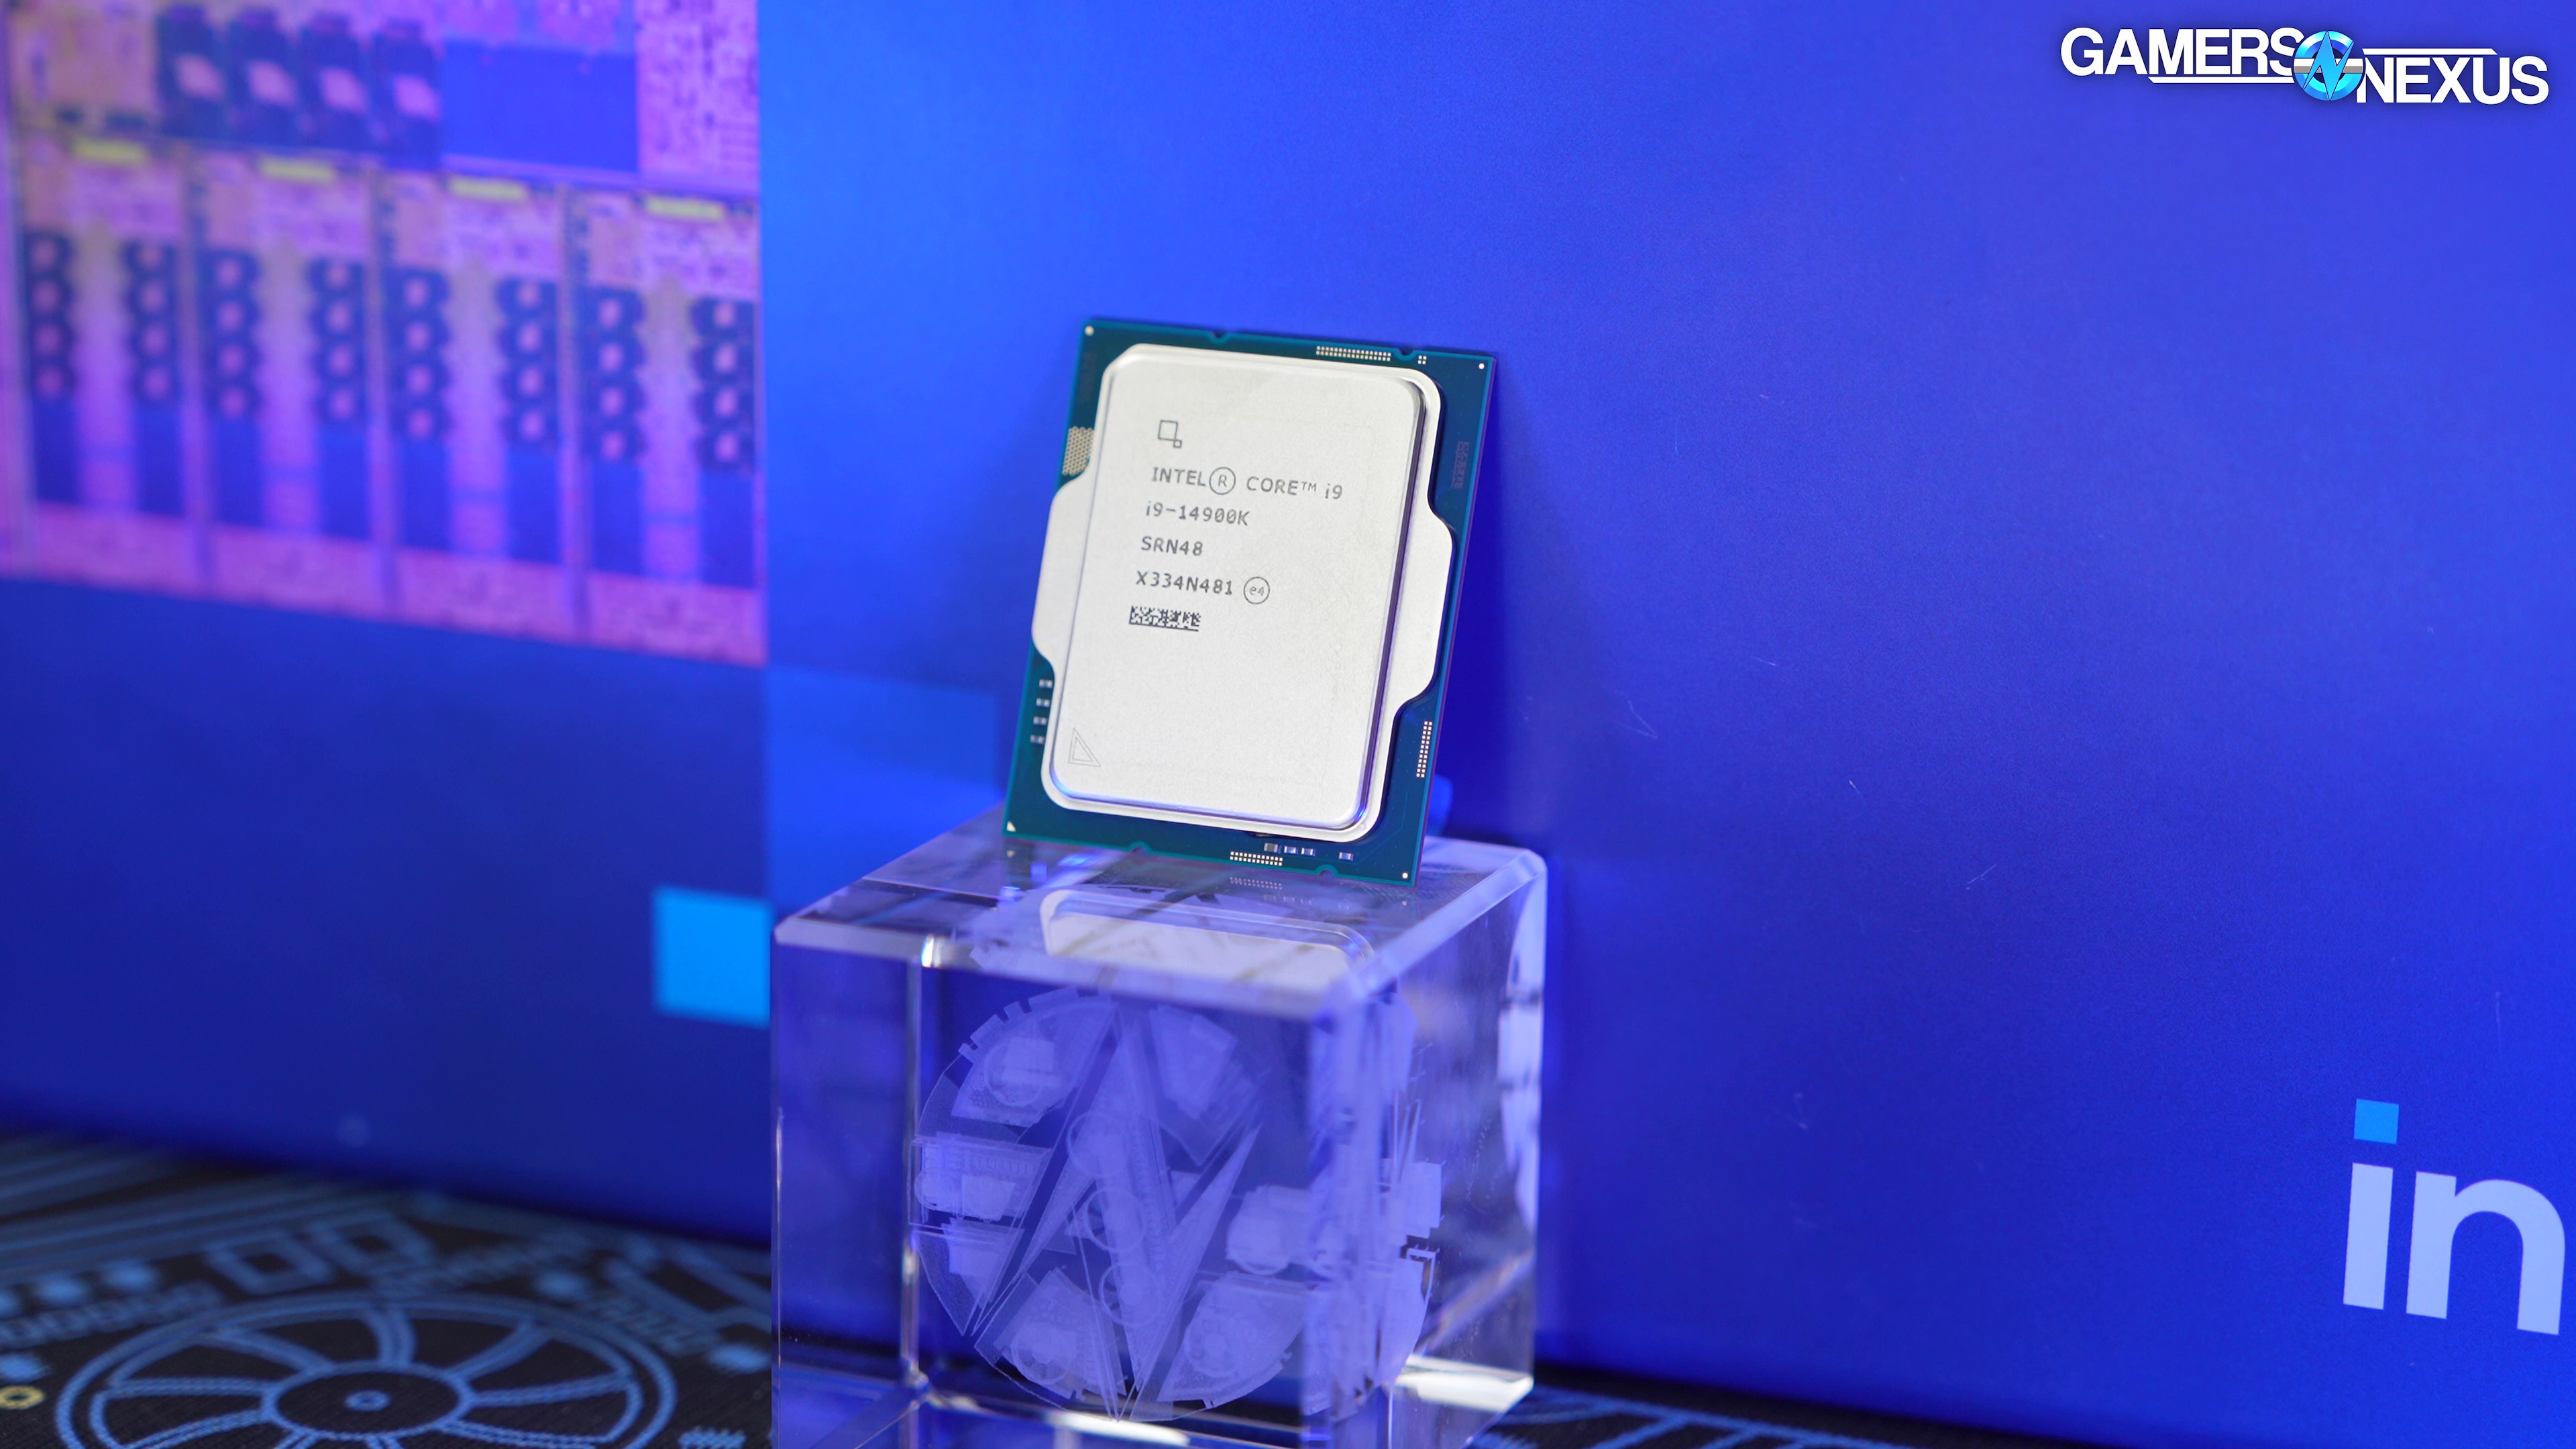
Meet the new 14900K, same as the old 13900K
The Highlights
- The 14900K has 8 performance cores, 16 efficient cores, and 32 total threads
- It’s impressively disappointing how similar it is in performance to its 13900K predecessor
- Unlike the 13900K, it features a 200MHz faster max turbo frequency at 6GHz
- Original MSRP: $600
- Release Date: October 17, 2023

The brilliance of Intel’s 14th “Gen” is limited only by its ability to believe. If Intel just believes that incrementing from 13 to 14 makes the CPU more than 1.8% better, then it can be true.
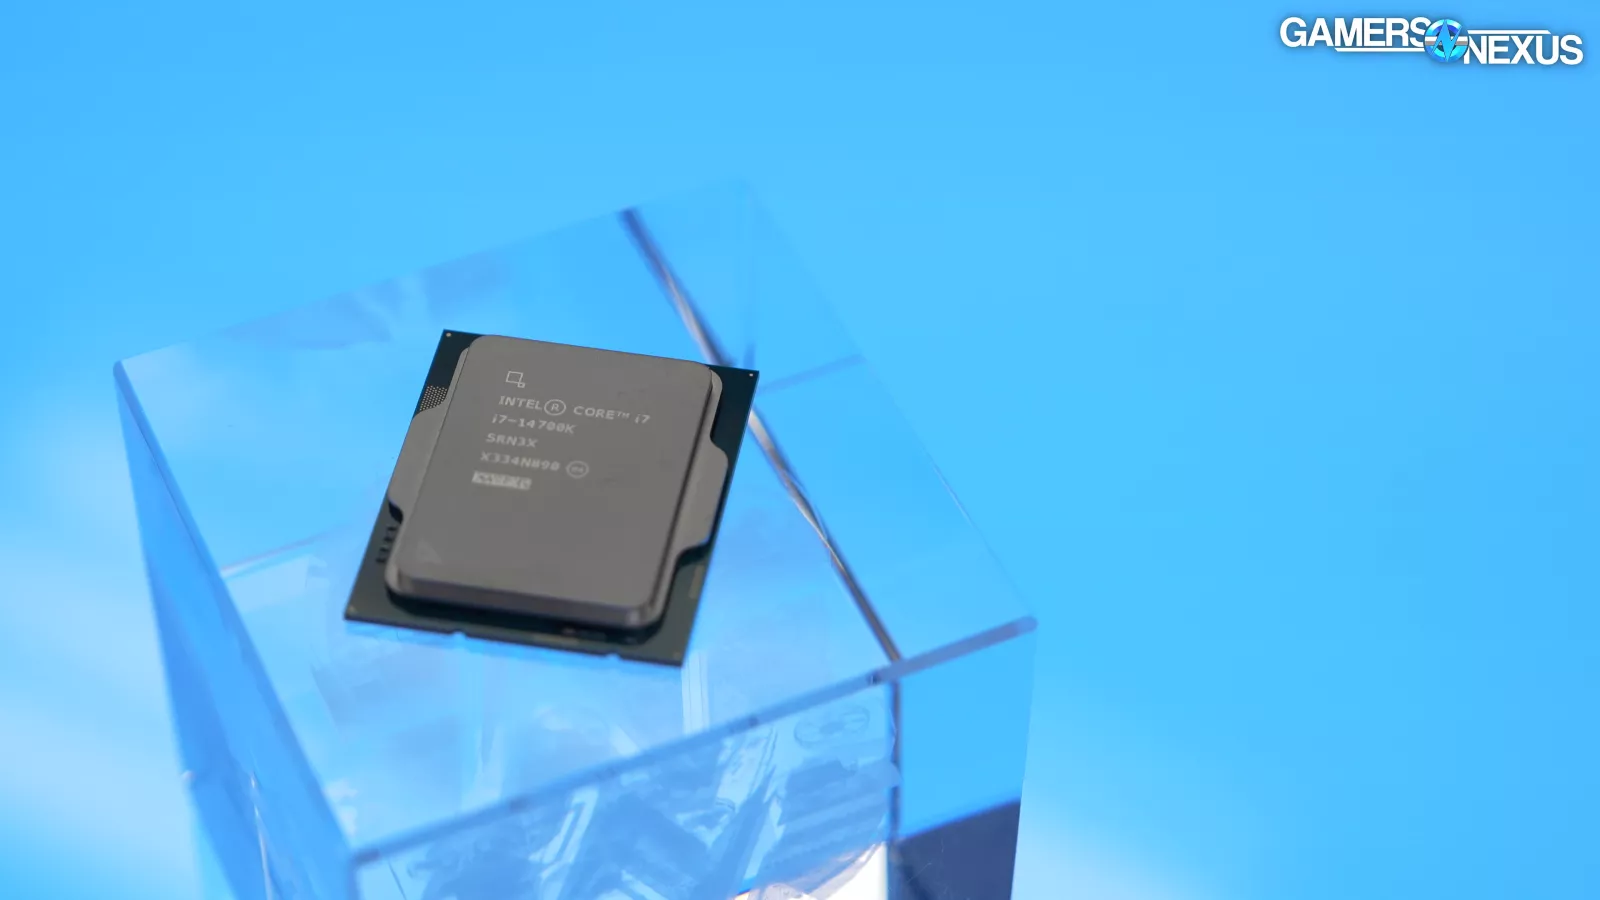
We were disappointed by the i7-14700K in our review -- which went a little off the rails, but that’s the trade for spending a week on a product like this -- and now we’re back to try our luck with the 13900K--err, 14900K. This thing pulls a ton of power (just like the 13900K), but now runs at 6GHz. That’s exactly the number that marketing needed to shove on a box and call this new, so we’re looking forward to it.
Intel i9-14900K Specs and Overview
The Intel 14900K is shipping for around $600-$625, depending on where and when you buy it.
The 14900K at $600 most directly competes with the 13900K at $550 from Intel. AMD’s strongest gaming competitor is the 7800X3D (find the review here), which has been around $350-$400 all week. The strongest production competitor from AMD is the 7950X (find that review here), commonly priced under $600. The AMD R9 7900X is around $425-$450 right now, depending on where you look.
Credits
Host, Writing
Steve Burke
Testing, Video Editing
Mike Gaglione
Camera
Vitalii Makhnovets
Testing
Patrick Lathan
Video Editing
Tim Phetdara
Writing, Web Editing
Jimmy Thang
Intel i7-14700K vs. 13900K vs. 14900K Specs
| Intel Core CPU Specs | 14700K | 13900K | 14900K |
| Performance Cores | 8 | 8 | 8 |
| Efficient Cores | 12 | 16 | 16 |
| Total Threads | 28 | 32 | 32 |
| Cache | 33MB | 36MB | 36MB |
| Total L2 Cache | 28MB | 32MB | 32MB |
| Max Turbo Frequency | 5.6GHz | 5.8GHz | 6GHz |
| TDP | 253W | 253W | 253W |
While we occasionally call Intel’s 14th series CPUs "14th gen," this isn’t really a new generation as it’s the same architecture and isn’t deserving of a new generational number. Unfortunately, Intel has misbranded this in a way where it will lead people to expect more than what they're getting.
Intel Core i9-14900K CPU Benchmarks
Testing today will consist of the following types of benchmarks:
- Thermal benchmarks (CPU temperature)
- Gaming (framerate/FPS) benchmarks
- Power consumption testing
- Power efficiency
- Production performance in workstation-type applications
Intel i9-14900K Thermal Testing
Let’s start with thermals. A quick reminder here: The temperature that comes out of a datalog for a CPU is not like a synthetic benchmark score. It’s going to change -- a lot -- and that’s entirely based on the motherboard and the cooler, plus the workload used for testing.
In our tests, we use Blender rendering for a realistic and heavy daily use case. We also test with a 360mm Arctic Liquid Freezer II (find the review here) at 100% fan and pump speeds (you can find our acoustic and other thermal data in our cooler reviews for that). Finally, other than controlling the board to not blast MCE or something, we basically let it do its thing with regard to voltages. That’s because we’re testing an out-of-the-box state (we'd control these voltages if doing a cooler test). This means that boards which are less controlled and push higher voltages, sometimes out of laziness to guarantee stability, will perform far worse than boards which are more tuned. We don’t try to pick one or the other - we just use whatever platform makes sense for the test or is sent by the company. In this case, the ASUS Z790 Dark Hero served as the test platform for the 14900K.
Blender All-Core Temperatures on i9-14900K
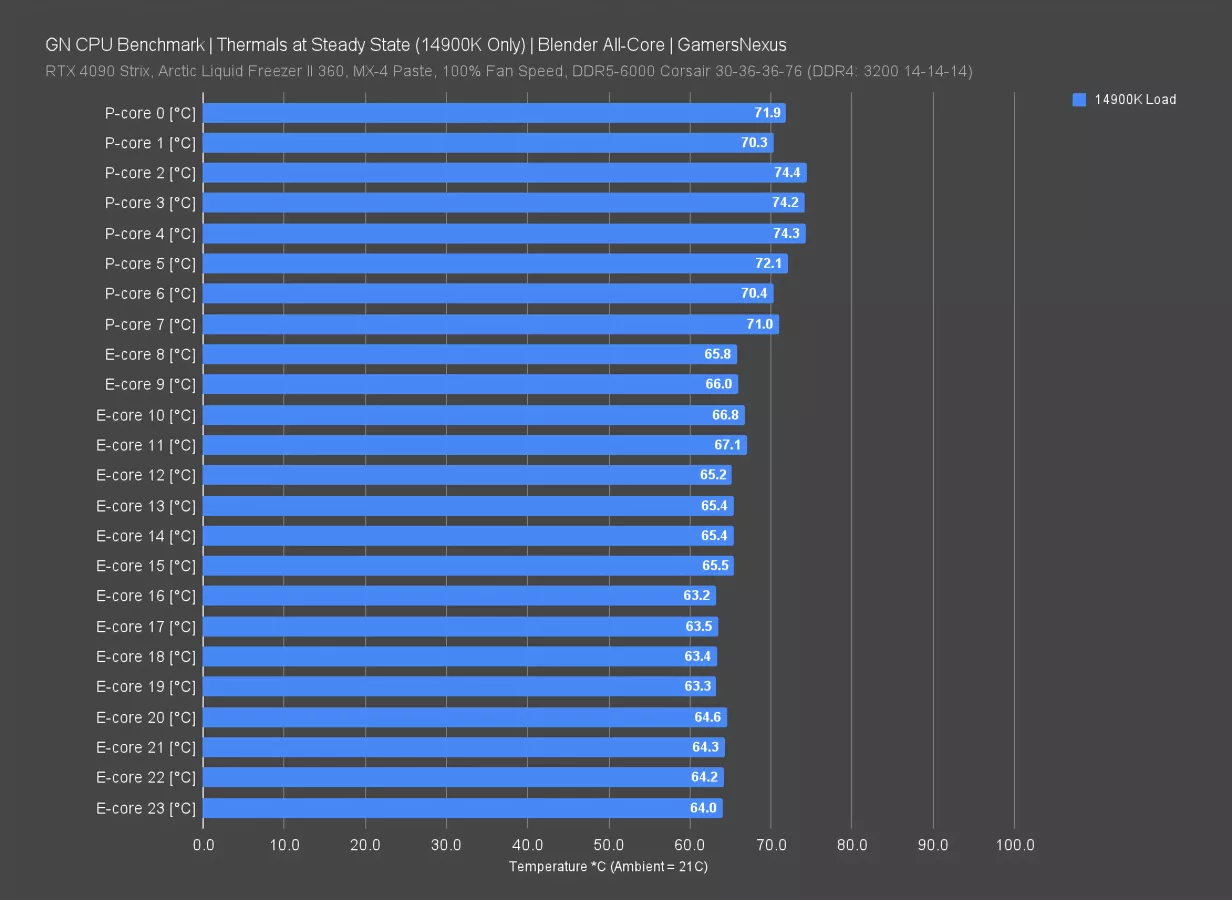
Here’s the chart -- first with just the 14900K bars. Logging every core at steady state and tested in a 21C environment, we ended up with temperatures that were shockingly consistent core-to-core. This is a lot better than we’ve seen in the past -- that much is typically the assembly quality and how the IHS is attached to the silicon. Our peak-to-peak delta for P Cores is around 4 degrees. We’re in the 70s with a 360mm cooler in a 100% core workload. It’s at least mostly under control. In gaming scenarios, this would be lower. We’ve seen others have been in the 90s, and depending on the cooler they used and the motherboard, that’s completely possible. The Dark Hero is logging via software as having a 1.172VCore. If that is to be trusted, that’d be low enough to explain the thermals. But sometimes this number isn’t an accurate representation.
Looking at some other temperatures, the 14700K ran higher overall in this workload despite being in the same board and under the same cooler. Some of this might just be the STIM quality and lid attachment by Intel. It’s not an unreasonable swing.
These can definitely be way worse with a BIOS that blasts voltage. One thing’s clear though: You really should be running a high-end liquid cooler if not planning to undervolt and if you want to run it under Intel guidance with heavy workloads.
Intel i9-14900K Power Benchmarks
This testing will look at the power consumption as measured at the EPS12V cables.
i9 Generational Power Consumption
Given our years of data we’ve collected on CPUs with the same methods, we can provide some interesting perspective with a look-back at all the i9 CPUs we’ve tested recently. Remember that the i7 existed as the top-end before this, but we have those numbers in our 14700K review.
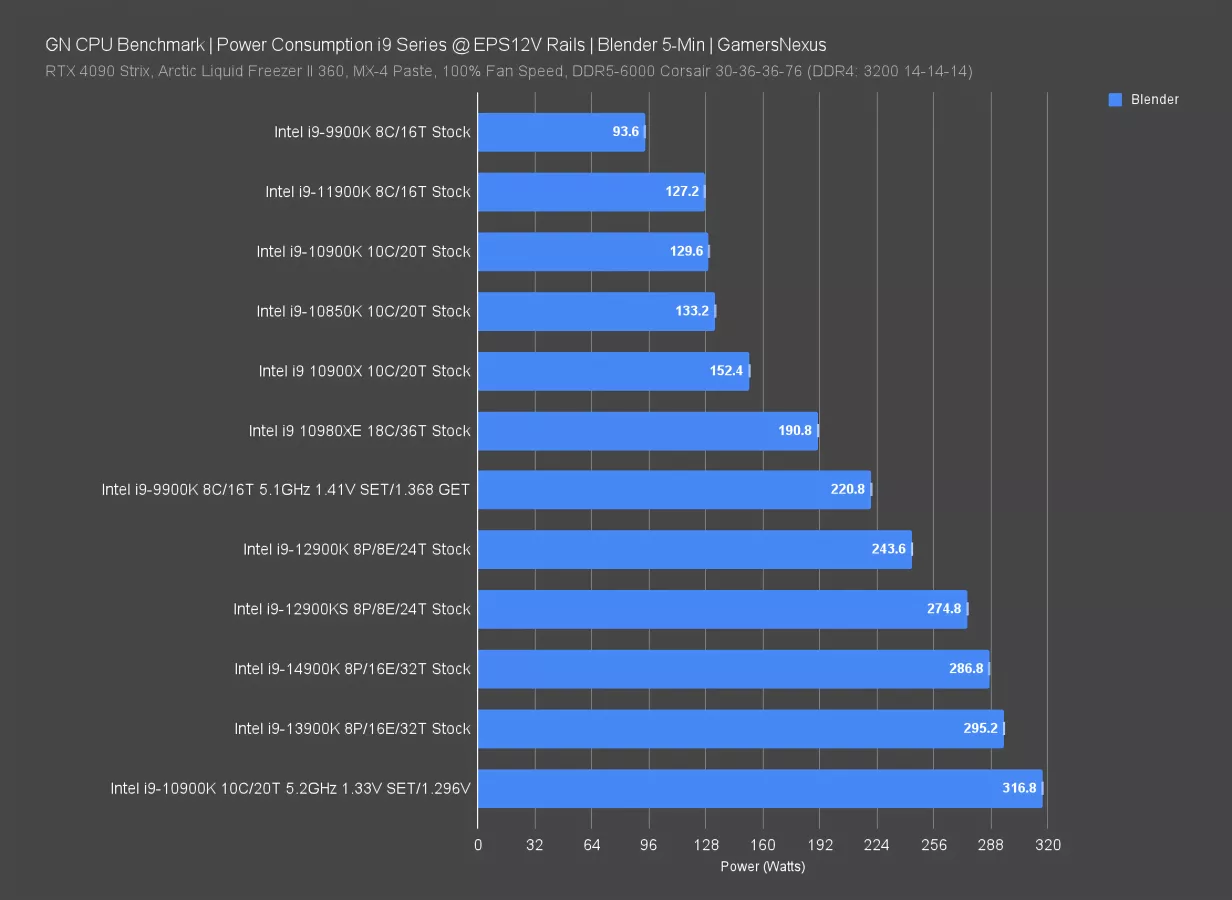
Here’s the i9 chart. The 14900K’s 287W is close to the highest we’ve tested, and aside from the 13900K, it is the highest stock draw we’ve tested. The 13900K isn’t far off, though -- they’re about the same. Dating back to the original Intel i9 desktop CPU, the i9-9900K, power consumption was as low as 94W all-core. The 11900K was 127W, about the same as the 10900K. The Intel HEDT CPUs -- like the 10900X and 10980XE -- pushed closer to 200W. That the 10980XE was lower power consumption than the 14900K is crazy considering how it was received at the time. We see a generational climb with the 12900K going to 244W, then 275W with the KS SKU.
There’s a clear trendline here.
Power Consumption Benchmarks - i9-14900K vs. AMD
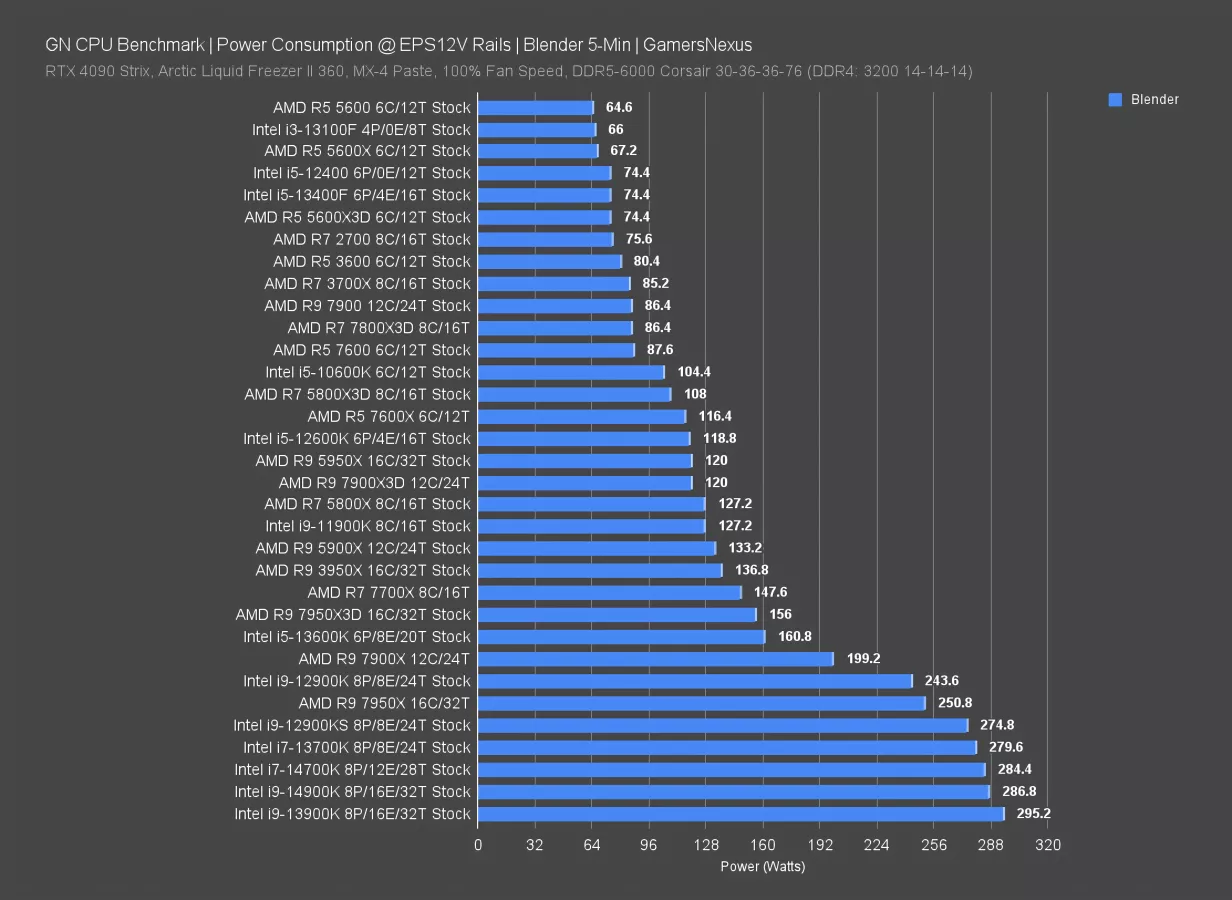
Here’s a look at more comparative power numbers: We measured the 14900K at 287W at the EPS12V cables -- meaning just the CPU and VRM efficiency losses -- when tested under an all-core Blender workload. That has it about the same as our 13900K, which was 295W previously. The 14700K’s 284W is about the same. AMD’s 7800X3D maxes-out at 86W all-core (although, to be fair, Intel won’t be at 100% CPU load in games like it is here -- but AMD is still advantaged). The 7950X CPU pulls 251W without Eco Mode, also below Intel’s 14900K.
This is a power-hungry CPU, and they’re only going to get harder to cool if Intel keeps going this direction. Overclocking also becomes more challenging -- although maybe in a new way -- in that it’s the cooling that begins to hit diminishing abilities to tame this power draw. Undervolting makes way more sense, and Intel boards traditionally have overvolted even at stock, so there’s room for improvement.
Power Efficiency Benchmark
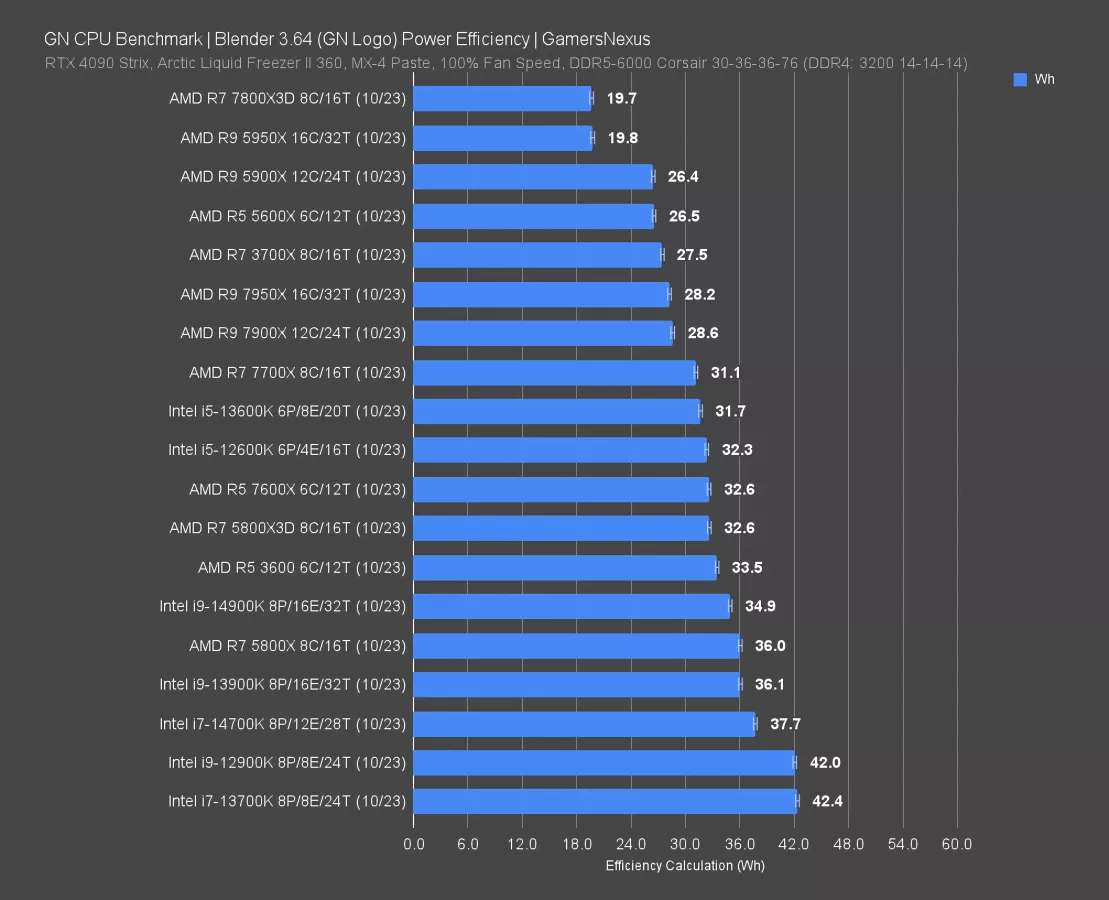
Energy efficiency testing will help us understand what all of this really means. For this number, we’re calculating the energy consumption during a Blender workload. Our metric is watt-hours, which allows us to see how much energy consumption there is for a CPU to complete the same workload. That means we’re normalizing for the workload, not the time. Lower is better.
The 14900K is towards the bottom-end of the chart. It’s more efficient than the 13900K, 14700K, 12900K, and 13700K -- and AMD’s 5800X, barely -- but it’s far below top performers like the 5950X and 7950X. It’s not the least efficient we’ve tested, but Intel is pushing its thermal envelope and power draw higher and higher.
Intel i9-14900K Production Benchmarks

Blender Benchmarks
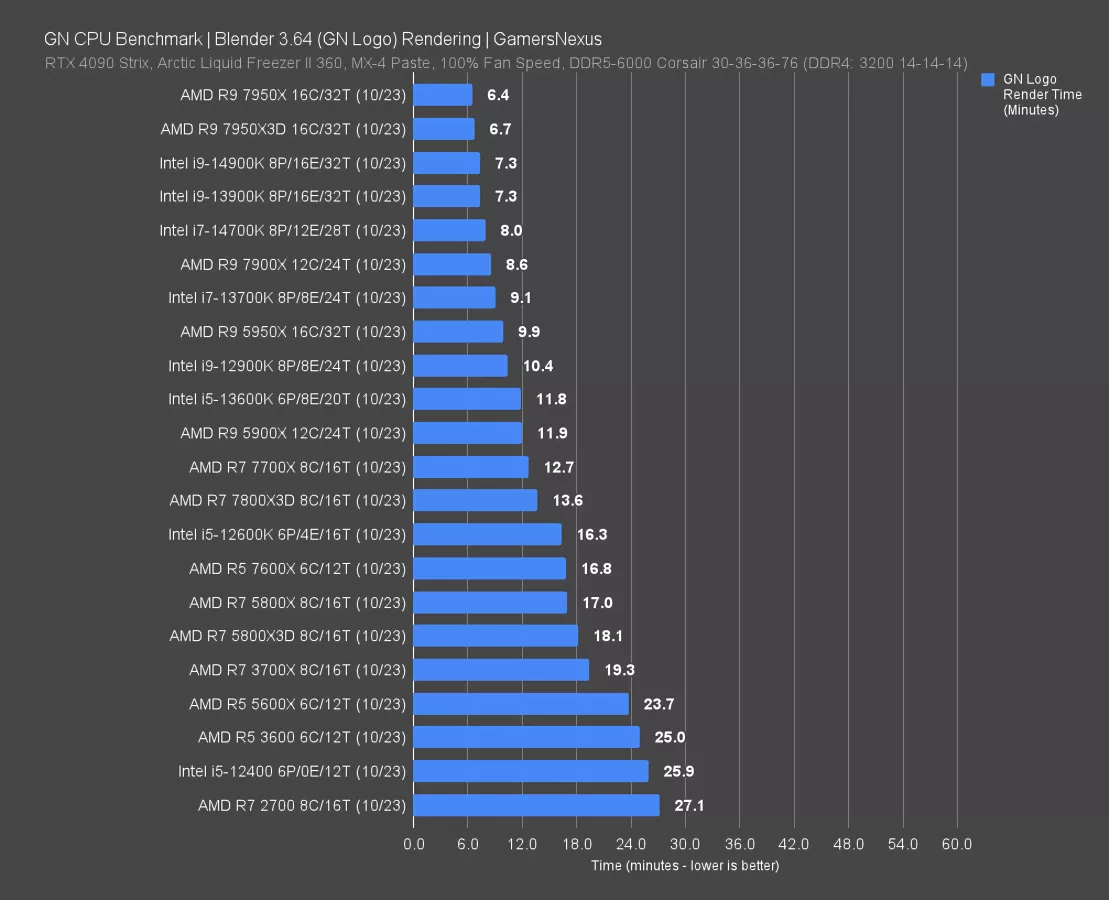
Blender is up next. Because this spawns one render tile per thread on the CPU, it scales well with higher thread-count processors.
The 14900K required 7.3 minutes to complete the render, which has it dead equal to the 13900K.
This has the 7950X and its 6.4-minute result ahead of the 14900K with a 12% time reduction. Against the 7900X, Intel’s lead is 15%, and against its own 14700K, it leads by 8.8% time reduced.
7-Zip Compression
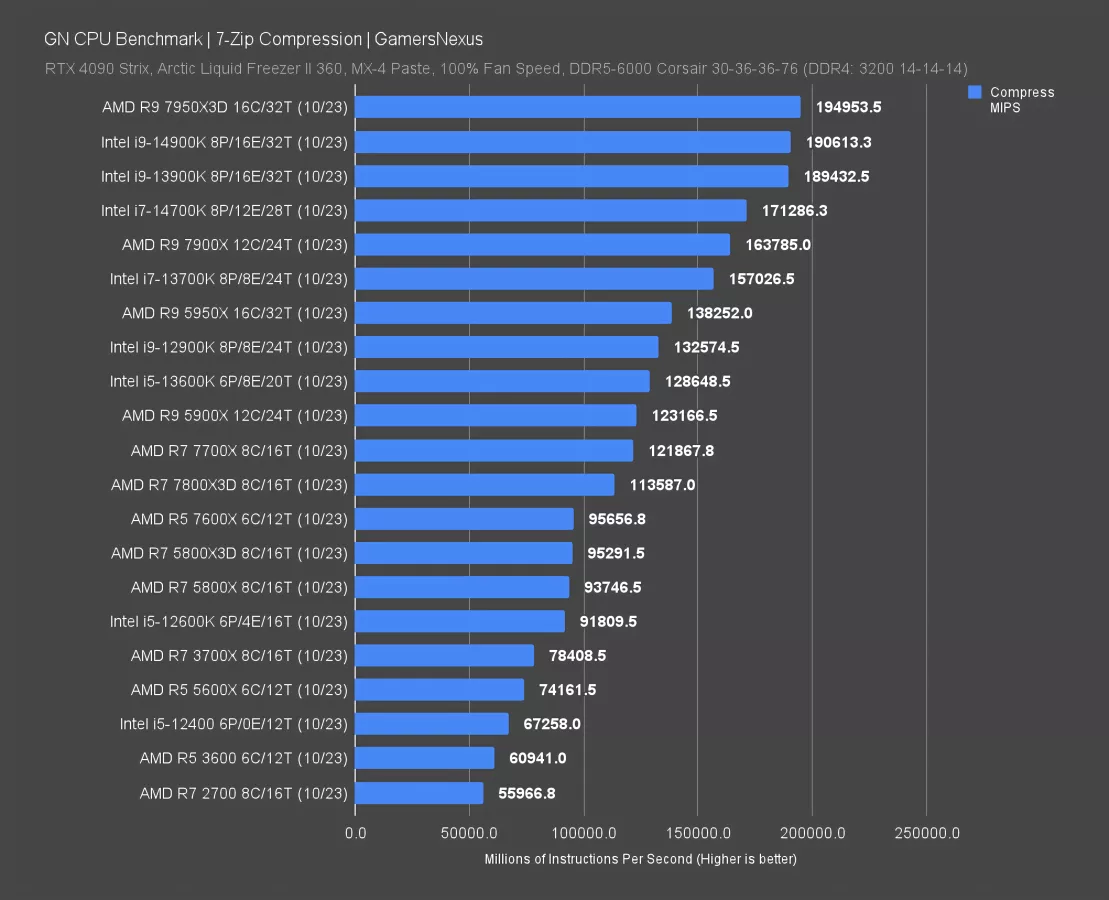
In 7-Zip file compression testing, the 14900K completed 191K MIPS, or millions of instructions per second. That has it about tied with the AMD 7950X and ahead of the 13900K by -- get ready for it -- 0.6%. So again, we’re basically re-reviewing the 13900K. Against the 14700K, that’s an 11% improvement -- if you can call total and utter stagnation an improvement.
7-Zip Decompression
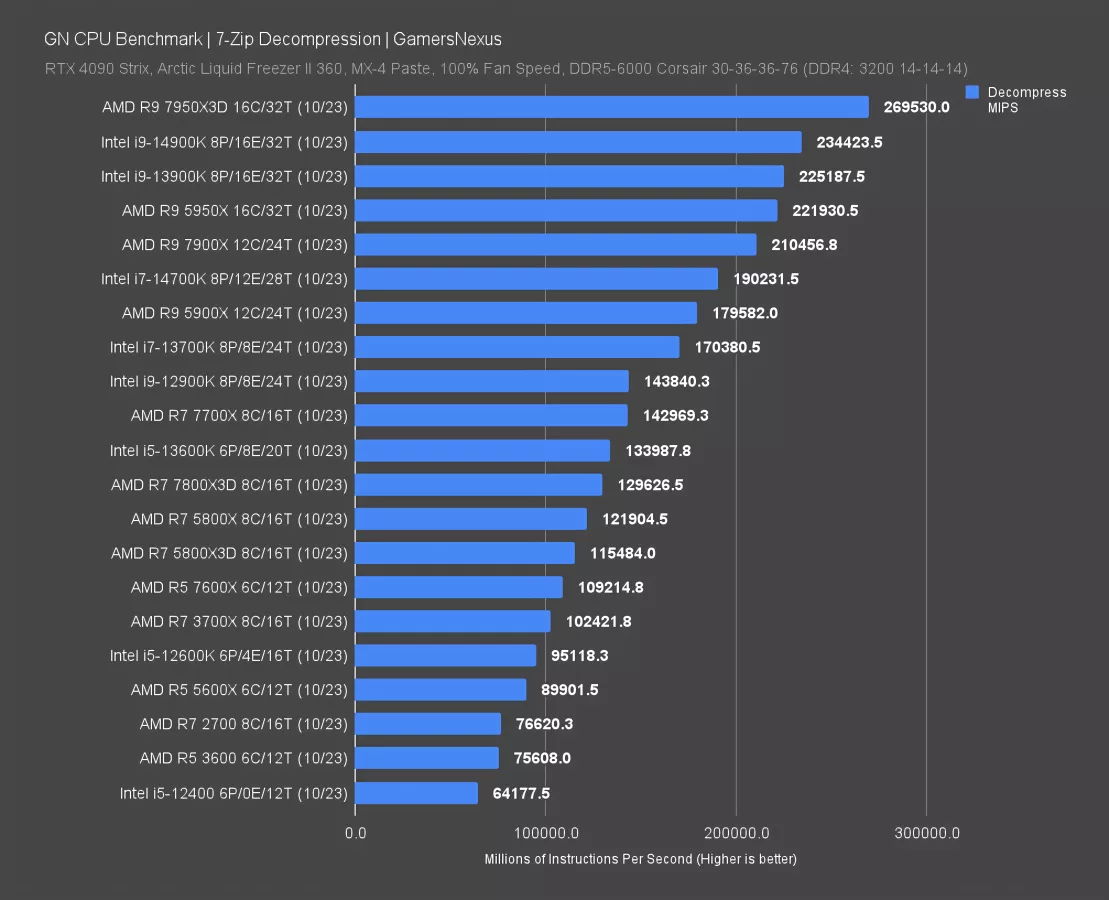
In decompression, it’s a little bit better at least -- the 14900K improves over the 13900K by 4% here. That has it behind the 7950X, not too distant from the 5950X, and leading the 14700K by 23%.
Adobe Premiere
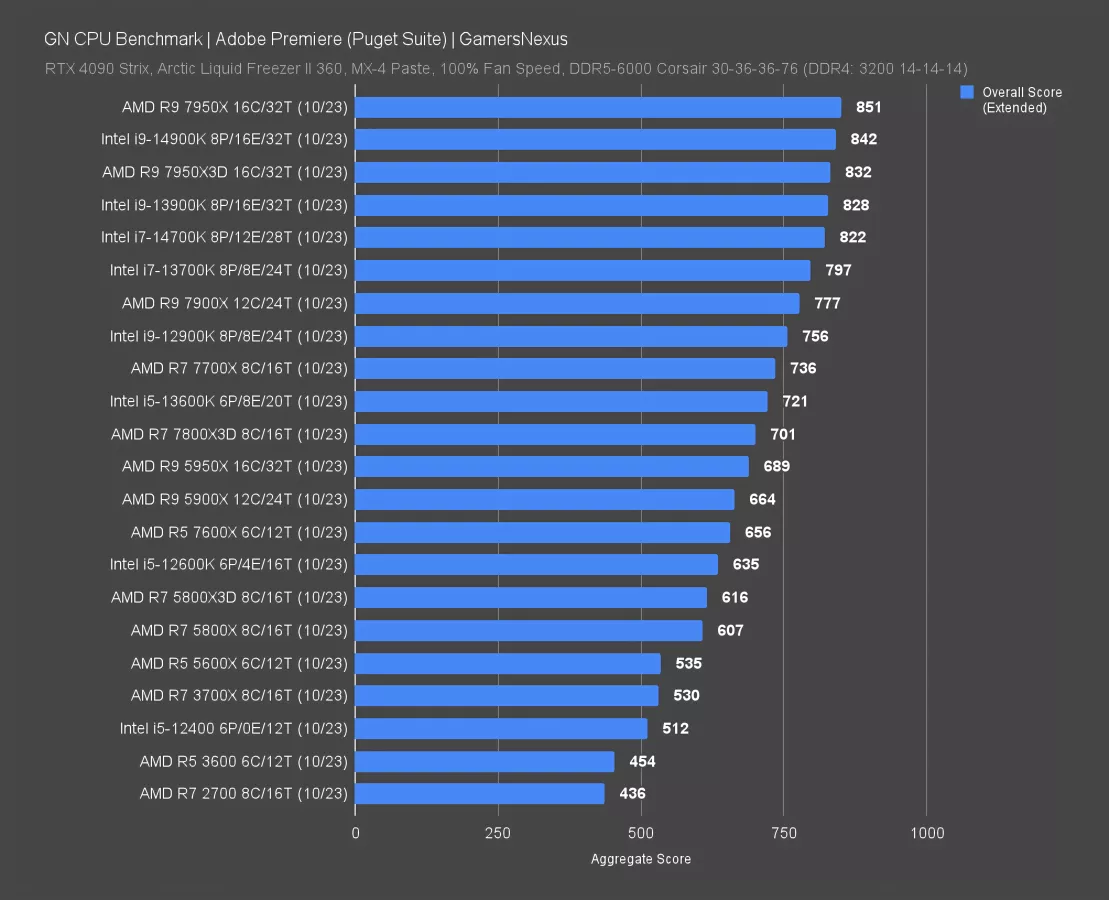
Adobe Premiere benchmarking via the Puget Suite is up now. This one has the 14900K at 842 points, leading the 13900K by 1.7%. So nearly margin of error, basically. Marvels like this are what Intel will be remembered for.
When the improvement is so large that we need a decimal place just to illustrate that it’s not within test variance, that’s when you know it’s a good generational uplift. In fact, it’s so exciting that we’re not even going to talk about any other production tests.
Intel i9-14900K Gaming Benchmarks
Time to move on to games. We were just so blown away by the production tests that we needed to take a break from reading through those charts -- it nearly brought us to tears just how much better this CPU is.
Rainbow Six Siege CPU Benchmarks
1080p/Very High 14900K Tests
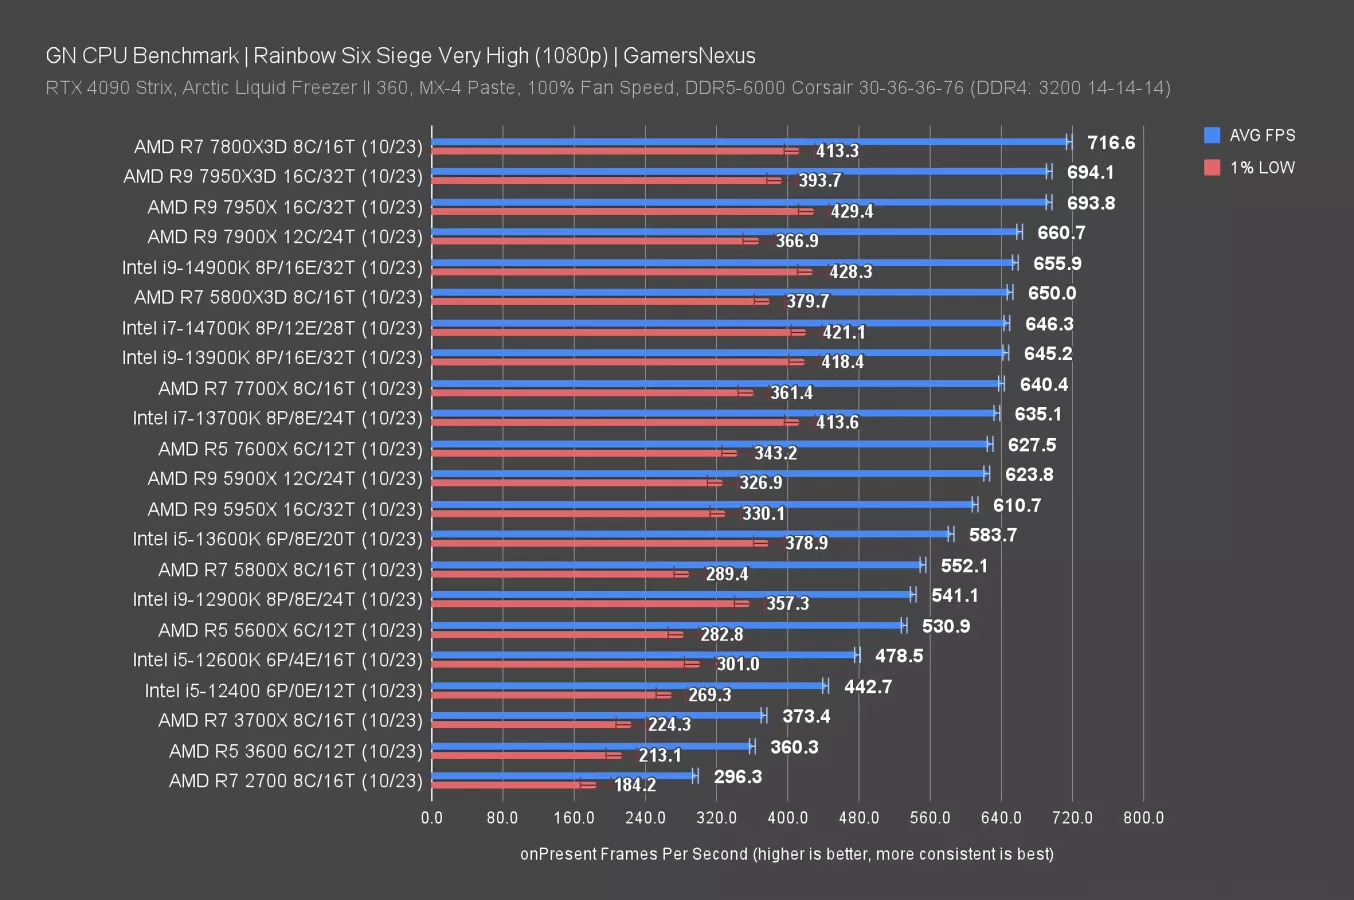
In Rainbow Six Siege at 1080p, the 14900K ran at 656FPS AVG. That has it ahead of the 13900K by 1.65840049597024%, a world-record for length of a percentage number in a GamersNexus review. Remarkable.
The positioning has it just ahead of the 5800X3D -- so Intel gets its wish. It is now technically ahead of the last-gen AMD X3D CPU. The 7000 series still leads, but it’s the small steps that count. Like beating something based on an architecture from years ago.
Against the 14700K, the 14900K is also under a 2% benefit.
Rainbow Six Siege - 1440p
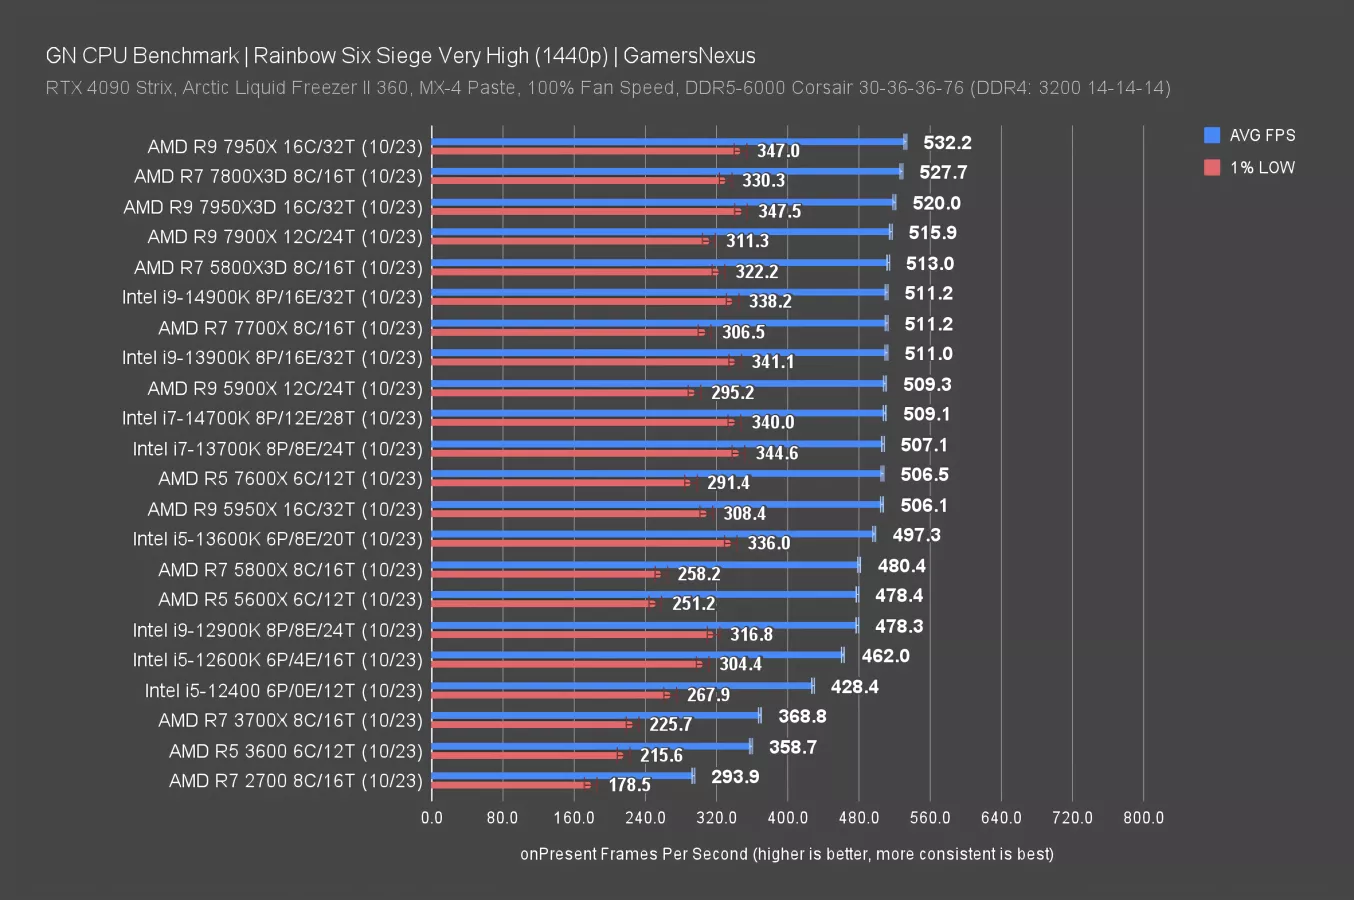
At 1440p, it’s even more riveting. The 14900K leads the 13900K by 0.2 FPS AVG. As you all know, Rainbow Six is a highly competitive game -- so that 0.2 FPS matters. We should give some perspective here. The extra 0.2 FPS AVG means your average frametime is shorter by 0.0008ms.
F1 2023 CPU Benchmarks
1080p/High
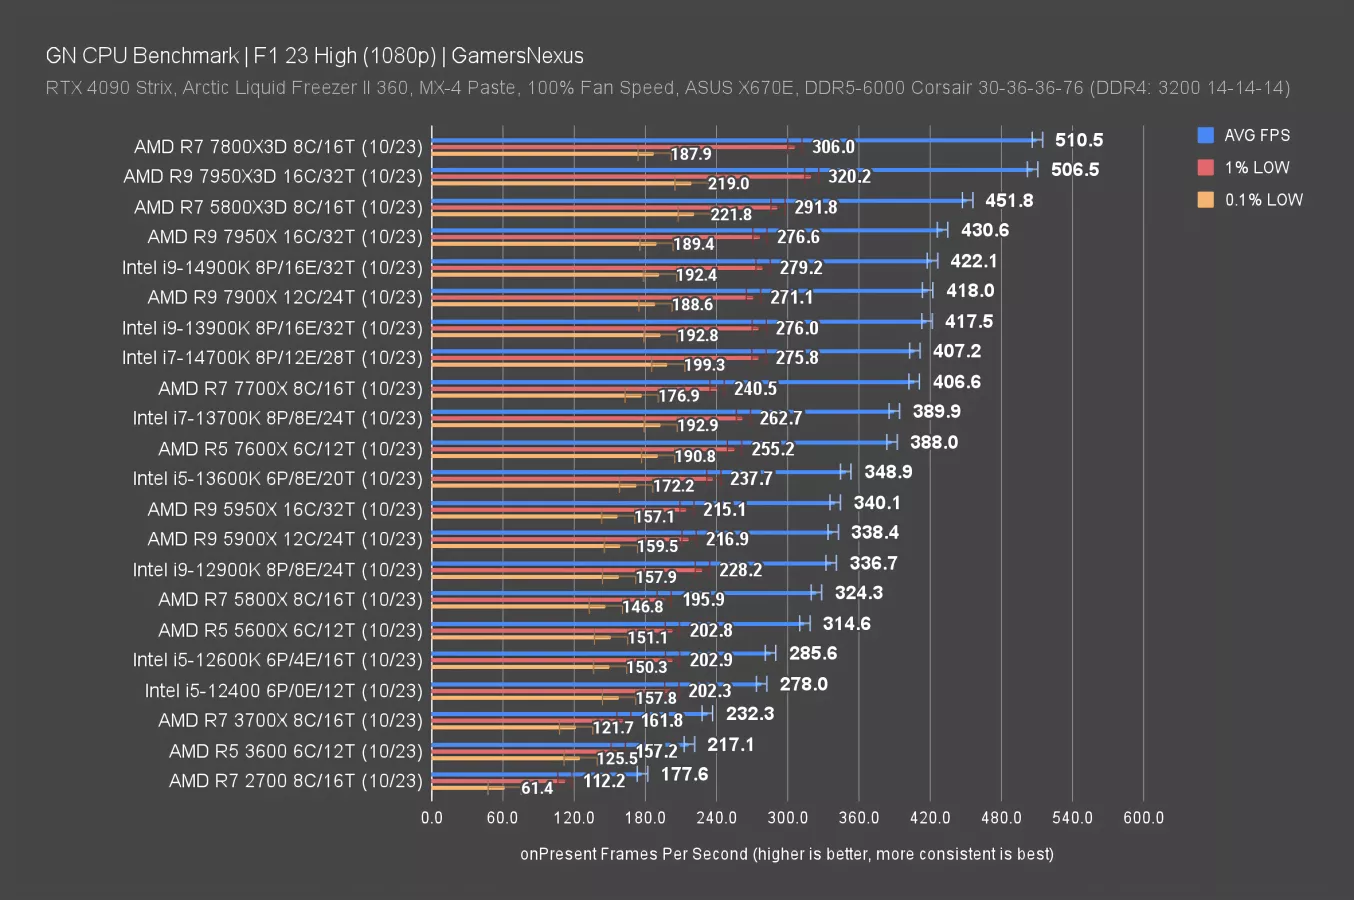
In F1 2023, the 14900K measured at 422FPS AVG, ahead of the 13900K by 1.1%. The difference genuinely is impressively tiny. If you’re picking between this and the 14700K, you’d be looking at about a 3.7% improvement moving to the i9.
Intel is struggling to meet AMD’s 5800X3D’s performance, which sits 7% ahead of the new i9. The 7800X3D is 21% ahead.
F1 2023 - 1440p
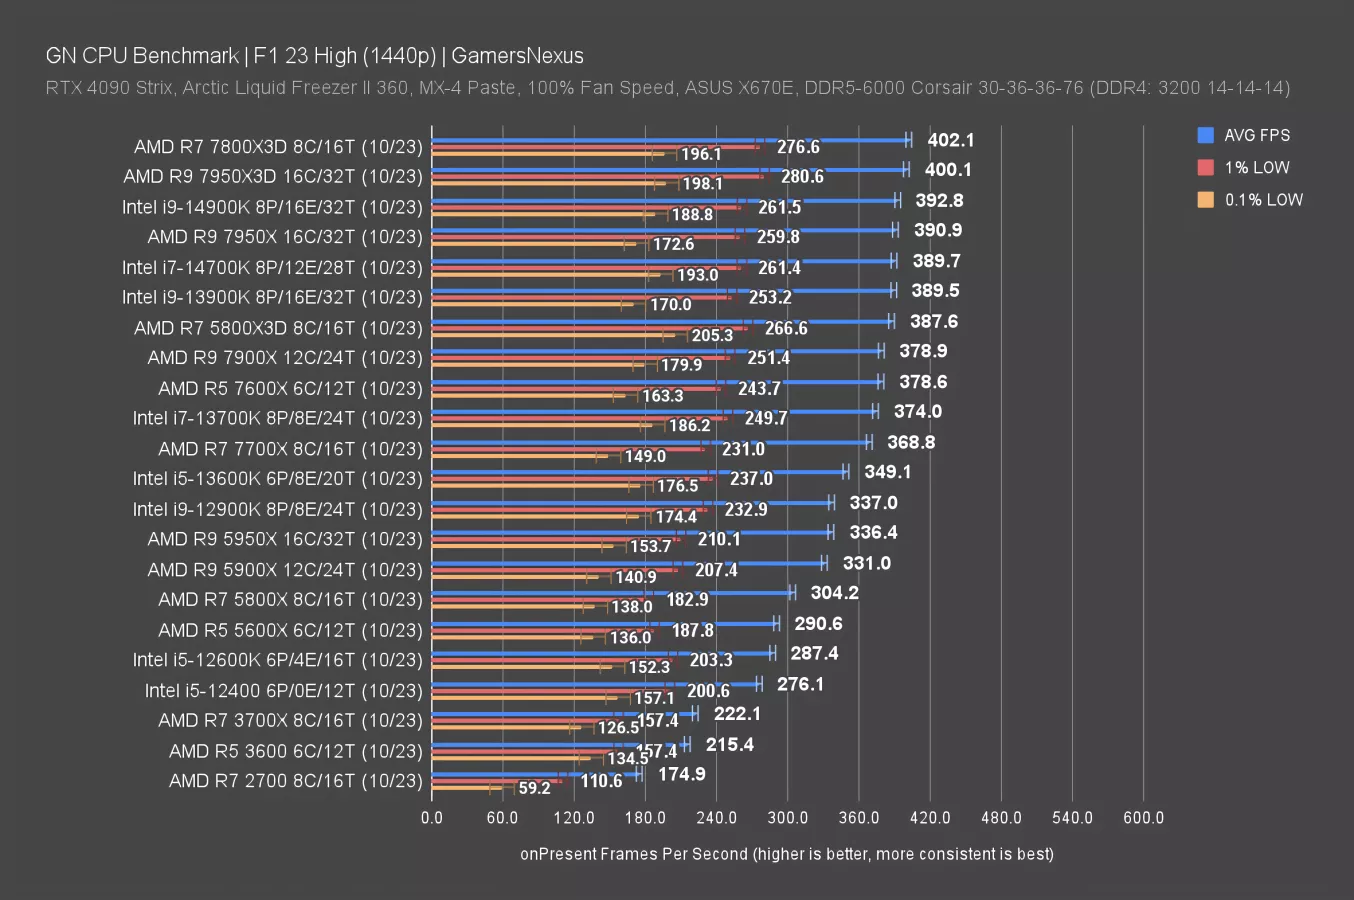
At 1440p, we get the usual reduction of scaling as a result of imposing a GPU limitation at the top-end of the stack so let’s move forward.
Baldur’s Gate 3 CPU Benchmarks
1080p/Medium
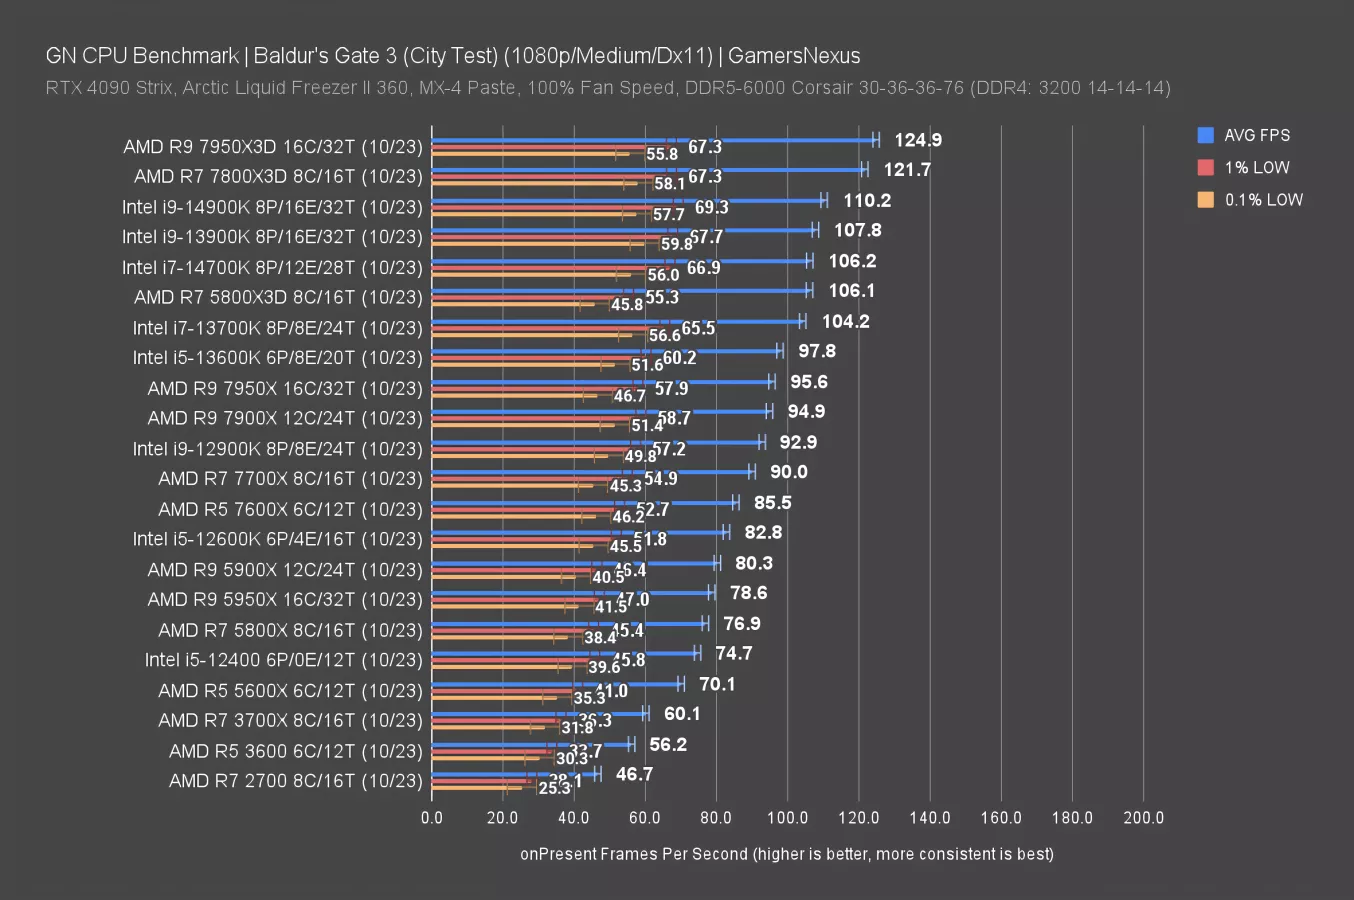
Baldur’s Gate 3 is up now. In this one, we again see the X3D CPUs soaring to the top of the charts. The 14900K landed at 110FPS AVG, gracing us with a 2.2% uplift over the 13900K while allowing the 7800X3D a lead of 10.4%. The 5800X3D isn’t far behind Intel and ends up about tied with the 14700K.
Baldur’s Gate 3 - 1440p
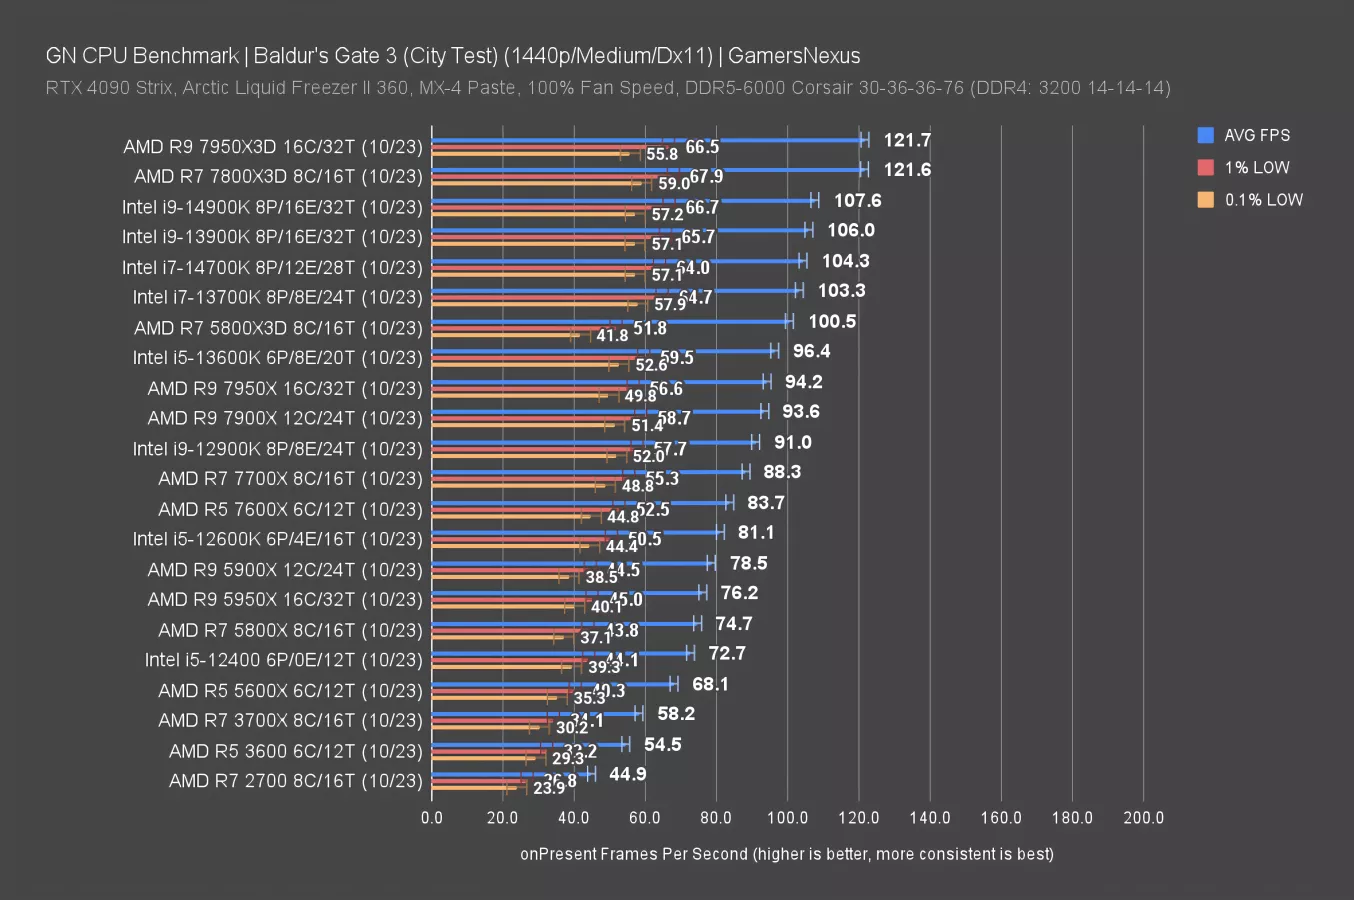
1440p, predictably, is the same. We’re CPU-bound even at this higher resolution in this title, so the 14900K’s positioning remains largely unchanged.
Cyberpunk: Phantom Liberty
1080p/Medium CPU Benchmarks
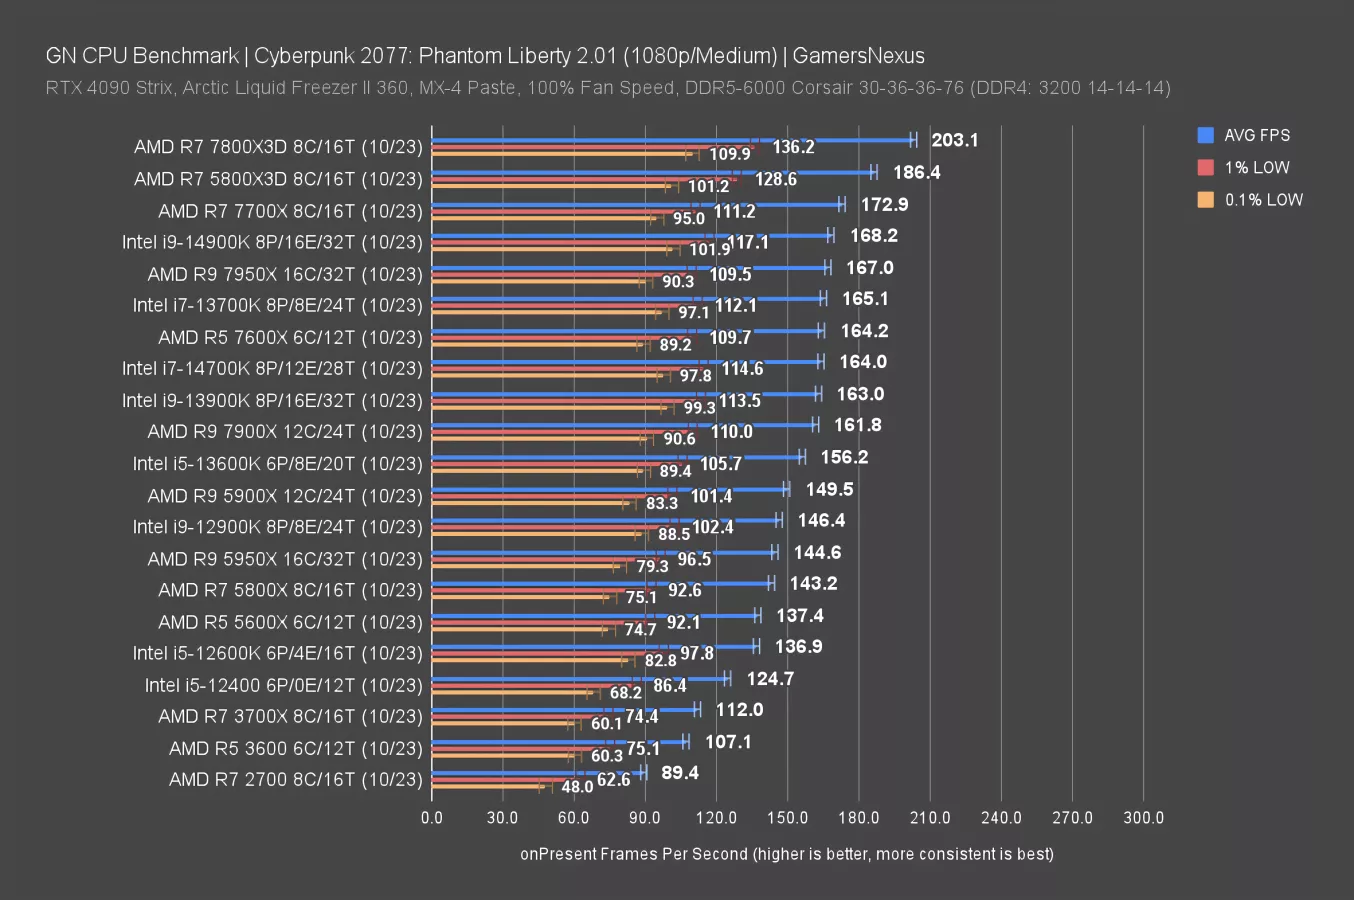
In Phantom Liberty at 1080p, the 14900K’s 168FPS AVG result had it ahead of the 13900K by 3.2%. The 14700K and 13700K are within run-to-run variance of each other, as we mentioned last round. All the Intel CPUs are getting clustered around the same spot. The 7800X3D, 5800X3D, and 7700X remain stronger options in this one. You can learn more about the other data and the testing for this one in our 14700K review. We’ll skip 1440p since it’s more of the same.
Final Fantasy XIV
1080p/Maximum CPU Benchmarks
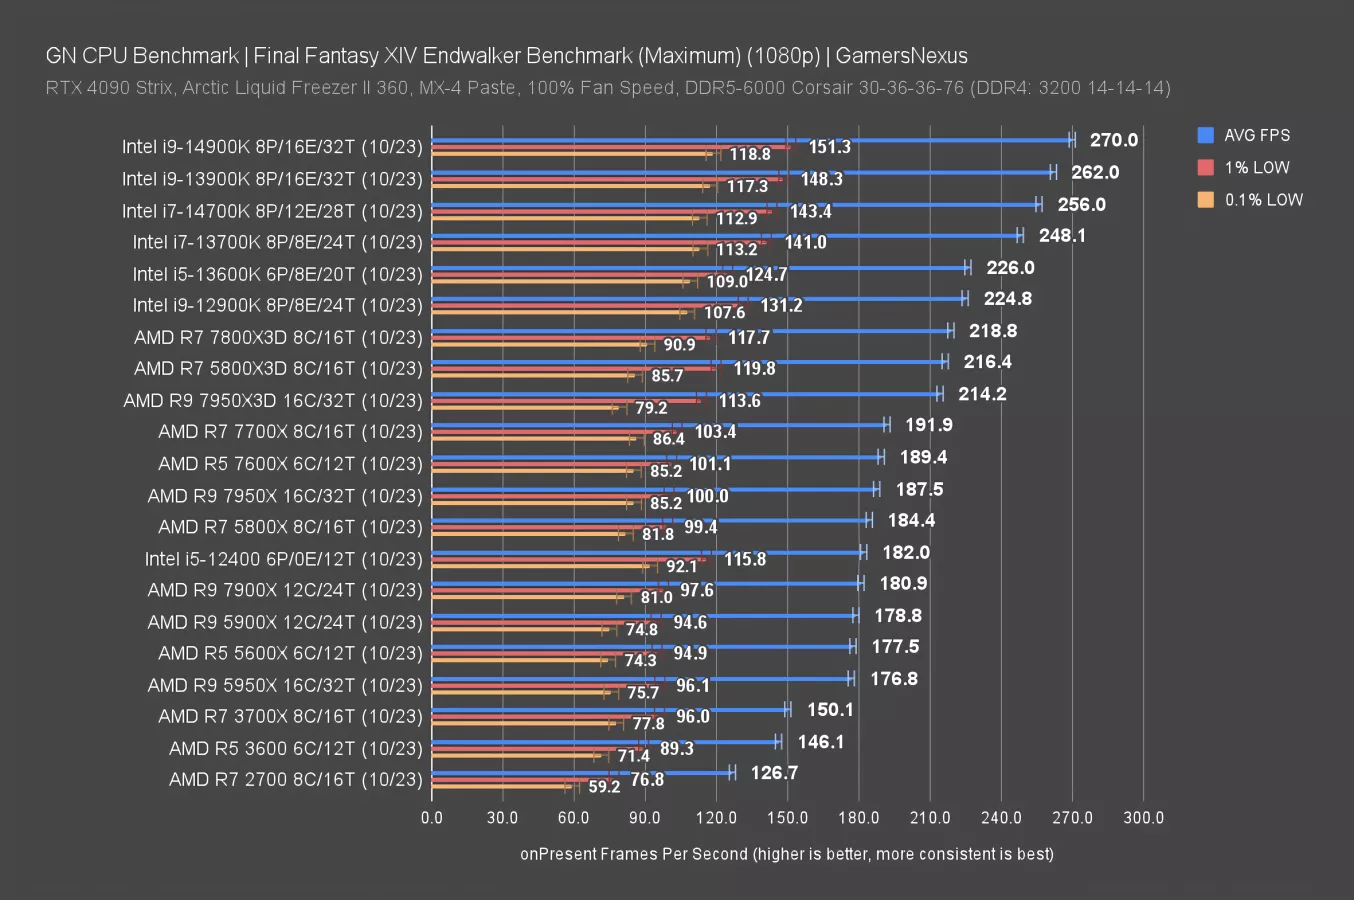
Final Fantasy gives Intel some hope -- it tends to do well in this game.
The 14900K is now formally the chart leader in FFXIV. They’ve done it. Intel wins -- we’ll stop here. Review over. The headline is now clear: Intel i9-14900K is the new king.
With a crushing 3.05% lead over the 13900K, and a likewise mind-bending 5.47% lead over the 14700K, this battle has been decided.
But, to be fair, this is a title where you’d want to favor Intel if you expect to be CPU-bound. The lead is a meaningful 23% over the 7800X3D for the 14900K.
Final Fantasy 14 - 1440p
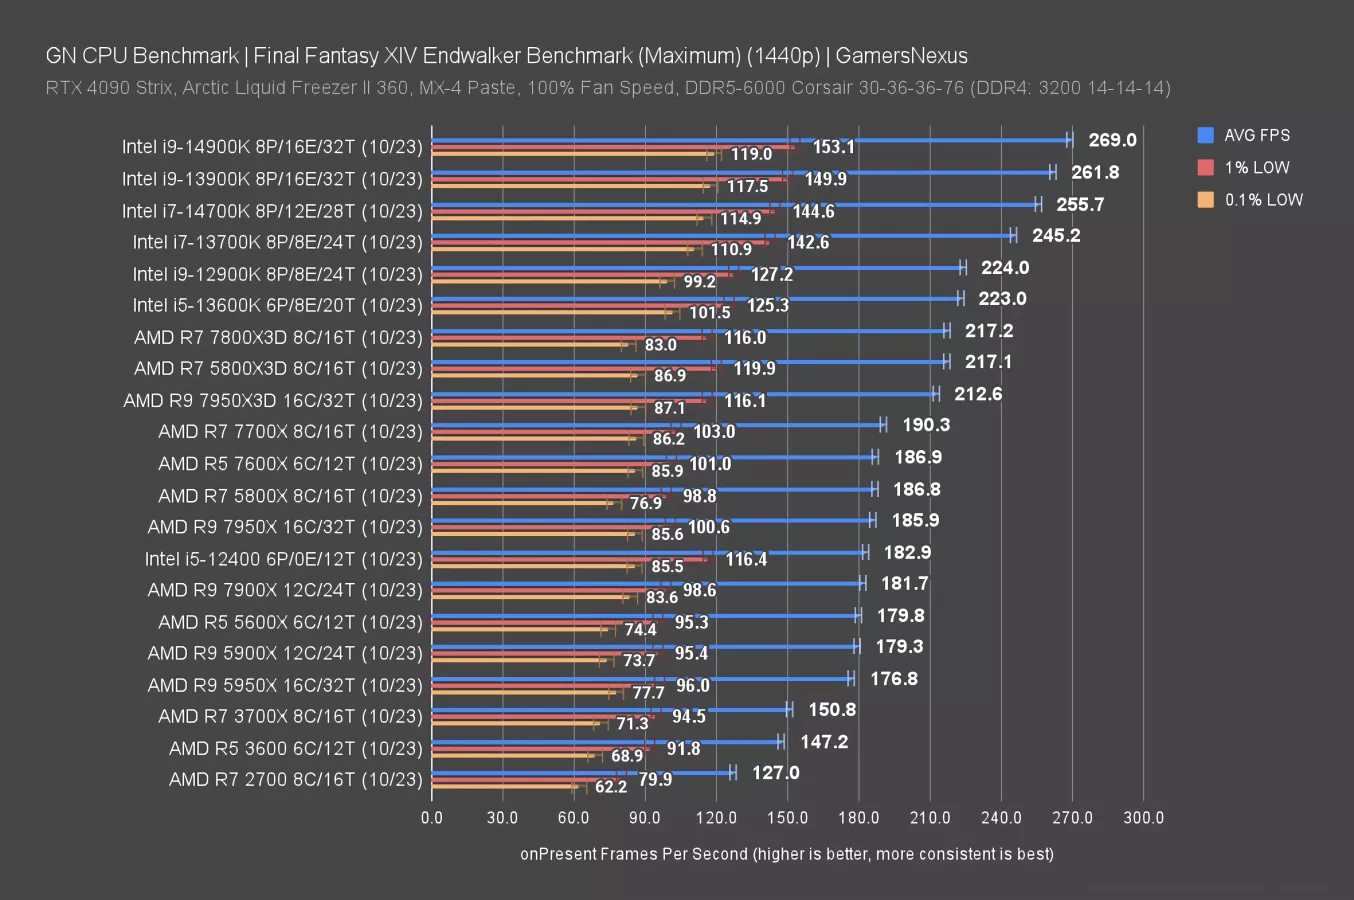
The 1440p scaling for this game is about the same. The framerate has marginally changed, but we’re still CPU-bound and they still stack-up largely the same way.
Stellaris
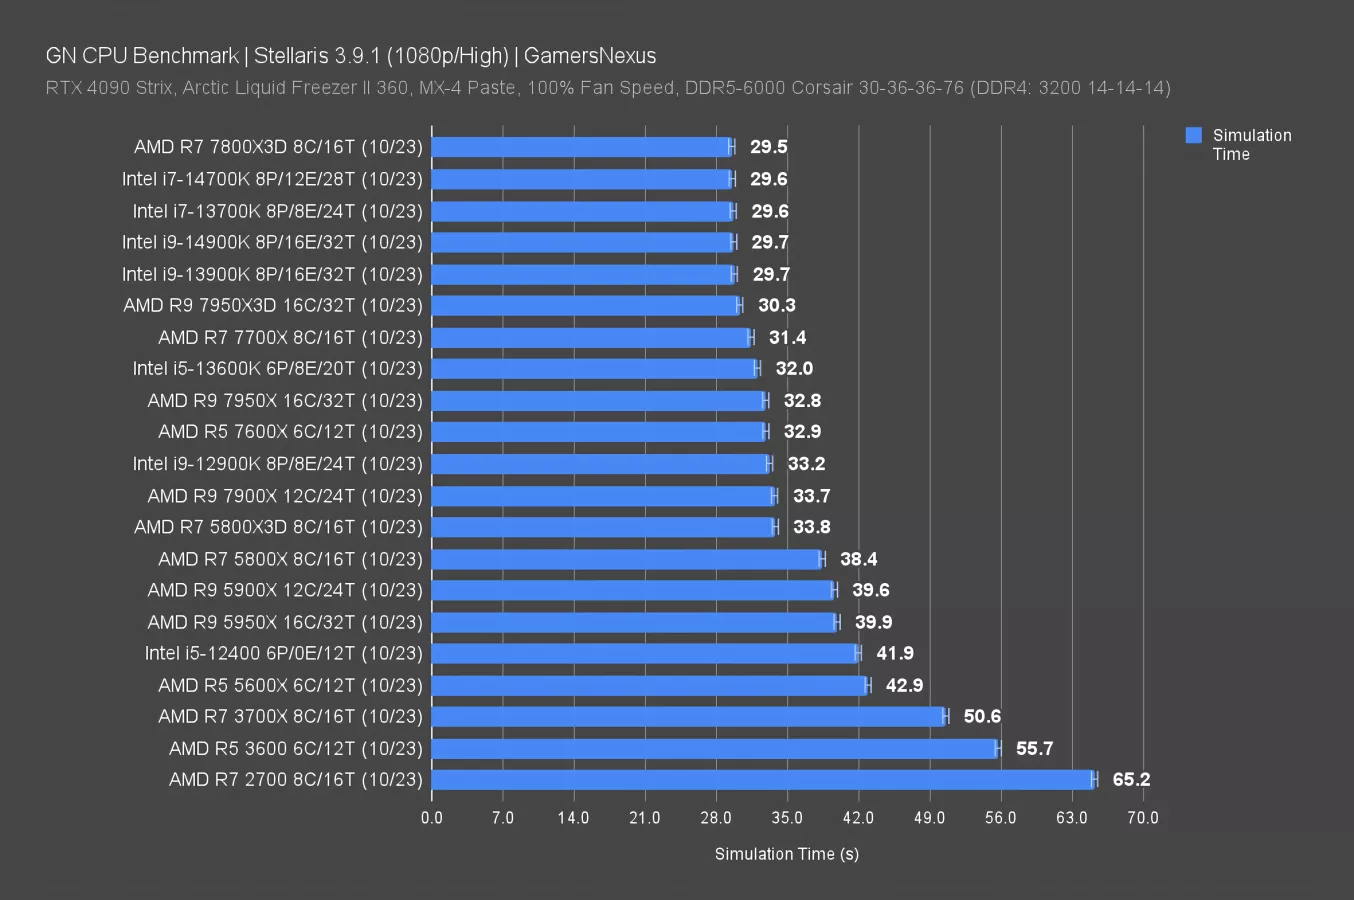
Stellaris is up now, measuring simulation time instead of FPS. We mentioned this in our 14700K review, but the game isn’t scaling much once we’re at around 30 seconds for simulation time. They’re all jumbling up to look the same due to other limitations. In our 14700K review, we asked those of you who are serious players to email your most complex, late game save file to our [email protected] inbox so we can see if we can find more scaling in the game for the next round.
In this one, there’s no difference -- but for once, it’s not the fault of Intel’s so-called-14th-so-called-gen, it’s just that we’re bound elsewhere. It might be hard to tell 0% generational scaling from 0% test scaling but it’s just 0% test scaling.
Starfield CPU Benchmarks
1080p/Low
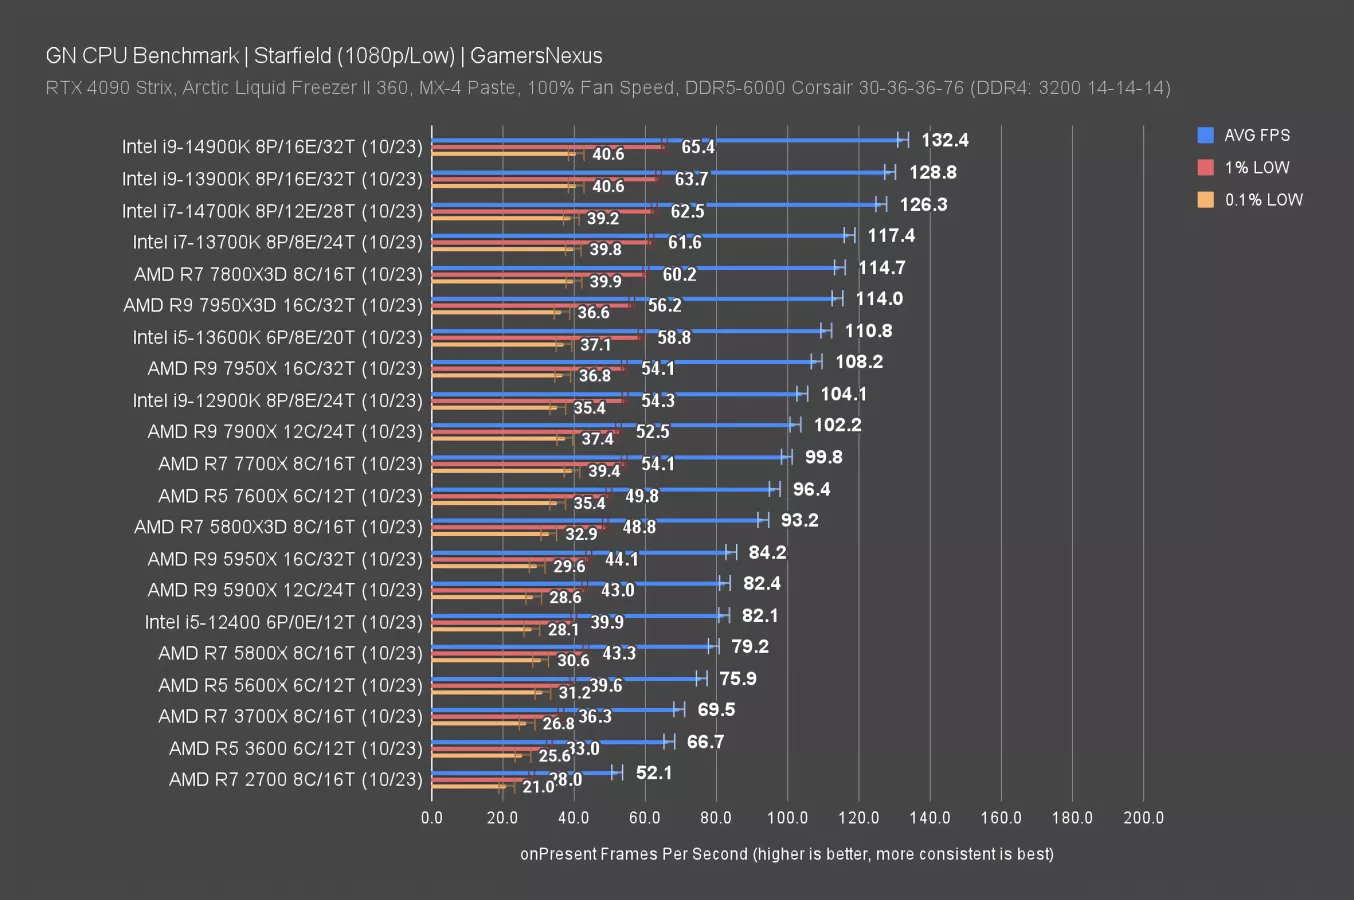
Starfield is another one that shows scaling for Intel -- sort of. Or at least, Intel has managed to wedge itself at the top of the chart to supplant the pesky X3D CPUs.
The 14900K’s 132FPS AVG has it 2.8% ahead of the 13900K, with the 14700K not meaningfully far behind. You’d never notice the difference between 126FPS and 132FPS, so selecting between them isn’t that important. The lead over the 7800X3D is at least more meaningful, at 15% improved.
Starfield - 1080p/High
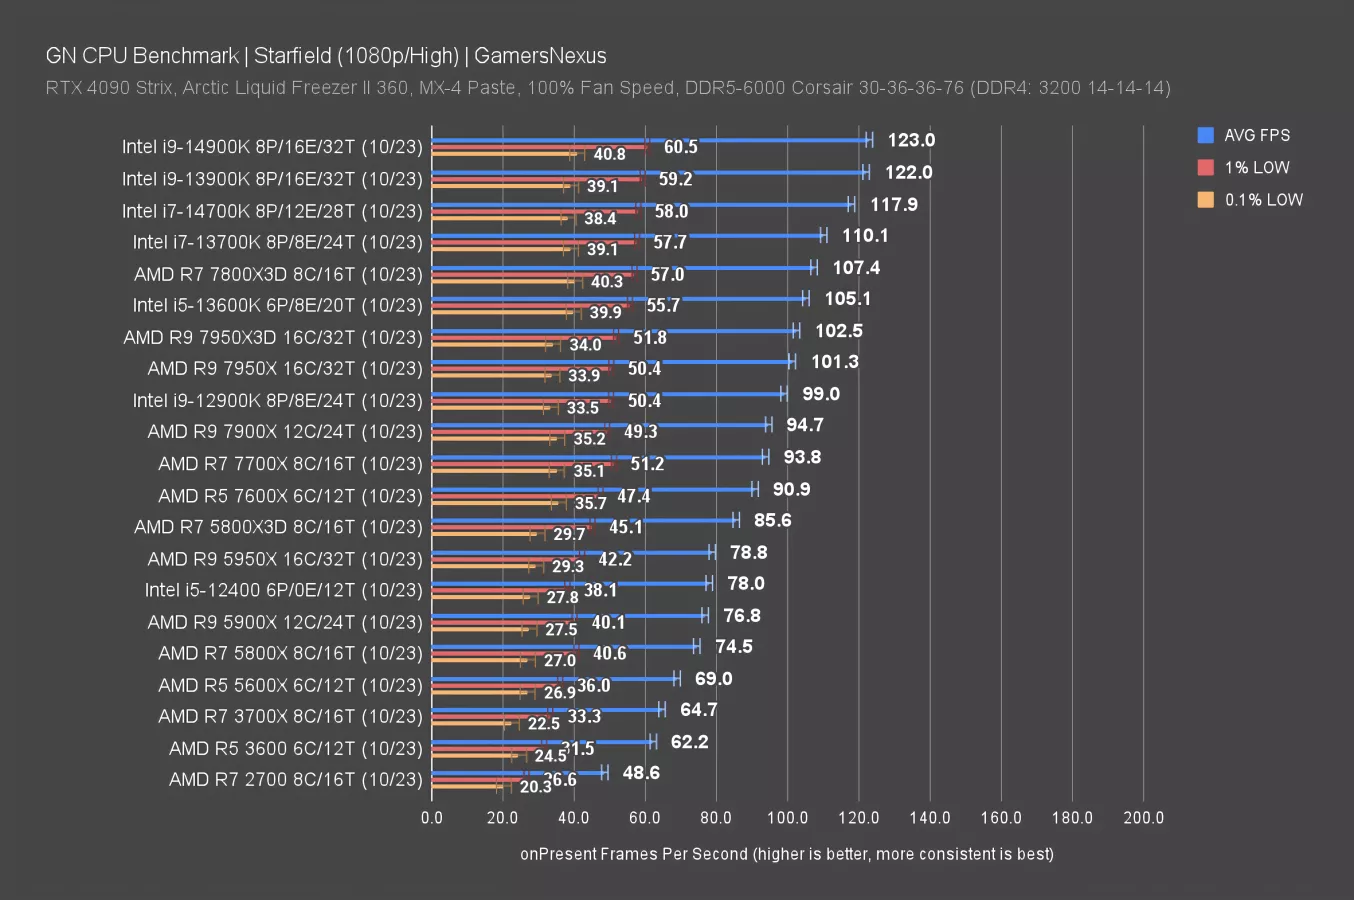
Scaling is similar at 1080p/High, with a lower FPS due to a heavier workload. But overall, the lineup is mostly unchanged.
Intel i9-14900K Conclusion

The Intel i9-14900K is disappointing. There’s very little change in stock performance and it isn’t deserving of a new generational number. This whole CPU series feels like grasping at straws. If you already had your eyes set on the 13900K, between it and the 14900K, you should just buy whatever CPU is cheaper.
On AMD’s side of the fence, the 7800X3D deserves the most attention in gaming, though the 5800X3D still warrants attention if you’re on AM4. On the production side, you should look at the 7950X and maybe the 7900X.
Update: We've since published our Best CPUs of 2023 round-up to help with your choices.