The i7-14700K is a desperate launch from Intel that comes across as a slightly pre-overclocked 13700K
The Highlights
- The i7-14700K is the successor to 2022’s 13700K and features a faster max turbo frequency of 5.6GHz
- This CPU is a weak launch for Intel and it performs mostly on par with the 13700K in games
- Compared to the 13700K before it, the 14700K features four additional E-cores, useful for all-core loads
- Original MSRP: $440
- Release Date: October 17, 2023

Making a new generation of product is hard. It requires years of development, engineering feats amounting in new CPU architectures, and sometimes it even needs new process nodes. Intel’s 14700K does NOT represent that ethos.
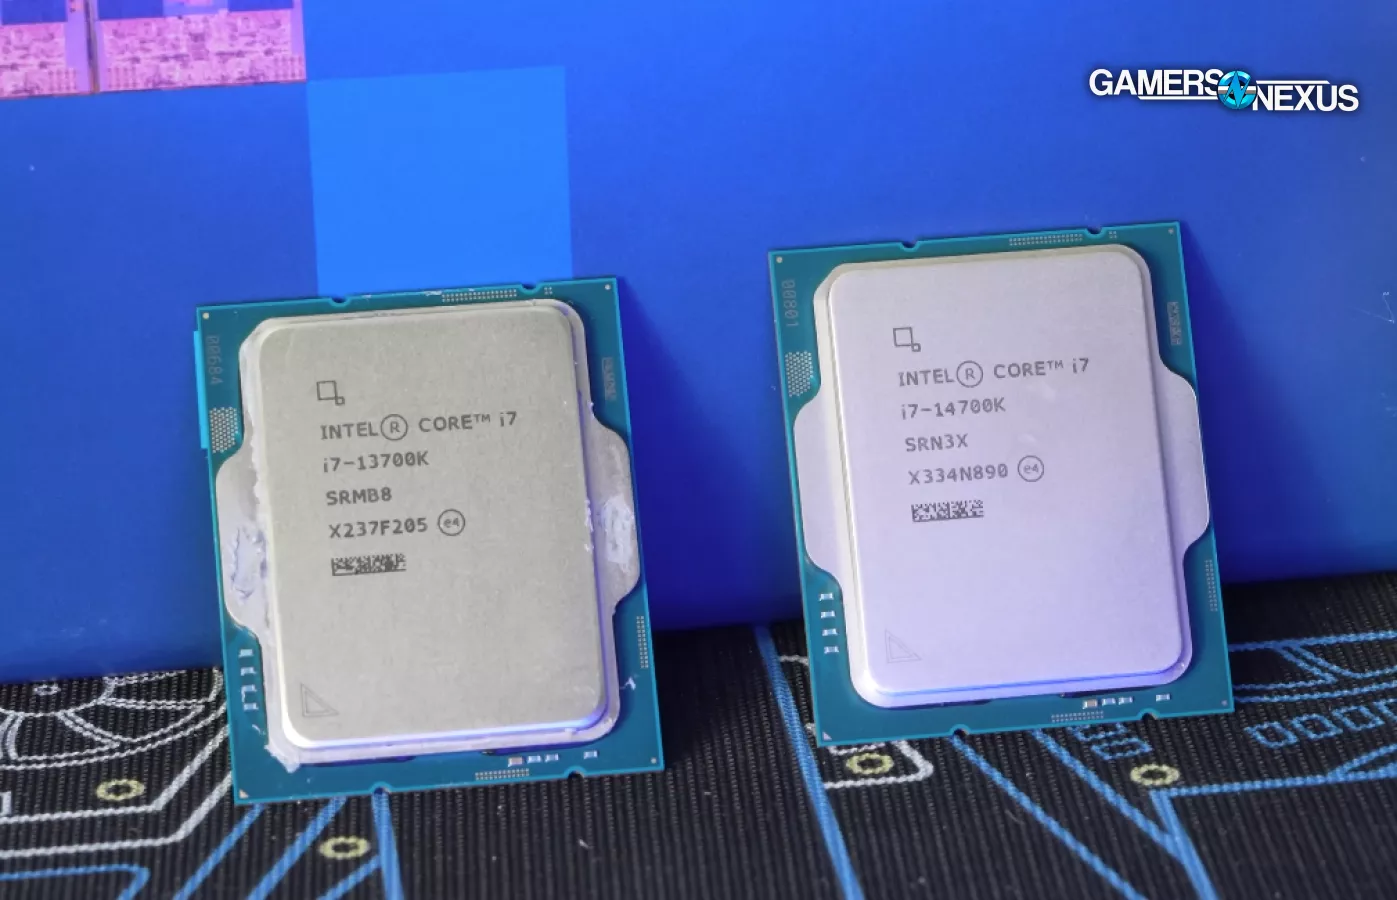
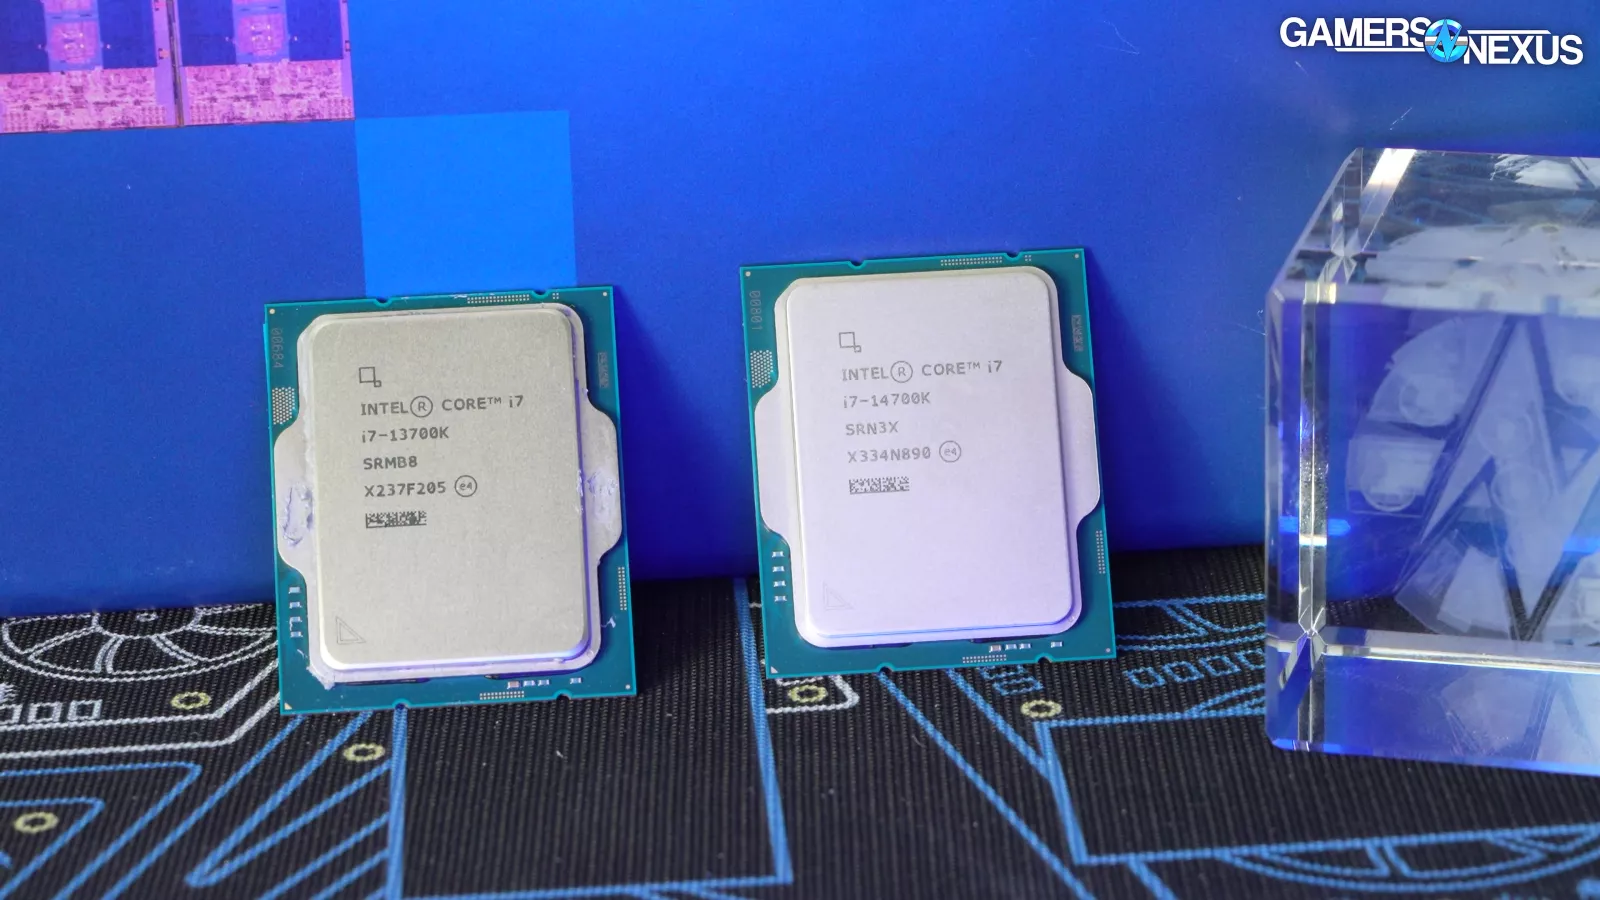
Out of the recently released 14600K, 14900K, and 14700K, the latter represents the only processor in the lineup of 3 that is remotely interesting. That’s because it has more cores than its predecessor, the 13700K, moving to 8P/12E/28T from 8P/8E/24T.
This CPU launch is Intel’s attempt to buy time while it works on its next actual architectural generation. We think the company was caught off-guard by how well AMD’s X3D CPUs (like the R5 5600X3D we reviewed) did in the gaming market, and now they’re scrambling to shove anything out the door to try and retain some of those buyers.
Credits
Testing, Host, Writing
Steve Burke
Testing, Video Editing
Mike Gaglione
Camera
Vitalii Makhnovets
Tim Phetdara
Testing
Patrick Lathan
Writing, Web Editing
Jimmy Thang
Intel Core i7-14700K Specs
| Intel Core CPU Specs | 14700K | 13700K | 13900K | 14900K |
| Performance Cores | 8 | 8 | 8 | 8 |
| Efficient Cores | 12 | 8 | 16 | 16 |
| Total Threads | 28 | 24 | 32 | 32 |
| Cache | 33MB | 30MB | 36MB | 36MB |
| Total L2 Cache | 28MB | 24MB | 32MB | 32MB |
| Max Turbo Frequency | 5.6GHz | 5.40GHz | 5.8GHz | 6GHz |
| TDP | 253W | 253W | 253W | 253W |
Product Overview
Intel’s new processors are called “Raptor Lake Refresh.” Instead of using the same generational naming though, Intel wanted to make the "13" a "14" to sound better -- so they did that, immediately setting expectations of something better than a couple percentage points of uplift. The “new” CPUs have higher clocks, but the 14700K in particular is different. It climbs from an 8 P-core, 8 E-core, 24-thread configuration to an 8 P-core, 12 E-core, and 28-thread configuration. So it has an extra 4 cores -- they’re E-cores, but they’re still cores. Those extra E-cores will mostly be useful in fully threaded applications like Blender, but will be of limited usefulness in games.
Frequency also climbs: Intel says its max turbo frequency is now 5.6 GHz, up from 5.4 GHz on the 13700K. Likewise, E-core turbo has climbed 100MHz. The base clock is the same, however.
Cache has also increased (which makes sense, since the core count increased). The official Intel site claims an increase of 4MB in L2 Cache. The TDP remains the same.
Current Pricing Lineup
The new CPUs land at the same MSRP as the original 13 series parts, but the 13 series has been reduced in price since launch.
That’s $440 or so for the 14700K at launch, although it has been dropping already on Newegg, $415 at launch for the 14700KF, but now the 14700KF is cheaper, and $625 for the 14900K that we reviewed. Unfortunately for Intel, its own 13 series parts are not the prices they were at launch: The 13900K can regularly be found for around $550 to $570, with the 13700K now lower as well.
So instantly, Intel will struggle to fight its old value.
But we need to look at the current landscape for pricing for any of this to matter.
Believe it or not, the R7 5800X3D (Amazon) is still regularly available (Newegg). You can check out our review of that chip here. You can typically find AMD’s 8-core, 16-thread CPU for around $320, making it one of the best values on the market -- especially as a drop-in upgrade for AM4 users. That's fierce price competition against Intel, especially if you eliminate the need to purchase a motherboard by making new use of an older AM4 platform. The 7800X3D is another relevant competitor and one that we reviewed here. That CPU typically goes on sale for under $400.
Power Consumption Benchmarks

Intel i7 Generational Power Consumption
Our power consumption tests will start with a chart showing only the Intel i7 series, then we’ll look at the comparison. We’ve been fortunate to collect power data on over 150 CPU configurations over the years, so we can start splitting that into different charts.
This test looks at all-core power consumption in a Blender workload.
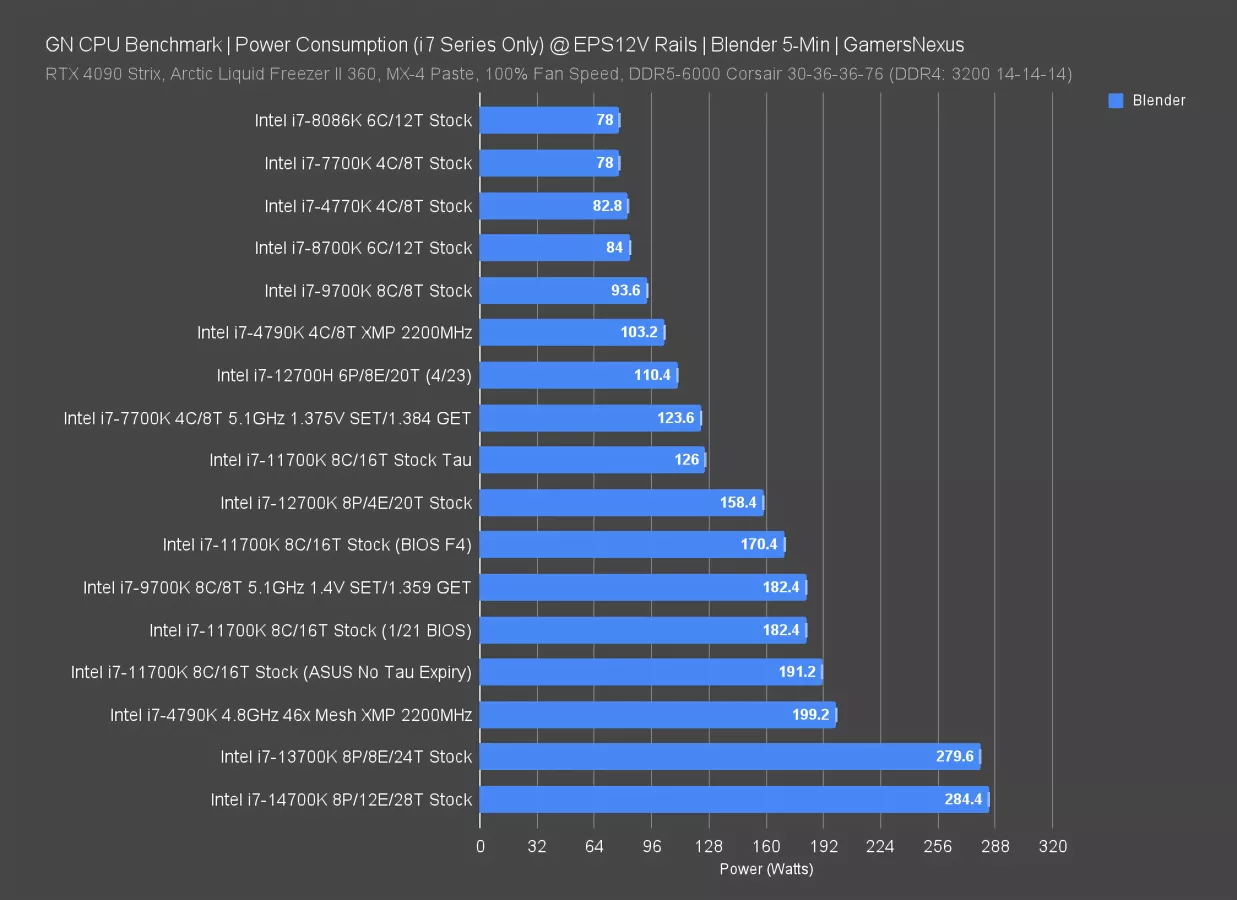
In an all-core workload with Blender, the Intel i7-14700K consumed 284W at the EPS12V rails during the test. That’s power to the CPU and VRM efficiency losses, not total system power -- so it’s a power-hungry chip. But not much different from the 13700K, which itself was around 280W. The Raptor Lake generation is the most power-hungry in all-core of the i7s.
If we look back further, the 12700K pulled around 158W in the same test, around the same as last gen’s i5-13600K (shown in the next chart). Going back further, the 11700K was around 126W, although using various BIOS options would push it closer to 200W, but 126W was the Intel guidance. The 7700K overclocked pulled about the same, or 78W when stock. The 8700K was about 84W. As a final reference, the 4770K -- the oldest currently on this chart, although we have other prior data -- pulled 83W.
The 13700K kicked it into a higher gear, and the 14700K followed. The extra few watts is close enough to call them the same.
CPU Power Consumption Benchmarks & Comparison
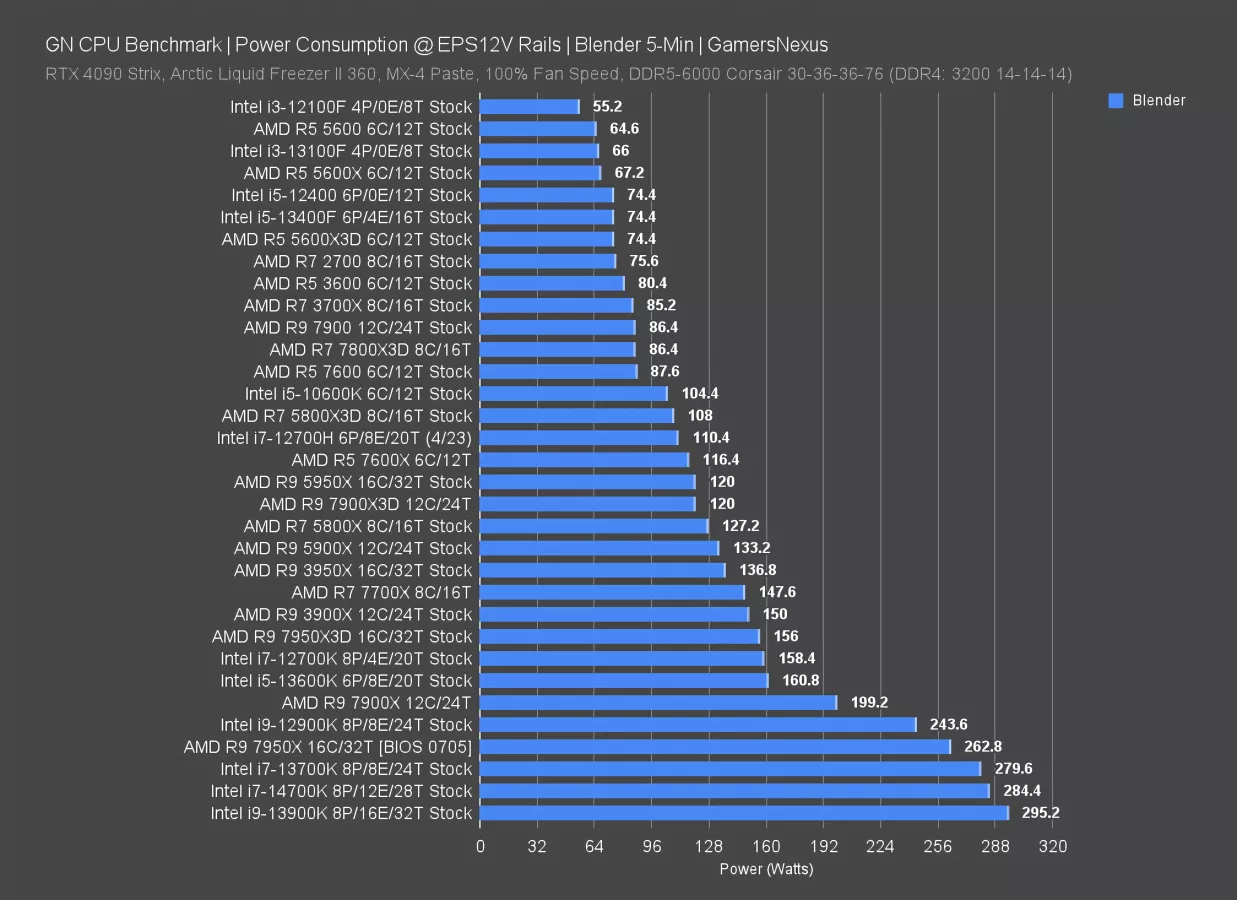
Here’s info on many more recent options, including competition.
The Intel i7-14700K outdraws the 7950X and its 263W consumption by an impressive 20W -- and not the good kind of impressive. The 14700K also outdraws the 12900K. AMD’s most dangerous competitor in gaming would be the 7800X3D, which pulls just 86W for the same workload. The 5800X3D remains relevant as well, plotted at around 108W.
At the uppermost-end, the 13900K ran at 295W when stock on the test platform we used. These numbers come down in gaming, of course, but they come down uniformly. Intel is pushing power hard for all-core boosting now. High-end coolers become more of a necessity than they were a few generations ago.
CPU Power Efficiency Benchmark
Energy efficiency is next. This is calculated by taking our Blender time required in minutes and running a simple watt-hours calculation against the power consumption. The end result is the energy consumption required to complete a full render -- so faster is better in isolation, but depending on the power consumption, it may be less energy efficient.
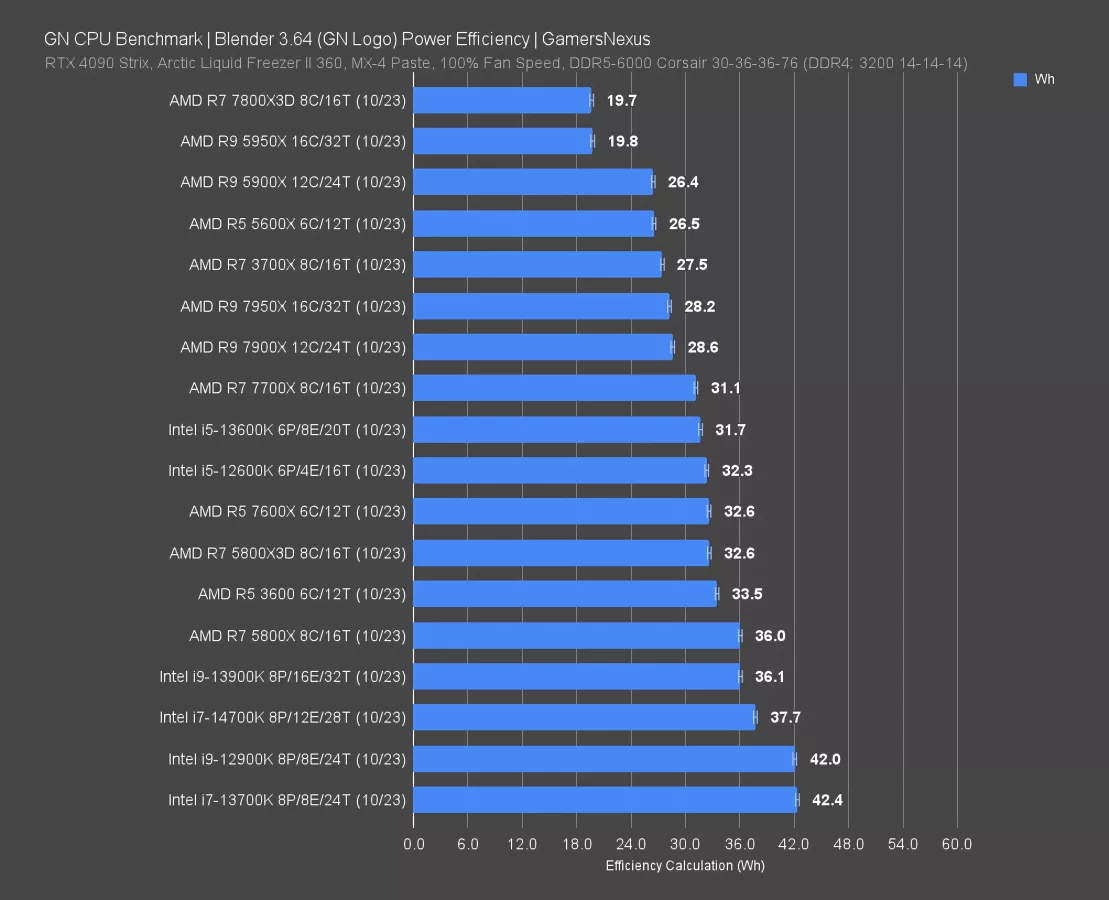
The 14700K ranked at 37.7Wh in this calculation. Lower is better, so that has it less efficient than almost everything else on the chart. It’s at least improved over the 13700K, dropping from 42.4Wh previously. Even if the 14700K is faster than many of these CPUs, it’s also pulling more power to complete the same work. Whether that matters to you is a personal choice: If you need the fastest thing possible, or the fastest in a budget, power is often one of the sacrifices. If you’re running these all the time though and are concerned about the power bill, this is a factor to strongly consider.
We’ll talk about raw performance separately, but some high-end competitors would include the 5950X, which is one of the most power-efficient CPUs we’ve ever tested. Its binning was phenomenal and the voltage requirement was low. The 7950X also scores significantly better than the 14700K in efficiency.
Intel’s all-core power efficiency is currently behind AMD’s. AMD remains impressive here. And check out our prior AMD Eco Mode testing on the 7950X to see where it does even better.
Intel i7-14700K Game Benchmarks

Rainbow Six Siege CPU Benchmarks
Rainbow Six - Best CPUs at 1080p/Very High
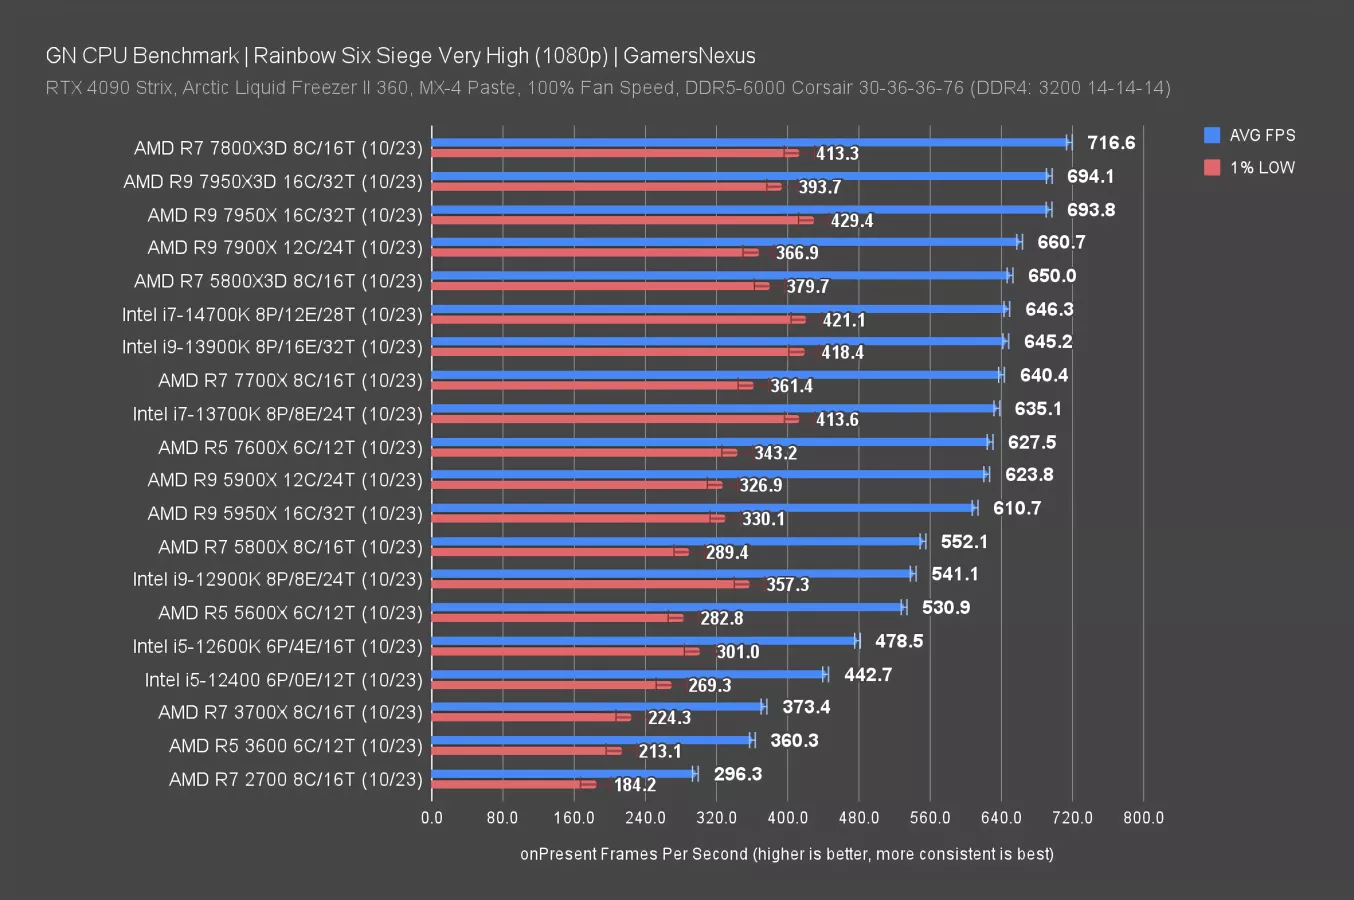
Rainbow Six Siege is the first title in our line of game benchmarks. This game has some insanely high FPS ceilings, so it makes for an excellent tool to compare CPUs.
The R7 7800X3D blows way past everything in these charts, setting a ceiling at 717FPS AVG -- that’s impressive for the AMD CPU, especially considering it’s been $350 on US retailers lately.
The 5800X3D is next in the running, at 650FPS AVG. These numbers are crazy to even talk about. The lows are relatively consistent, especially considering how high the FPS is here. The 14700K is functionally tied in average with the 5800X3D -- you’ll never notice that difference. Lows are technically higher, but given the standard deviation of 1% can be as high as 10FPS in this particular game, depending on which set of runs it is, these end up roughly tied.
Generationally, the 14700K is tied with the former flagship 13900K. It’s within 1% of the 7700X (which is currently $300 to $330), and it’s ahead of the prior 13700K by 1.8%. That’s a shockingly boring lead for the 14700K over the 13700K. Just from this game, you’d want to buy whichever is cheaper.
Users of the R5 3600 would see an uplift in the range of 80% -- more if you’re on older Ryzen generations -- but then you might as well get a 5800X3D and keep the same motherboard. Your cost would be way lower.
Rainbow Six - Best CPUs at 1440p/Very High
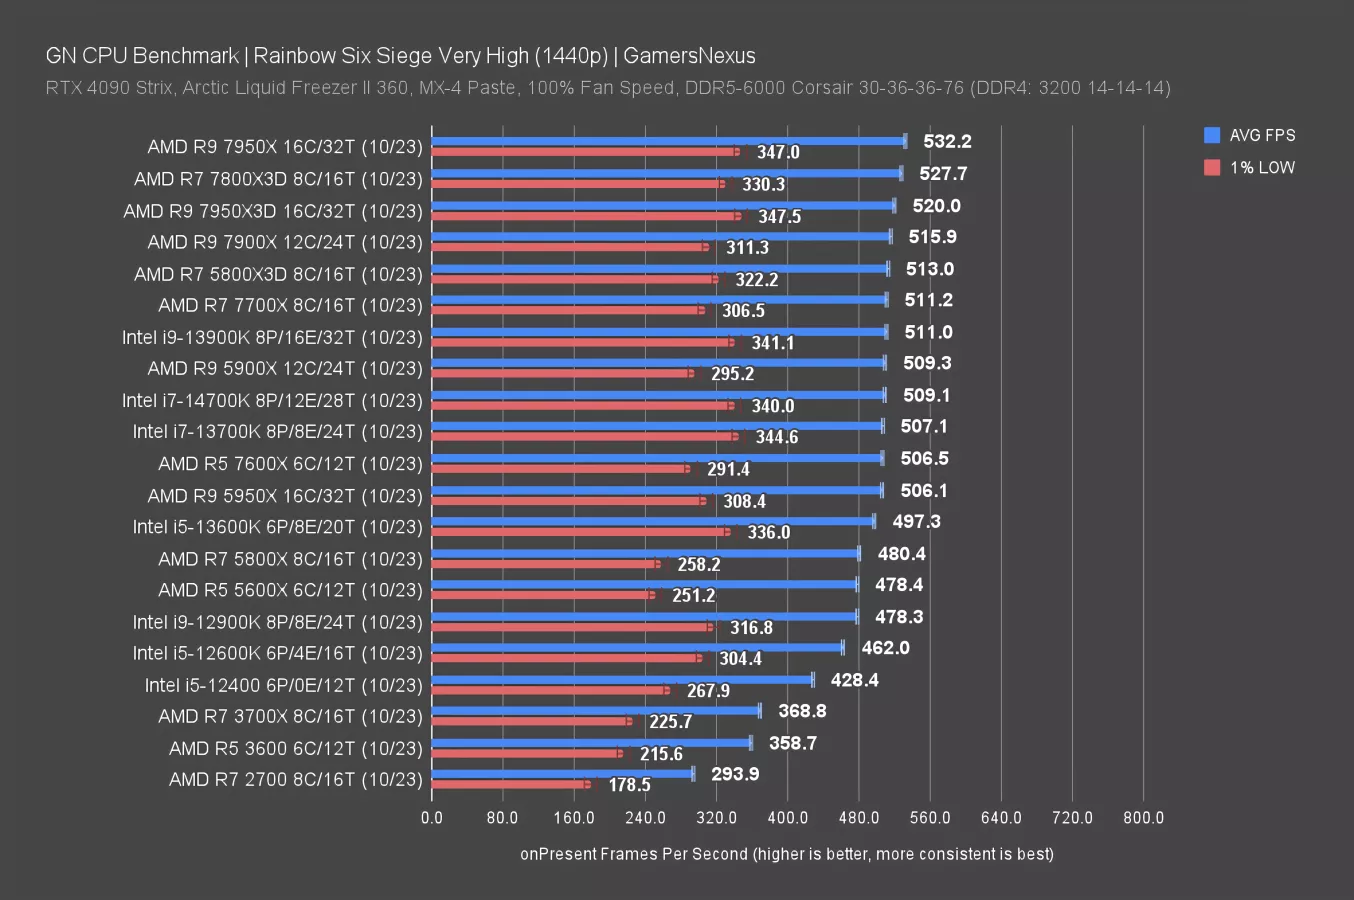
At 1440p, AM5 leads again: We’re bouncing off of a GPU bind at the very top-end, with the 7800X3D and 7950X both restricted by the 4090 (as evidenced by the reduced maximum framerate). The 14700K isn’t quite there, instead ending up in a cluster with the 7700X, 13900K, 5800X3D, and most of the other high-end CPUs. Its lead over the 13700K is once again irrelevant, unfortunately. But this goes to show that even at 1440p, there can still be scaling with modern high-end GPUs.
Most of these are functionally the same though: The 7700X equals the 14700K, for instance.
F1 2023 CPU Benchmarks
1080p Gaming Benchmarks
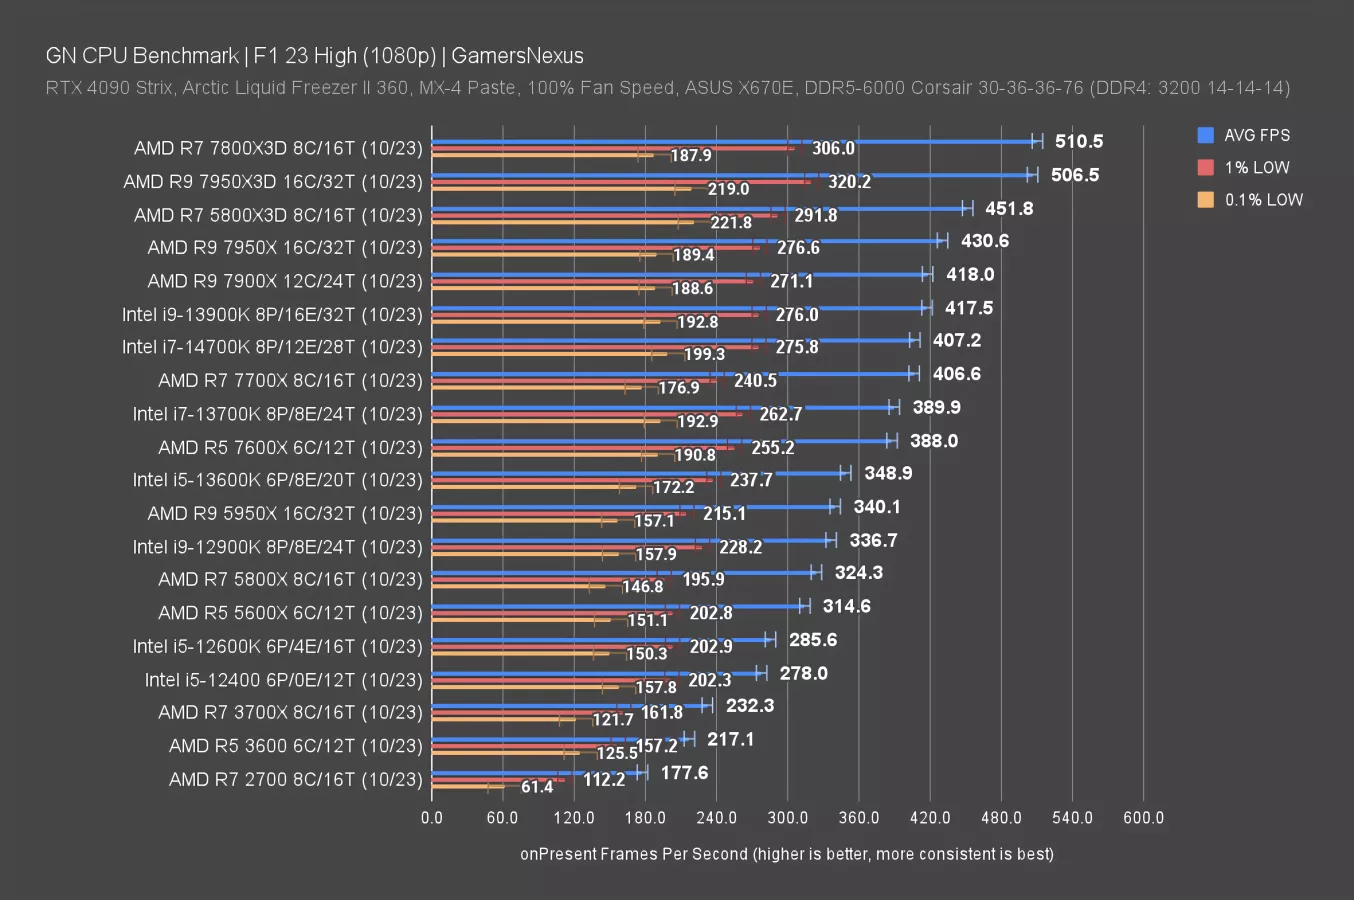
The F1 series has been in our bench for years at this point and F1 2023 is another game that generally scales well across CPUs and GPUs alike, plus ray tracing inclusion makes it a good test candidate for GPUs.
Looking at the 1080p results for CPUs, the 7800X3D leads once again -- it’s at 511FPS AVG. The lows are slightly reduced versus other CPUs, but not meaningfully. The 5800X3D is also in the upper echelon of CPUs here, hanging on to a podium finish with a 452FPS AVG result.
The 14700K’s result places it down at 407FPS AVG, ahead of the 13700K by a “whopping” 4.4%.
1440p Gaming Benchmarks
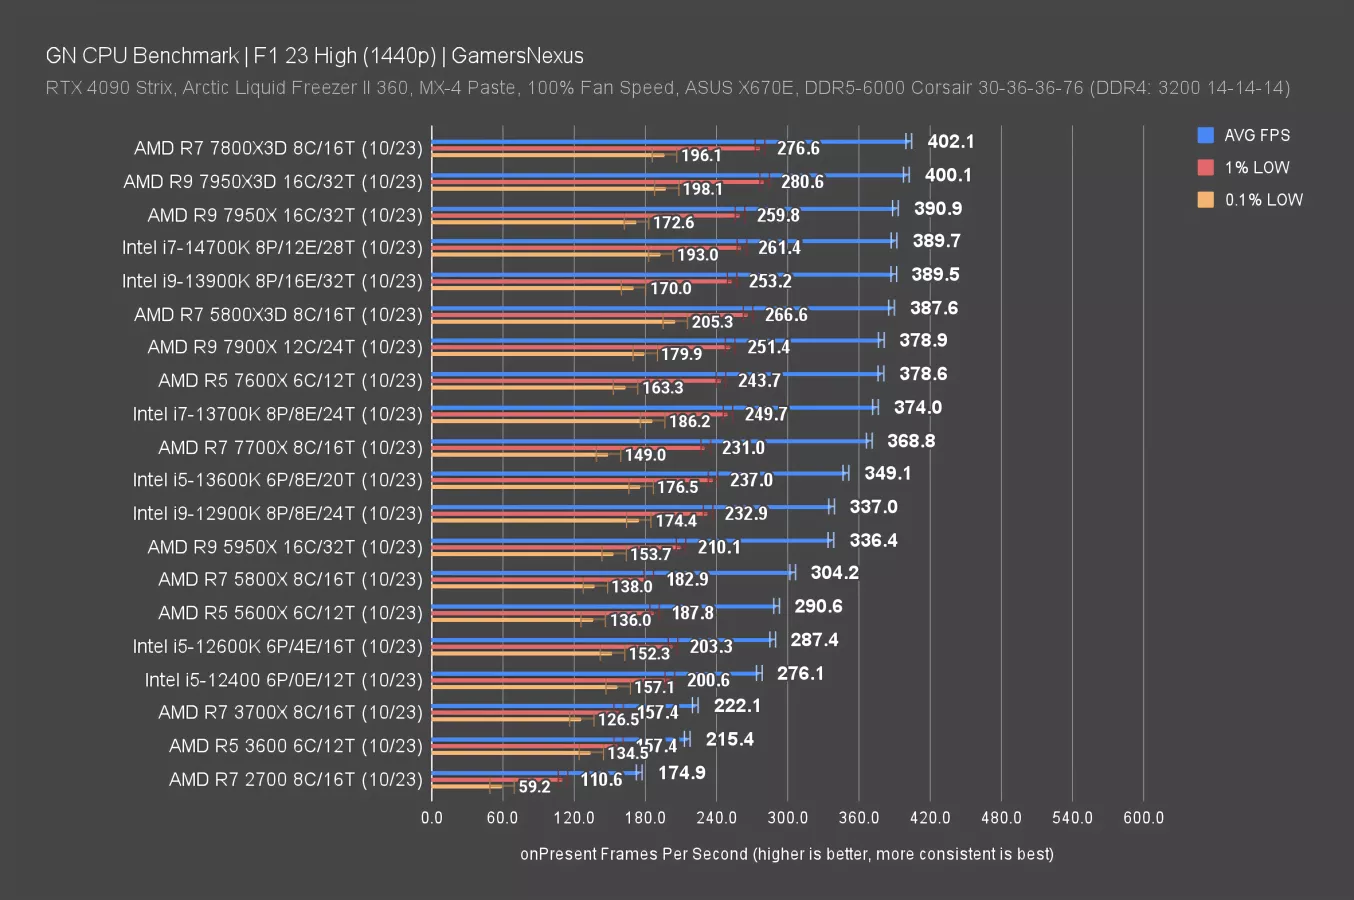
At 1440p, the 14700K’s “mind-blowing” technological prowess strikes even harder: This time, we’re seeing a 4.19786096256684% improvement in AVG FPS over the prior 13700K. That’s almost as many numbers as an AMD mobile CPU name.
The results overall on this chart have come down, even those which were more distant from the GPU bottleneck. We see that with the 5800X, which dropped about 20FPS AVG off of its 1080p result. The 14700K is functionally at the top of the chart, though -- it’s hitting limits, as are the 7800X3D, 7950X, and other nearby neighbors.
Baldur’s Gate 3 CPU Benchmarks
1080p/Medium/Dx11
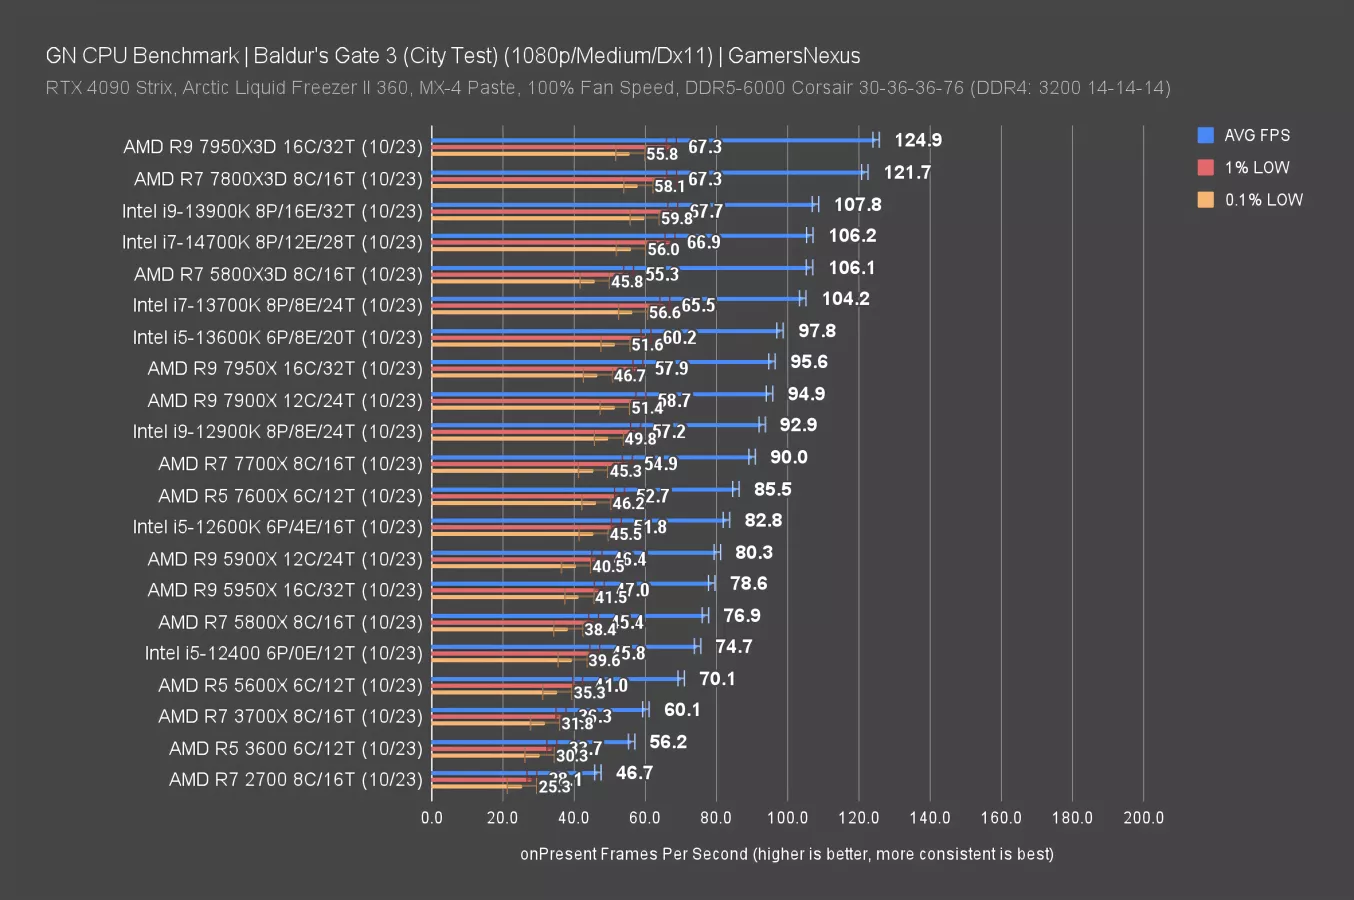
Baldur’s Gate 3 is brand new to our test suite, but we already studied it extensively in our GPU benchmark video. That video also goes into detail on GPU Busy metrics for Baldur’s Gate 3, plus some information on Vulkan versus DirectX 11. The standard deviation run-to-run for all our CPUs averaged out to 0.9 AVG FPS, 1.4 for 1% lows, and 4.1 for 0.1% lows, so Baldur’s Gate 3 is remarkably consistent and makes for an excellent CPU benchmark.
At 1080p with Dx11, the 14700K ran at 106FPS AVG -- slightly behind the 13900K and about 1-2% better than the 13700K. Unfortunately, the 14700K multi-classing into more E-cores didn’t benefit it here. Like a mimic deep in Undermountain, the 14700K looks like the healing potion that Intel needs -- until you realize you only get to roll 1d4 on use. And subtract 1.
It’s not a bad CPU at all, but it’s not a meaningful improvement in this game. If you were buying Intel no matter what, the choice between the top 3 Intel performers doesn’t matter in this game benchmark. The X3D CPUs, meanwhile, blow past everything.
1440p CPU Benchmarks
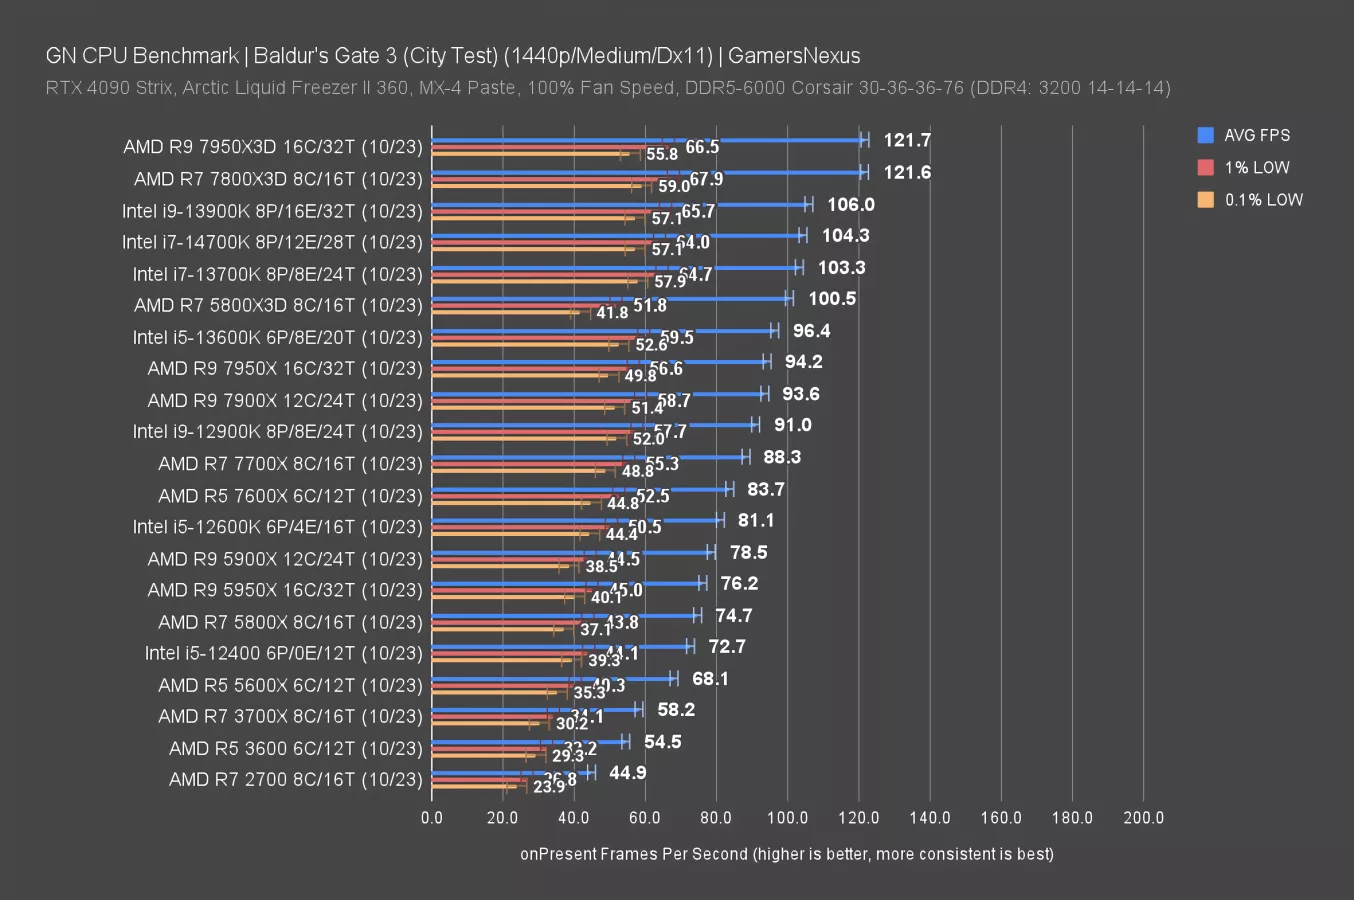
At 1440p, standard deviation is even lower for the 1% and 0.1% lows (and about the same for AVG FPS). The results are slightly impacted, but overall, we’re looking at even scaling. We’re still effectively completely CPU-bound. There’s nothing new to see here -- just another 1d4-1 health potion.
Cyberpunk: Phantom Liberty
1080p/Medium
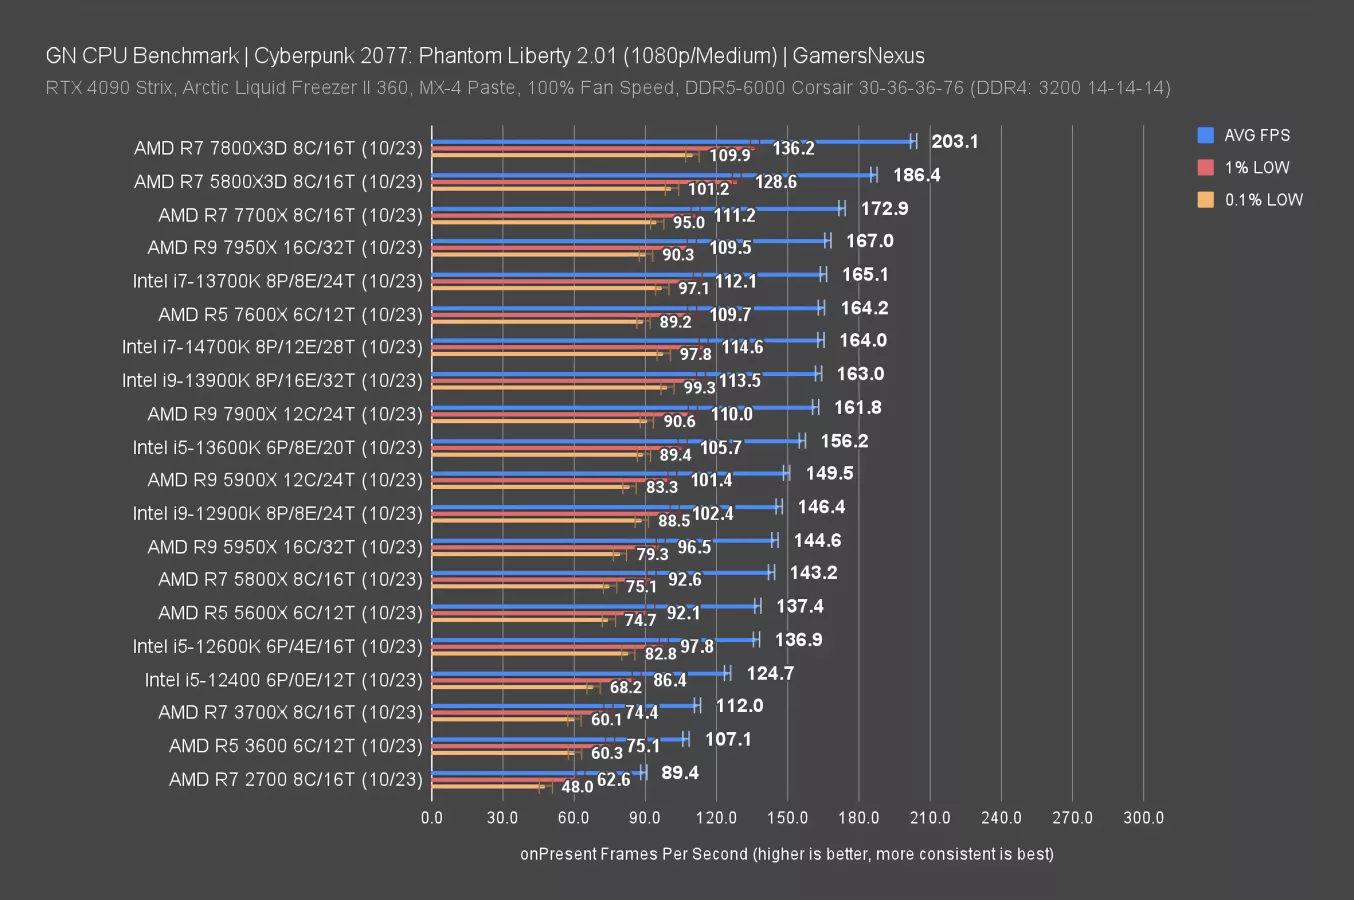
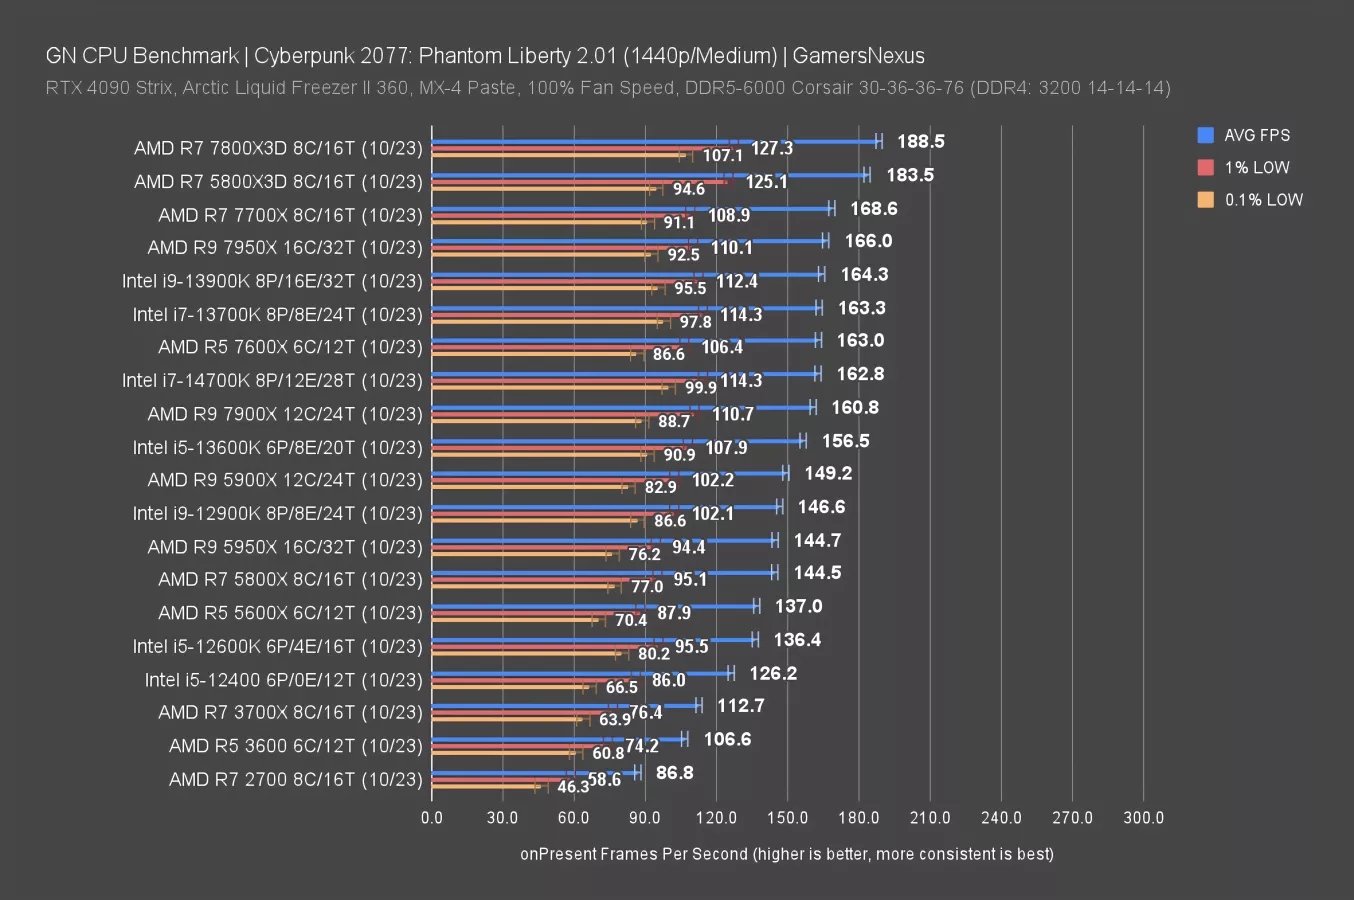
Cyberpunk: Phantom Liberty tests are next. These are brand new to our test suite. As nice as it looks, we’re not using any ray tracing options here -- that’d create a GPU bind in most scenarios, and we want to see CPU scaling.
Now, this game has a specific setting of importance: The SMT toggle has been updated in recent patches and now should automatically toggle off for some CPU configurations. According to CDPR, the SMT option will flip when core count is under 8 cores. We had the option of forcing SMT on for all CPUs, forcing it off, or following the behavior that will result in the best performance as according to the game’s native behaviors. We decided to use the SMT toggle on “auto,” which is a dumb toggle that flips at 8 cores. If running a 3600, SMT will be enabled. This allows each CPU to maximize its performance but in a predictable way -- it’s not a random auto.
Here’s the chart. Unfortunately for Intel, in this one, we just didn’t see any scaling with the 14700K. The results are within error of each other. AMD is pulling far ahead with the 7800X3D again. The gap is 24%. The 7950X3D has some terrible 0.1% low behaviors in this title, but the 7800X3D is doing well, as is the 5800X3D. The R7 7700X also leads Intel.
Cyberpunk: Phantom Liberty
1440p/Medium
1440p has the same lineup -- we’re mostly bound by the CPU, which is good for scaling. The top of the results get truncated a little bit from the resolution increase.
Final Fantasy 14
1080p/Maximum
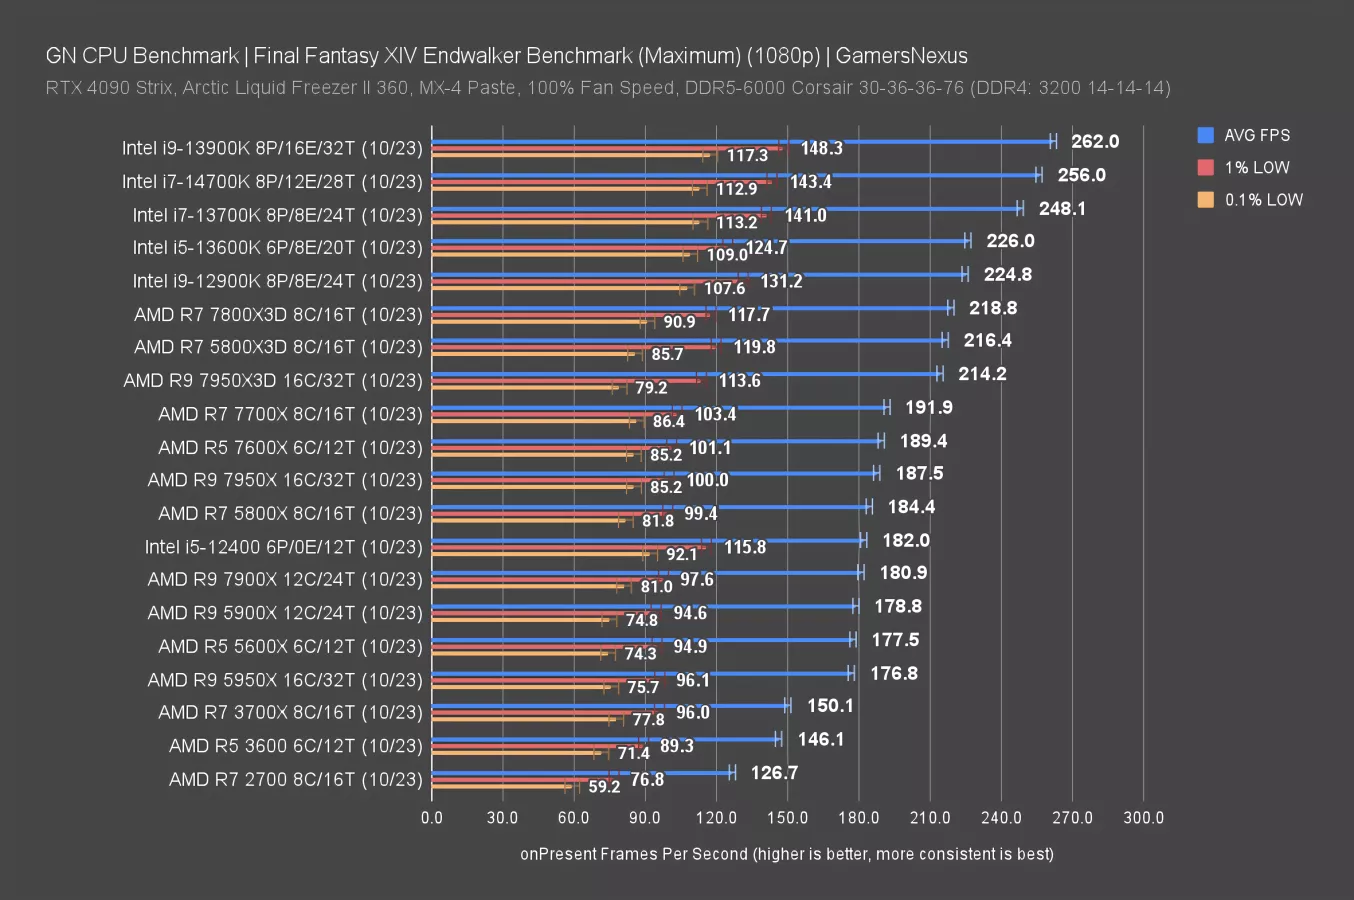
Final Fantasy remains one of Intel’s strongest games, so this should be a more beneficial test for the new CPUs.
X3D doesn’t trend as high here: You’ll notice that the 5800X3D and 7800X3D are bound-up at effectively the same framerate.
The 13900K leads this chart until we run our 14900K review (which will be on the channel within the next 24 hours). It holds a 2.3% lead over the new 14700K, which itself rests near 256FPS AVG. Now for the exciting part: That’s a “staggering” 3.18% better than the 13700K.
If you’re choosing between a 13700K and 14700K and they cost exactly the same, then the 14700K is the better CPU. But otherwise, this isn’t convincing enough on its own.
Final Fantasy 14
1440p/Maximum
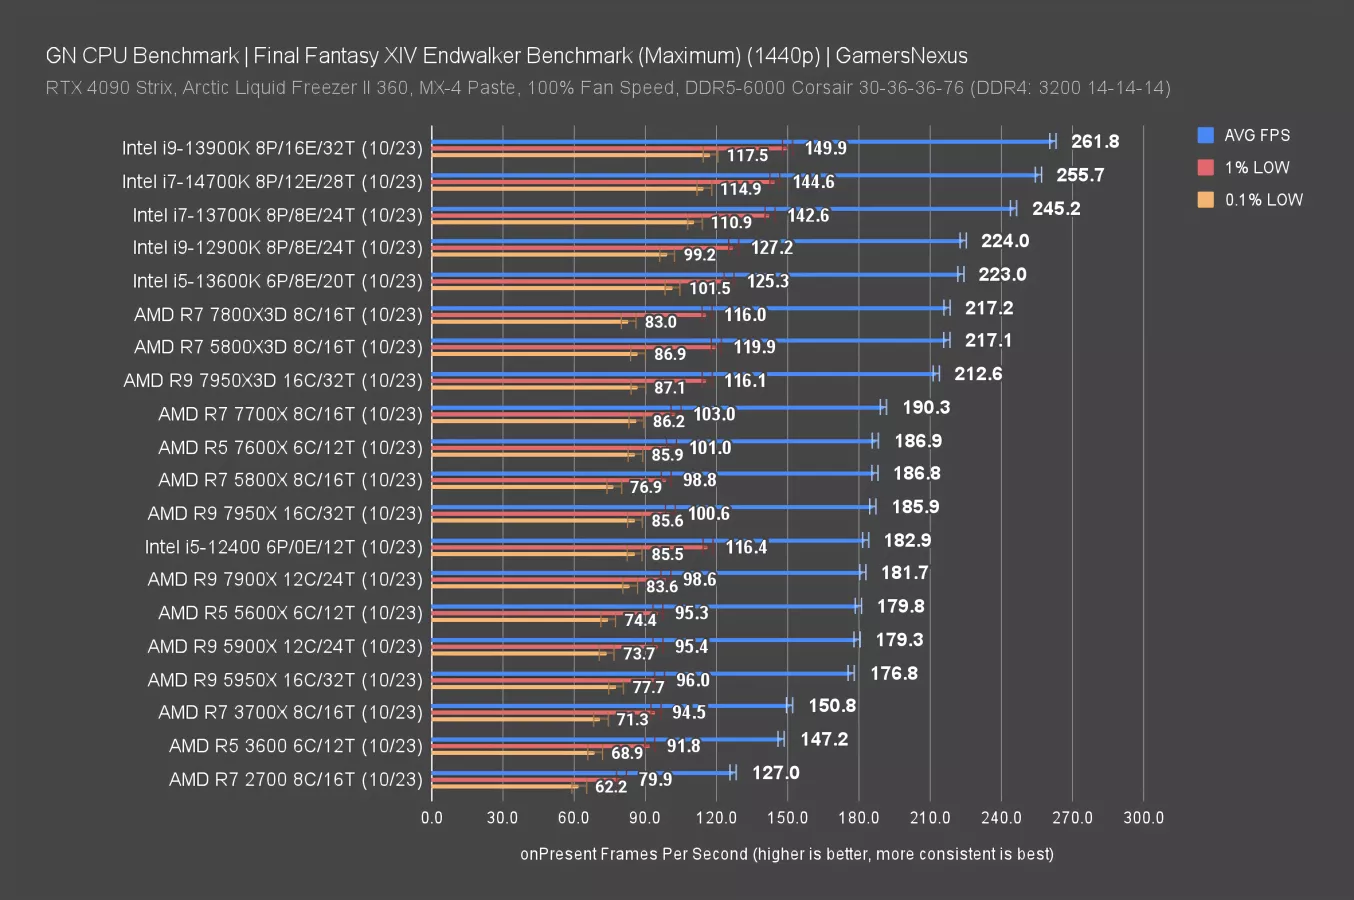
The 1440p results were the same. We’re CPU-bound, so we still see scaling even at the higher resolution.
Stellaris
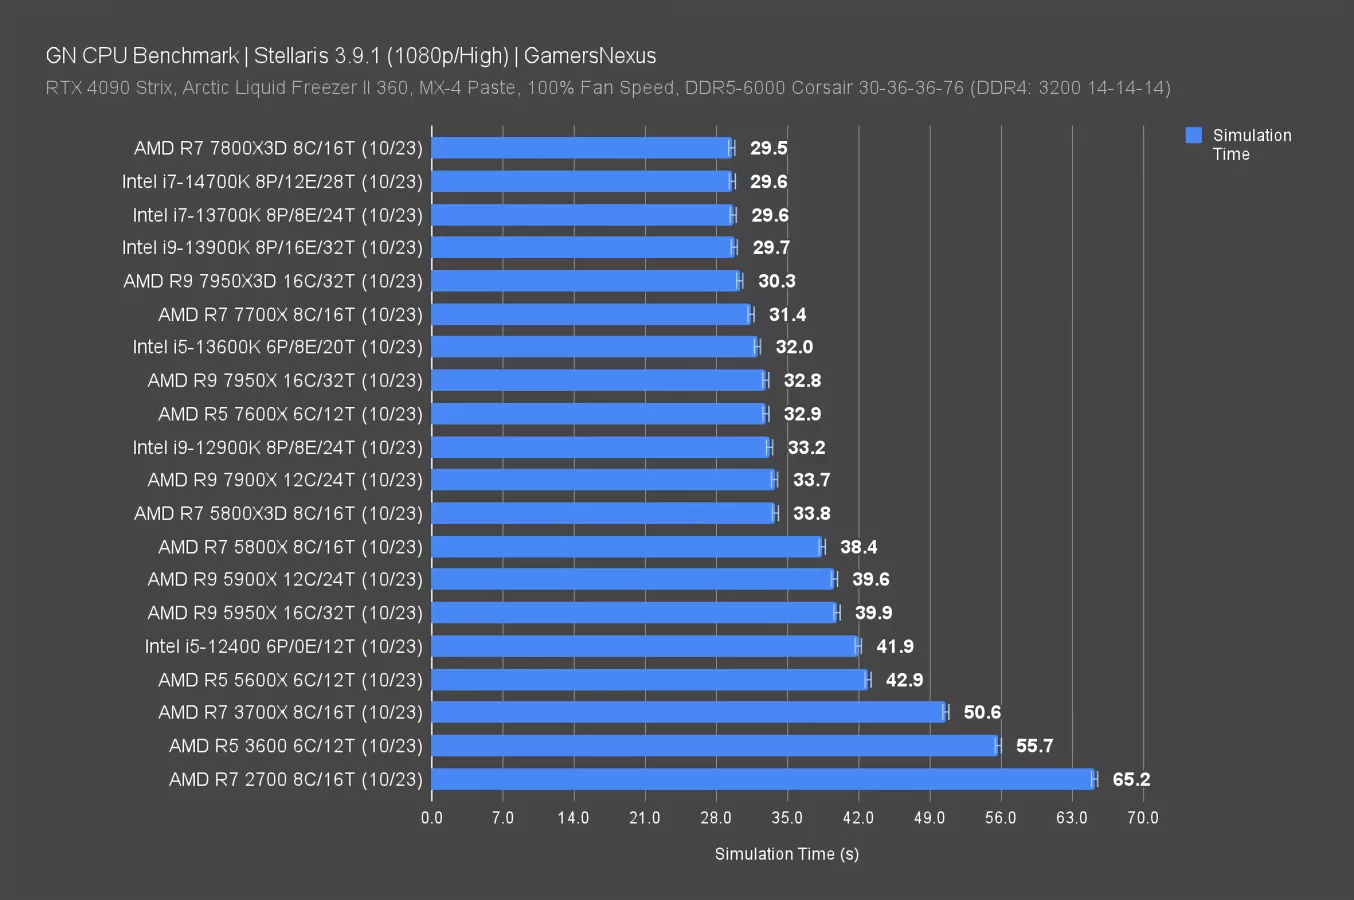
In Stellaris, we’re testing simulation time measured in seconds across 4 test passes. This isn’t an FPS benchmark, but a time benchmark. Lower is better.
Unfortunately, we’re just not seeing scaling past about 30-31 seconds. Everything hits a wall, and the jumble at the top doesn’t actually mean any CPU is better than the other, just that they’re all the same. We’re using a late game state for this, so it should be fairly intensive. That said, we want to experiment with some other ones. This game has a lot of potential since it scales great above the 31-second mark -- just look at the gap from the 2700 to the 7700X. We want to experiment with some more save game files, so if you have a really late-game save with a lot of complexity and if you want to see us continue to use this test, please email it over to us at [email protected]. We’ll see if we can force some more scaling room.
For now, the 14700K and 13700K are about the same -- a far, far cry from our “staggering” 3% differences we’ve seen so far.
Starfield CPU Comparison
1080p/Low
Speaking of space games, it’s time to go to one that needs some more work. Starfield is new to our CPU test suite. We’re testing using the latest version of the game as of October 11th.
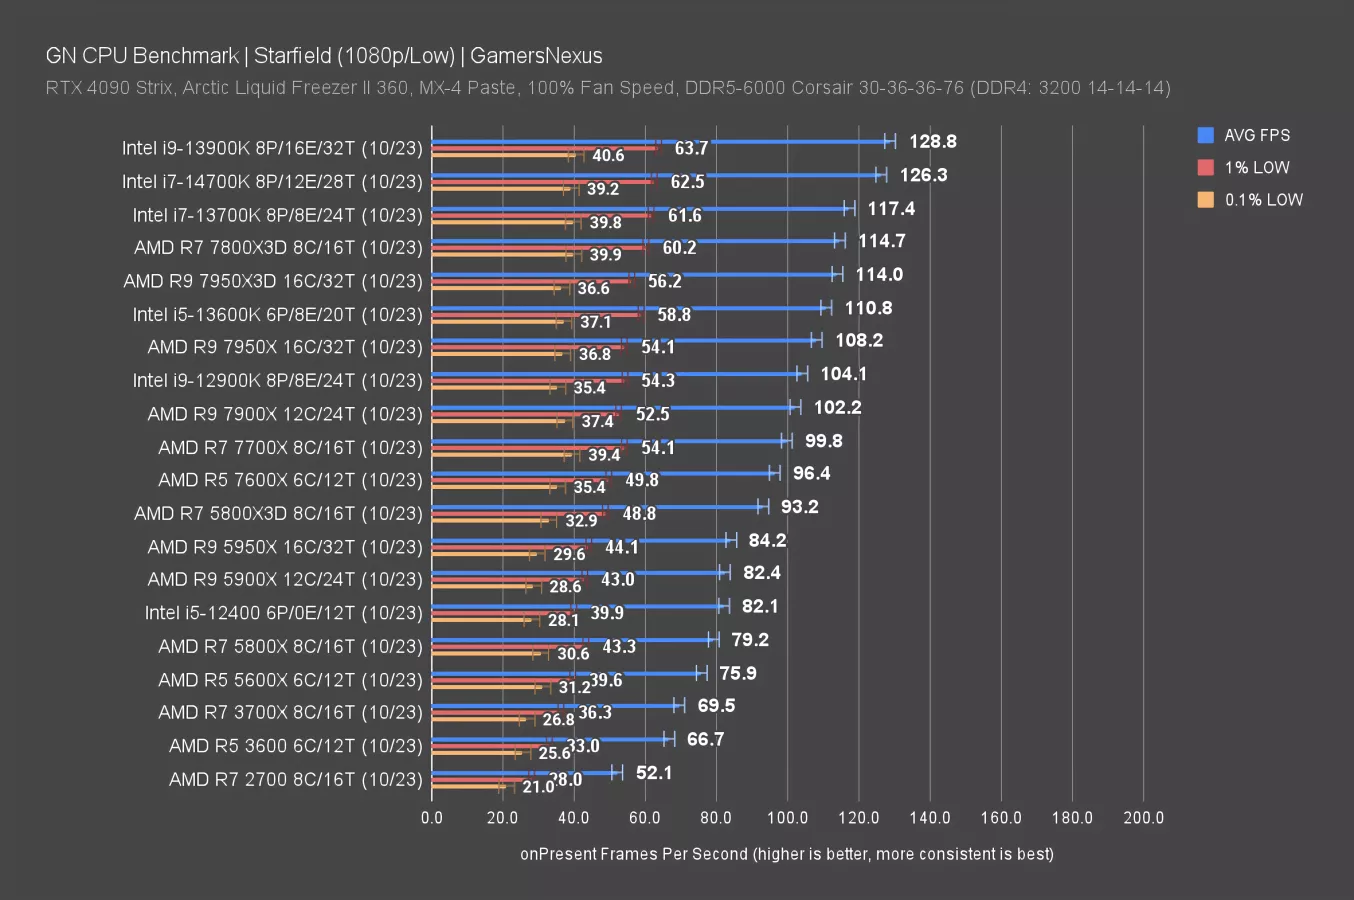
Our first test begins at 1080p/low. The 14700K ran at 126FPS AVG, posting what was, unironically, the most exciting result so far: A 7.6% improvement over the 13700K.
This puts the 14700K near the 13900K and technically ahead of the 7800X3D. AMD’s CPUs generally run slower in this game, with Intel largely controlling the top half of this chart.
1080p/High
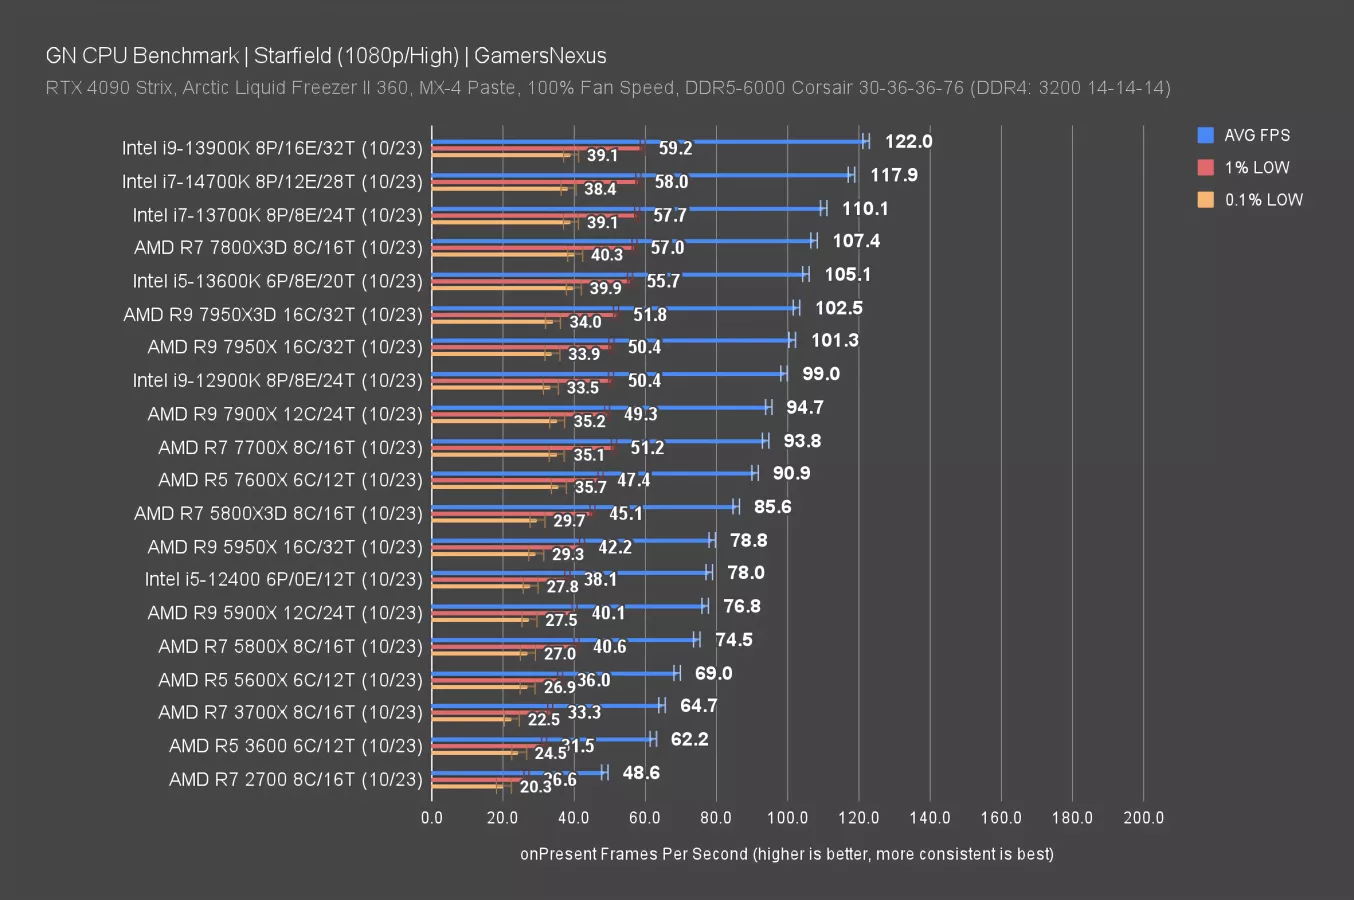
At 1080p/high, we saw a similar lineup but with a truncated top-end for performance. Nothing that stands out here, so we’ll move on.
Production Benchmarks
Now we’re on to production benchmarks. These actually show some double-digit improvements -- not always, but at least we see them sometimes. These include tests of Adobe Premiere, Blender, file compression and decompression, and more.
Blender Benchmarks
We’ll start with Blender, the 3D modeling and animation software.
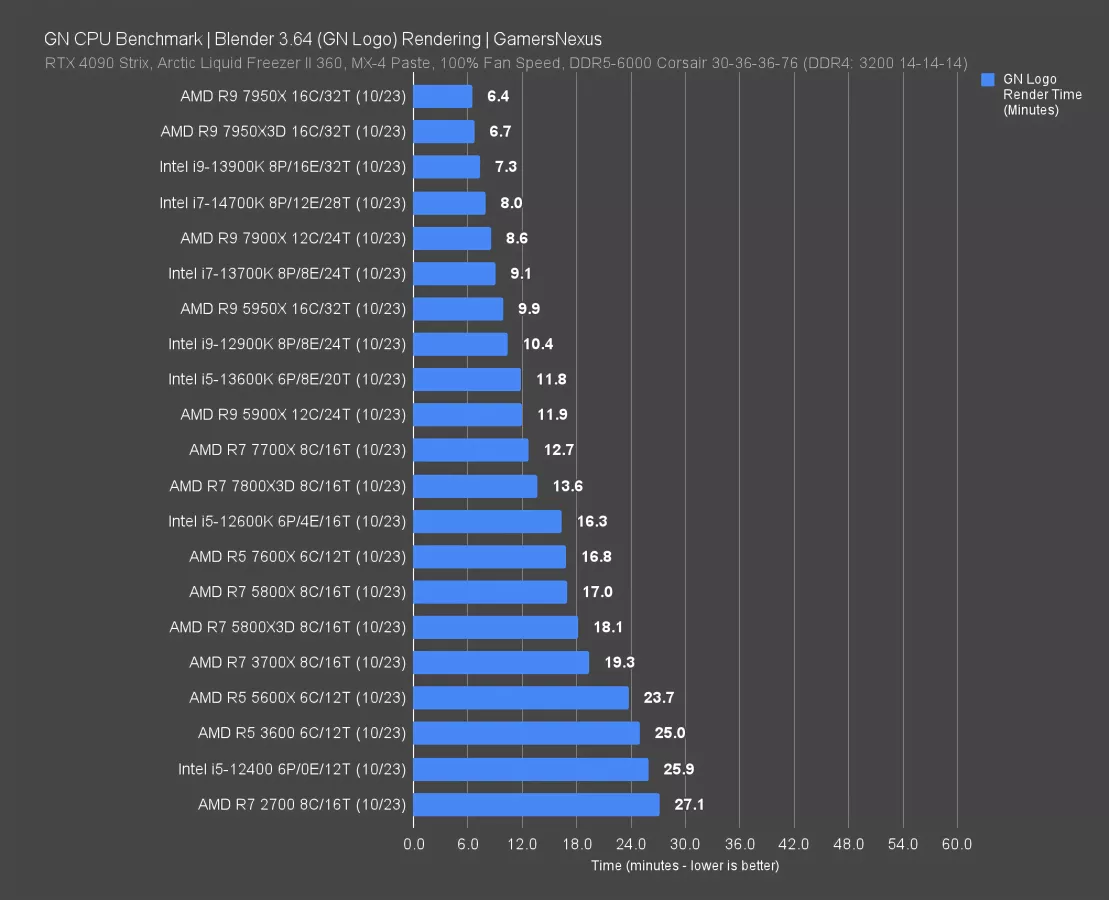
The i7-14700K finished in 8 minutes here, improving upon the 13700K with a 12% reduction in time required to complete the render. The 13900K still outdoes the 14700K by 9%. This is because Blender will use every thread given to it at 100%, so we see more scaling.
AMD’s closest competitors would be the 7950X. It leads and represents a 20% reduction against the 14700K. That CPU costs roughly costs $590 right now.
The 7900X is next and gives up a 7% lead to the 14700K.
7-Zip Compression
File compression and decompression are measured in millions of instructions per second.
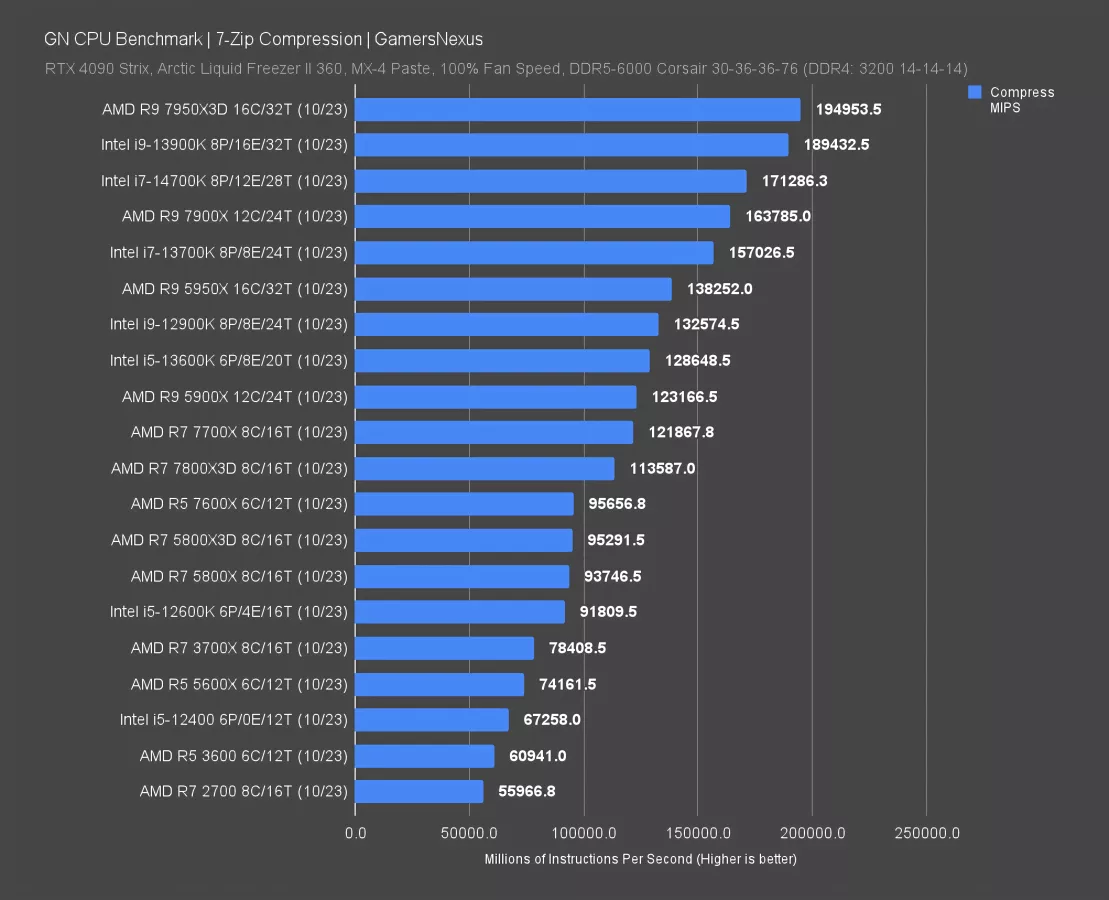
In compression, the 14700K completed 171K MIPS. It’s 9% ahead of the 13700K here. It’s still just an overclocked 13700K, but at least it does something in production. The 7900X is AMD’s closest price competitor, with the 14700K ahead by 4.6%. The 7950X leads by 12%.
7-Zip Decompression
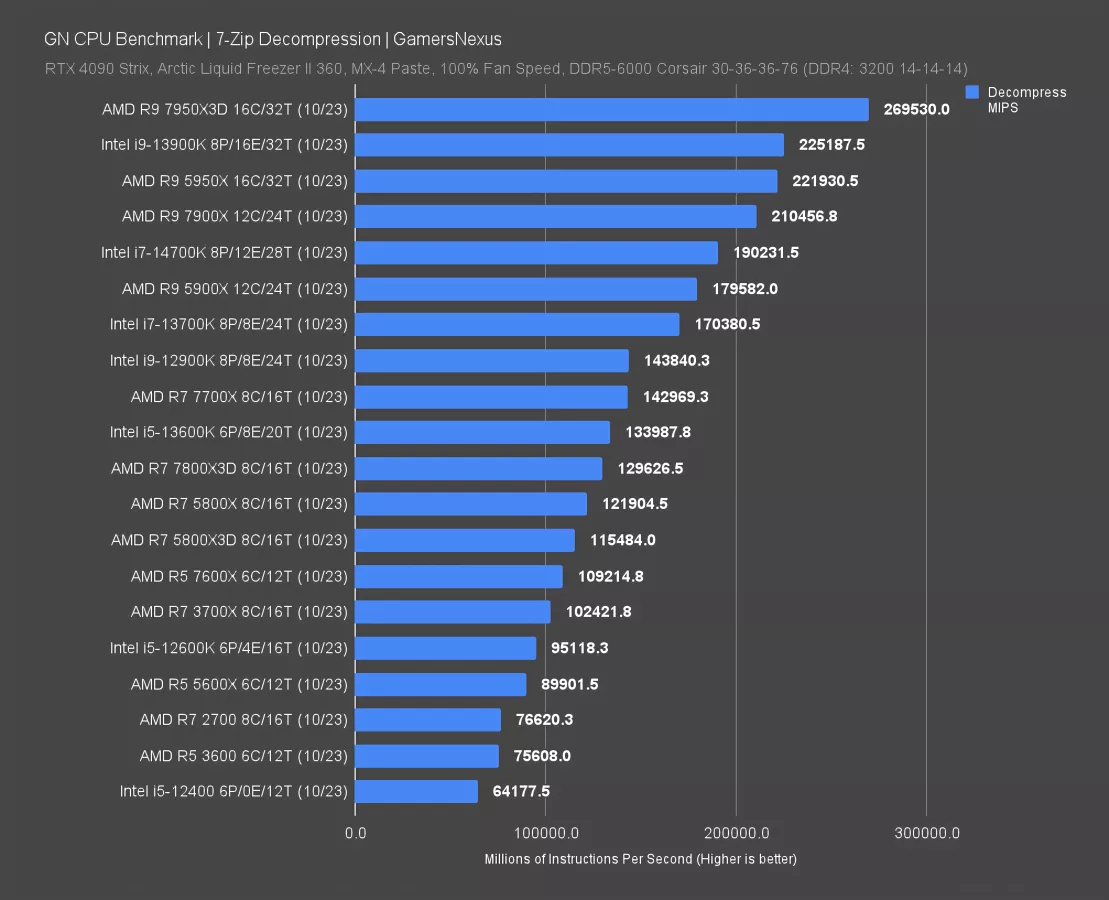
Decompression is interesting since the stack sometimes reshuffles. Here, the 14700K gets led by the AMD 5950X from a generation ago -- and by a lot at 17%. The 14700K improves over the 13700K by 12%, but losing to last-gen AMD isn’t a great position.
Adobe Premiere
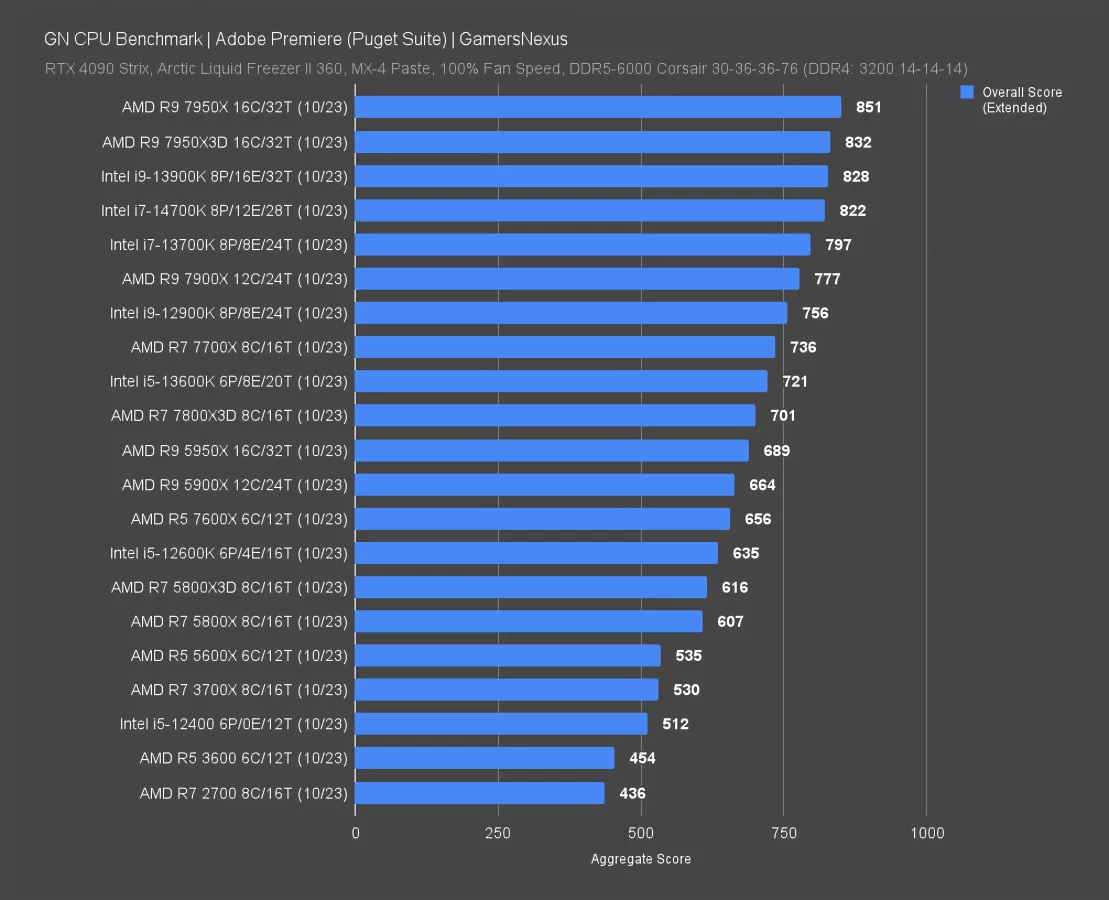
The next chart looks at the best CPUs for Adobe Premiere. This is scored in aggregate with the Puget bench. The 14700K scored 822 points, outperforming the 13700K by 3.1%. We’re back to those “groundbreaking” numbers we discovered earlier. The 7950X leads the 14700K by about 1% -- there’s not a ton of difference at the high-end in this one.
Adobe Photoshop
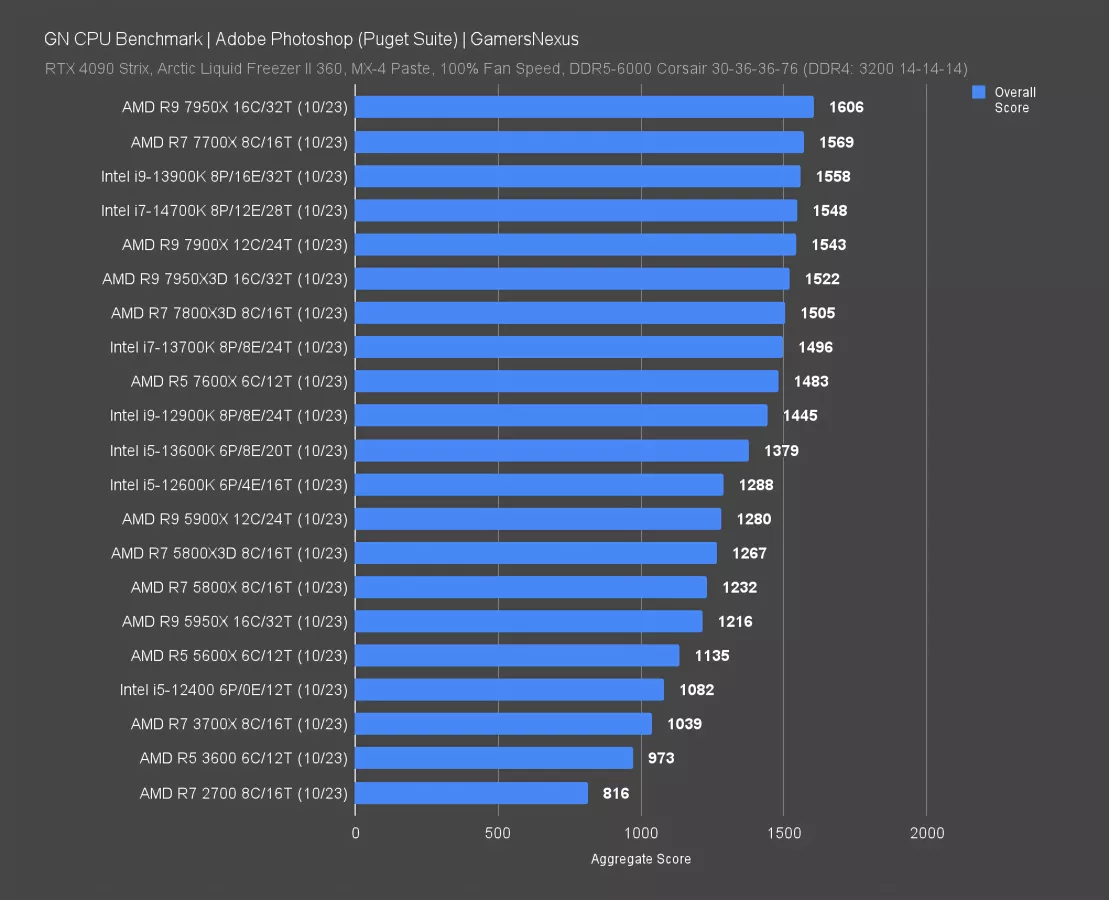
Adobe Photoshop had the 14700K at 1548 points in aggregate, functionally tied with the 13900K and 7900X. The top of the scoring in this one isn’t spread out much. The lead over the 13700K was 3.5%.
Conclusion
Intel’s latest 14000-series CPUs were less the savior than we thought they were going to be, specifically the 14700K with its higher core count. It’s 12 percent time reduced versus the 13700K in our Blender test, and that’s not bad, but that’s only in a single productivity test.
If you’re thinking about buying either the 13700K or the 14700K, you should look at pricing. For gaming, the 14700K does not justify the price increase as it offers virtually the same performance and currently costs roughly $36 more. For example, the 1.8% lead the 14700K showed over the 13700K in Rainbow Six Siege is so small that you might see a similar delta if you ran it up against another 13700K.
And even to this date, AMD largely holds a lead in gaming with its X3D CPUs. Anyone building a new system should strongly consider the R7 7800X3D (if primarily for gaming), as it's a direct alternative in price to the i7-14700K, but often better in gaming. Owners of AM4 (or anyone trying to build a more budget-oriented gaming PC) should seriously consider the R7 5800X3D, which has managed to remain available and in a dominating position in the gaming market.
In productivity tasks where you might get some uplift, then we suppose it’s worth considering the 14700K, but you should know it’s not a great value overall. Intel’s older 13900K offers some stiff competition, not to mention AMD’s current crop of CPUs.
This wasn't a good launch for Intel. It comes across as desperate and weak and reminds us a bit of the company’s 11th series processors, which offered maybe one decent CPU -- and we almost forgot about that series. If, however, you look at the 14000 series chips as slightly pre-overclocked CPUs, then you won’t be disappointed because that’s what they are.