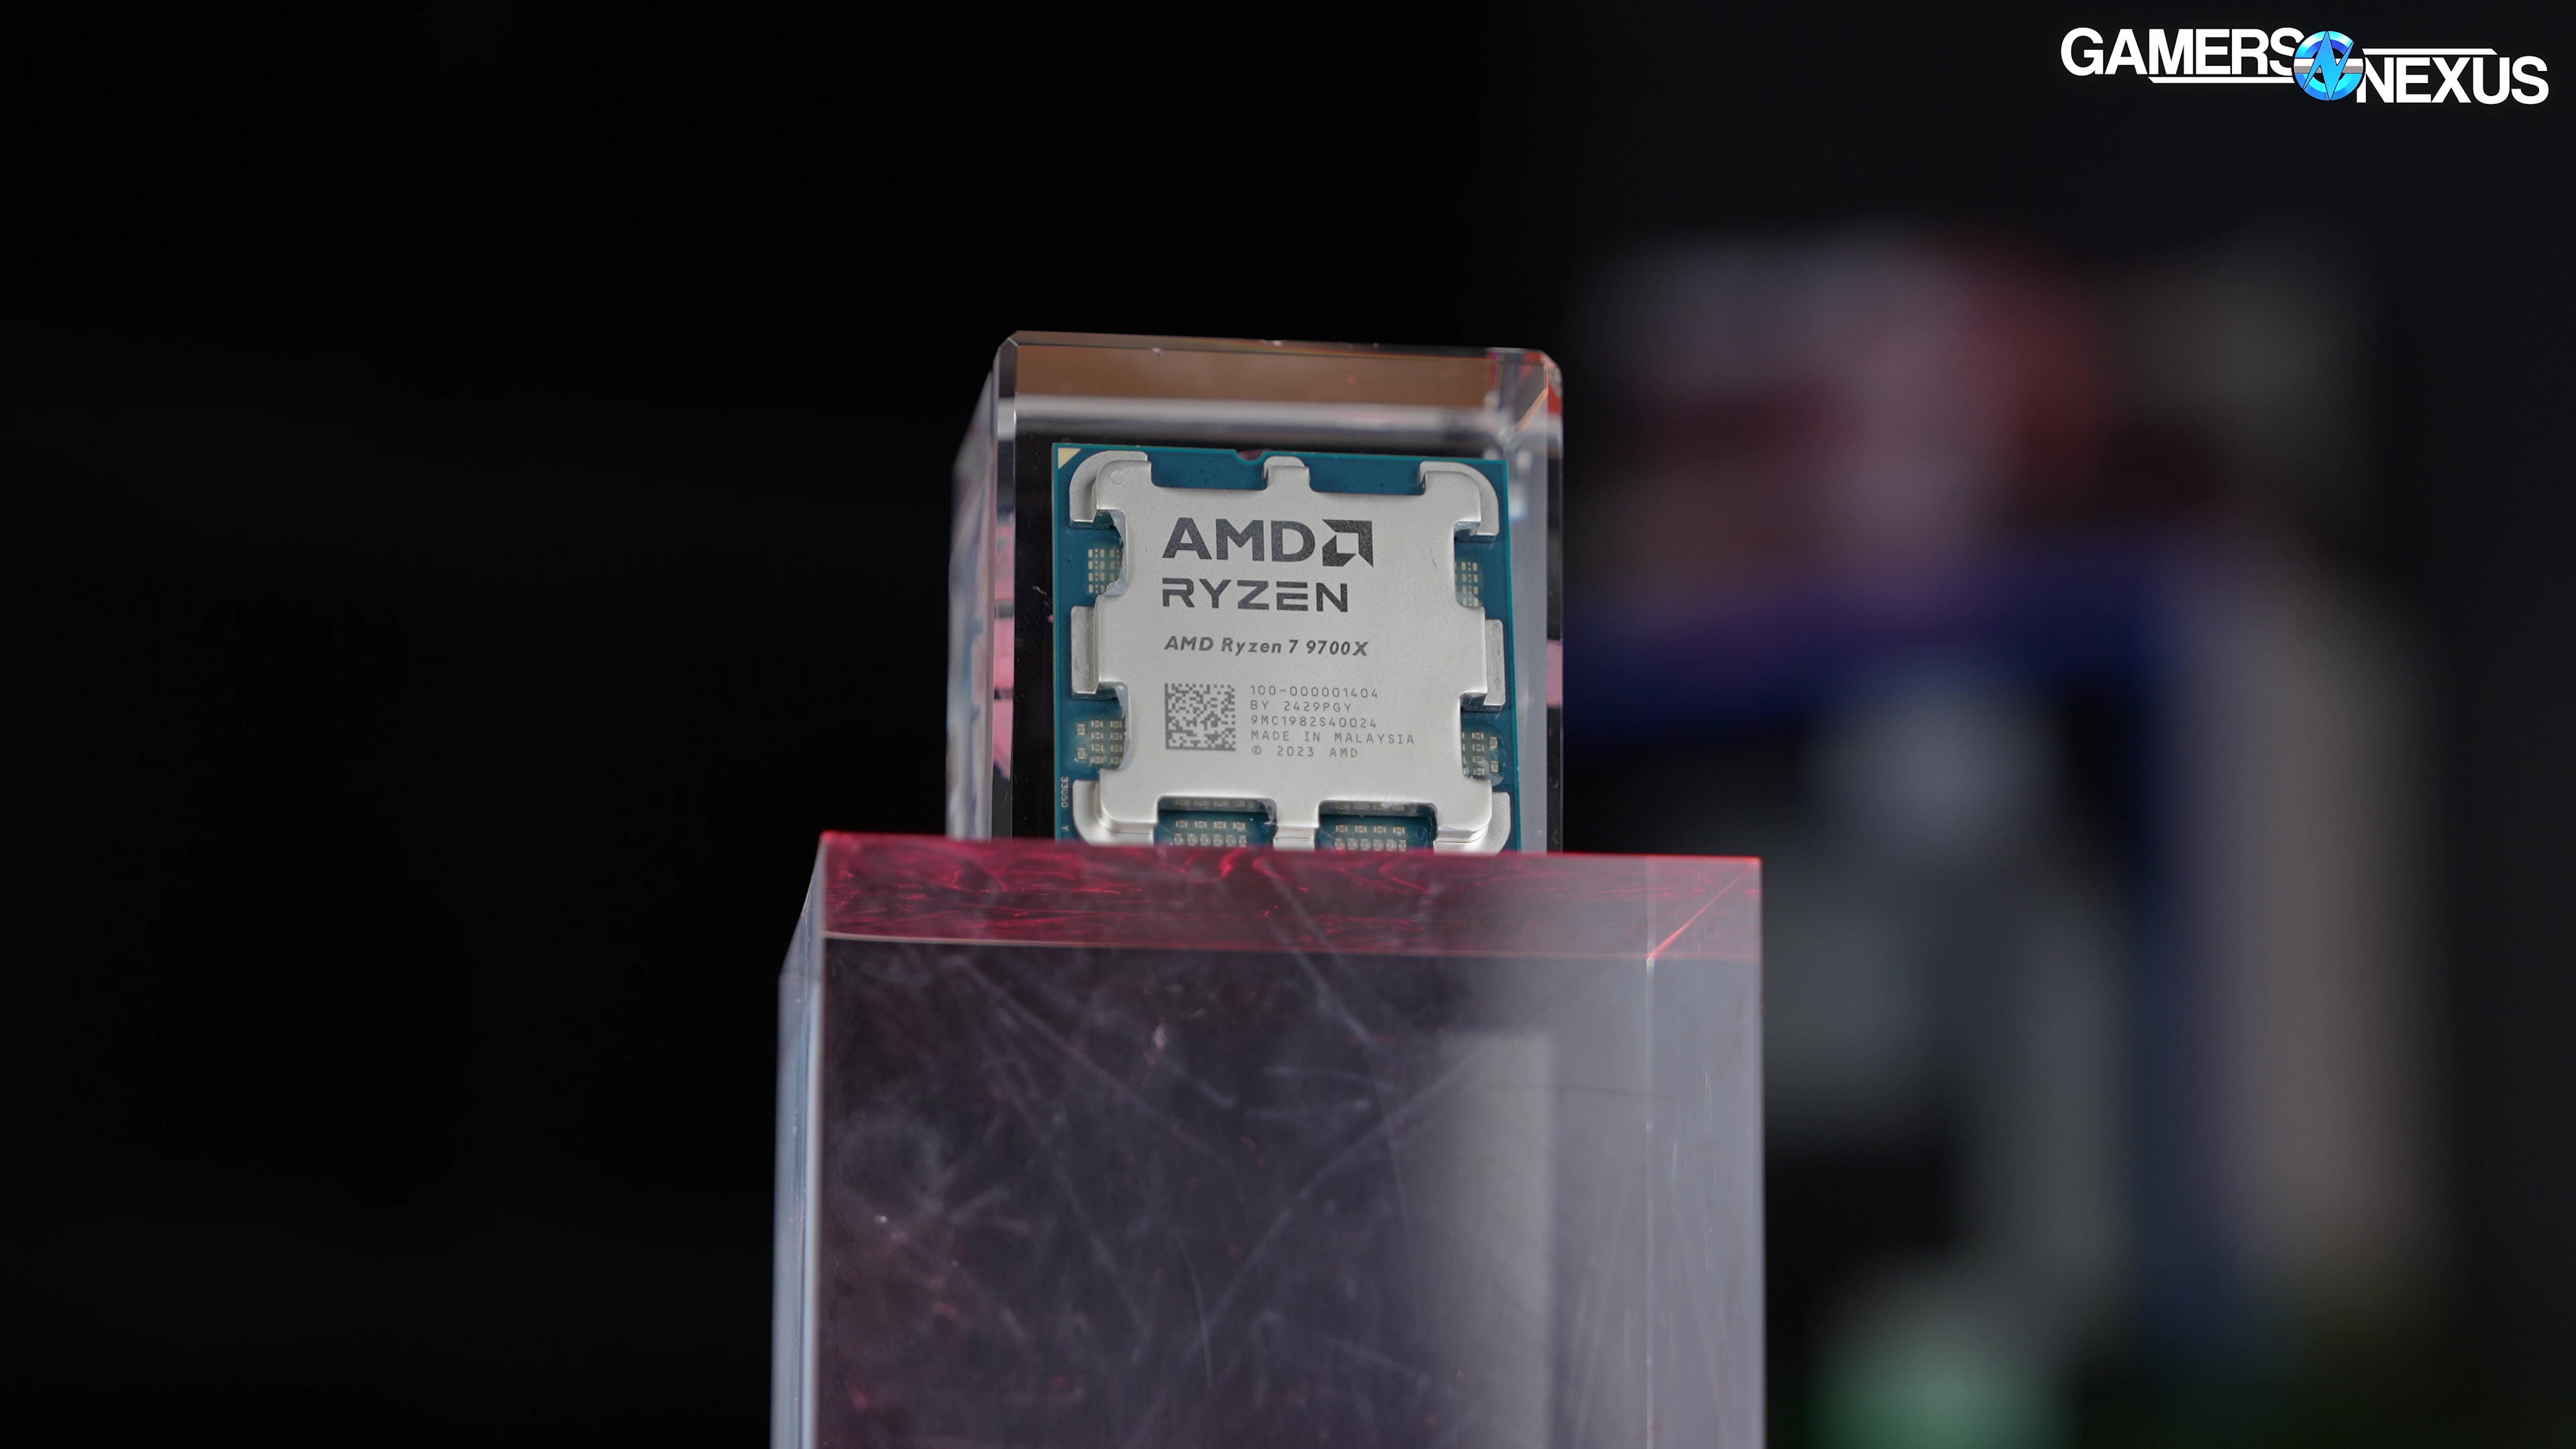
Wasted Opportunity: AMD Ryzen 7 9700X CPU Review & Benchmarks vs. 7800X3D, 7700X, & More
Last Updated:
We ran the AMD Ryzen 7 9700X through numerous tests that include gaming benchmarks, production workloads, power, efficiency, thermals, and more
The Highlights
- The Ryzen 7 9700X is a 8-core/16-thread CPU based on AMD’s new Zen 5 architecture
- The 9700X is a relatively boring release that’s slightly better than the 7700X at times but sometimes slightly worse
- The most positive thing about AMD’s Ryzen 7 9700X is its efficiency
- Original MSRP: $360
- Release Date: August 8, 2024
Table of Contents
- AutoTOC
Intro
The most positive thing about AMD’s Ryzen 7 9700X is its efficiency. The next most positive thing about it is that, even though we have looked everywhere, we cannot find a single word “Intel” anywhere on the product or in the packaging.
We’re reviewing the AMD R7 9700X 8C/16T CPU with Zen 5 architecture. We would be posting a 9600X review today as well, except ours has massive memory compatibility issues. Actually, we had trouble with memory on the 9700X as well, though we were able to work around it. Considering AMD recalled these CPUs prior to launching them, it’s not a surprise that this launch is a complete mess. Although there are stories about the recall being due to a typo on the IHS, that’s not the only reason (and we don’t know if that one is confirmed). AMD definitely had problems with clocks on some of these CPUs, mostly the 16-core options.
Editor's note: This was originally published on August 7, 2024 as a video. This content has been adapted to written format for this article and is unchanged from the original publication.
Credits
Test Lead, Host, Writing
Steve Burke
Testing
Patrick Lathan
Mike Gaglione
QC
Jeremy Clayton
Camera, Video Editing
Vitalii Makhnovets
Camera
Andrew Coleman
Writing, Web Editing
Jimmy Thang
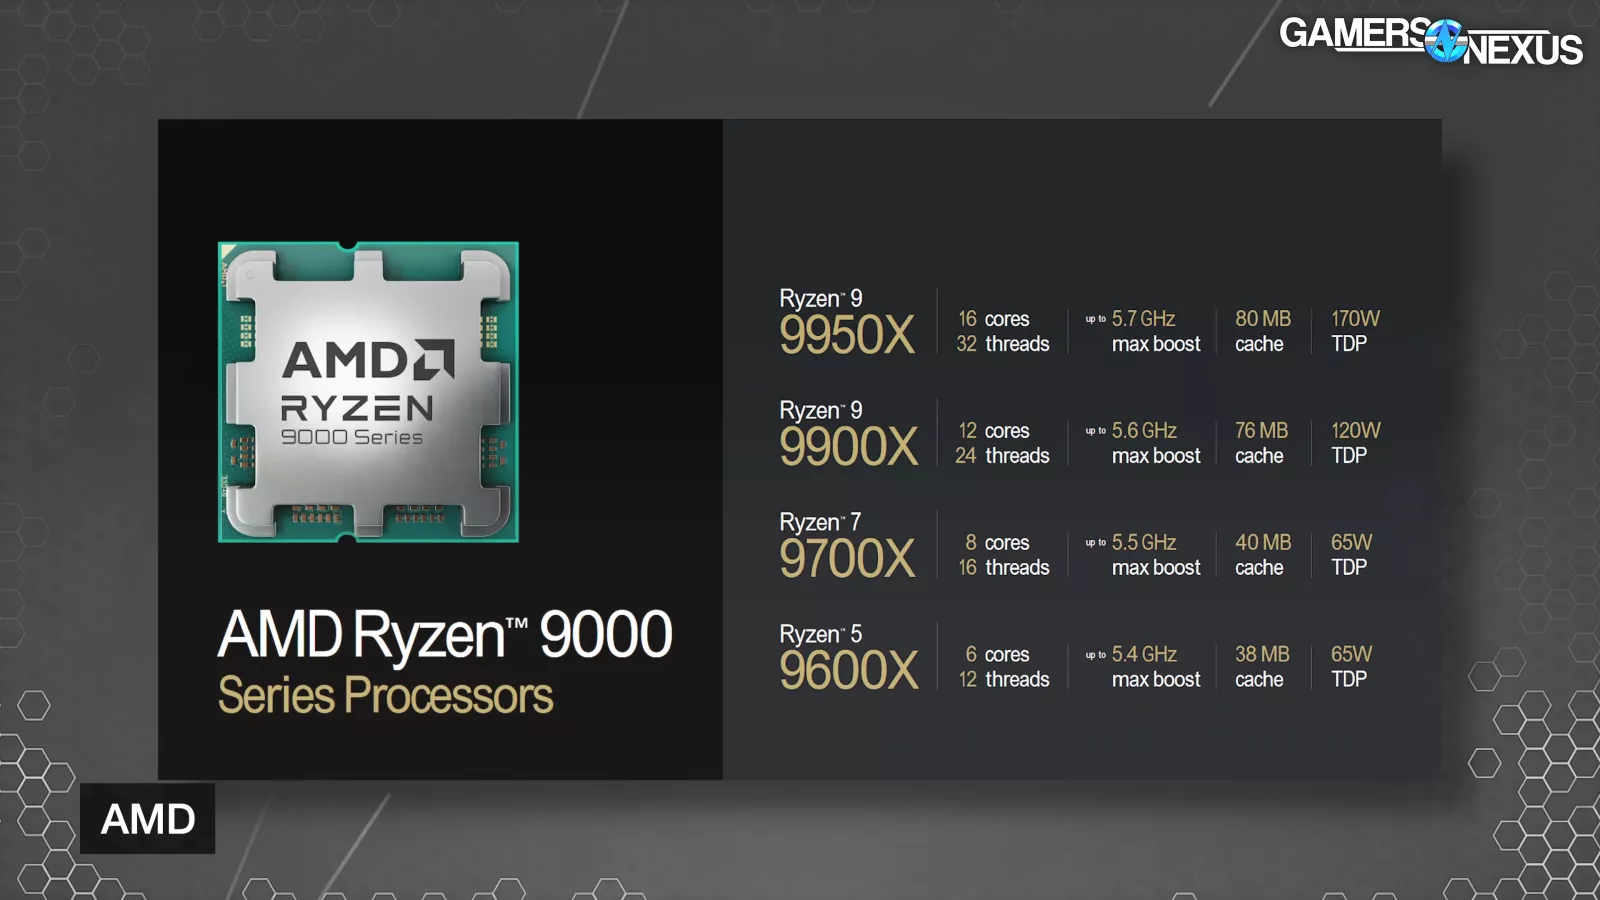
But those launch next week. AMD is launching the 9700X and 9600X today, with the 9950X and 9900X launching next week. The 9700X will cost $360 and the 9600X will cost $280.
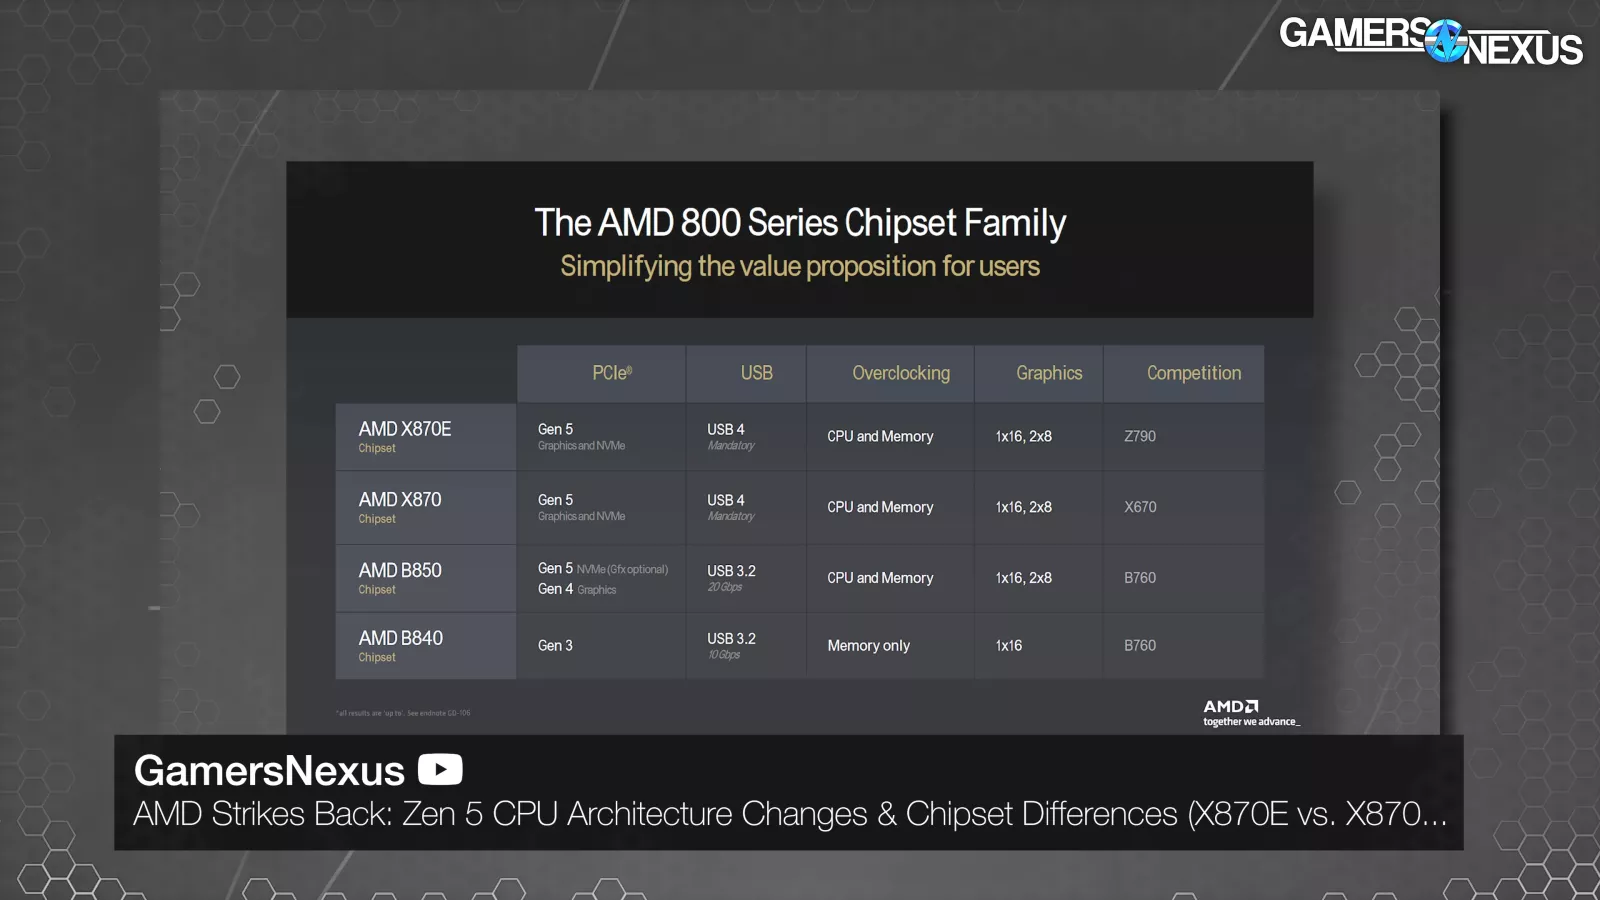
This sockets into the AM5 platform and uses existing chipsets, but will also be followed shortly by new chipsets in the 800-series, like X870E. We covered that and architectural differences.
Today’s focus is on performance.
Overview
It’d help to get some quick market prices so that everyone watching is up to speed on the current options.
Checking Newegg and Amazon, and keeping in mind that the 9700X is $360, we found these to be relevant:
- For AM4 users, the 5700X3D is a good upgrade at $209, sometimes on sale for $180
- The 7800X3D is going to be better for gaming in many cases than current Zen 5 and costs $375
- The 7700X costs $294, meaning the 9700X is 22% more expensive right now
- The 7600X is $200 (against $280 on the 9600X)
- The 14900K is $581
- The 14700K is $398
- And Intel’s most reliable current processor, the 12900K, is $326
- As a reminder, we are not currently comfortable recommending Intel’s 13th or 14th Gen CPUs until we can evaluate their new microcode and until the company begins acting in good faith to help its customers. You can watch our previous video for more about that.
We had problems working on these CPUs. We haven’t had any major problems with AMD’s launches for a couple of years now, but this one felt like a regression.
AMD sent out the newest BIOS versions for common test boards. The ASUS X670E board we use was among those updated, which is good.
Except we noticed a number of problems:
First, we noticed that FCLK was defaulting to 2100MHz, which is an error. It is supposed to default to 2000MHz still, which we confirmed with AMD. Fortunately, we control our FCLK manually for tests, so this didn’t affect us; however, anyone not paying attention may either have artificially high performance in these tests vs. the prior generation as a result of a non-like-for-like comparison and some may have instability.
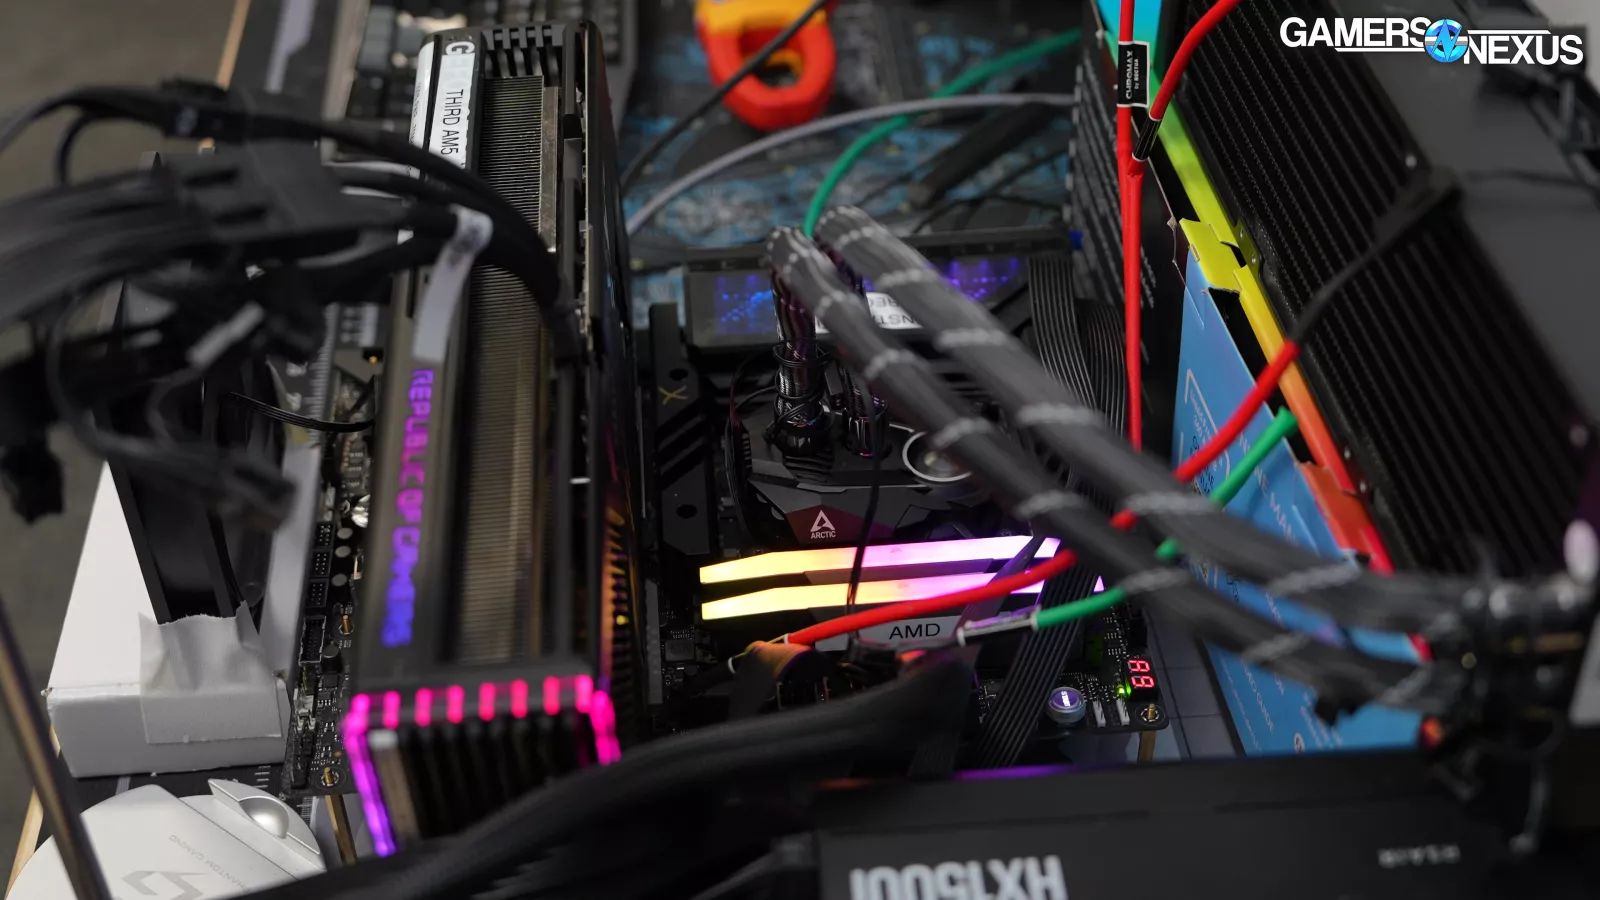
We typically use a 2-stick kit of Corsair DDR5-6000 memory for AM5. This has been used on all AM5 CPUs we’ve tested to-date, including on our exact board; however, we cannot get the 9600X or 9700X to stay stable with the same board we’ve been using, although there was a BIOS update so that is a possible and maybe likely candidate for why. We manually control most relevant timings and the voltage, plus we control the FCLK and UCLK:MCLK ratios, and it still wasn’t stable.
We eventually got the 9700X working with a very similarly spec’d Lexar DDR5-6000 kit; however, the Lexar kit has some looser timings. This will minimally affect performance comparisons, but was more frustrating because it felt like AMD’s old teething issues with memory.
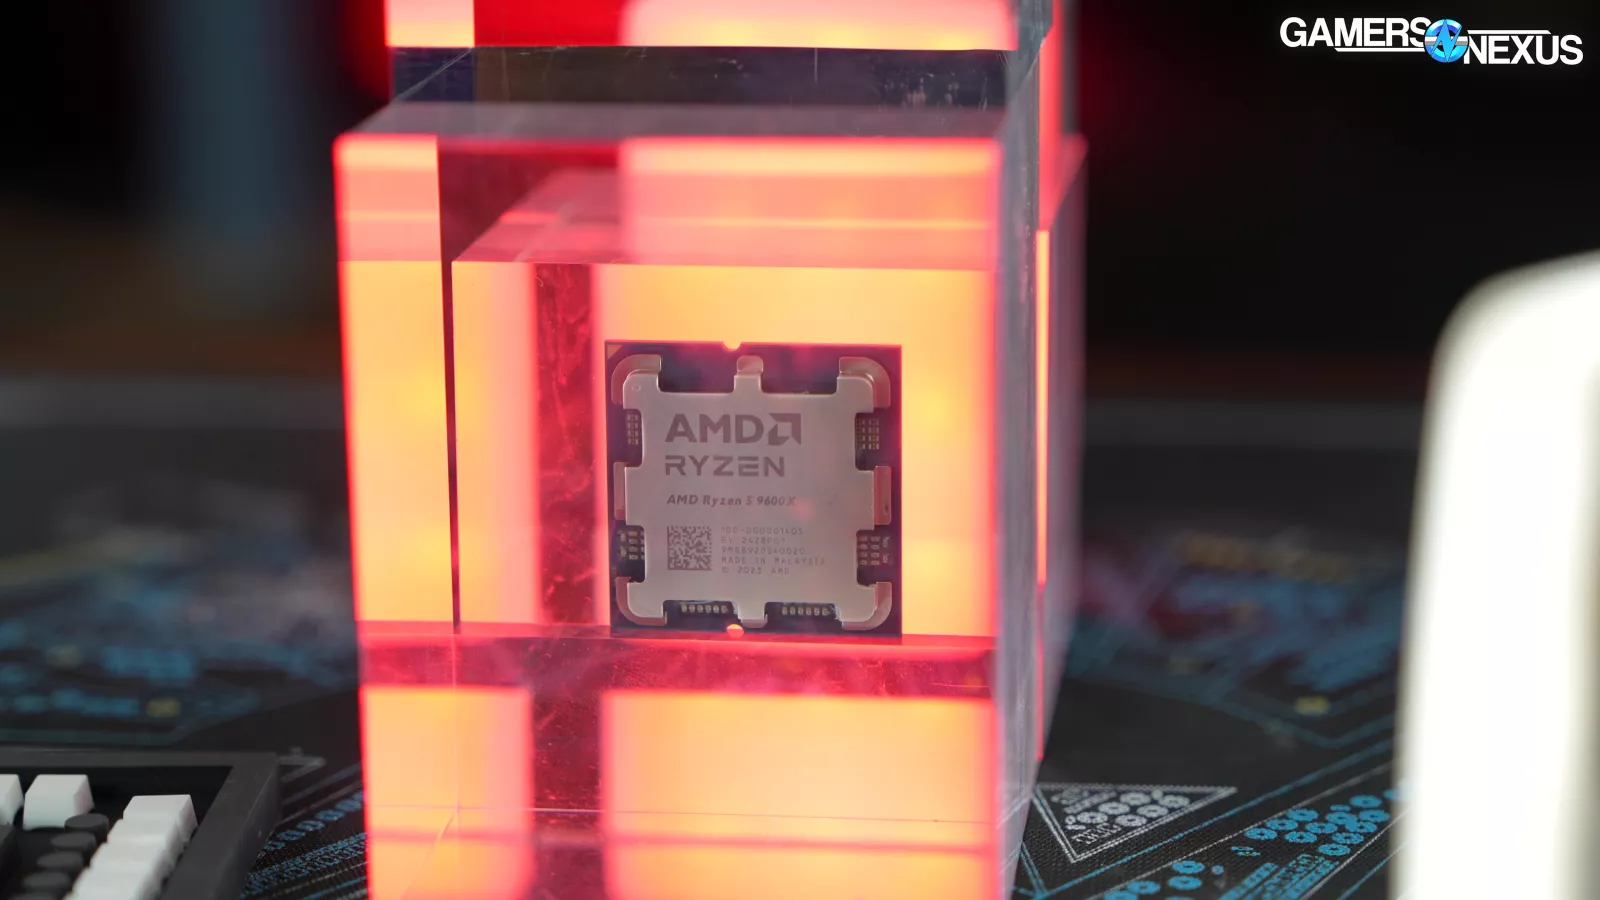
The 9600X was not able to hold stability, which we’ll get into in our upcoming 9600X review.
Regardless, we got the 9700X working on very similar memory, so it is mostly comparable. That said, differences within 1-2% of no-change can be thought of as within slightly wider margins due to the change.
Test Methodology
We recently debuted our new suite of testing for CPUs in our revisit of the 3700X and 3600 CPUs. To quickly go over the major changes, here’s the list of games we’re currently testing:
GN CPU Review Game Tests
| Game | Year Released |
| Final Fantasy XIV: Dawntrail | 2024 |
| Dragon's Dogma 2 | 2024 |
| F1 24 | 2024 |
| Baldur's Gate 3 | 2023 |
| Starfield | 2023 |
| Cyberpunk: Phantom Liberty | 2023 |
| Total War: Warhammer III | 2022 |
| Stellaris | 2016 |
| Rainbow Six Siege | 2015 |
Not every one of these will be in every review. We sometimes rotate them out temporarily if game updates render existing data incomparable, like what just happened with Rainbow Six’s newest patch.
All games are from 2024 or 2023, with the exception of Total War: Warhammer III from 2022, Stellaris (originally from 2016), and Rainbow Six Siege (from 2015). These have continued to receive updates, though, and Stellaris remains important for evaluating sim time rather than just framerate.
Here’s a list of our current production or workstation tests.
| GN CPU Review Production Tests |
| SpecWS: Finance Models |
| SpecWS: Computational Fluid Dynamics |
| SpecWS: Biomedical & Health Simulation |
| 7-Zip File Compression |
| 7-Zip File Decompression |
| Chromium Code Compile |
| Blender Rendering |
| Puget: Adobe Photoshop |
| Puget: Adobe Premiere |
| Cinebench R23 NT |
| Cinebench R23 1T |
The main addition here is Spec Workstation. Otherwise, everything is mostly the same as it has been, just updated to newer versions of the software. Spec Workstation has become a standardized test for us as part of our CPU reviews, however, it is still in experimental phases, which means we’re still determining how exactly we want to use it and test it and it follows our use in our Threadripper reviews previously.
And here’s our list of miscellaneous tests we do, such as thermal, power, and frequency logging.
GN CPU Review Misc.
| Software | Tests |
| Blender + HWINFO | FrequencyThermalPower |
| Cinebench 1T + HWINFO | FrequencyExternal Validation |
| Blender + EPS12V Monitoring | PowerEfficiency |
| Limited Games Suite | Efficiency |
Finally, we removed this list of CPUs from our data for this review. We have these tested, but removed them because the charts became too crowded and difficult to read or because we were still validating some results. These will go live in a separate Mega Charts piece soon.
| Removed | Reason |
| 9900K | Space |
| 9700K | Space |
| 8700K | Not finalized |
| 8600K | Space |
| 8086K | Space/redundant |
| 1300X | Space |
| 9100F | Irrelevant |
| 13400F | Not finalized |
| 9600X | Broken |
| 9600K | Space |
| G7400 | Irrelevant |
| 7950X3D | Will add for 9950X |
| 7900X | Will add for 9900X |
| 5950X | Space(Better 5000 series options for gaming) |
| 3950X | Space(Better 3000 series options for gaming) |
| 12400 | Space |
All of this is on our website free of third-party ads in the living document page for our general test benches and methodologies. It doesn’t contain full details as we’re still building it all out, but has most of the basics for you. You can check that page for updates on what we’re using lab-wide. That’ll give component information like the memory kits, motherboards, and so on. We’ll run some methodology videos as soon as we can find the time to put them together.
Let’s get into the data.

CPU Power Consumption - Blender All-Core
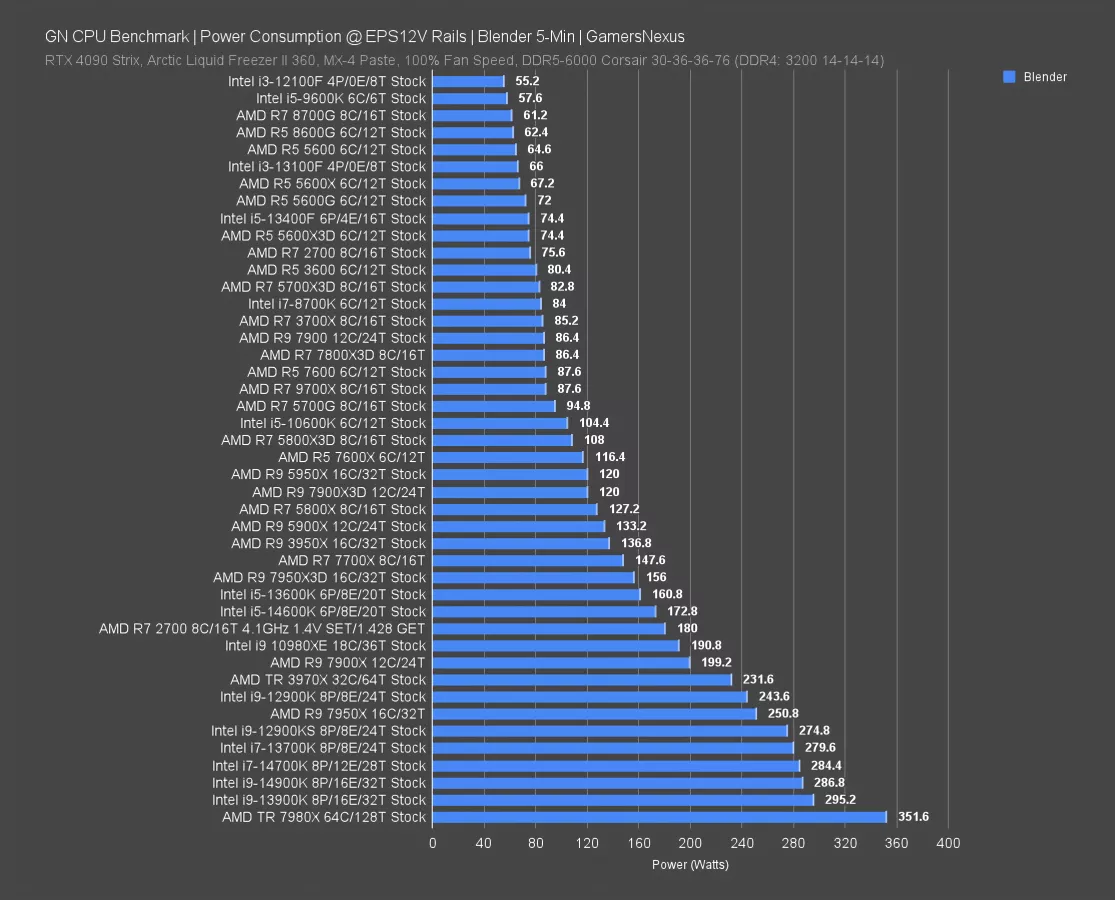
We’ll start with power consumption and efficiency, seeing as that’s the most promising aspect of Zen 5.
This is tested in an all-core Blender workload that’s intended to max-out the power and measured after at least 5 minutes elapse, ensuring that any Tau-based boosting behavior on older Intel CPUs is in effect.
The 9700X pulled 88W at the EPS12V cables, which has it equal to the non-X 7600 and 7900 CPUs and similar to the older 3700X. The 7700X pulls significantly more power at about 150W. This will be important throughout this review: There are times that the 9700X slightly regresses or equals the 7700X (watch our review), and that’ll be from the company’s choices on power limiting and boosting. In the very least, it is a significantly lower power part. Whether that’s an improvement depends on performance.
For reference, the 14900K was pulling about 287W with our original review microcode, ranked right alongside the 14700K. The Threadripper 7980X was at about 352W for significantly more all-core performance.
Power Efficiency - Blender All-Core
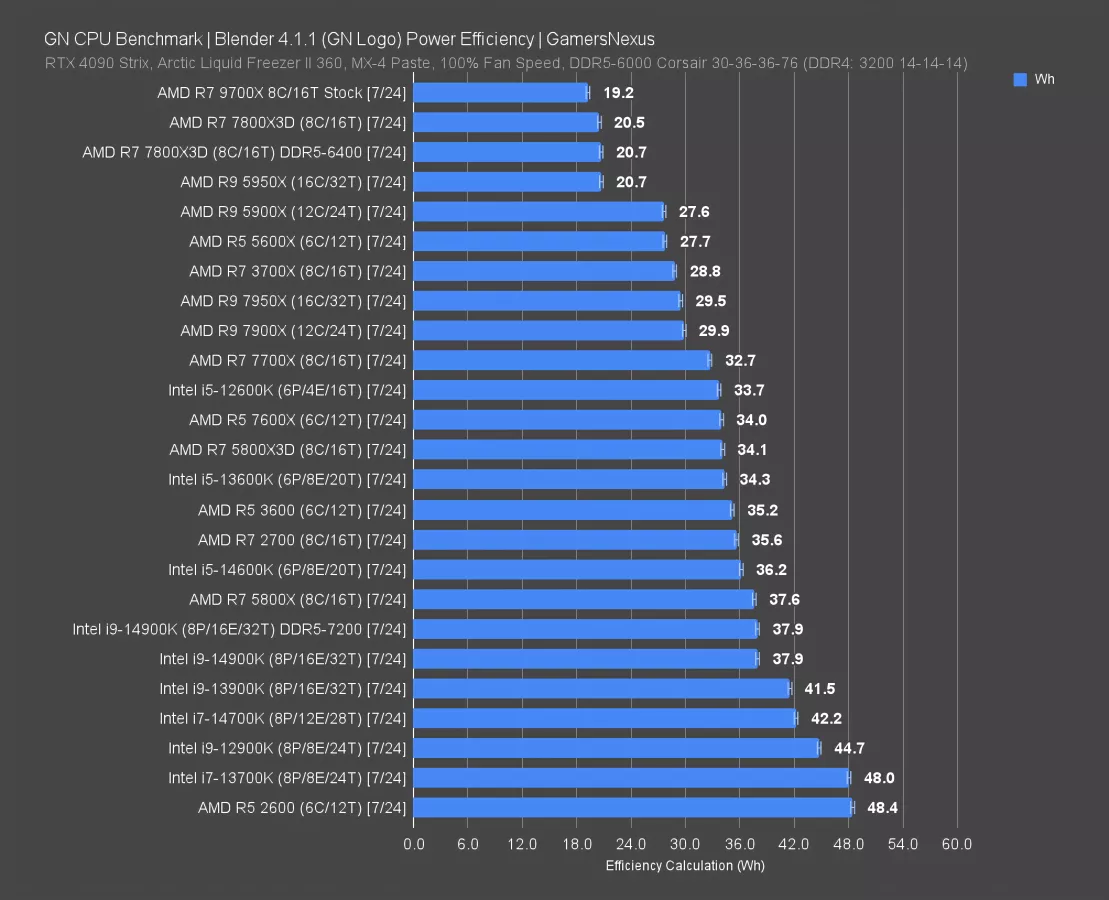
Now for efficiency. This informs us how much work is completed per unit of power. We’re looking at total energy consumed as a formula of power and time for this, ultimately resulting in watt-hours. This test is interesting because the part that completes the work fastest isn’t necessarily the most efficient (and often isn’t).
In this test, the 9700X is now our new chart leader for all-core efficiency. It gets the work done using the least amount of energy, making it the most efficient on this chart. The previous leader isn’t present, which was the 7950X in Eco Mode. In terms of things running out-of-box though, the 9700X leads. The 7800X3D is next for its low power consumption and the older 5950X remains impressive as well. Intel remains one of the least efficient in general on this chart when you look at something like the 14900K (read our review) or the 14700K (read our review), which are down towards the bottom for the out-of-box settings and Intel’s “recommended defaults,” whatever that means.
9700X Frequency
Frequency - All-Core
All-core frequency is next. These tests are important for understanding application performance later.
Prepare to be disappointed.
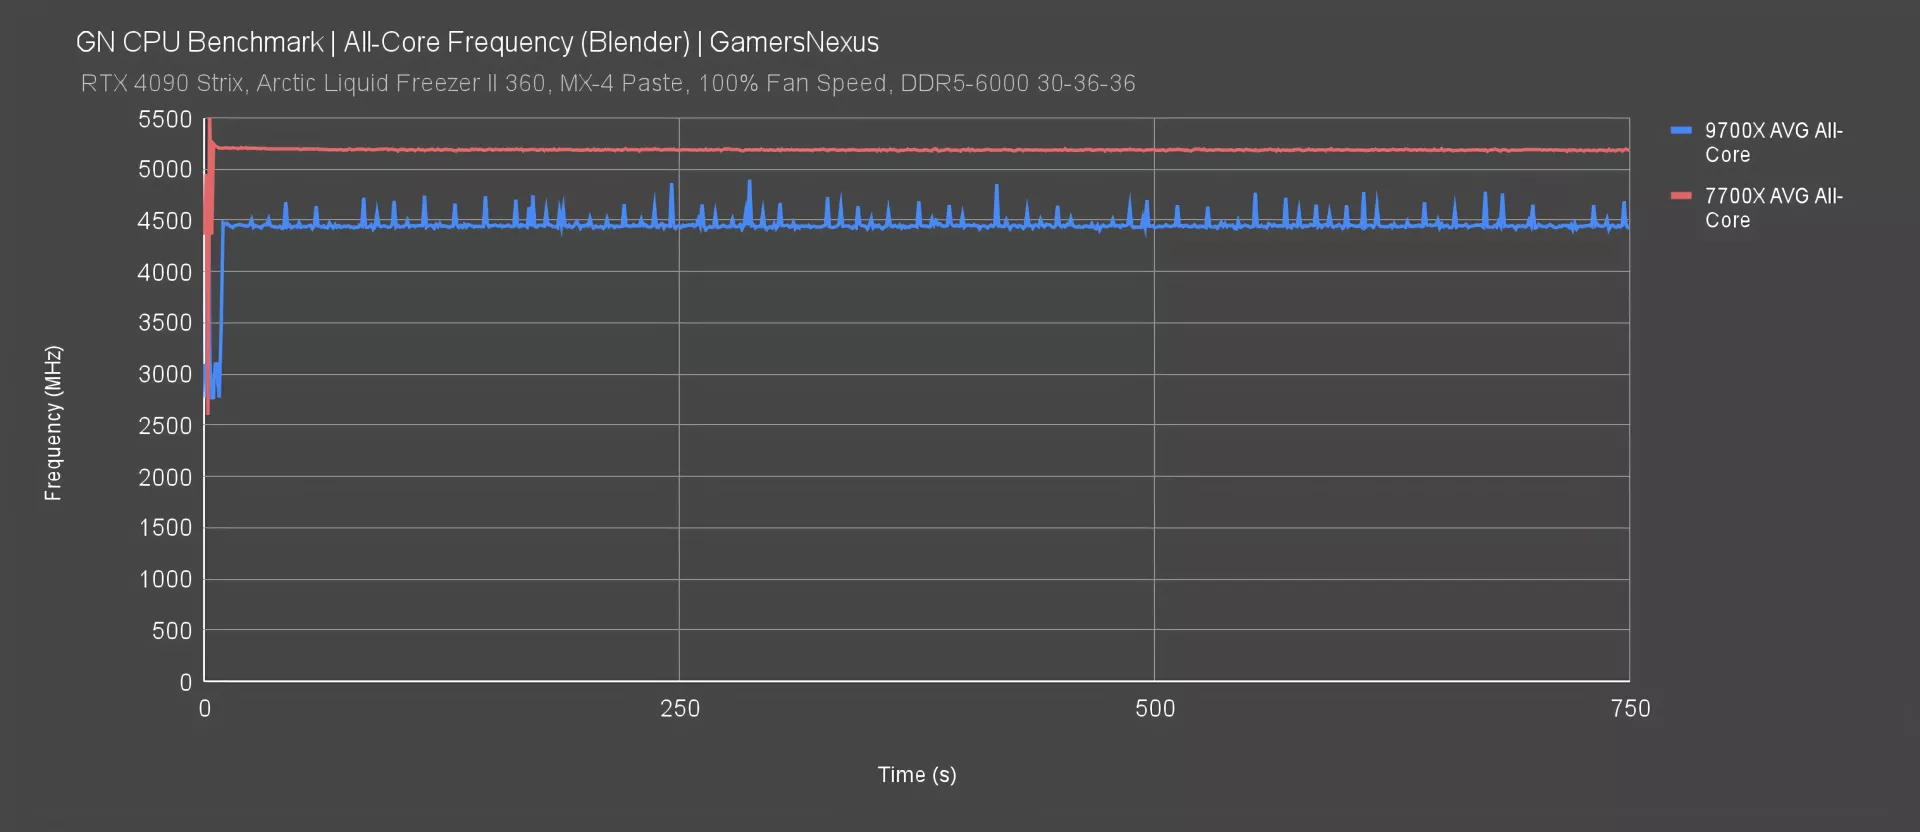
Testing with all threads engaged, the 9700X ran at an average all-core frequency of about 4440-4480MHz, with frequent spikes above that in a deviation from typical Ryzen boosting behavior. This is a remarkably low all-core frequency and is a result of the default power limits imposed on the CPU by AMD. Plotting the 7700X, we see the predecessor at 5200MHz initially, with a slow decay to around 5190MHz. There are no spikes that appear. That’s a huge gap between these 2 CPUs, one of which is supposed to be a predecessor.
Frequency alone doesn’t mean anything for performance, but it is an indicator of it. Architectural differences mean that the frequency between the two is not purely like-for-like comparable, but this will explain some performance in all-core loads later.
This is why manufacturers have “up to” numbers for boosting. It is typical that the boost listed on a box is higher than the all-core boost, as the listed spec normally refers to a low thread count load. We can look at that next.
Frequency - Single Core
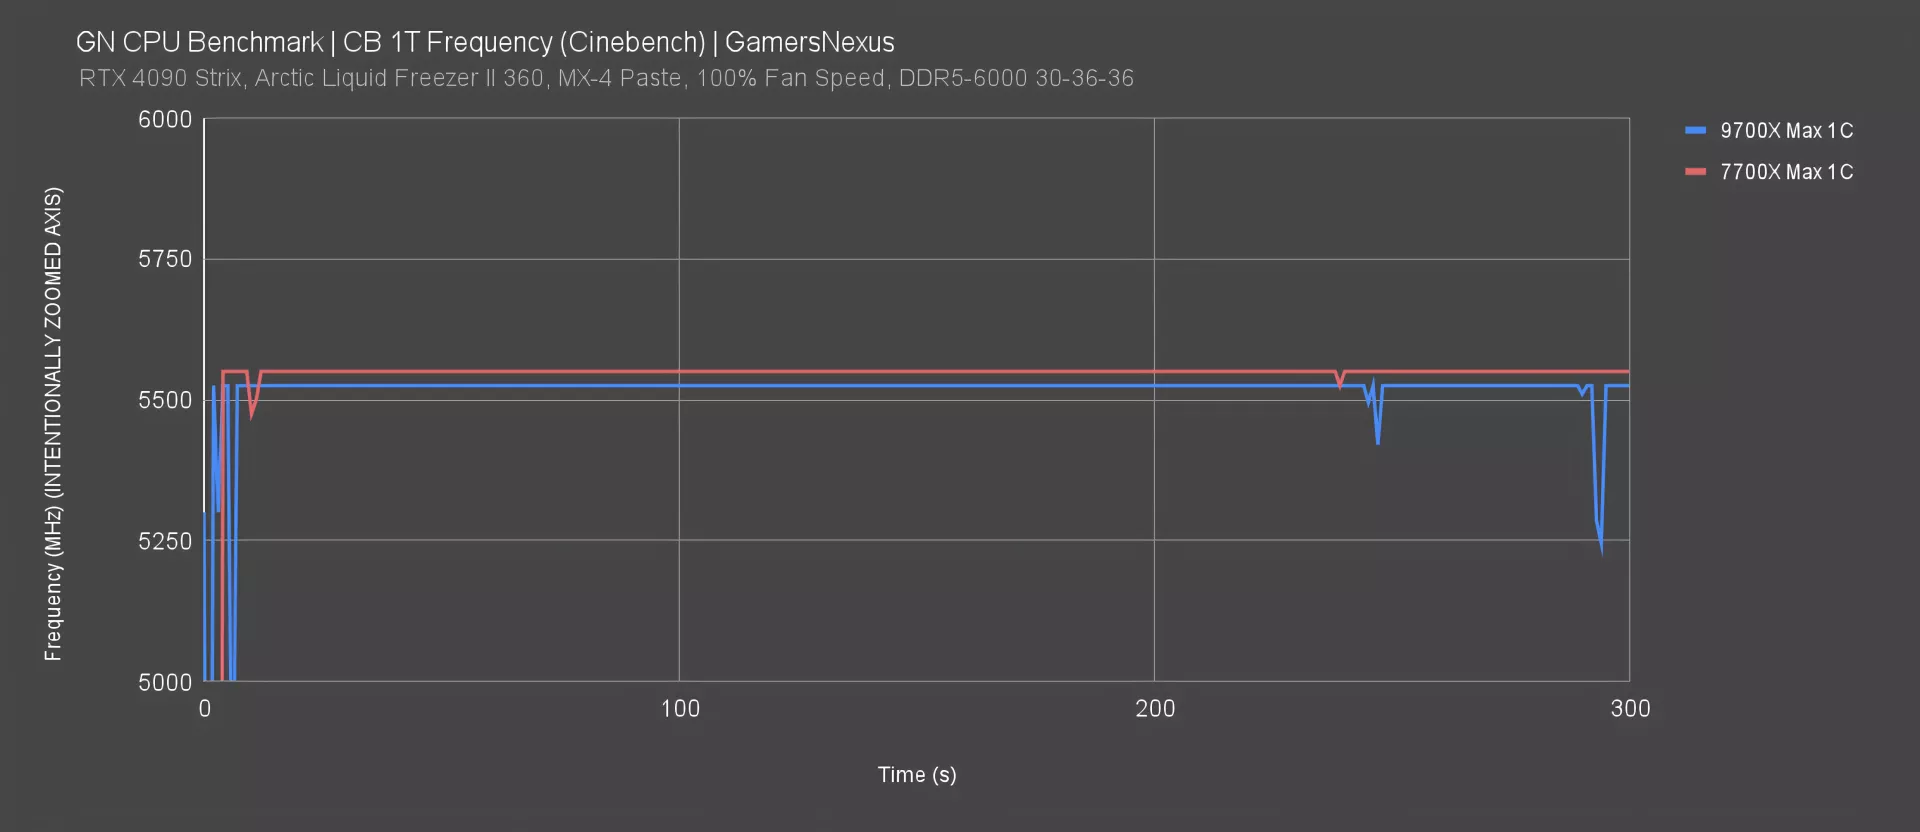
Single core frequency has the 9700X at 5525MHz flat in Cinebench single-threaded. The advertised spec is “up to 5.5GHz,” so they hit the advertisement. Our 7700X ran the same test at 5550MHz, slightly higher, but 25MHz isn’t a big enough swing to counterbalance the architectural improvements in the 9700X. We should see improvements in applications where they run a lower thread count.
9700X Thermals - All-Core
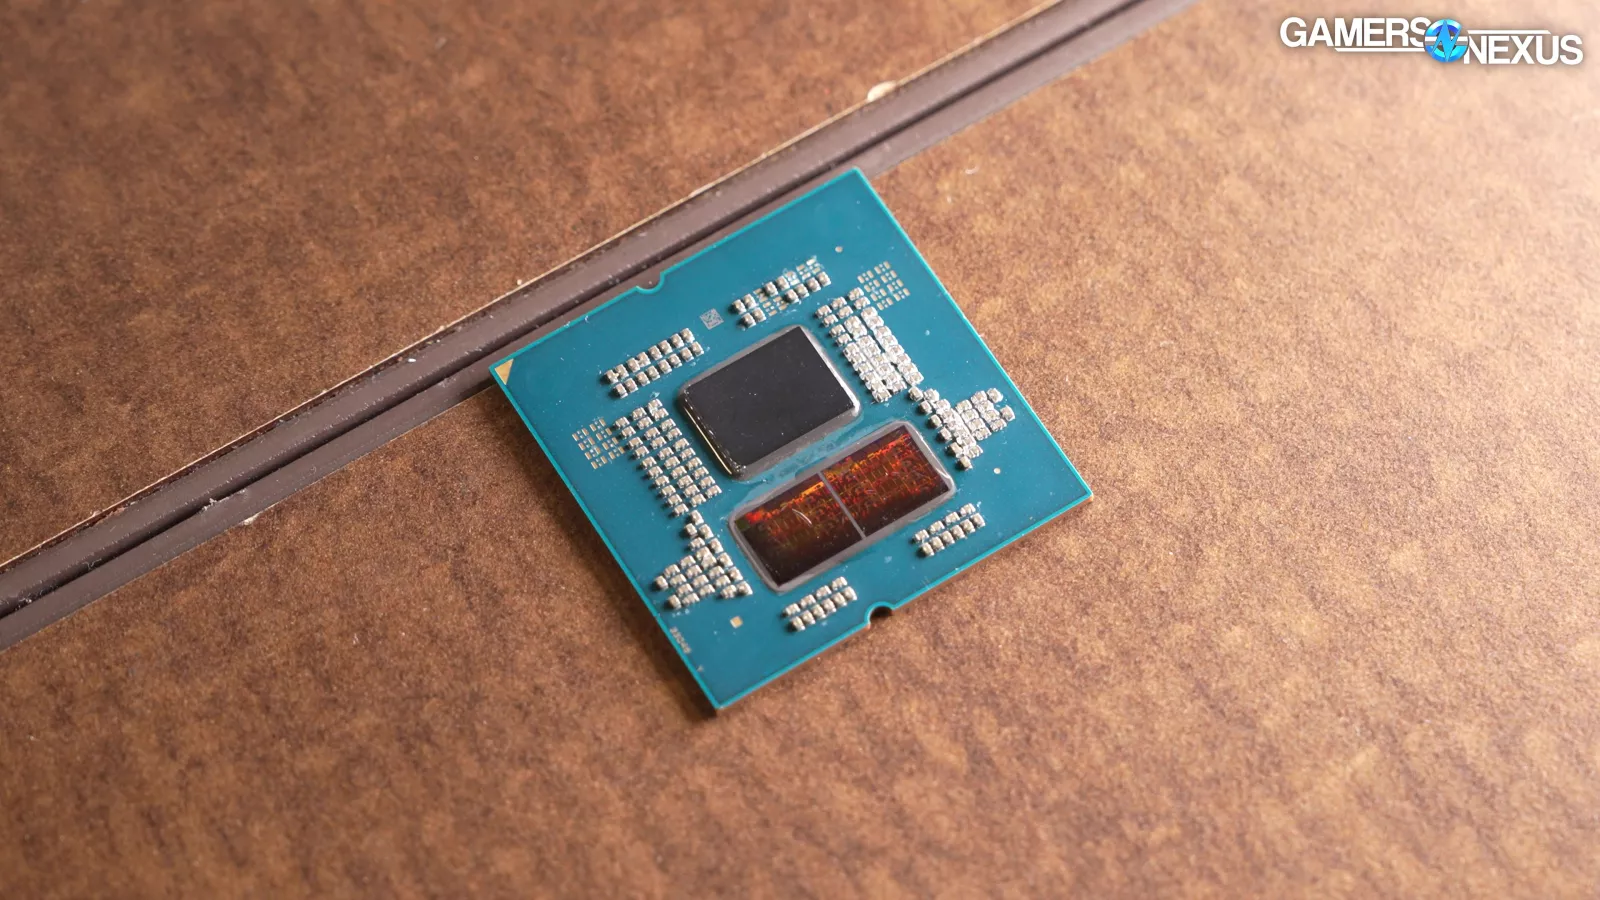
The next big one will be thermals. This is an important section: AMD has moved the sensors to reduce hot spots, if we believe the reasoning, and the result of this is that the 7700X and 9700X cannot be directly compared with the internal sensors with out-of-box settings. What we can do though is compare the sensor behavior. Because the chiplet layout is the same and the IHS is the same, we can mostly isolate for architecture and sensor behavior.
For this test, we’re going to limit the 7700X down to the exact same power consumption as the 9700X in Blender, so we’ll run both at 86-87W in Blender at the EPS12V cables. That’s about a 90W PPT on the 7700X, or similar to the Eco Mode levels.
Here’s the result.
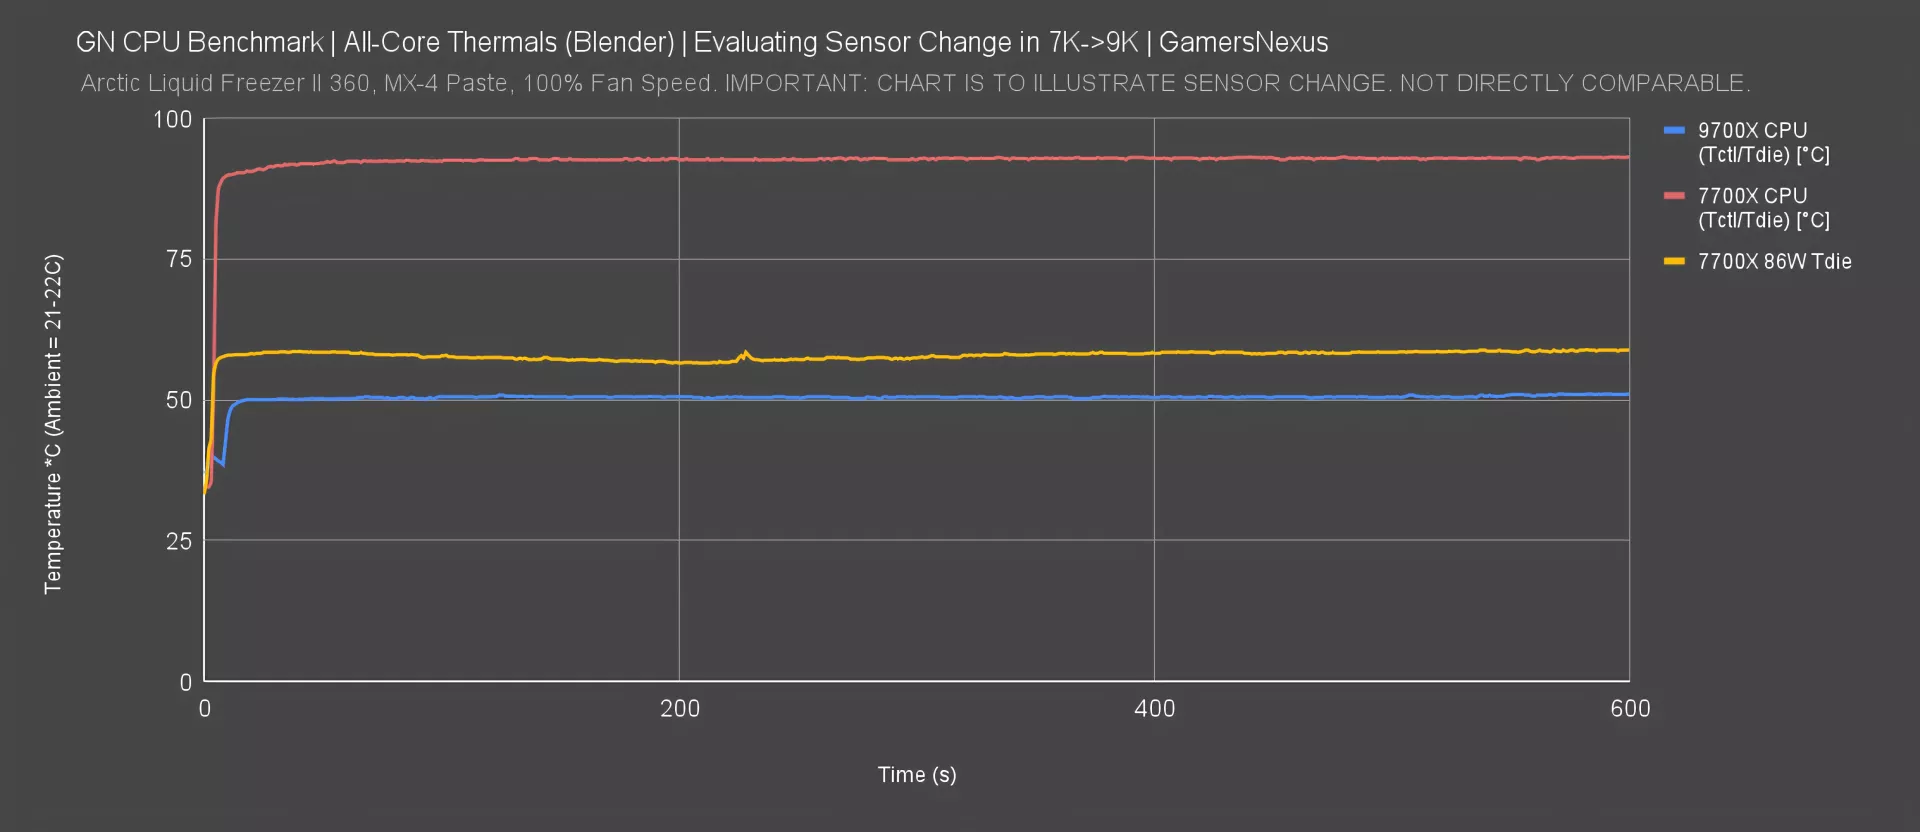
The 9700X plotted at about 50-52 degrees Celsius in a 21C ambient under a 360mm Liquid Freezer II at 100% fan speeds. This was with an all-core load. The original 7700X result at 150W ran at about 92 degrees Celsius. Remember that this was by design for the 7000 series: These CPUs boosted until they hit a thermal limit and would keep boosting until hitting a power limit. The limit is 95C. So we have two things going on: It looks higher because it’s boosting until that point, but also because AMD moved the sensors.
Unveiling the 7700X at the same power, we see it’s now at about 59 degrees Celsius. As compared to the 9700X, this helps us understand two things. One is whatever the actual improvements there may be and the other is the change to the sensor behavior itself. This is much more directly comparable to the 9700X. It is as close as we can get without external sensors and the end result is closer to an 8 or maybe 9 degree change depending on where you look on the chart. So this makes sense and AMD’s previous claims were approximately 7 degrees Celsius at the same TDP. We're actually remarkably close for this approach so this would be the closest we can get to a real comparison. Although it'd be one hell of a story to say that AMD reduced it by 40 degrees, it's really just not that simple.
9700X Game Benchmarks
Starfield (1080p)
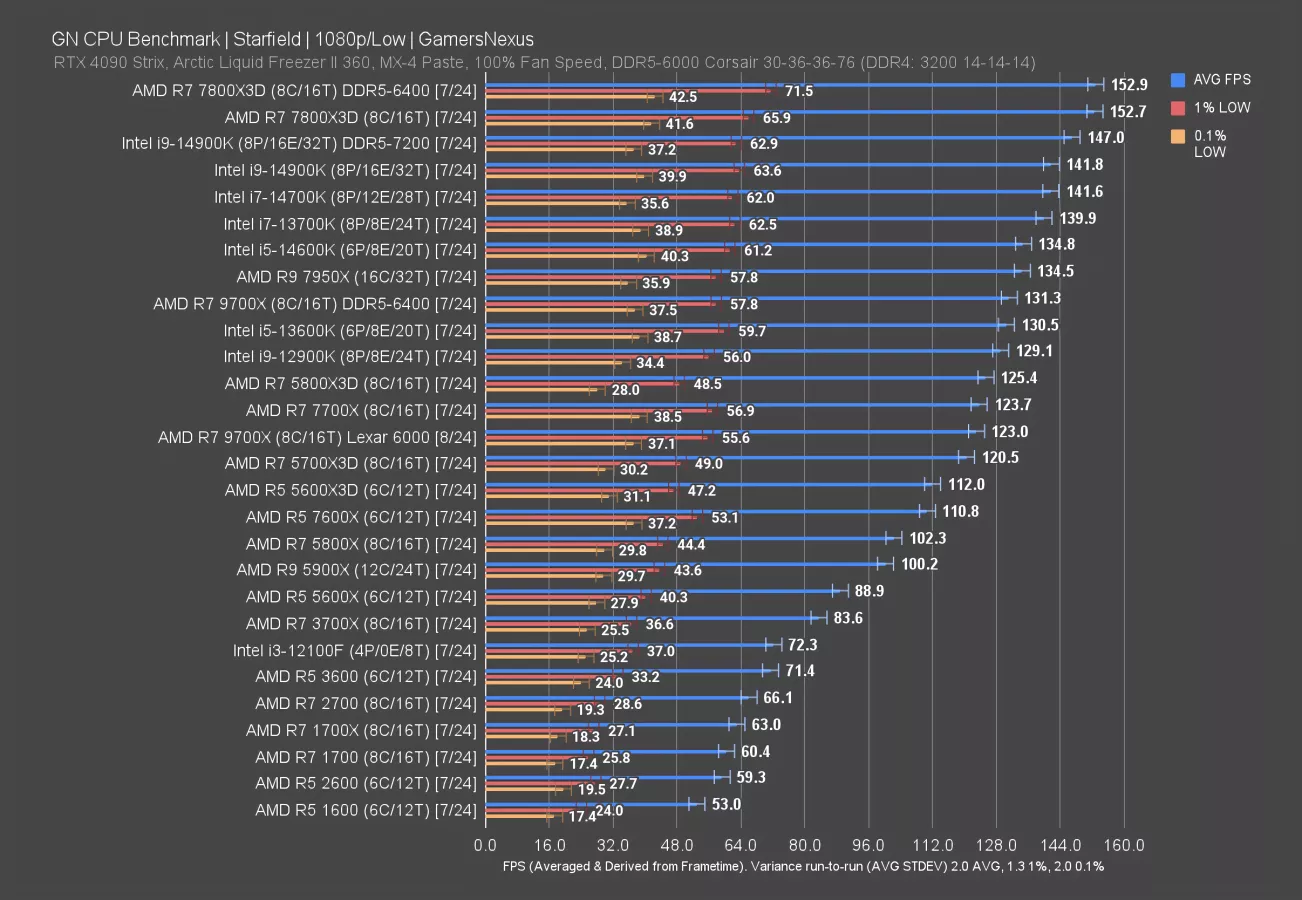
Starfield is just embarrassing for AMD. The 9700X technically is below the 7700X here, but in reality, they’re about equal. This may explain why AMD stalled this launch. We’ve seen this with AMD in the past -- notably, the 5950X and 3950X (watch our review) in some production tests -- but this is just sad for the 9700X. It would have to be a good deal cheaper to matter.
The higher spec memory helped it here, but remember that applying the same memory to the 7700X would likely yield another result nearing equivalence. Still, this is one of the few games where we saw uplift on the 9700X with the faster spec memory. The 7800X3D (watch our review) didn’t seem to benefit much from it, but this is consistent with less reliance on memory in general due to the larger cache.
As for Intel, there’s a large block that leads the 9700X, including the 14600K, 13700K, 14700K, and 14900K -- for now, at least -- with the 7800X3D above those.
FFXIV: Dawntrail (1080p)
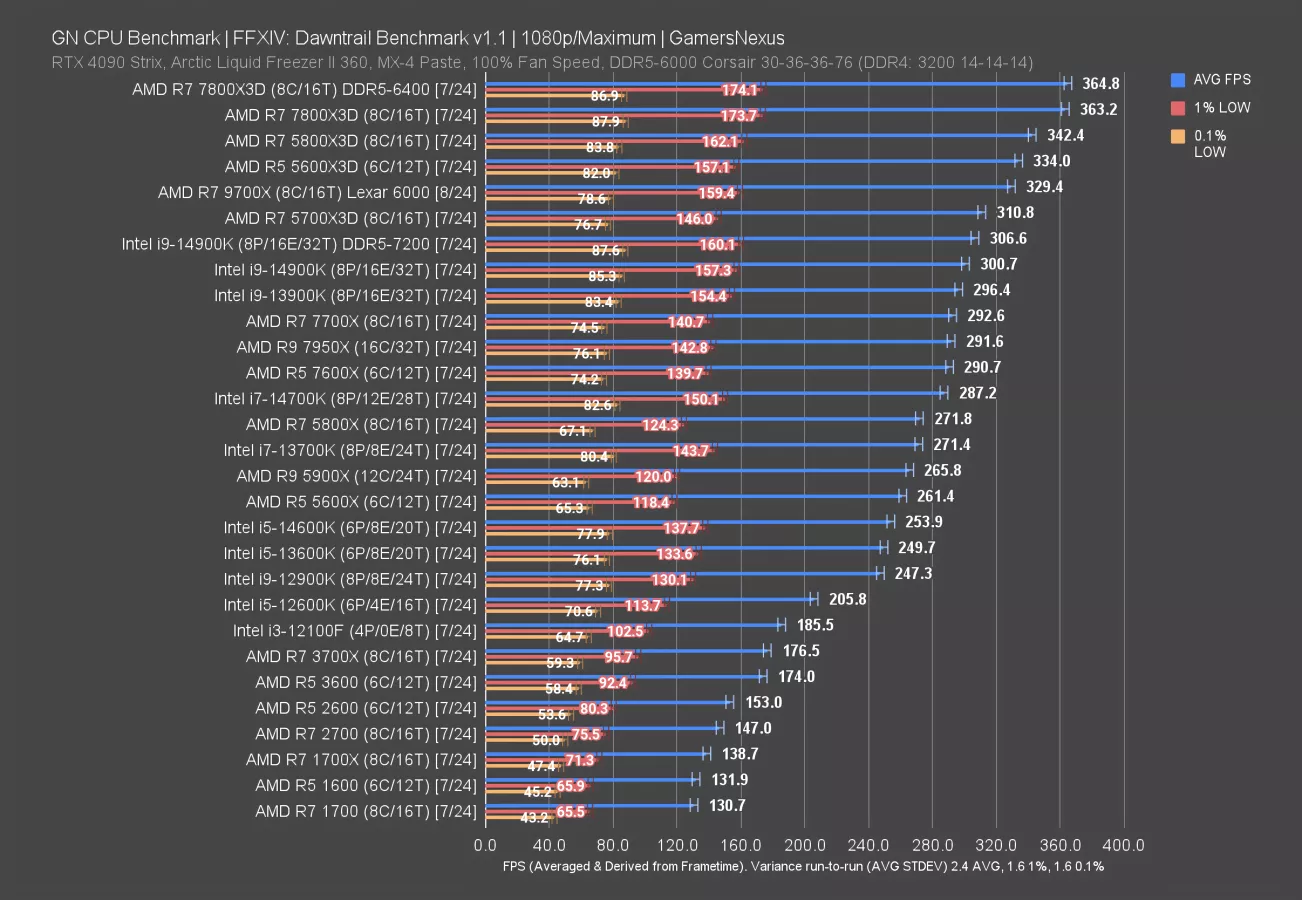
Final Fantasy 14: Dawntrail is up now. This is a brand new, 2024 update to FFXIV and includes a complete overhaul of graphics and other systems. It also totally changes how Intel and AMD behave on these charts in relation to each other.
The 9700X landed at 330 FPS AVG at 1080p/Max, which has it 6% ahead of the 5700X3D’s 311 average FPS result. The lows are proportional to the average and otherwise uninteresting.
This makes the 9700X as worse than the 5600X3D (read our review). As a reminder, the 5600X3D has a 300 MHz higher boost than the 5700X3D (read our review), so in games where the clock helps more than the extra cores, it’ll outperform the 5700X3D. That’s what we’re seeing here. In either case, the 9700X ends up in a boring position: It’s below the 2-generation-old 5800X3D, which leads by 4%, and behind the 7800X3D, which leads by 10%.
Intel runs worse than cheaper AMD CPUs here. Even ignoring the uncertainty of the inbound microcode update, it isn’t competitive.
FFXIV: Dawntrail (1440p)
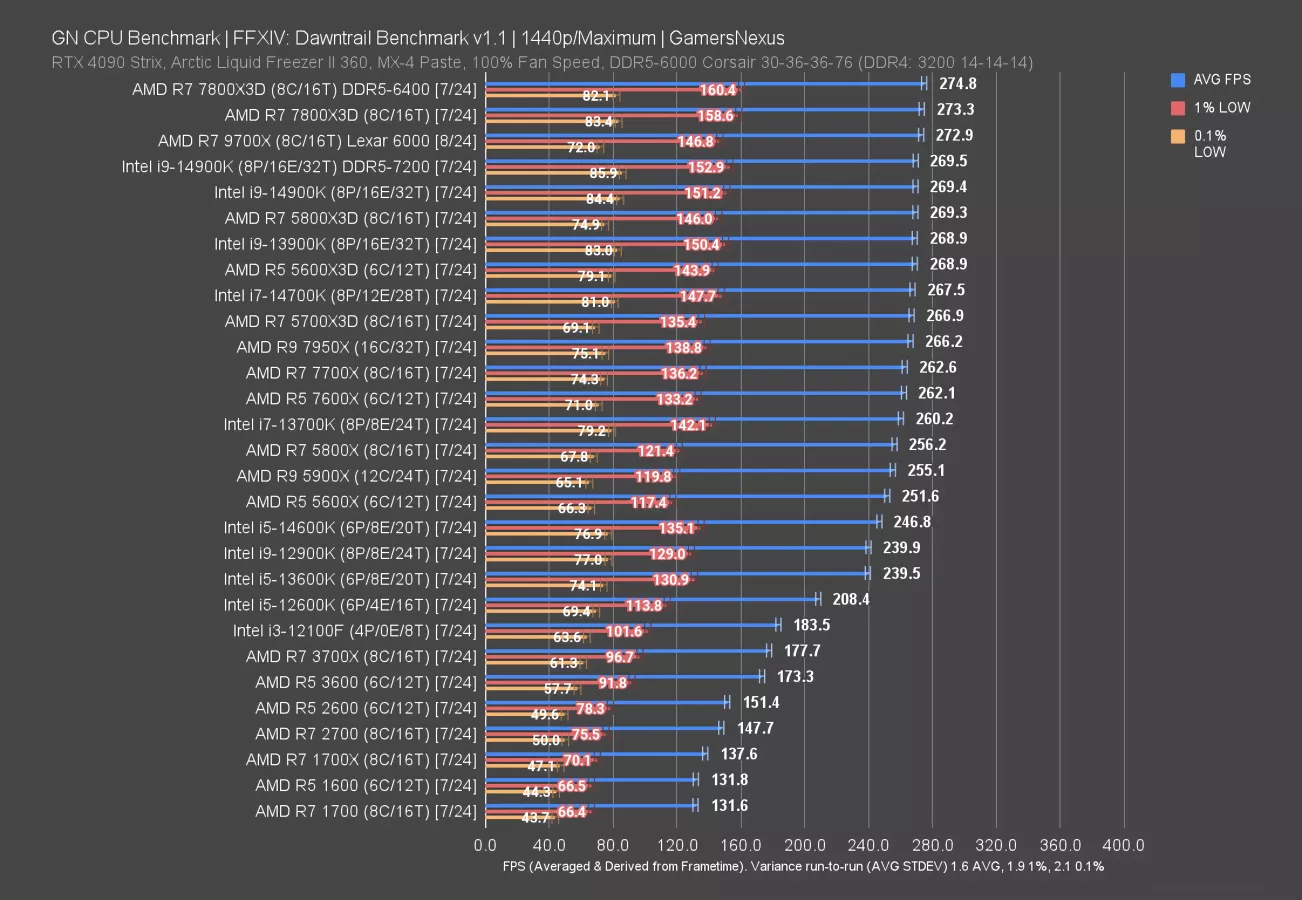
At 1440p, we’re bringing in a GPU bind to the top of the chart that limits performance scaling of the CPUs. This also makes the data less useful at the top, as it will clip the upper bound of framerate and bring down the average.
The 9700X ran at 273 FPS AVG, which had it about tied with the 7800X3D and 14900K... and 5800X3D, 5600X3D, 14700K, 5700X3D, and so on. The lead over the 7700X is real, but not meaningful at 3.9%.
Baldur’s Gate 3 (1080p)
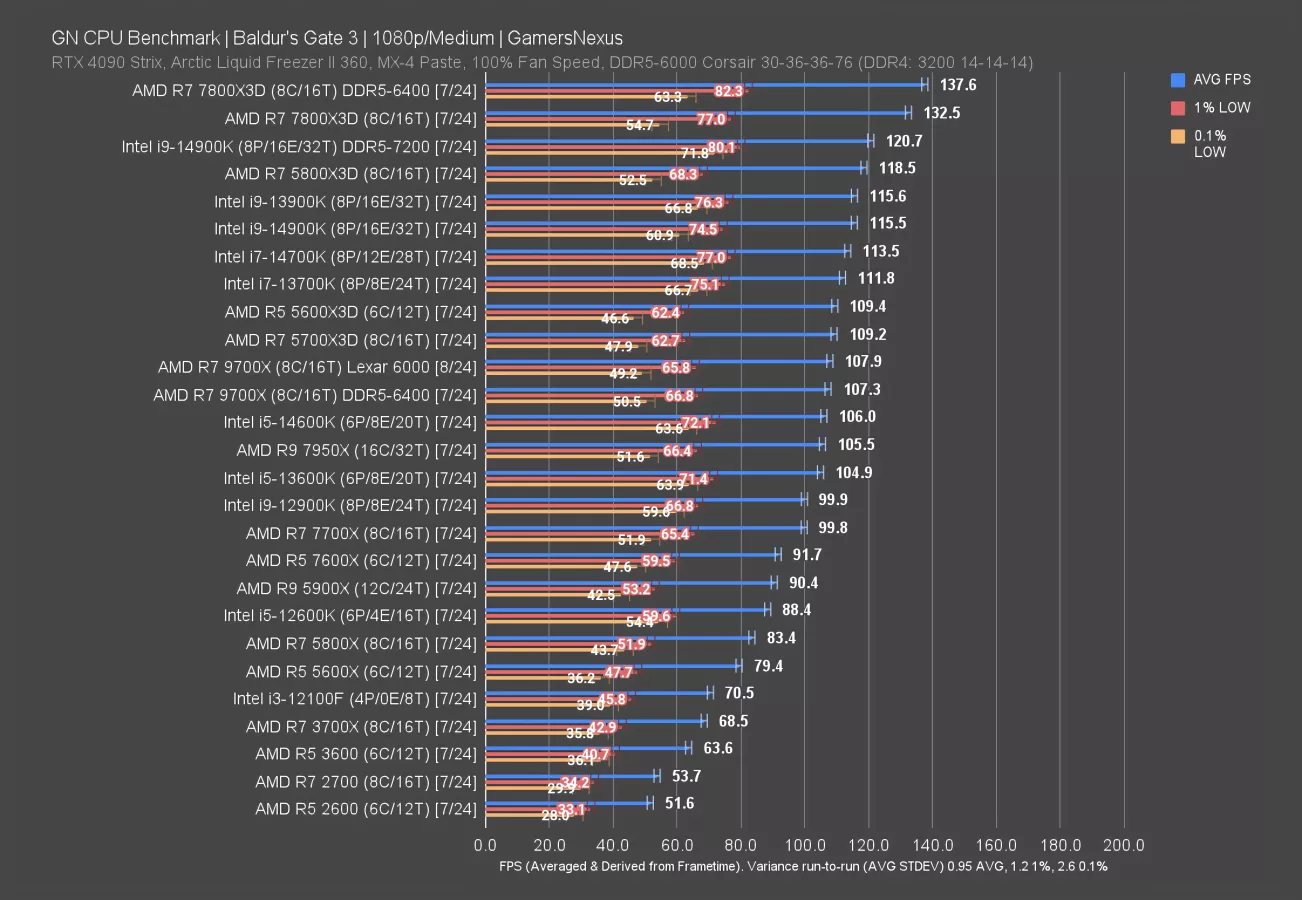
Baldur’s Gate 3 is up now, the 2023 launch that saw worldwide success.
Tested at 1080p/Medium in a carefully selected area of the city that creates a heavy CPU bind, the 9700X landed at 107-108 FPS AVG with both kits of memory. The 5700X3D has a technical but indistinguishable lead. The Intel lineup mostly clusters around 114 FPS AVG, also slightly ahead. The 7800X3D with our default memory leads the 9700X by 23% here, with the 5800X3D (watch our review here) ahead by 10%. As for things the 9700X is better than, it leads the 7700X by 8%.
Older CPUs like the R5 1600 and R7 1700 (watch our review here) ran poorly in this game, and so were removed from the data set. You can see the 2700 (watch our revisit here) and 2600 (watch our review here) for prior generation comparisons.
Generationally, the 9700X leads the 2700 non-X by 101%, the 3700X (read our revisit) by 58%, the 5700X hasn’t been retested but would be similar enough to the 5800X, which allows the 9700X a lead of 30%.
Dragon’s Dogma 2 (1080p)
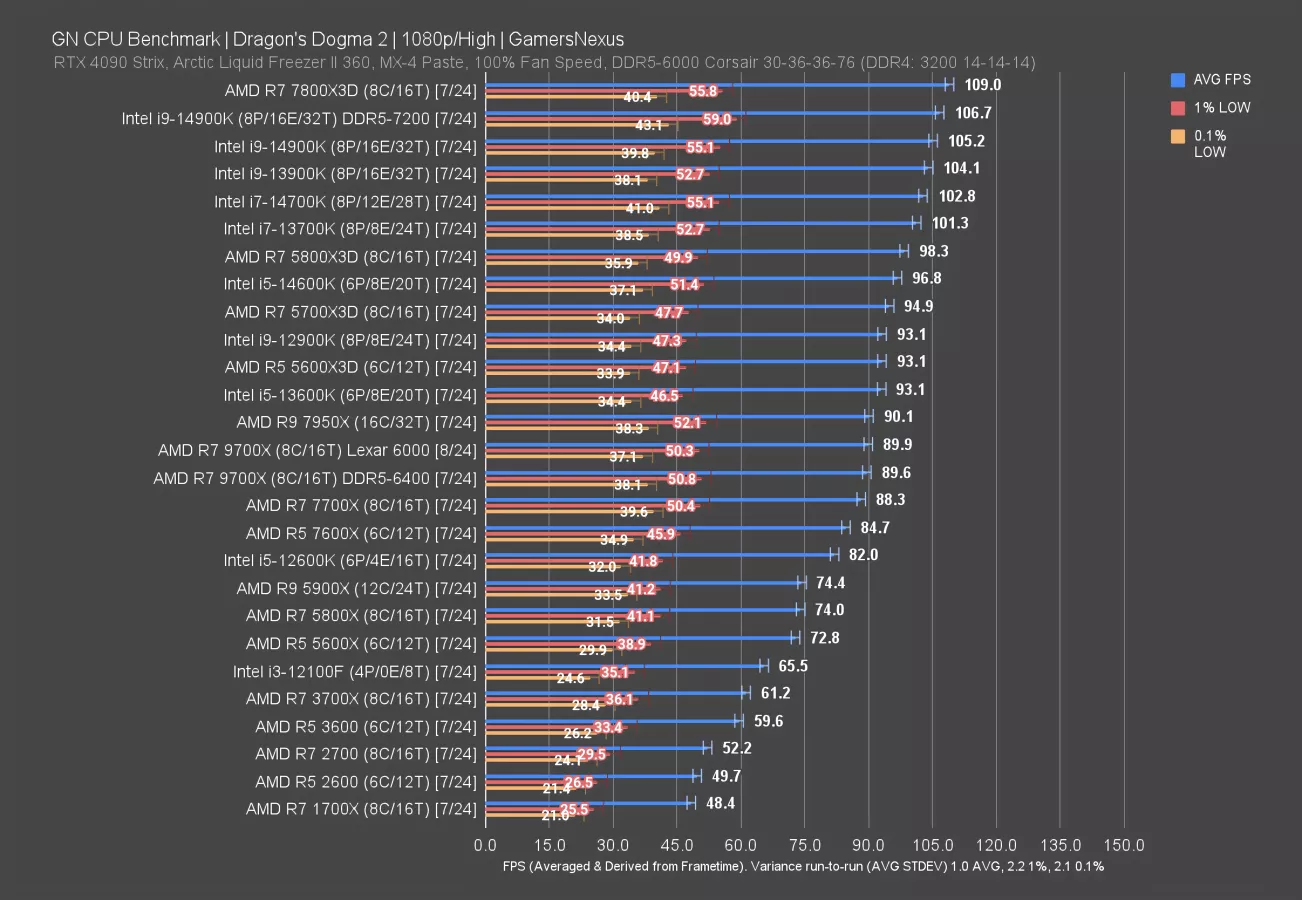
Dragon’s Dogma 2 is up next, this one from 2024 and a remarkable CPU benchmark for its NPC load. Our testing includes the game’s recent patches that claimed to improve performance.
The 5700X3D is back to leading the 9700X in this one -- and actually, so is half of the rest of the chart. The 9700X is only ahead of the 7700X by 1.8% here. The 5800X3D leads the 9700X by about 9%, with the 7800X3D leading it by 21% at 109 FPS to the 90 FPS of the newer CPU.
Compared to older CPUs, the 9700X leads the 1700X by 86%, the 2700 non-X by 72%, the 3700X by 47%, and the 5800X by 21%. Intel’s 14700K is ahead of the 9700X by 14%, though we don’t know what Intel’s microcode will do.
The 6400 kit had no meaningful change from the 6000 kit for the 9700X in this particular game, but that’s not always the case.
F1 24 (1080p)
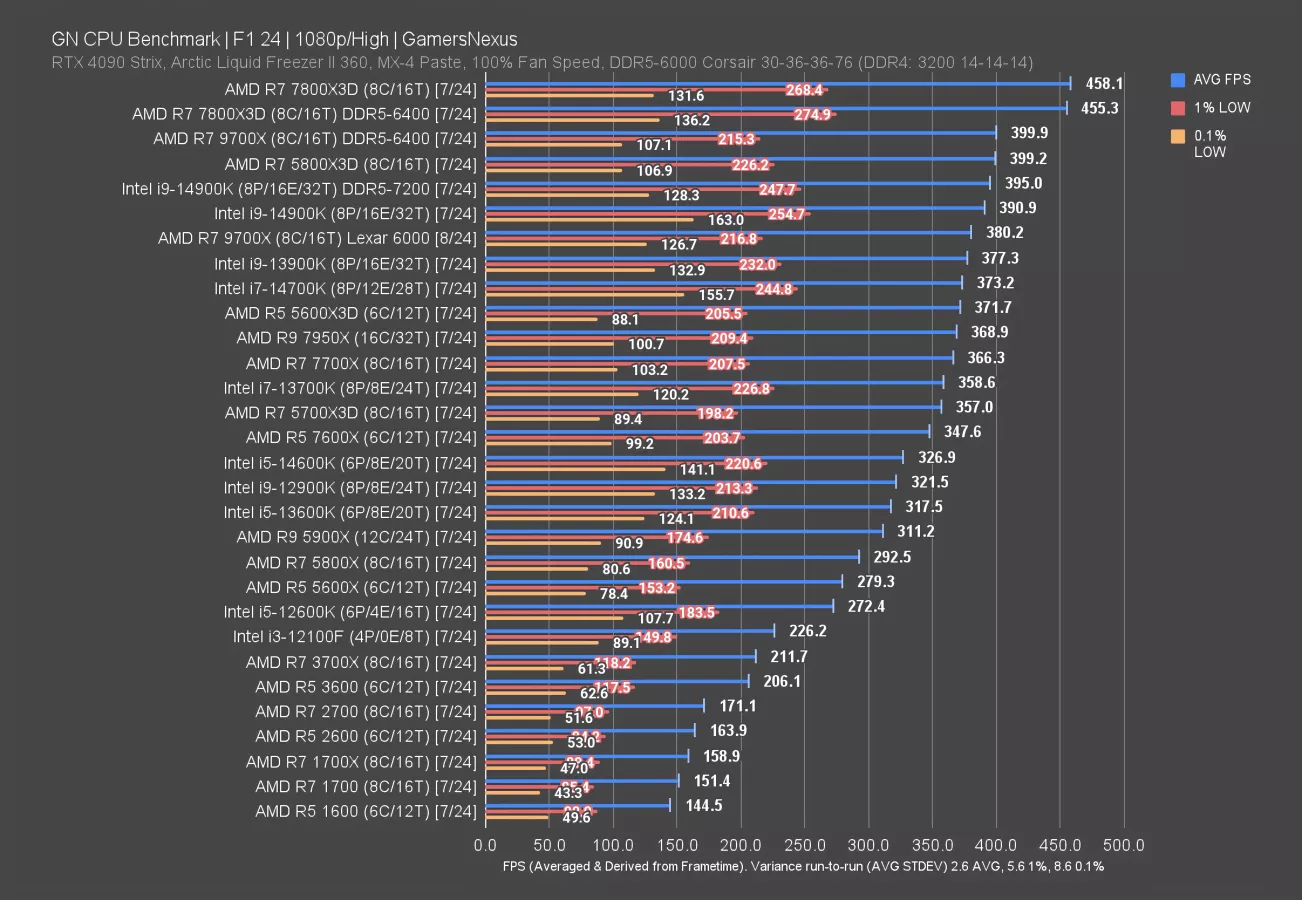
F1 24 is up next. The “24” stands for... 2024. We’re not sure what that stands for, though.
At 1080p/High, the 9700X ended up at 380 FPS AVG, with lows mostly proportional as far as AMD devices go. Intel’s 14900K has a slight advantage in 1% and 0.1% lows here, but not in a way observable to a human.
The 9700X with DDR5-6400 improves to 400 FPS AVG, a jump of 5%. The 7800X3D didn’t benefit from the same memory bump, but still leads the 9700X by 20.5%. Compared against the 7700X, the 9700X on the same memory spec was 4% ahead. Not very exciting. The 14700K trails the 9700X and leads the 7700X, landing right in the middle at the time of testing.
As for the 5700X3D, that one falls below the 9700X and 7700X in this game. The 5800X3D is still better than the 9700X with equivalent memory, though, and ties the DDR5-6400 result.
F1 24 (1440p)
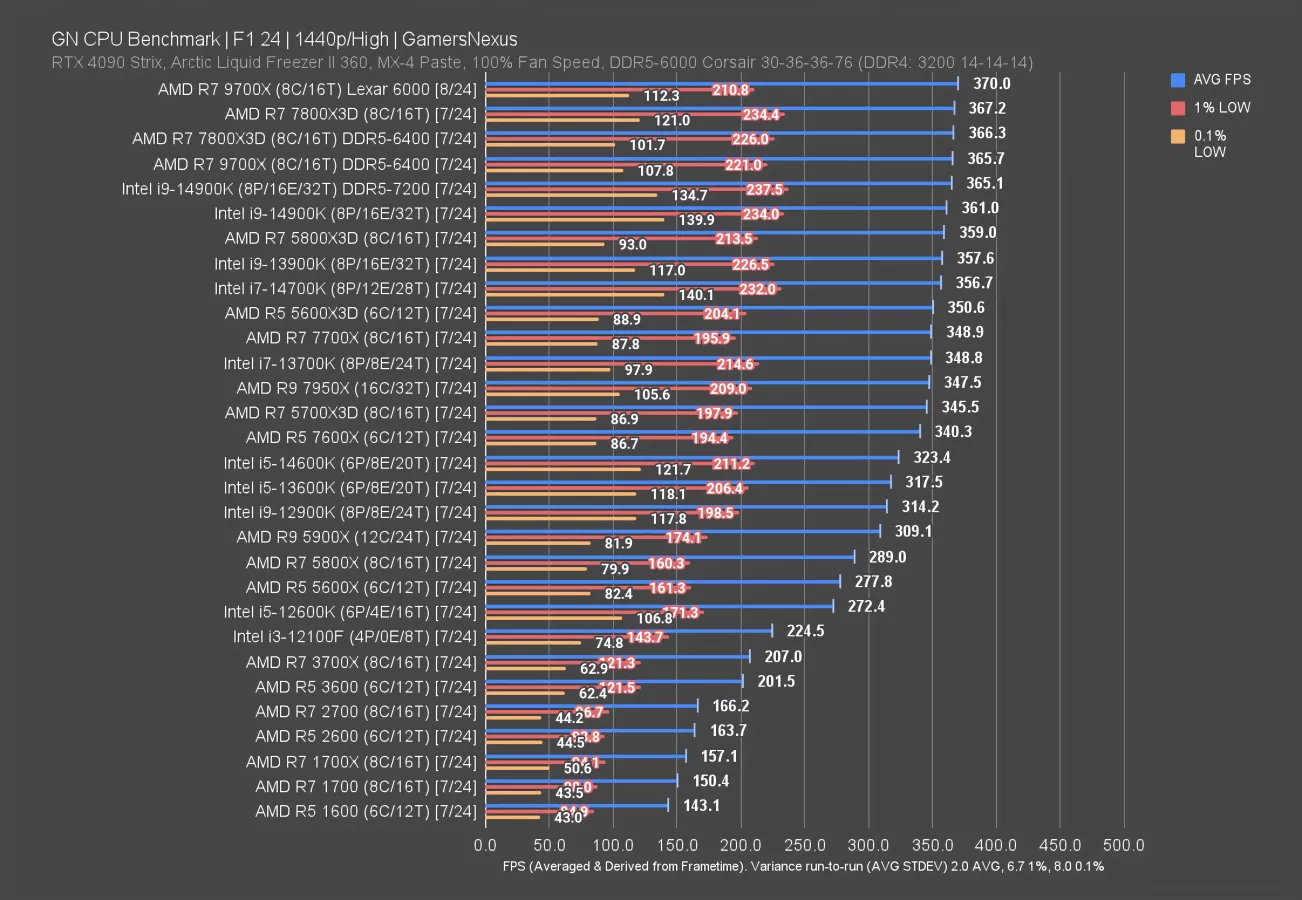
At 1440p, the GPU restriction limits framerate to 370 FPS AVG on the fastest device here, which ends up being the 9700X by a technicality. Its rank is shared by the 7800X3D. Both are bottlenecked by other components, so these can be thought of as the same.
Otherwise, the chart mostly scales as before, except with the top-performing devices having the max framerate trimmed, thus reducing the average.
Stellaris
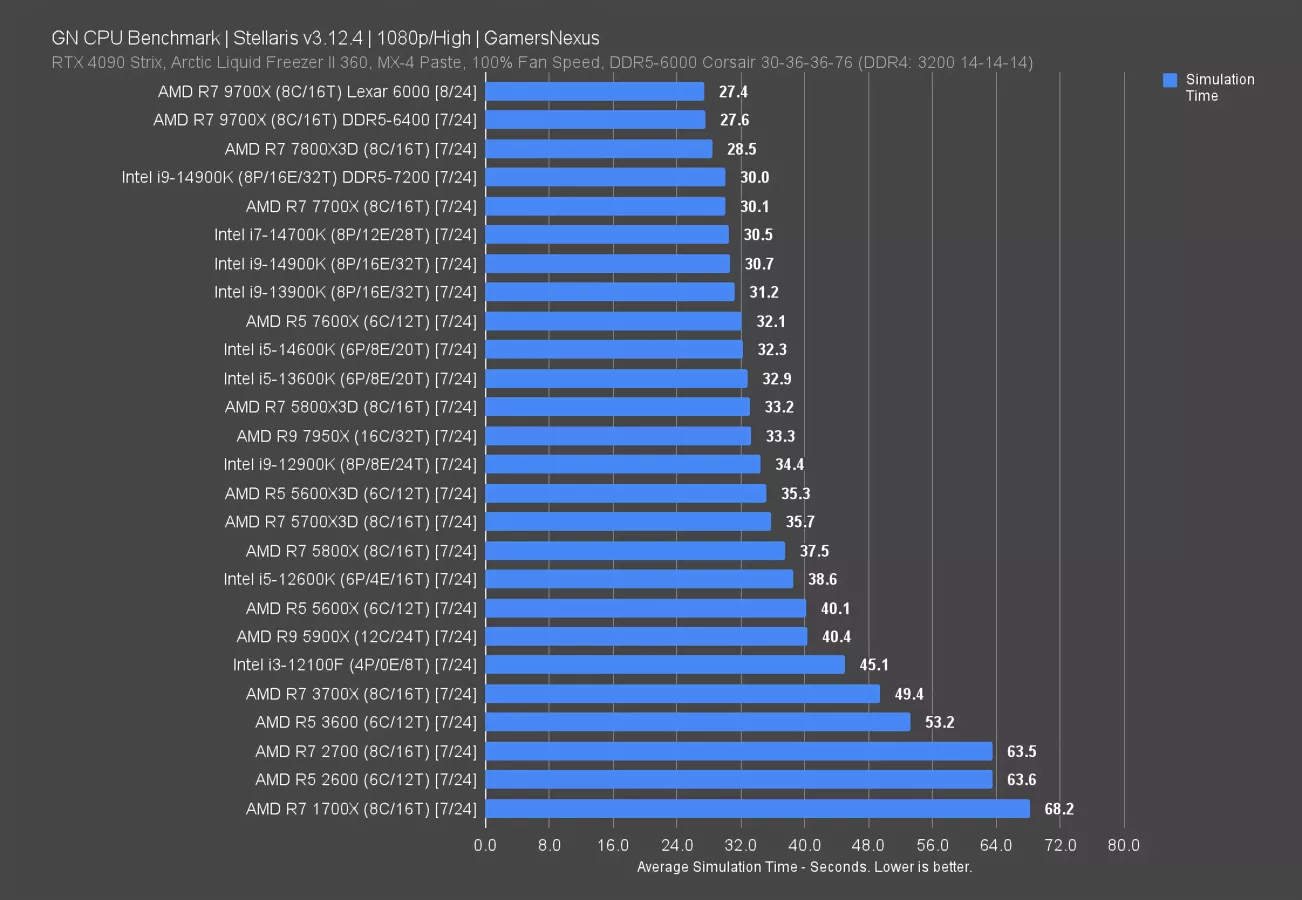
Stellaris at least shows some uplift. Although extra cache via X3D helps in some situations, like the large 5800X3D improvement over the 5800X (a reduction in time of 11%), it has never helped as much at the very top of the performance range in our test. We become bound elsewhere. For this reason, the 7800X3D isn’t as impressive a jump, leaving the 9700X the leader with a sim time reduction of 3.9% over it.
Against the 7700X, it’s a reduction of almost 3 seconds, or a somewhat large 9% drop. This game seems to benefit from the IPC uplift, and because it’s based on time and not framerate, it is immediately and clearly observable to most users. Games like Stellaris, Galactic Civilizations, or other simulation titles have clear time reductions from uplift like this. This is one of the 9700X’s stronger titles.
Intel’s first showing is at 30 seconds with fast memory, or 30.5 with the same memory that almost everything else uses. But we already knew Intel’s simulation time is slow since it wasn’t able to run PR simulations fast enough to bury the recent controversy.
This allows AMD a lead overall on this chart.
Rainbow Six Siege (1080p)
We have to skip Rainbow Six this time since they just updated the game and we measured a performance impact from the patch, so we only have 9700X tests for the new version. We’ll move on to production benchmarks.
Production Benchmarks
Blender
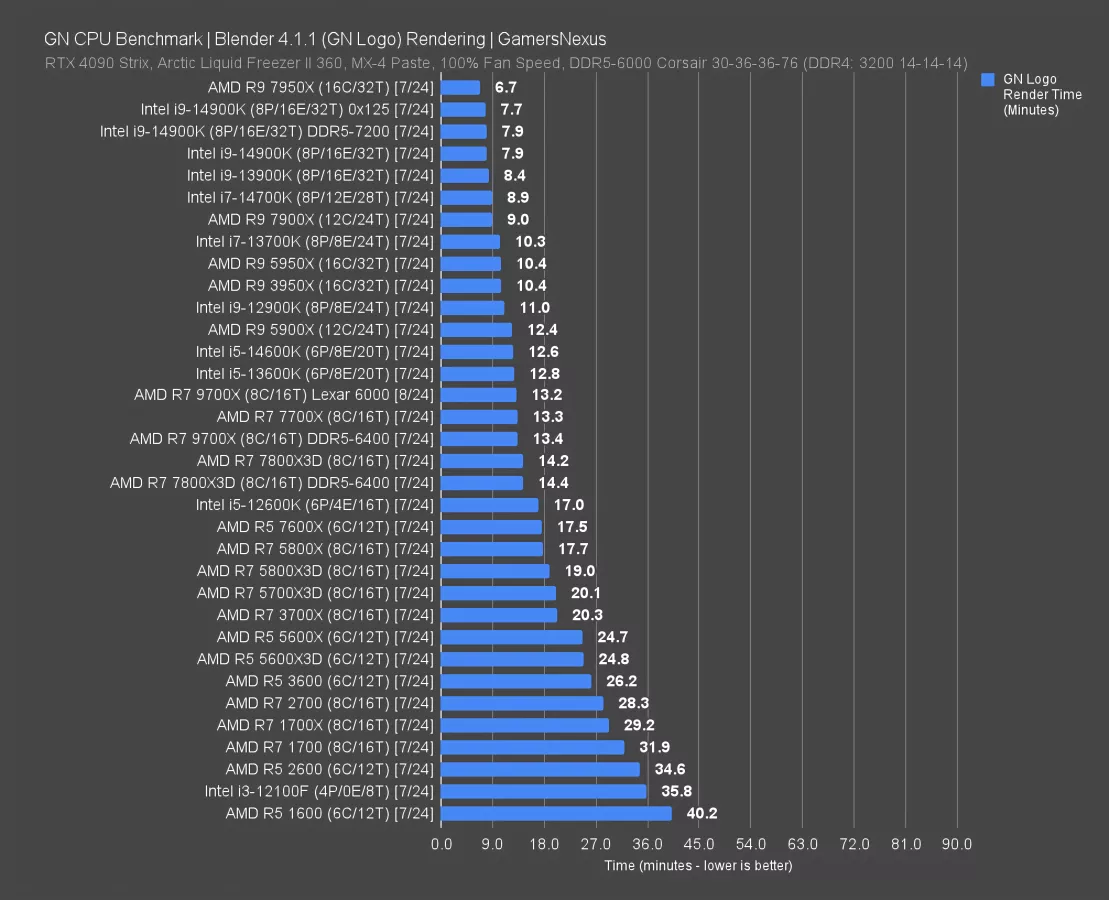
Our production and workstation tests are up now. These tend to be more heavily multithreaded and are generally more reliant on core count.
Our Blender render is a real-world one and performs a tile-based render of our intro animation to this video. The render requires 13.2 minutes on the 9700X for one frame, which roughly ties it with the 7700X. That’s unfortunate. Stellaris already showed us the opposite of this, where the performance of fewer threads matters more for the 9700X; here, however, the impact is lessened because of the workload distribution across all the CPU cores minimizes the difference.
X3D doesn’t matter in these tests, so the non-X3D parts generally perform better since they tend to have higher clocks.
Sadly for the 9700X, it’s outperformed by the 5900X of a few generations ago (which is benefitted more by the core count than the 9700X is by frequency and architectural improvements). The same is true for the 3950X 16-core part. Intel’s 14700K also outperforms the 9700X here.
The 5000-series X3D parts at least don’t lead this time, but the result is complete and total stagnation for the 9700X versus the 7700X. It’s just not good.
7-Zip Compression
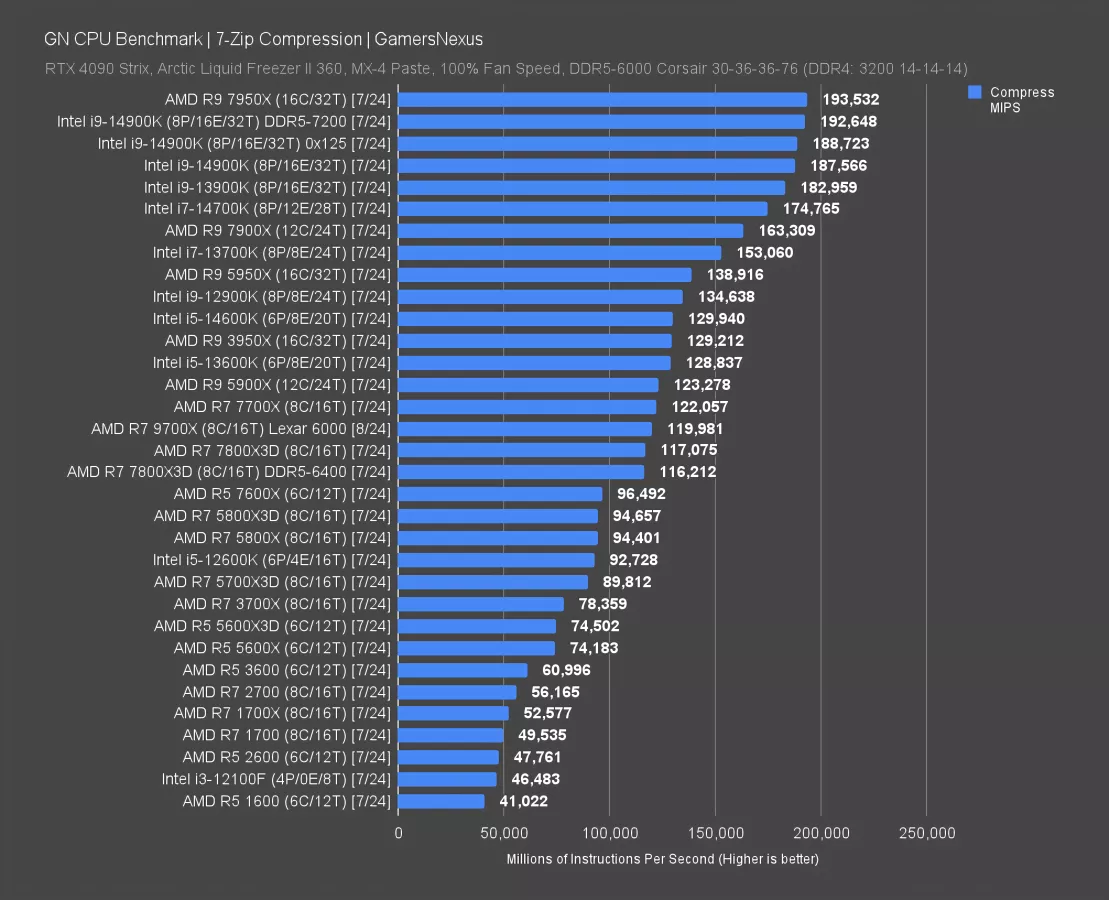
Moving on to file compression with 7-Zip, the 7700X is technically 1.7% ahead. Functionally, they’re tied and we’re looking at stagnation. Remember that the 9700X was run technically on different memory, despite us matching the timings as much as we could stabilize. This could account for some very small differences, but not much. Ultimately, at best, the parts are the same and at worst the 9700X is slightly worse.
The 5900X, 3950X, and even 14600K all run ahead of the 9700X. AMD’s performance here is embarrassing and fails to move the needle. There is absolutely no reason to buy this CPU for workloads like this unless you were going to buy a 7700X anyway and if this is cheaper. Both of those conditions would have to be true.
7-Zip Decompression
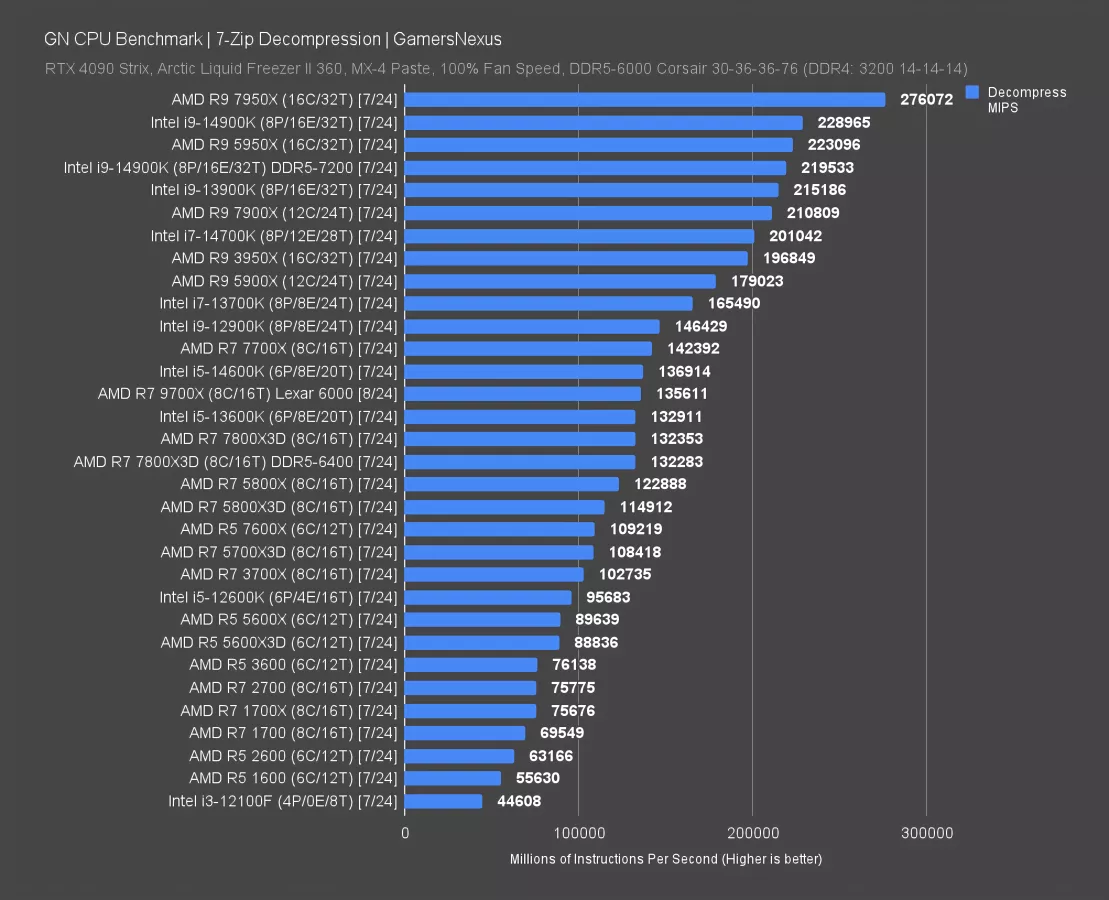
In decompression testing, the 9700X completed 136K MIPS, which roughly tied it with the 14600K (watch our review). Performance is below the 7700X for the reasons we discussed earlier. At best, you could maybe call them equal, but overall this is pretty disappointing.
Adobe Photoshop
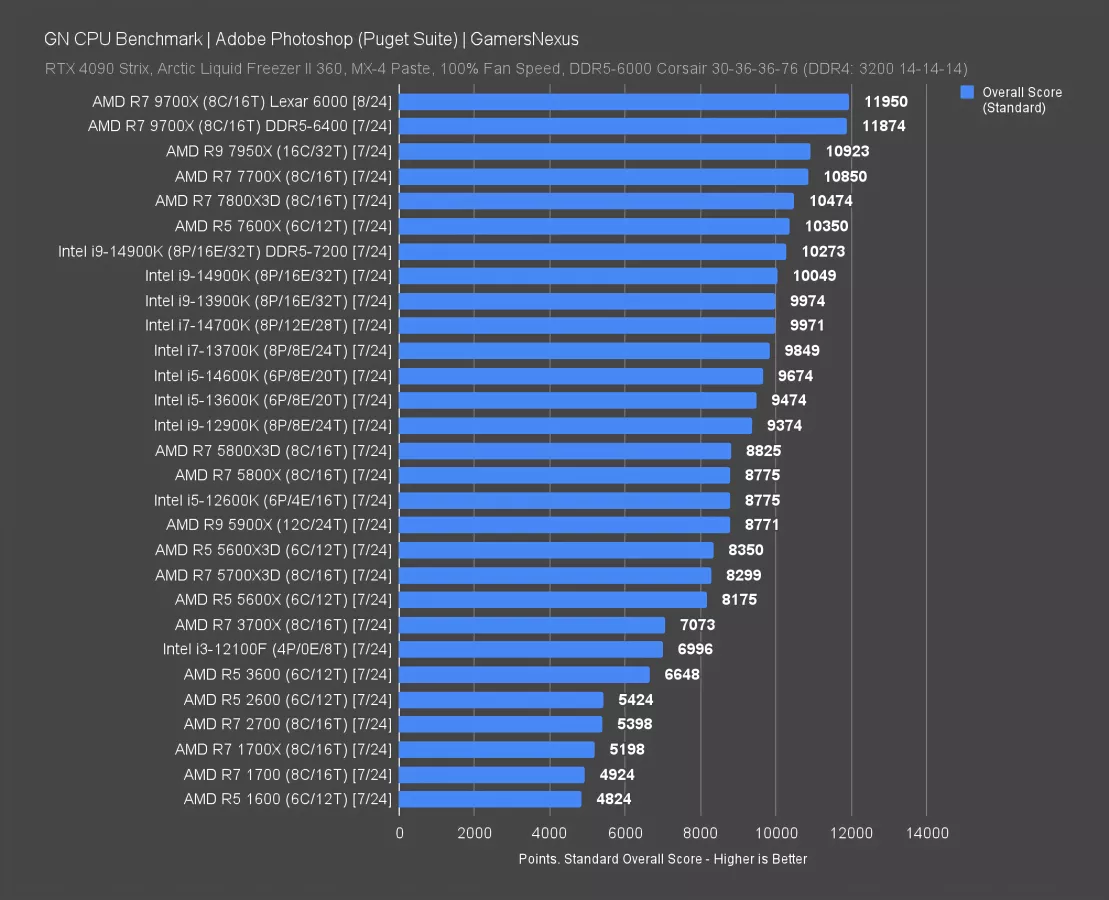
The 9700X leads in Photoshop -- so for AMD, that’s a relief. This is less thread-bound and more individually intensive on fewer cores. As a result, AMD’s IPC improvements show through. The 9700X ends up leading the 7950X and 7700X alike, with the lead over the 7700X at 10%. That’s the largest gap we’ve seen in our testing so far and is similar to Stellaris.
The closest Intel CPU is the 14900K at 10049 points, giving the 9700X a lead of 19%.
Against the original 1700X, the 9700X leads by 130%. That was the era when AMD was disadvantaged on clocks, manifesting in disproportionately bad Photoshop results.
Adobe Premiere
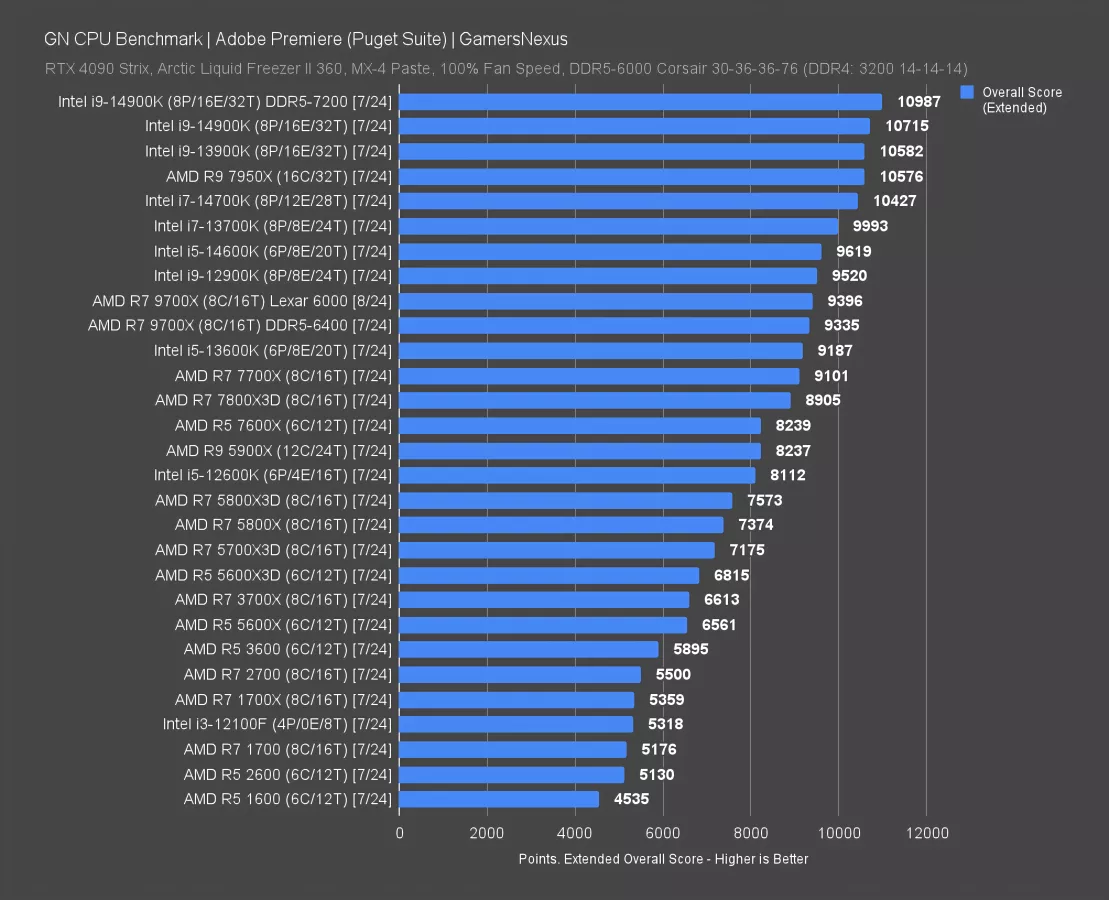
Adobe Premiere is up now. The Puget aggregate score is a combination of editing tasks such as filters, time warps, scales, RAW performance, intraframe performance, and more.
This one favors the 14900K, which has an overall score of 10715 points in aggregate, or 14% higher than the 9700X. The 9700X is at least ahead of the 7700X in this one, boasting an unbelievable, breathtaking 3.2% lead. It’s truly mind-blowing what AMD is able to achieve in just 2 short years. It’s almost as much as what Intel achieved with each year of its 14nm era.
Chromium Code Compile
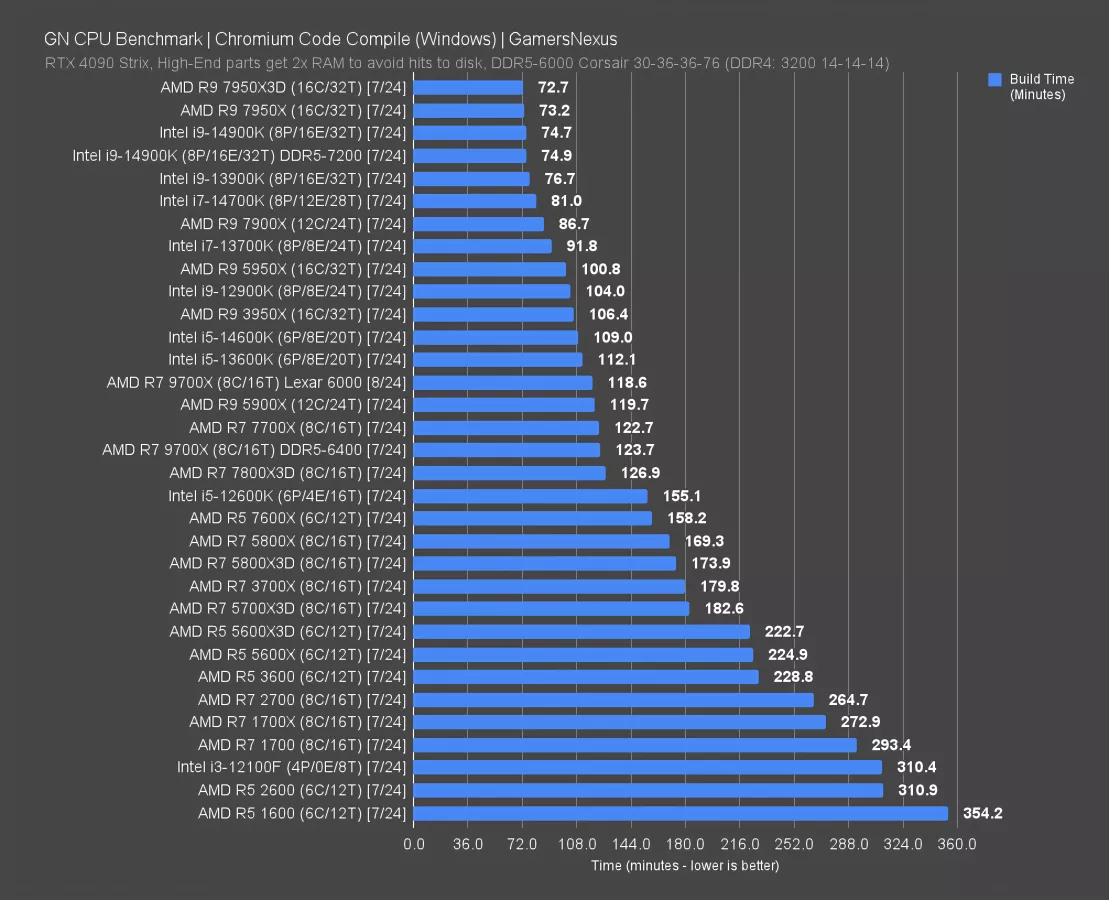
Code compile testing is up next, compiling Chromium for a heavy and extended workload. The longer runtime of this test allows us to better see the impact of boosting behavior.
The 9700X ends up slightly ahead of the 7700X again, this time with a 3.3% compile time reduction. The 13600K is faster here, but what’s even faster than that is if it blue screens while compiling. Intel’s 14900K and 14700K also do well in this test, with the 7950X (watch our review) and X3D leading.
SpecWS: Rodinia CFD
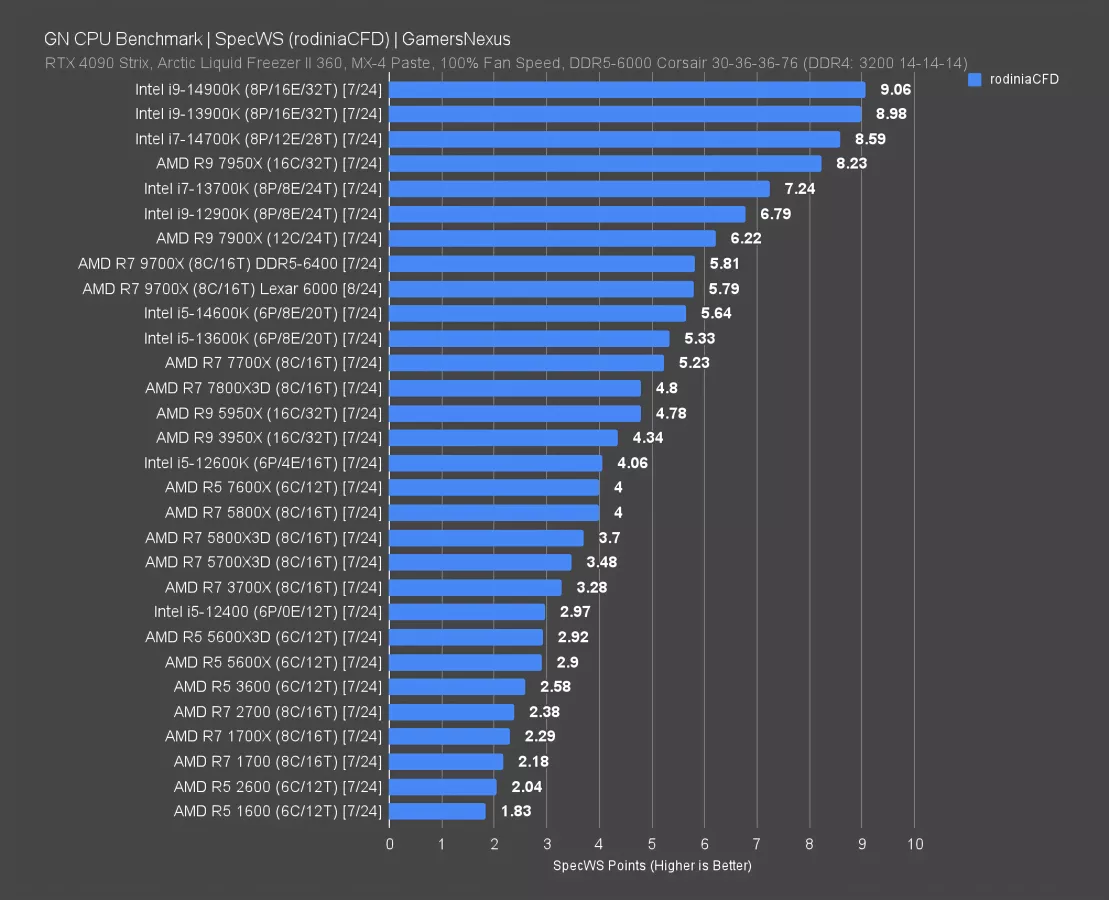
Rodinia CFD is next. Our observation of this one is that it likes core count and frequency, with less emphasis on cache and reduced on purely cores. It’s a balance.
The 9700X has one of its larger leads over the 7700X in this one, at 10.7%.
Intel is overall dominating here.
SpecWS: LAMMPS
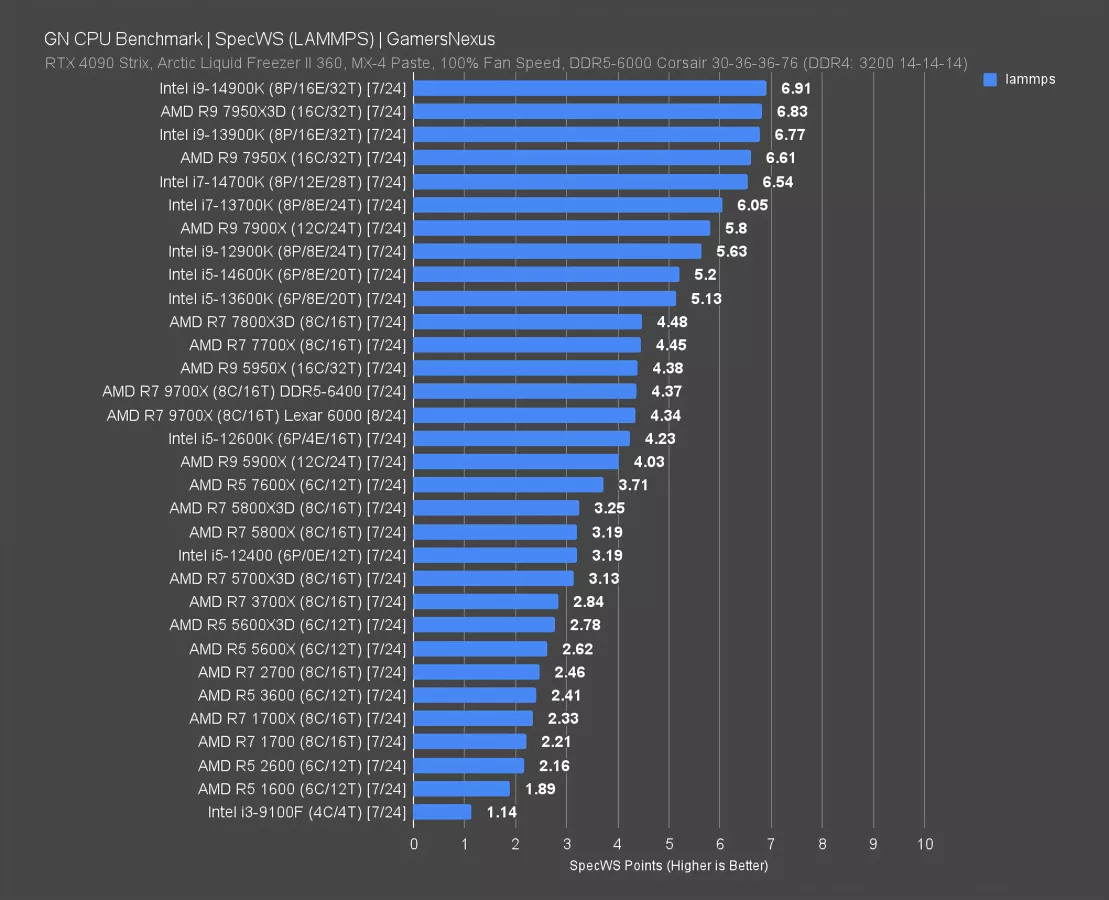
Next up are the Spec Life Sciences & Biomedical tests. The Spec Life Sciences & Biomedical LAMMPS test is described by Spec.org as “a molecular dynamics simulator that consists of five tests simulating a variety of molecular properties.”
In LAMMPS, we’re seeing regressive performance again. It doesn’t happen often, but the 7700X’s 4.45 result leads the 9700X by 2.5%. Some of this may be due to the slightly different memory timings as a result of the compatibility trouble, but that shouldn’t account for the whole difference. The 9700X is just disappointing as compared to the 7700X in this one.
AMD R7 9700X Conclusion

This is a big review. We’ll keep the conclusion as simple as possible.
Intel has been working hard this past year. Its concerted effort has ensured that it can nuke the confidence of its consumer base, and it’s going to take some time for Intel to earn that back. That’s the biggest thing going for AMD right now.
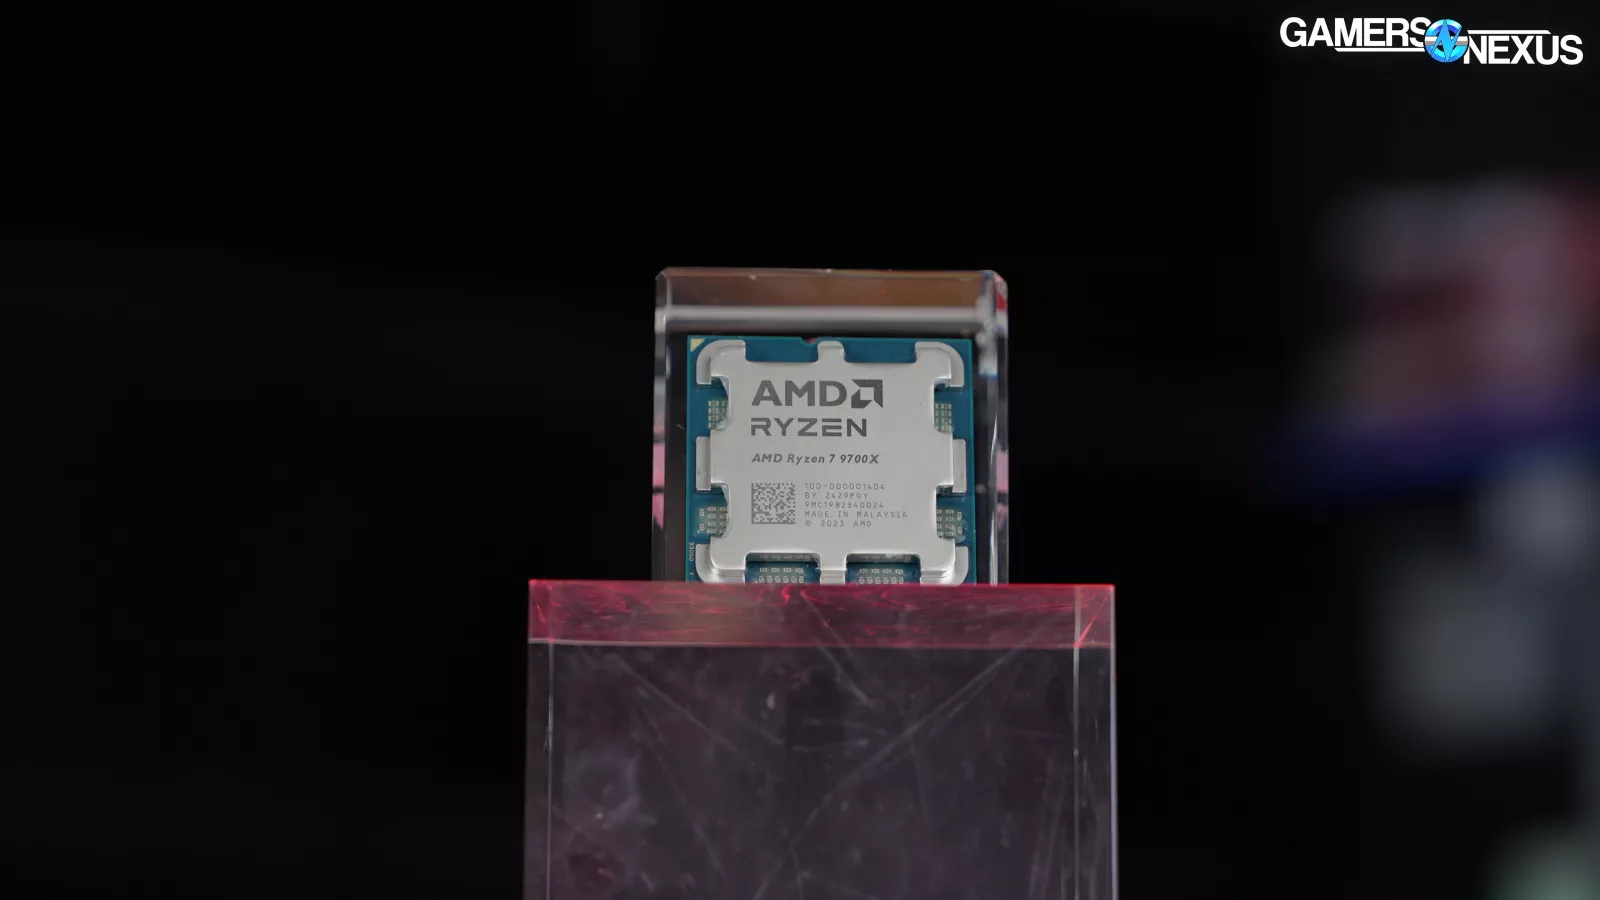
But marketing on the back off “the other one is worse” isn’t good marketing. This leads to stagnation, boredom, and an overall slow-down in the market. AMD has efficiency going for it in a big way, and that’s the singular pillar preventing this launch from becoming AMD’s 14nm+++++ moment.
Overall, the 9700X is relatively boring. It’s slightly better than the 7700X sometimes, sometimes it’s slightly worse. The biggest swings we see are 10%, but they’re not common enough to really stand out. The efficiency is exciting in a way, but we think AMD could have found a better balance between efficiency and performance to at least more consistently ensure there wasn’t regression in charts.
The memory compatibility has also been rough for our testing, which is odd considering the stability for the literal same motherboard and RAM on the 7000 series CPUs. It could be BIOS or could be the CPU or AGESA, but ultimately, it’s AMD’s fault. They know whose boards are in the hands of reviewers to the extent that they personally vet and distribute the BIOS to reviewers.
The CPU is “fine.” If it didn’t have the efficiency improvements, it’d be getting the Intel 11th Gen treatment of being the dead generation -- the waste of sand. But because it has efficiency, it instead gets a “meh.” If you’re on AM4, you can either upgrade to a 5700X3D for cheap or just wait. If you’re on AM5, there’s no reason to upgrade unless it’s from the lowest spec part or something, and even then, a 7800X3D may make more sense for gaming in many scenarios.
As for Intel, we’ll re-evaluate the company’s processors as soon as the new microcode ships.