We compare the 9980X vs previous Threadripper CPUs (like the 7980X) and against desktop-class CPUs (like the Intel 285K and AMD Ryzen 9950X)
The Highlights
- AMD’s new 9980X Threadripper moves to the Zen5 architecture
- On the gaming side, there are sometimes issues with consistency
- The 9980X is anywhere from 2% to 58% improved upon the 7980X in our benchmarks
- Original MSRP: $5,000
- Release Date: July 31, 2025
Table of Contents
- AutoTOC

Intro
We’re reviewing the $5,000 AMD Threadripper 9980X 64-core CPU and have a ton of new production tests to benchmark it. A lot of this is just an excuse to do some cool new testing. Like with medical simulations where we saw an 18% generational uplift, similar to the 18% we saw in financial options and black-scholes modeling, or the 58% improvement over the 7980X that we saw in convolution benchmarking. In most places, the gain is much smaller, like in compression with a couple percentage points of change. However, from the Zen 5 change to how AVX instructions are handled, it sometimes gains disproportionately. We saw the same with the 9900X vs. 7900X (or X3D variants) when in AVX-heavy scenarios.
Editor's note: This was originally published on July 30, 2025 as a video. This content has been adapted to written format for this article and is unchanged from the original publication.
Credits
Test Lead, Host, Writing
Steve Burke
Testing
Patrick Lathan
Mike Gaglione
Video Editing
Tim Phetdara
Writing, Web Editing
Jimmy Thang
The quick version up front is that the improvement on the 7980X is anywhere from around 2% to that 58% number, but the vast majority of tests are closer to the range of 5% to 18%. It really heavily depends on the workload with these CPUs, particularly AVX occupancy.
These are workstation CPUs intended for research, production work, or generally tasks that either make money or advance science or something similar. We’re still benchmarking gaming, but the focus will be mostly on production workloads today with gaming only there to ensure there are no major broken results.
These CPUs are expensive. That limits the audience. For that reason, we added all the new tests as an opportunity to also re-run everything else, so all of this data is brand new. Even if you’re not in the market for Threadripper, this will have interesting data from more “normal” CPUs out there.
Overview
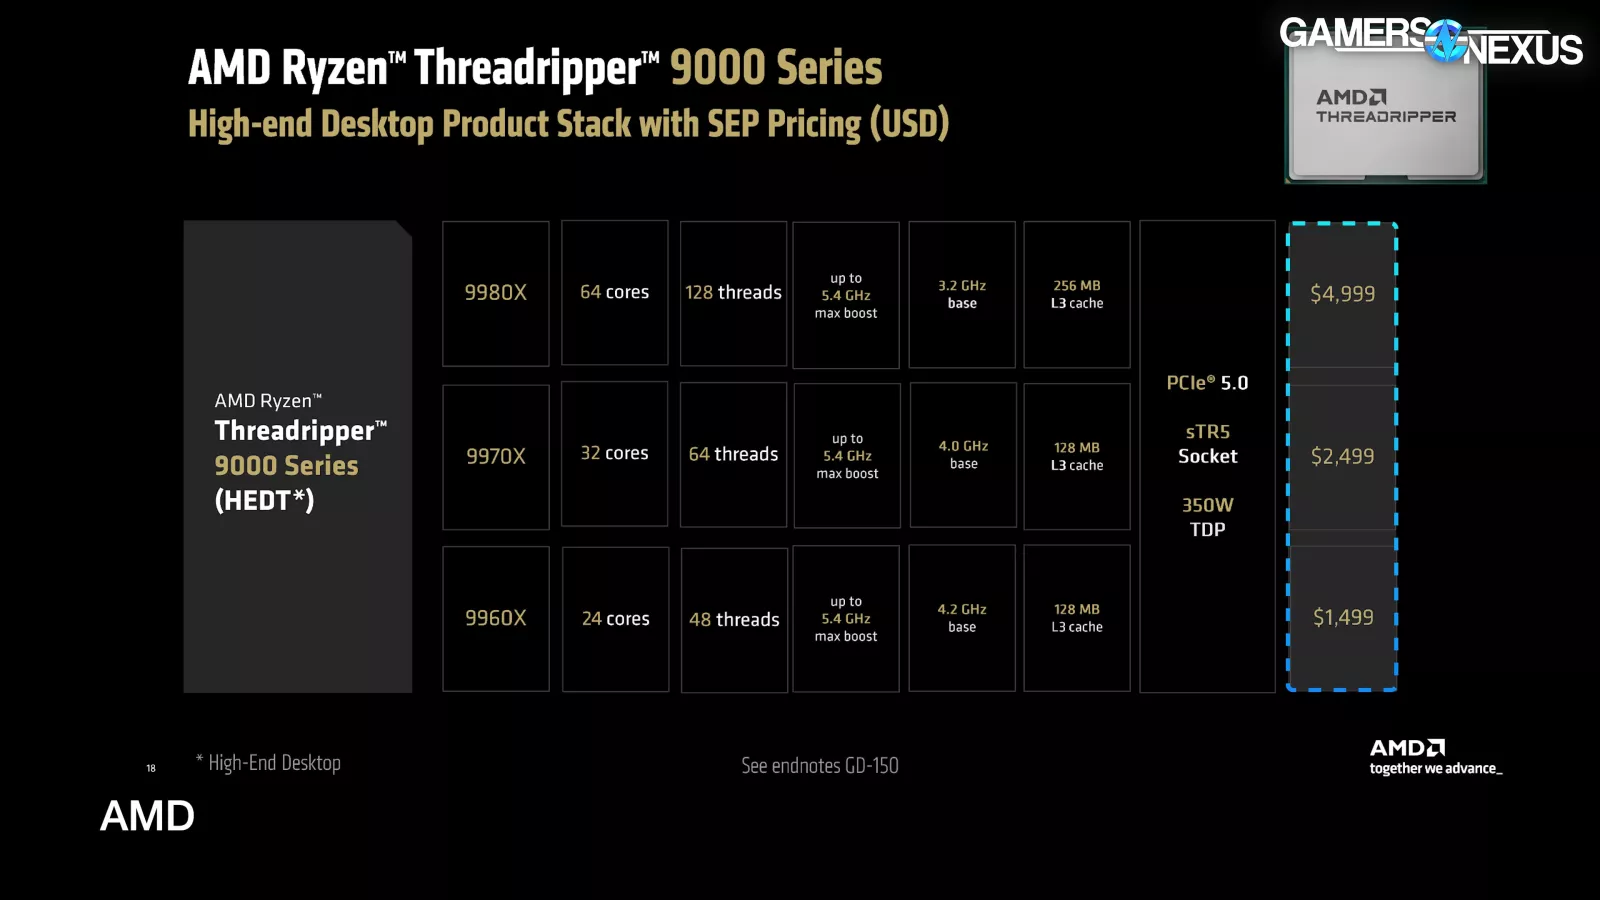
Here’s the quick recap of the CPU lineup.
AMD is launching two versions of the Threadripper 9000 CPUs. These include the non-Pro and Pro CPUs. The Pro CPUs had an earlier embargo; today, we’re covering the HEDT (or “high-end desktop”) non-Pro Threadripper CPUs.
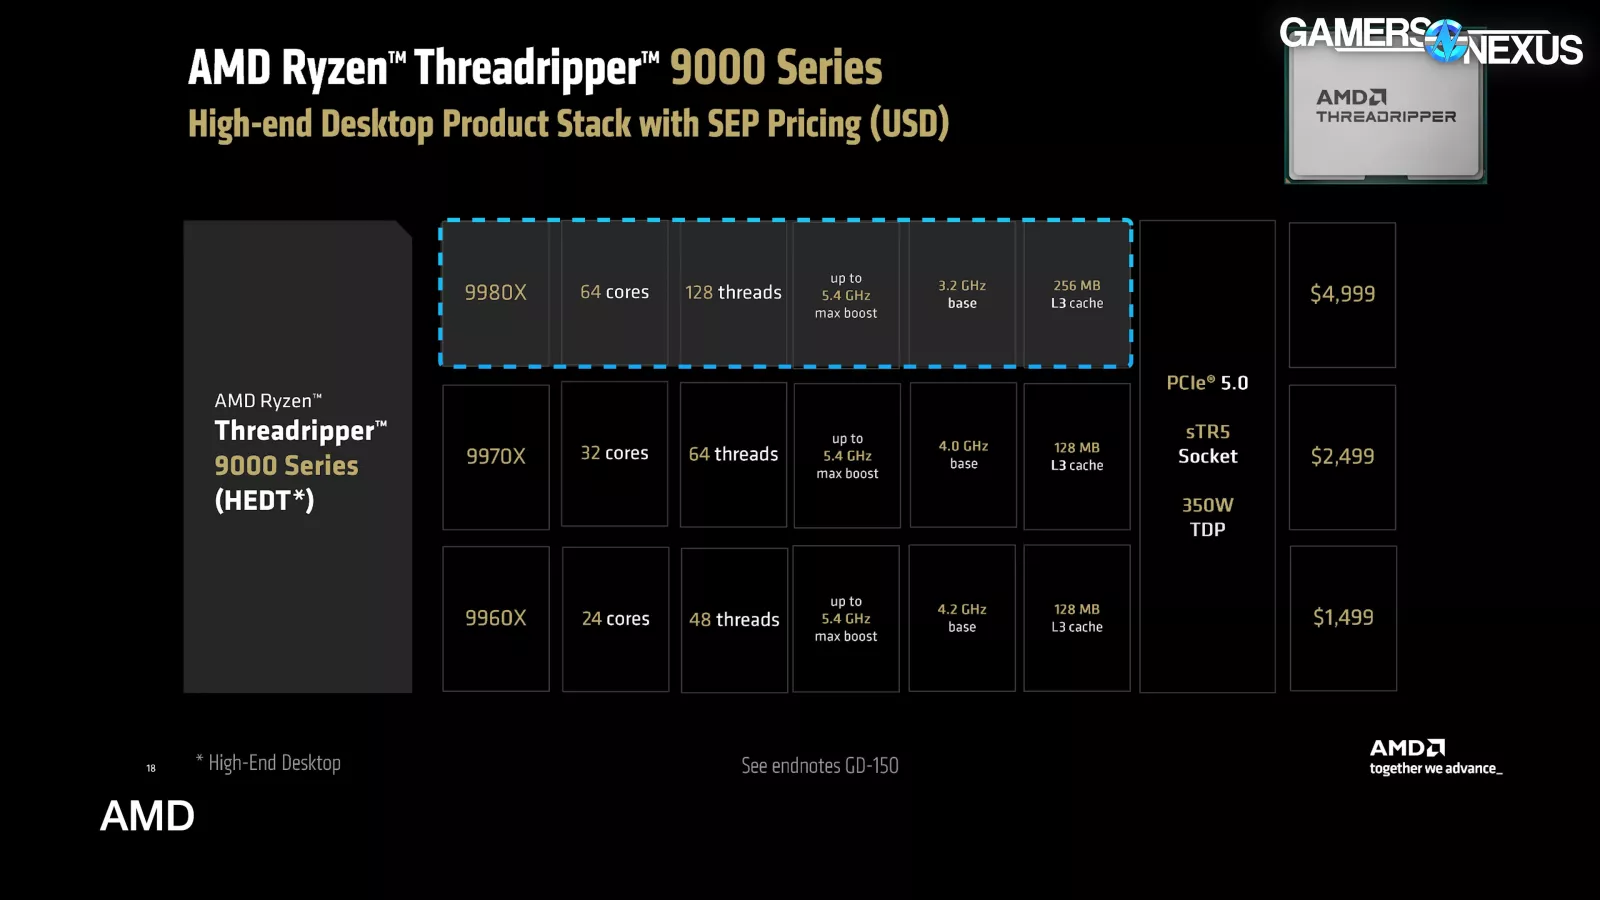
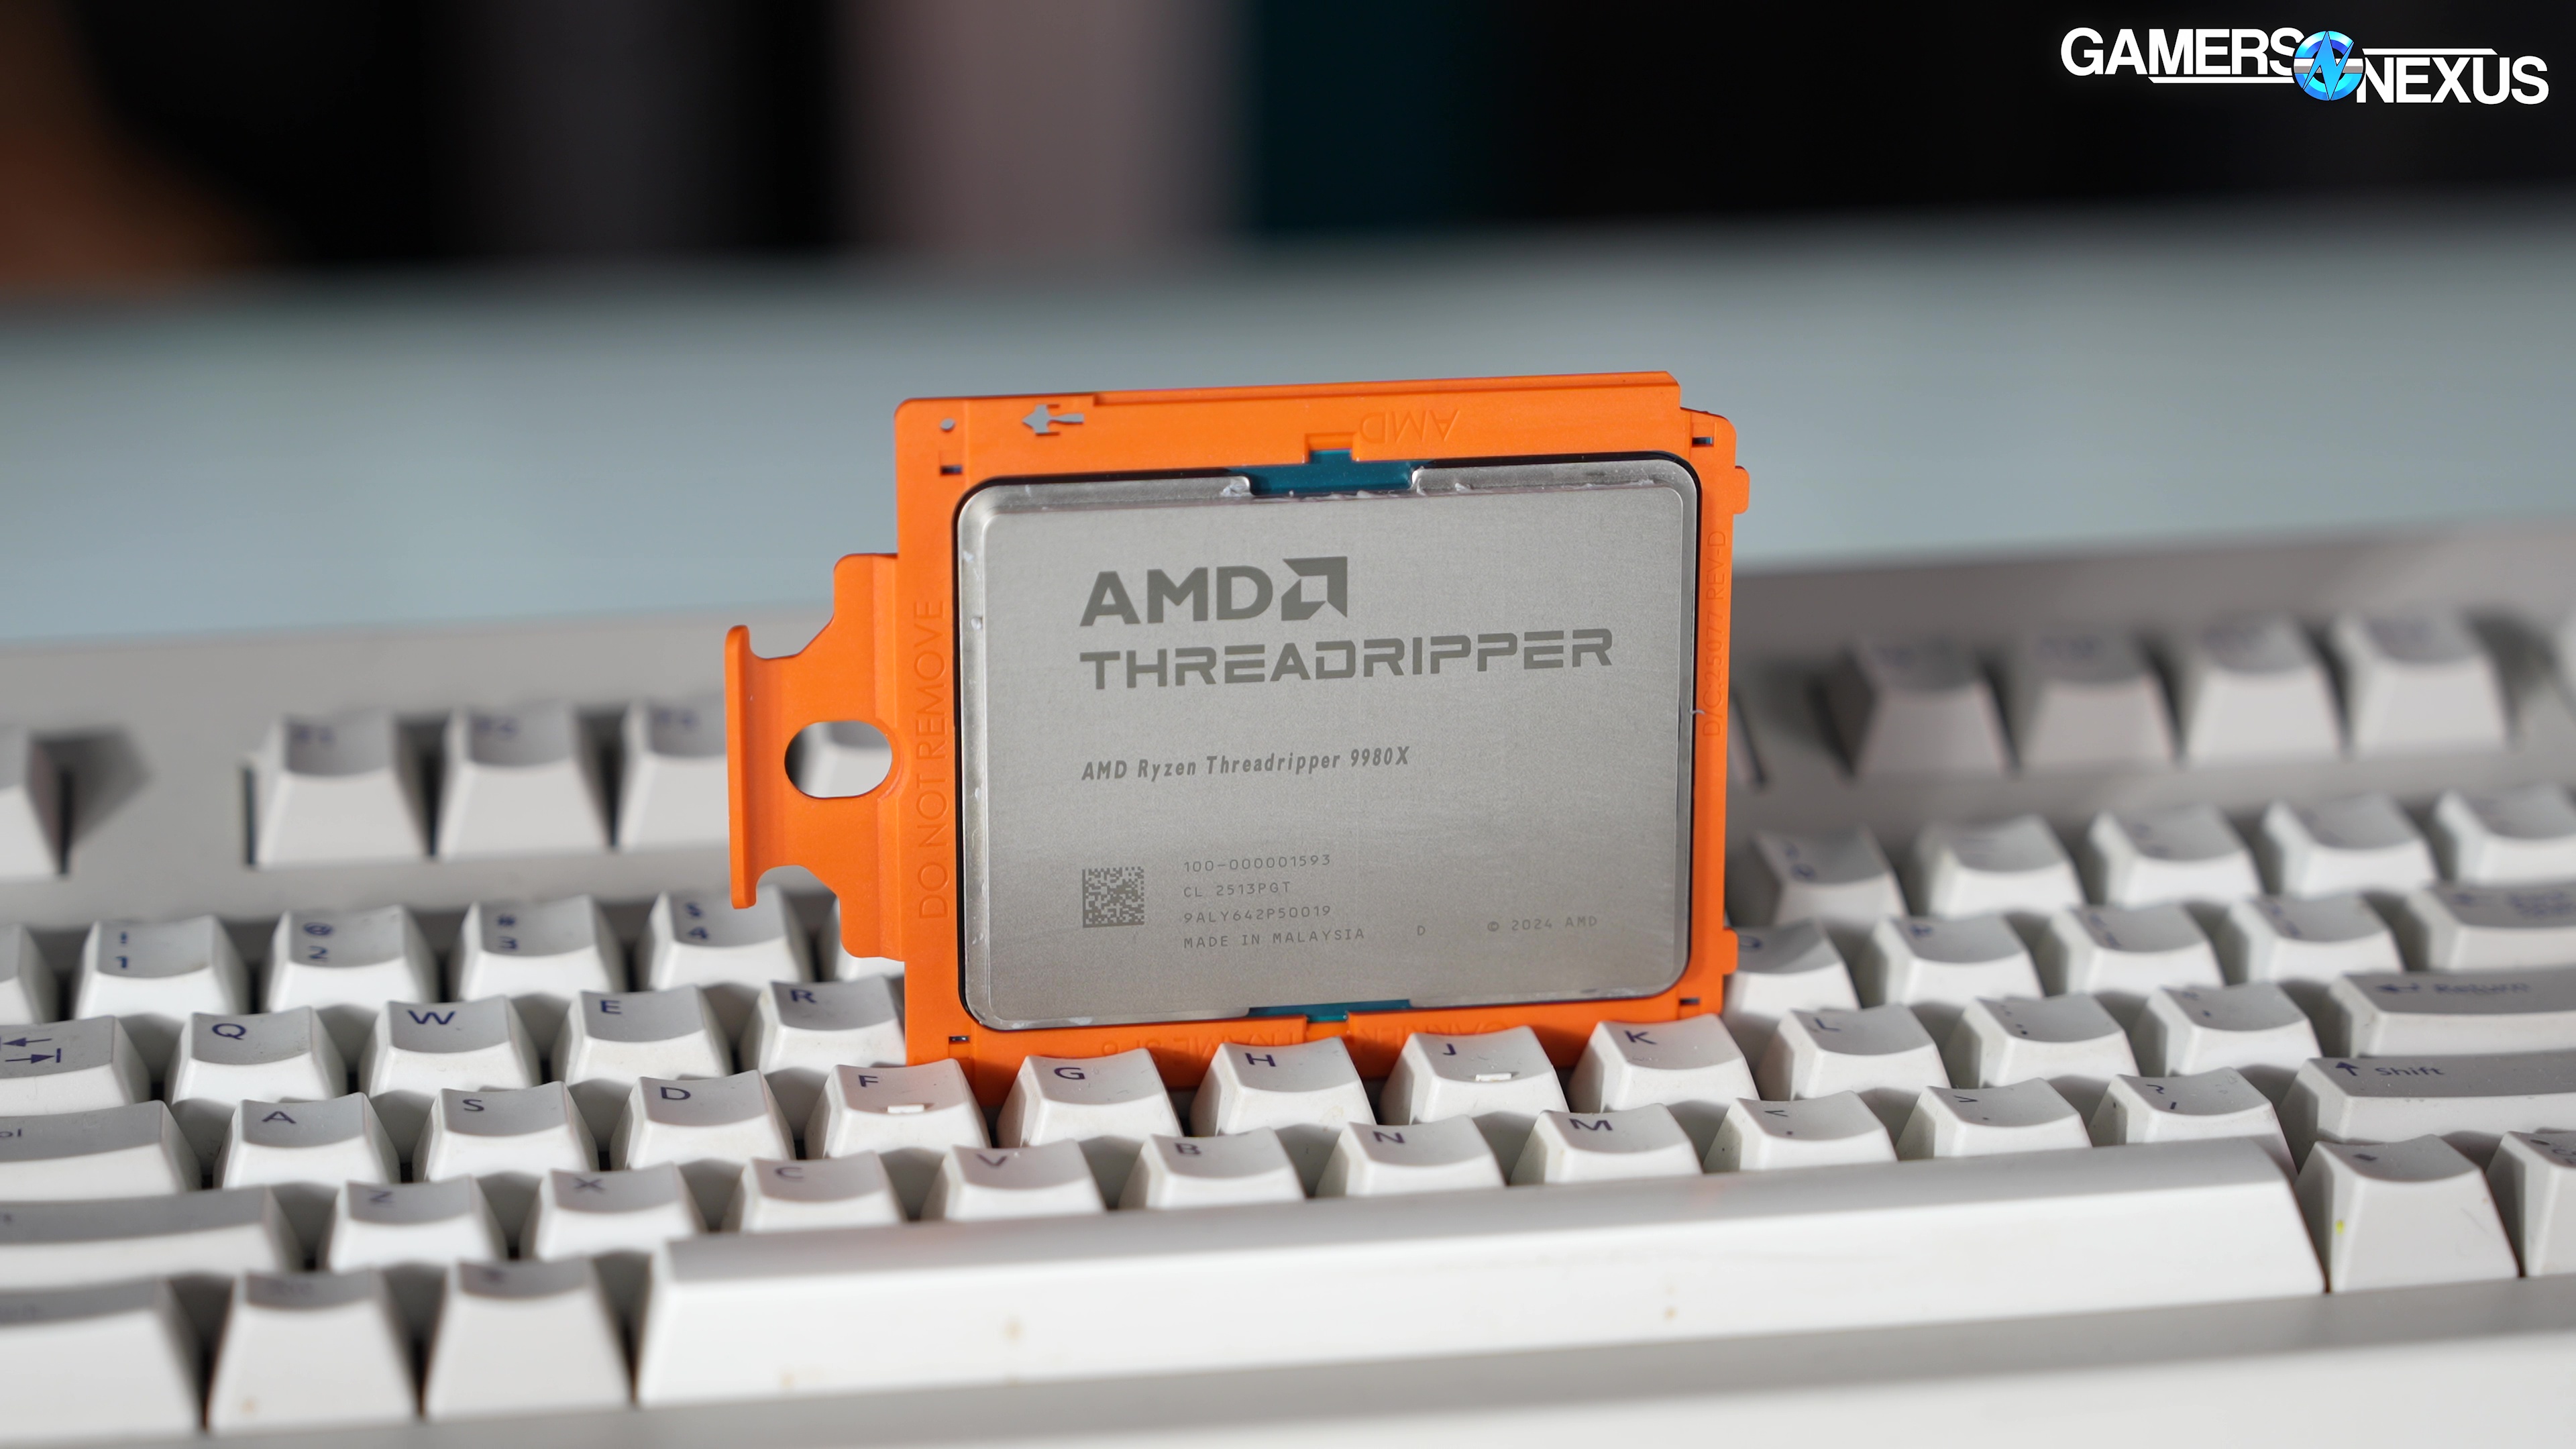
The 9980X is a 64-core, 128-thread part that boosts up to 5.4 GHz and has 256MB of L3 Cache. The CPU sockets into STR5 platforms and, like the other two modern Threadripper parts launching with it, has a 350W TDP. It’s $5,000 for the 9980X.
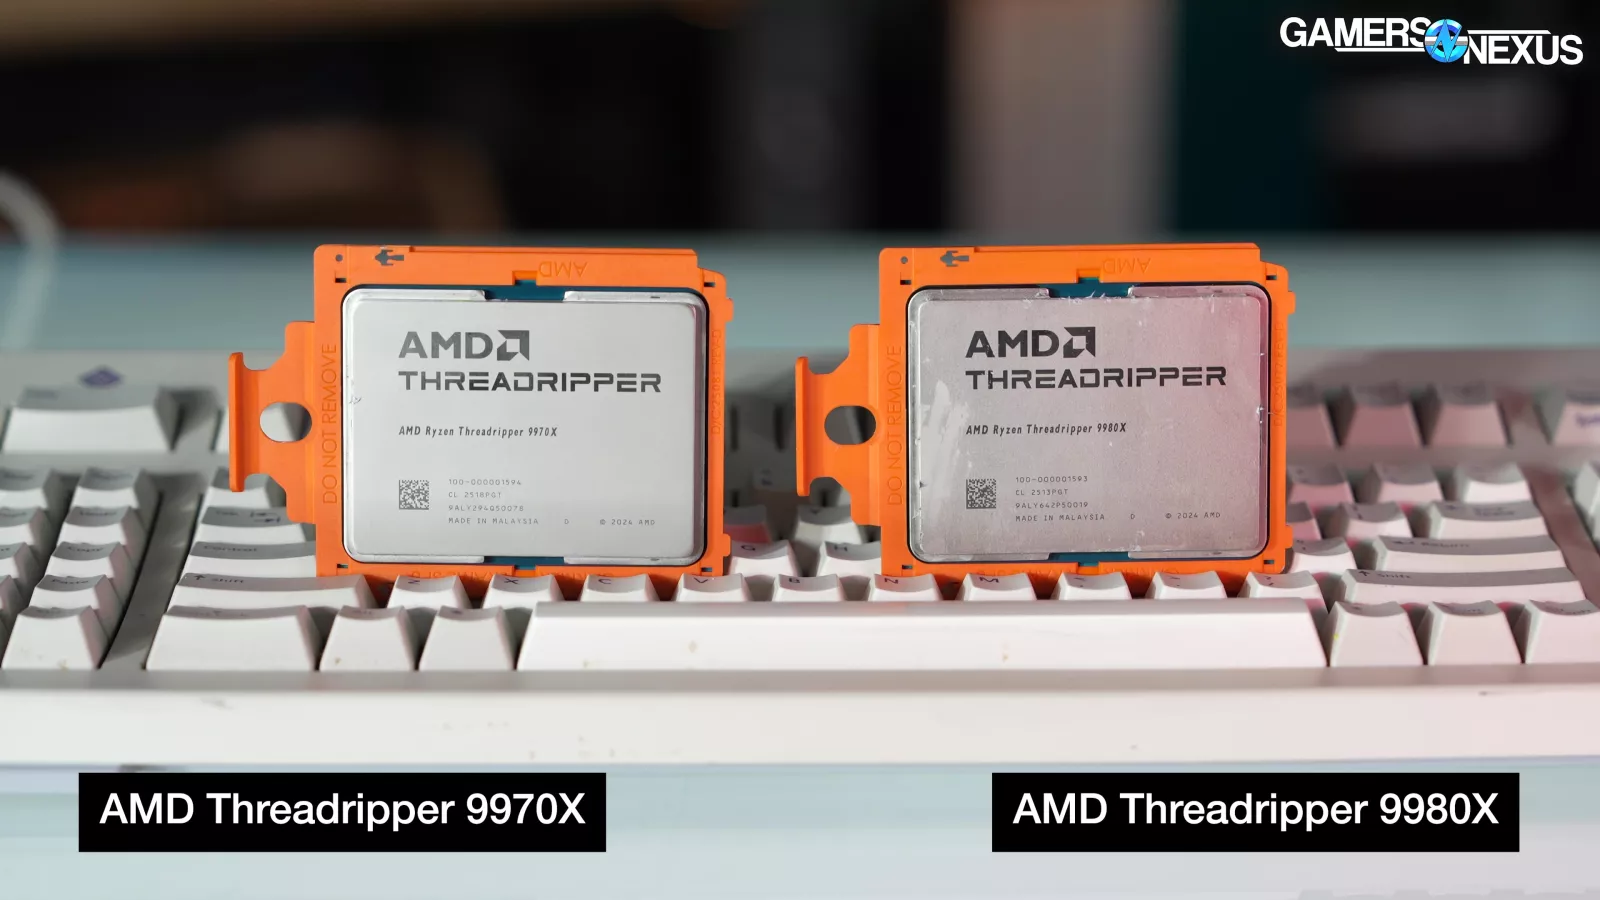
The 9970X is a 32-core, 64-thread part. They all share the same boost of 5.4GHz, but the base clock is higher on the lower core-count CPUs as a result of higher power availability per core based on power budget. Cache is down to 128MB L3 on the 9970X and 9960X, the latter of which is a 24-core, 48-thread part. Pricing is $2,500 for the 9970X and $1,500 for the 9960X.
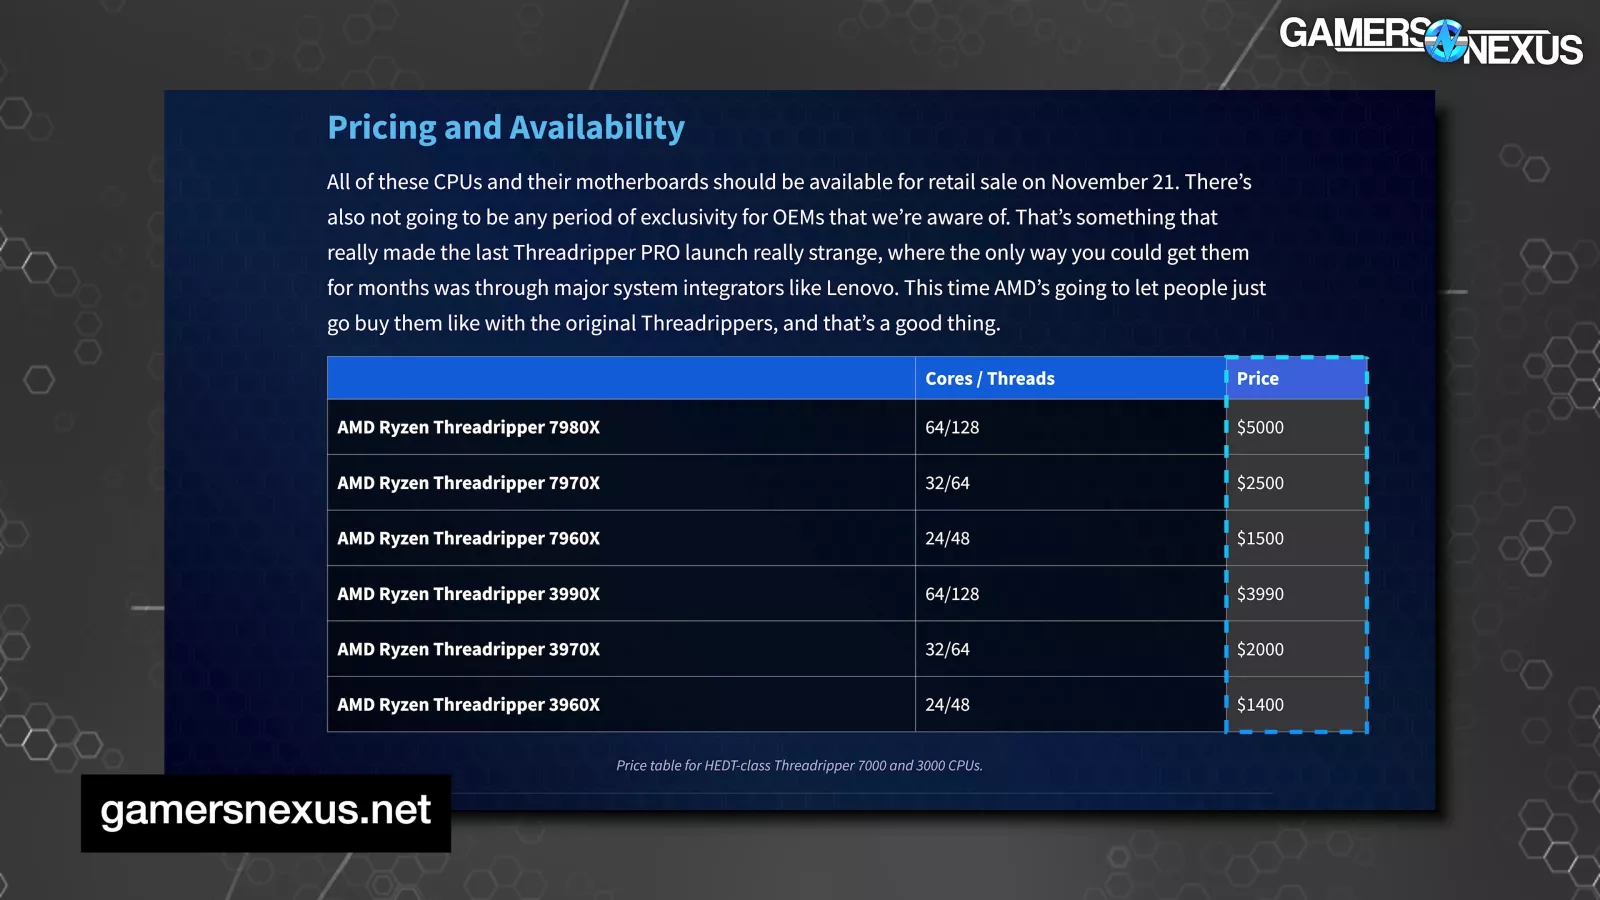
Compared to last time, prices are familiar: The 7980X was $5,000, the 7970X was $2,500, and the 7960X was $1,500. Threadripper 9000 prices are elevated from several generations back to the 3000 series, but the same as the 7000 series.
The architectural improvements are the same as in Zen 5 with the 9000 series launch. The biggest one you’ll see today is from the AVX changes. When we were digging into the largest improvement in our testing, AMD sent this explanation as a refresher on Zen 5:
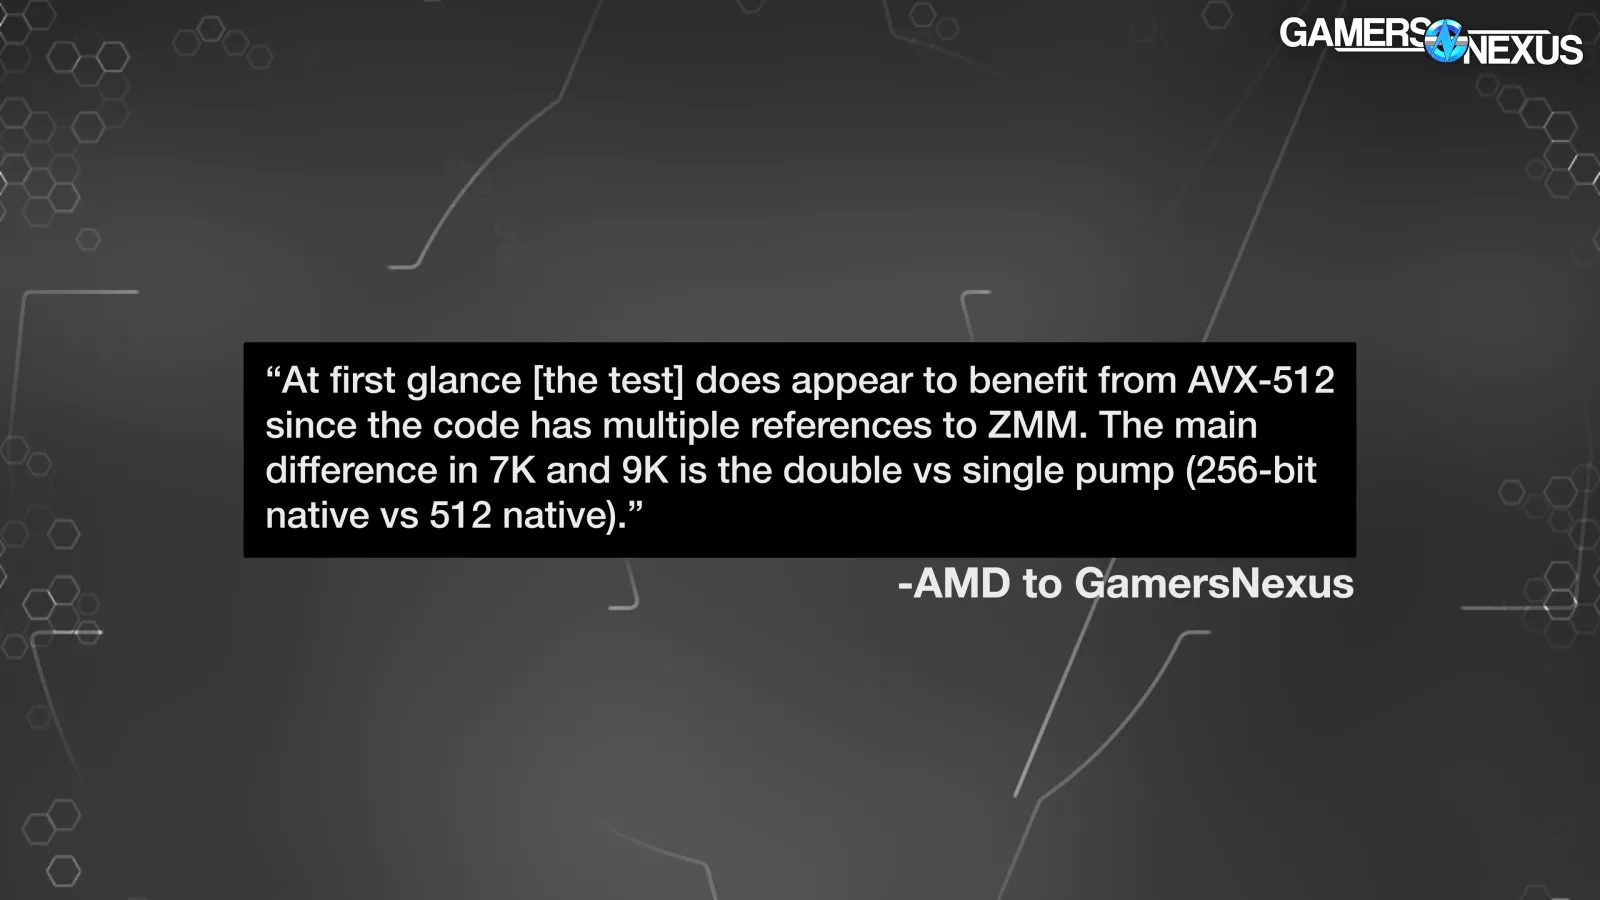
“At first glance [the test] does appear to benefit from AVX-512 since the code has multiple references to ZMM. The main difference in 7K and 9K is the double vs single pump (256-bit native vs 512 native).”
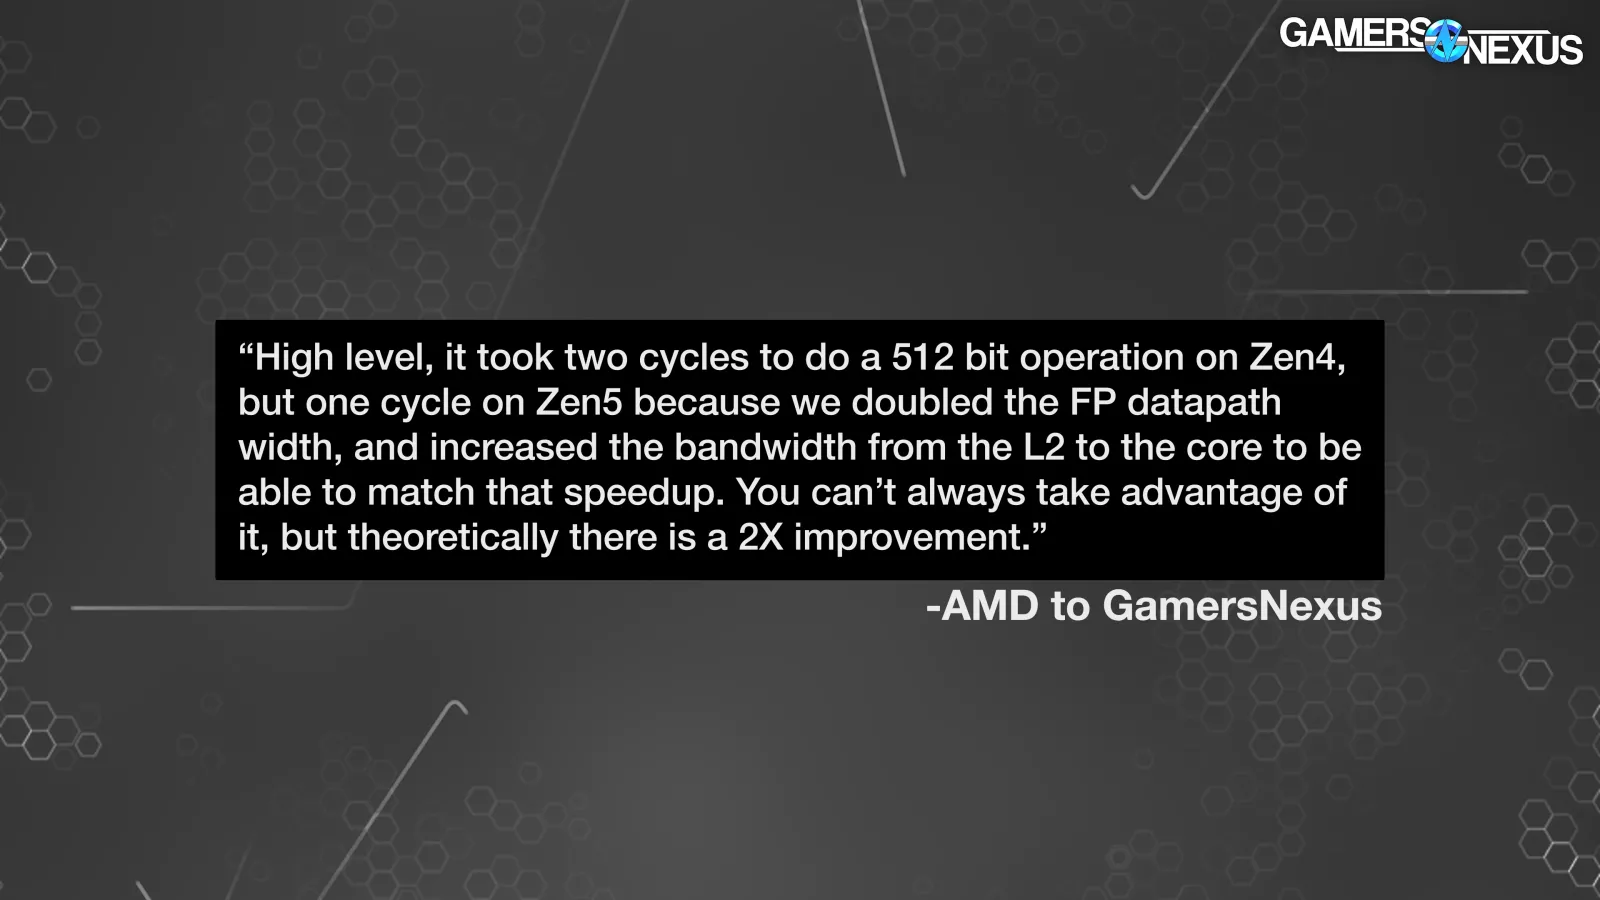
“High level, it took two cycles to do a 512 bit operation on Zen4, but one cycle on Zen5 because we doubled the FP datapath width, and increased the bandwidth from the L2 to the core to be able to match that speedup. You can't always take advantage of it, but theoretically there is a 2X improvement.”
That “theoretically” is important, because it doesn’t show up in most of our tests; however, in some, there is a very large uplift. This isn’t special to Threadripper and is instead specific to Zen 5 vs. Zen 4. We’ll spend some time on that in our review.
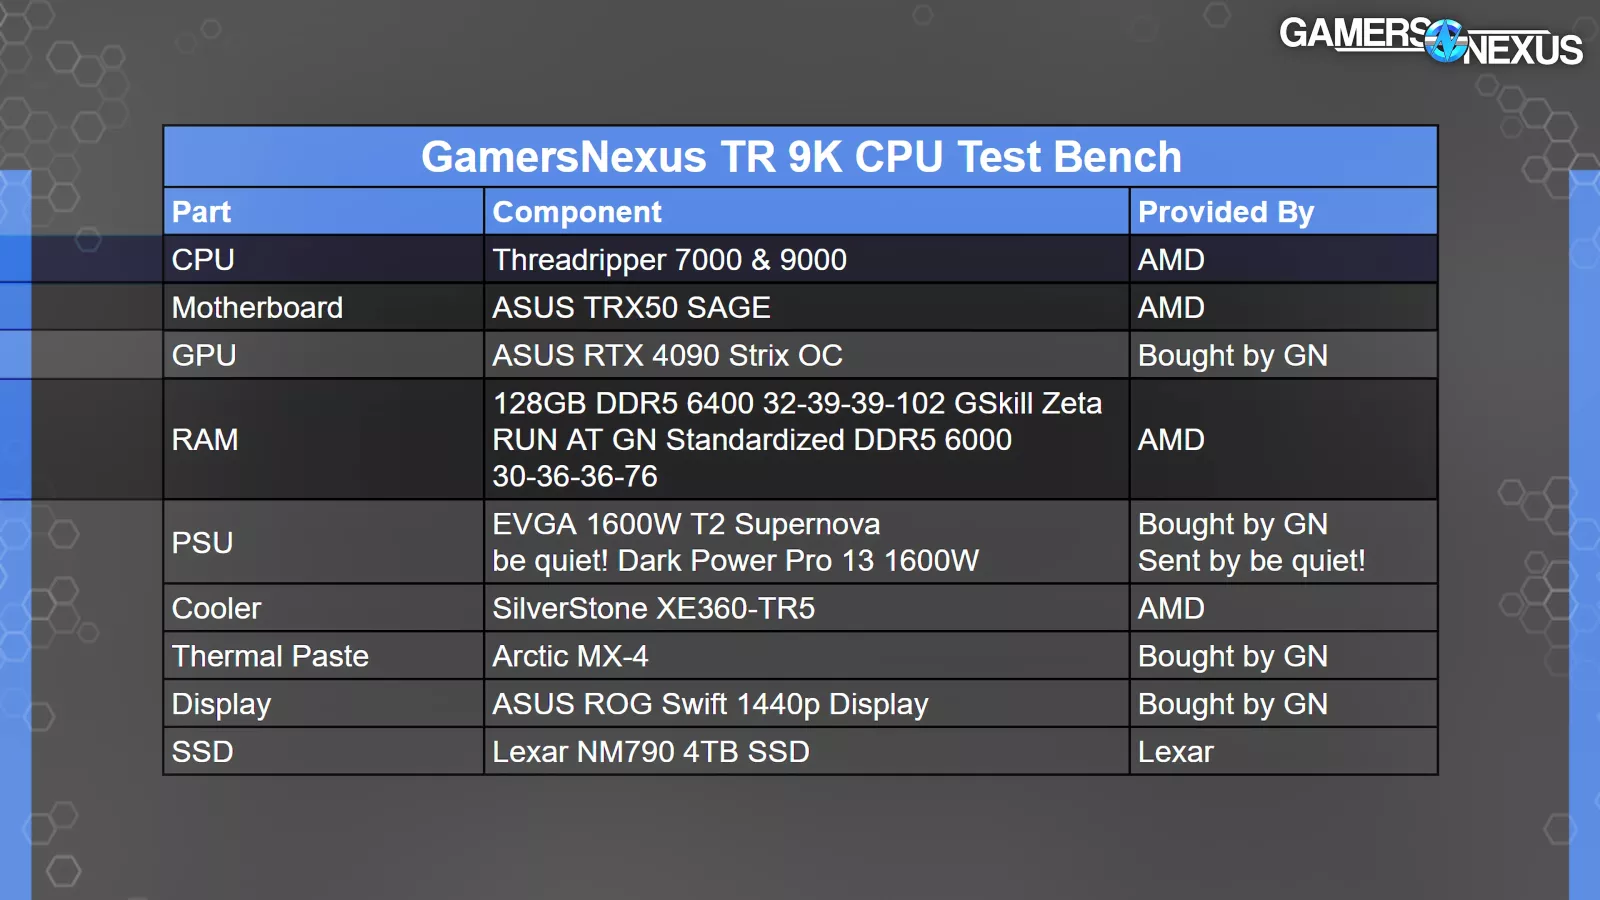
As for the test bench: Our chart subtitles apply to the desktop platforms, but the Threadripper CPUs are tested with different memory and motherboards. It deviates from some of the other benches.
Let’s get into the benchmarks. We’ll start with production testing.
9980X Production Benchmarks
7-Zip Compression
7-Zip compression is up now.
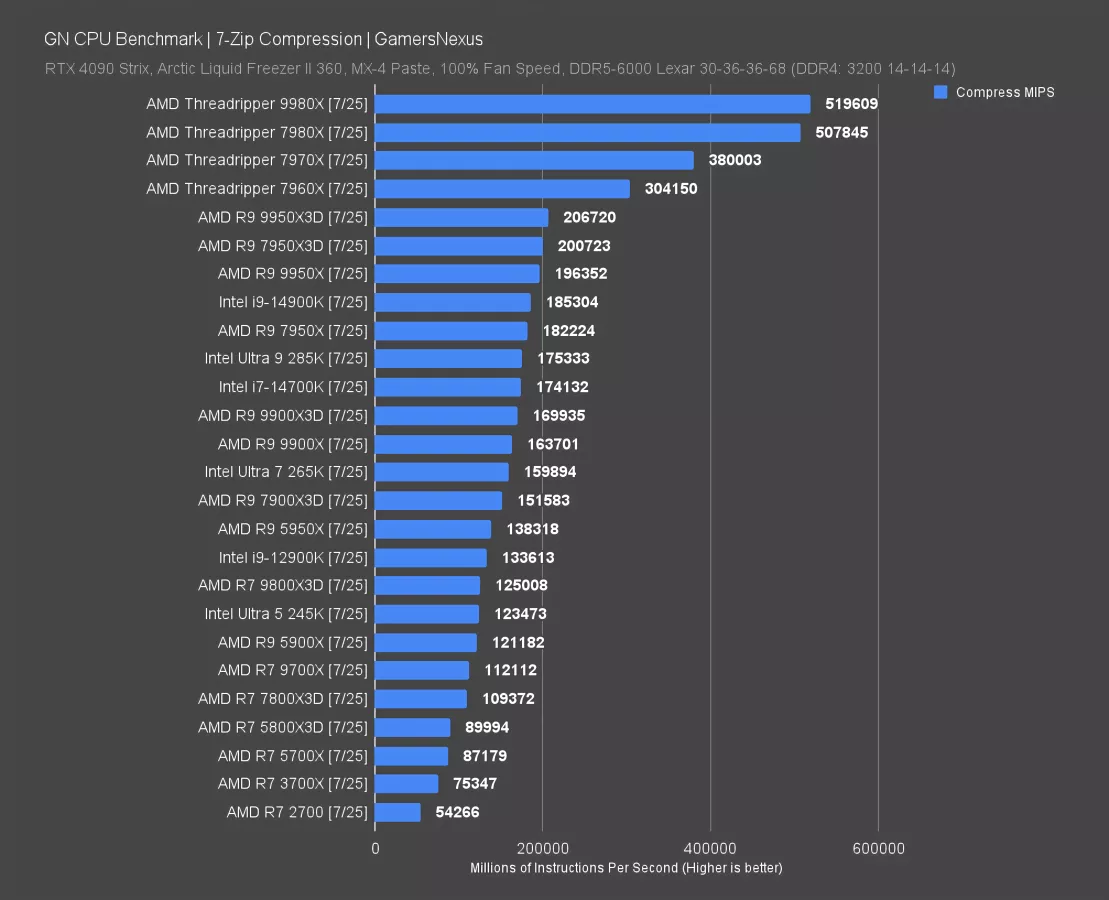
This test is measured in MIPS, or millions of instructions per second. Higher is better throughput. The 9980X is the new chart-topper here, at 520K MIPS versus the 7980X’s 508K MIPS. The improvement is just 2.3% here. This is one of the lower improvements.
There’s clear benefit to higher core counts in this test. The 7980X over the 7970X previously held a lead of 34%, or 67% over the 7960X.
Against the highest-end desktop part, the 9950X3D, the 9980X sees an improvement of 151%. Notably, extra cache seems to help here: Both the 7950X3D and 9950X3D are benefitted over the 9950X.
Threadripper is in an entirely different class from desktop components, although the uplift over the last generation’s 7980X is limited and relatively boring here.
7-Zip Decompression
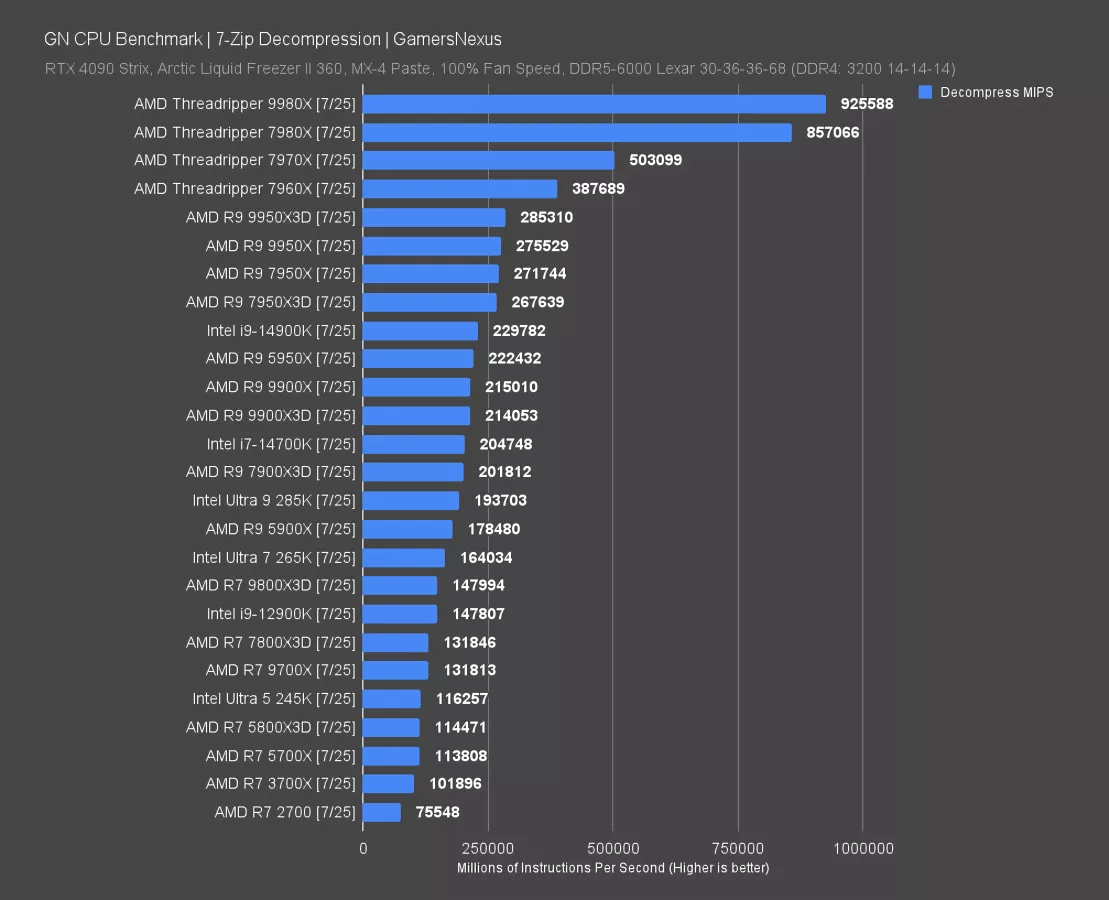
In decompression, the 9980X scaled up to 926K MIPS, gaining 8% on the 7980X’s 857K MIPS. This is a better showing than what we saw in compression and posts better scaling. The rest of the lineup is familiar to the prior examples. Extra cache doesn’t help as much in this test as compared to the compression test, as the 7950X3D is now below the 9950X. This would align with the speed benefit providing more of an uplift on Threadripper as well.
SpecWS: OptionsPricing
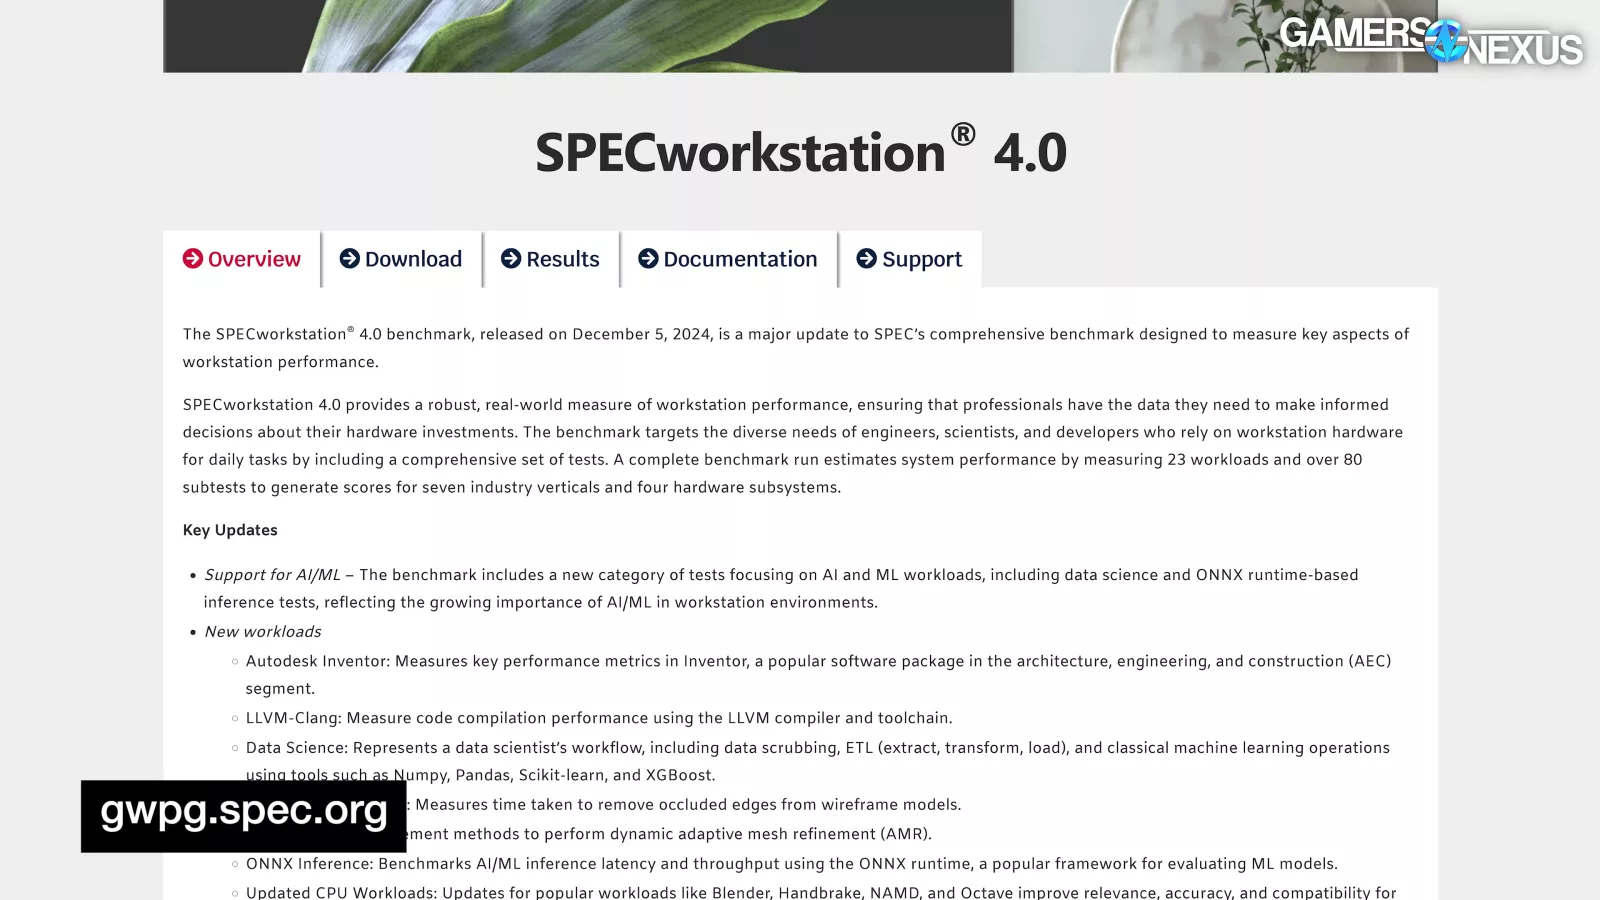
SpecWorkstation 4.0 is next. This runs a number of simulations and mathematical models that we aren’t experts in, but we can at least run the benchmarks. We’ll rely on the Spec website to explain what the tests are.
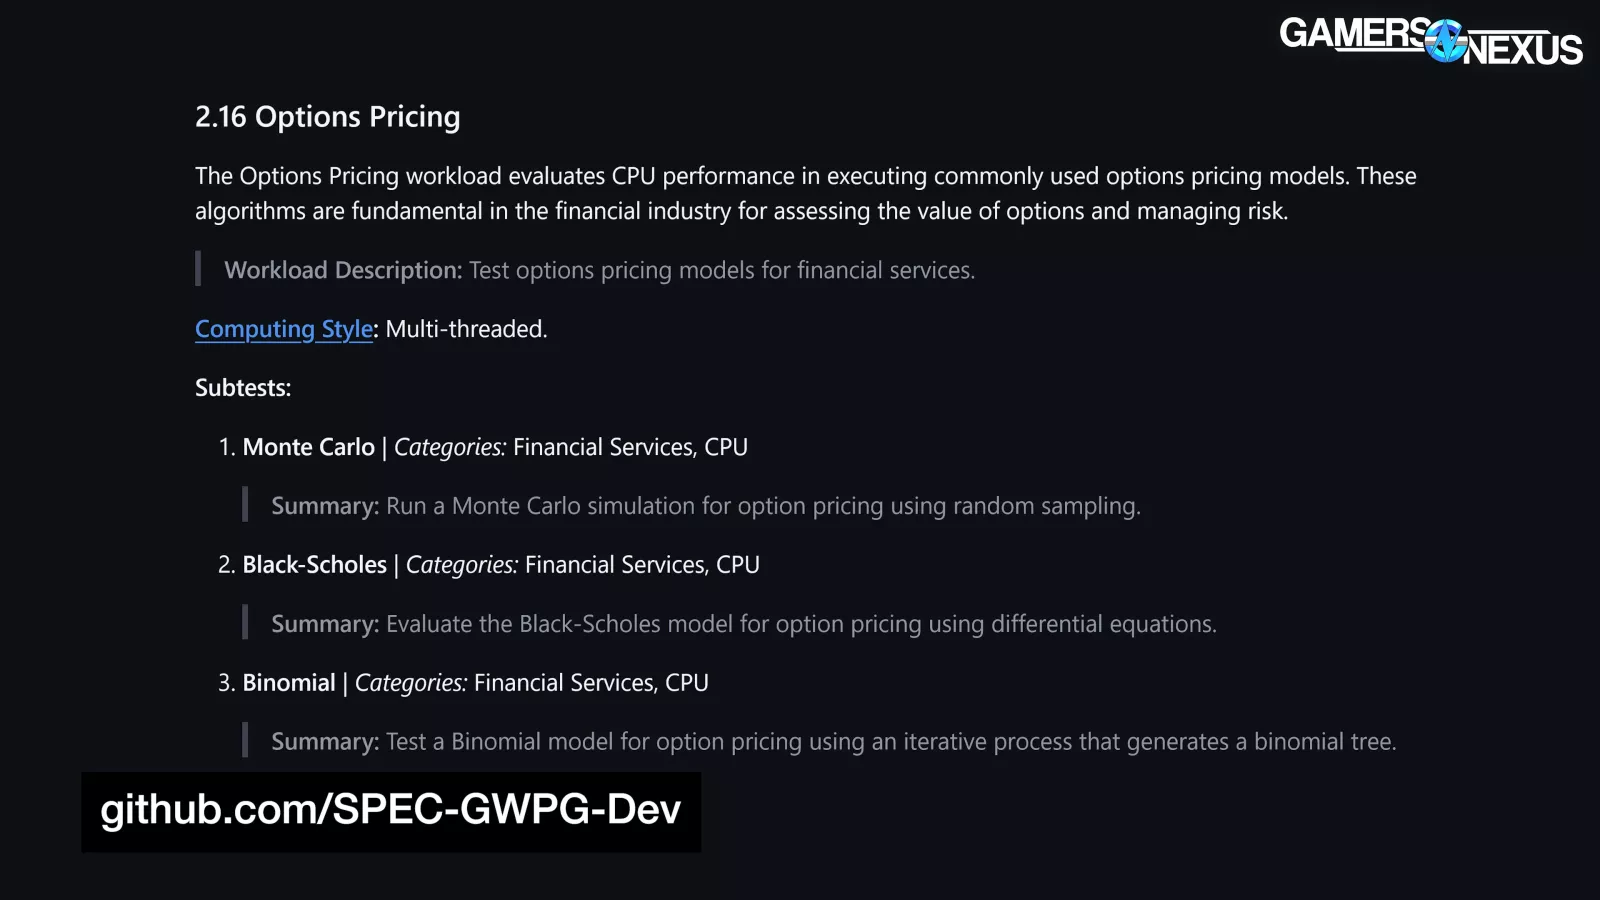
The first is Options Pricing. The website says that this runs Monte Carlo probabilistic simulations for financial uncertainty, Black-Scholes pricing models for theoretical value, and binomial options pricing. We are not experts in how these are used, but those of you in our audience who are experts have repeatedly expressed an appreciation for this test.
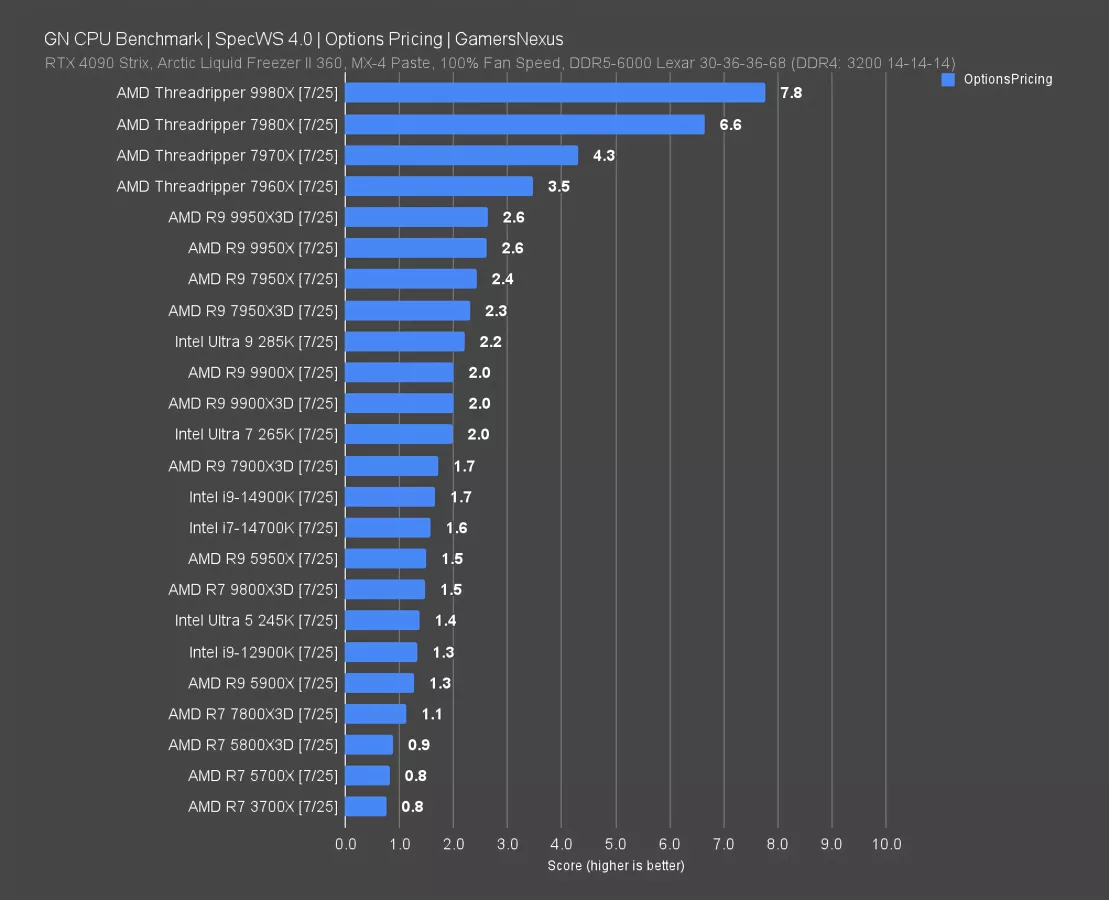
The results have the 9980X at the top, with a 7.8 score. That has it improved on the 7980X by an impressive 18%, aligning with the findings of the 9000 series desktop parts against the 7000 series in this same test. You can see that in the 9800X3D against the 7800X3D or the 9900X3D vs. 7900X3D. This is an architectural benefit. It’s one of the rare break-outs for Zen 5 that we talked about after the initial round of reviews when we had validated it as a legitimate deviation.
The 9980X improves on the highest-end desktop 9950X3D by 200%, basically being the difference between being runnable and not. Threadripper really makes an impact here, and the generational gain is real but rare in this one test.
SpecWS: OpenFOAM
OpenFOAM is next. Per the Spec website, OpenFOAM is a CFD test that “performs 2D Reynolds averaged simulation for fluid dynamics analysis.” It also runs a solver test.
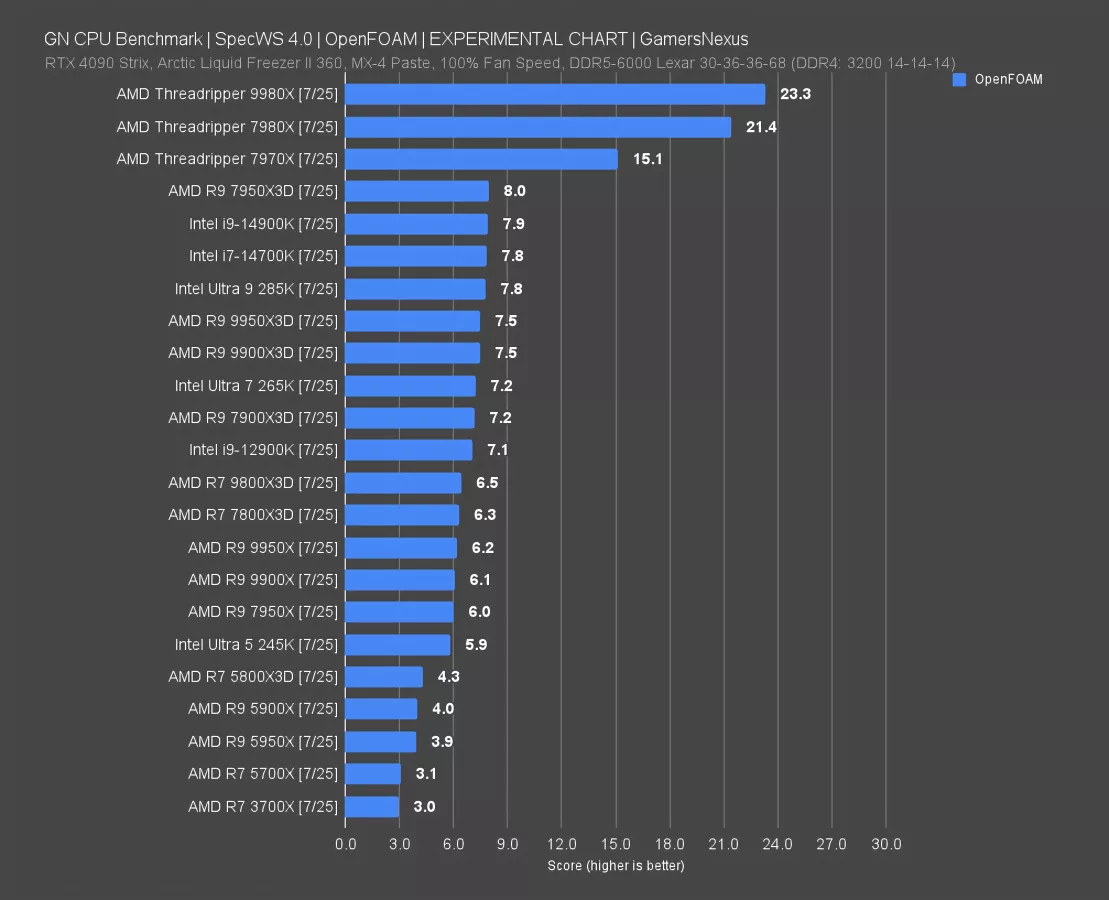
The 9980X scores 23.3 here, leading the 7980X prior generation by about 9%. Not as impressive as Options Pricing, but better than some other tests we have today.
The lead over desktop parts like the 9950X and X3D is enough that it’s really not in the same class, with multiples of uplift.
SpecWS: Convolution
Convolution testing is next. Spec says that this test applies “a convolution filter to an image, a critical operation in signal processing and image analysis” for edge detection and feature extraction. This is heavily multi-threaded.
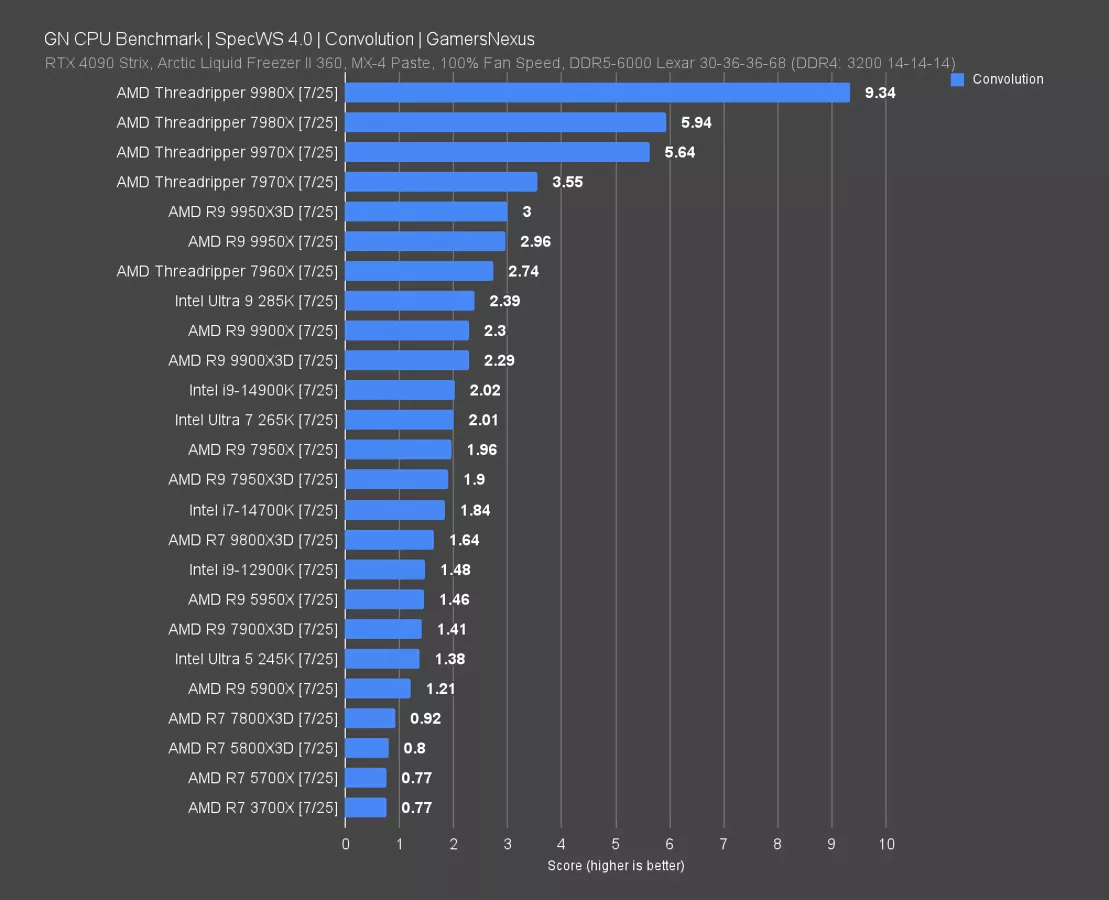
In this test, the 9980X scored 9.3 to the 7980X’s 5.9, a huge uplift of 58%. This is completely out of alignment with any other tests. We contacted Wendell of Level1 Techs and AMD’s engineers to get both a first-party and a neutral third-party check of these numbers. Wendell noted that this is expected behavior and had seen similar results in other tests, believing it to be related to AVX improvements in addition to being a test that runs long enough to benefit from them. AMD noted that it has also seen results around 60% for certain similar tests.
Although we have our 9970X review coming up separately, we’ll note that it also saw a 56% improvement here over the 7970X predecessor. The results align. Looking at last gen, the 9950X improved on the 7950X by 50%, which is consistent generationally. The results appear to be consistent and are present across numerous CPUs cross-generation, which means the only thing left to consider is whether this benchmark represents real-world scenarios. We’re not sure: This particular test exits our expertise, as we don’t do signal processing or image analysis work. We’d love to hear from those in our audience as to whether the Spec Convolution test aligns with real-world applications that you use in your work life.
Regardless, the result is repeatable -- it’s only a question of whether it’s effectively a microbenchmark or is something that scales to real-world use.
SpecWS: LAMMPS
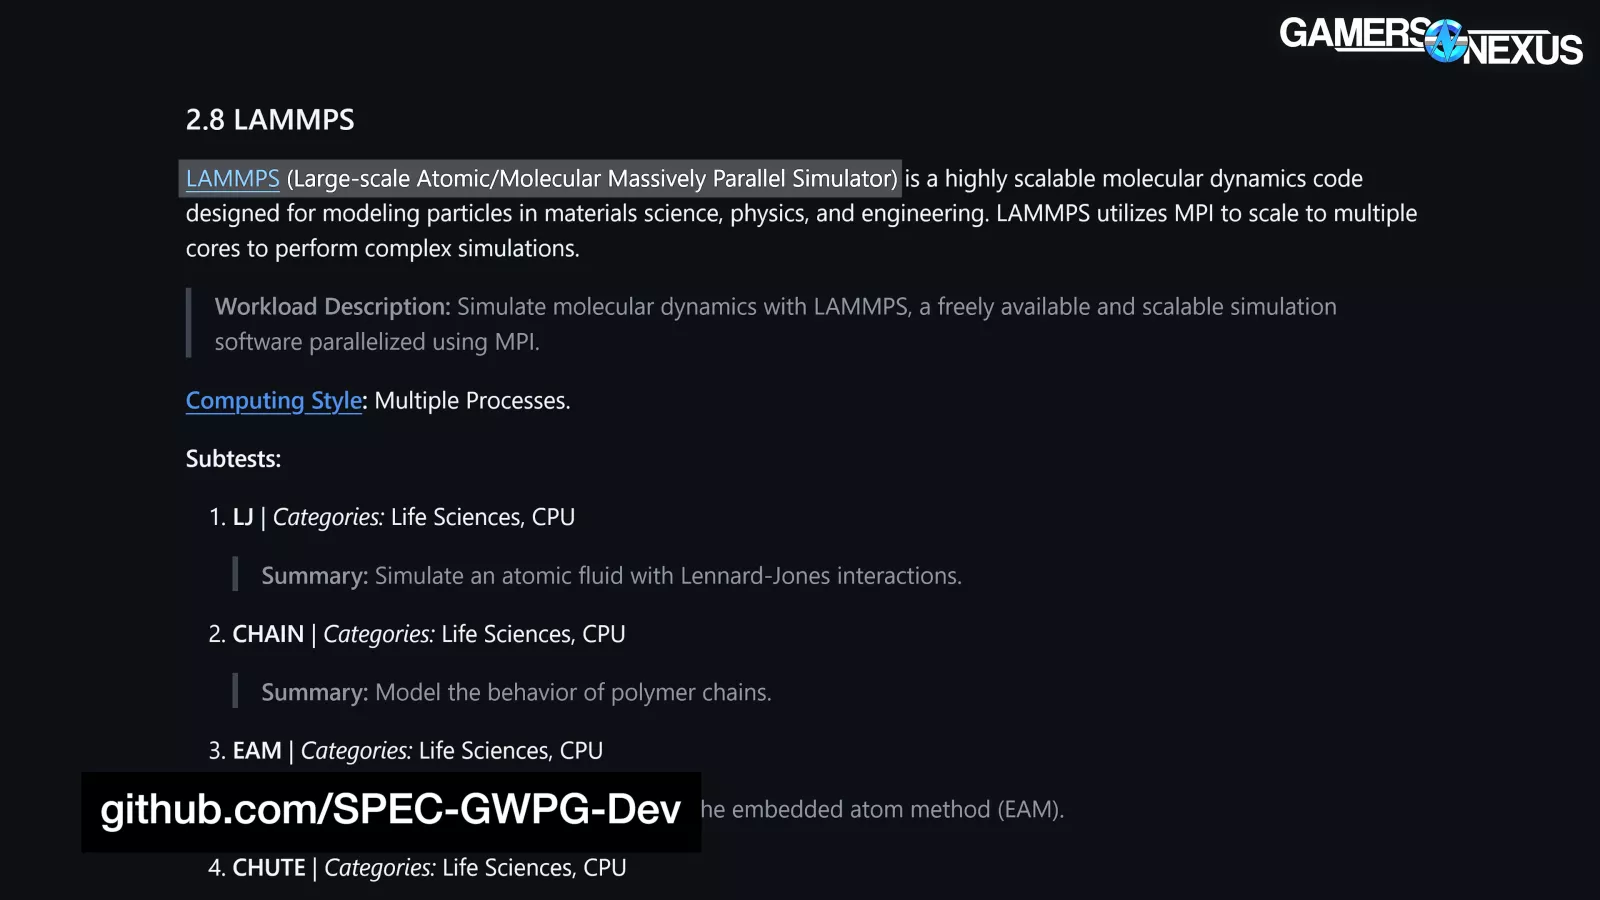
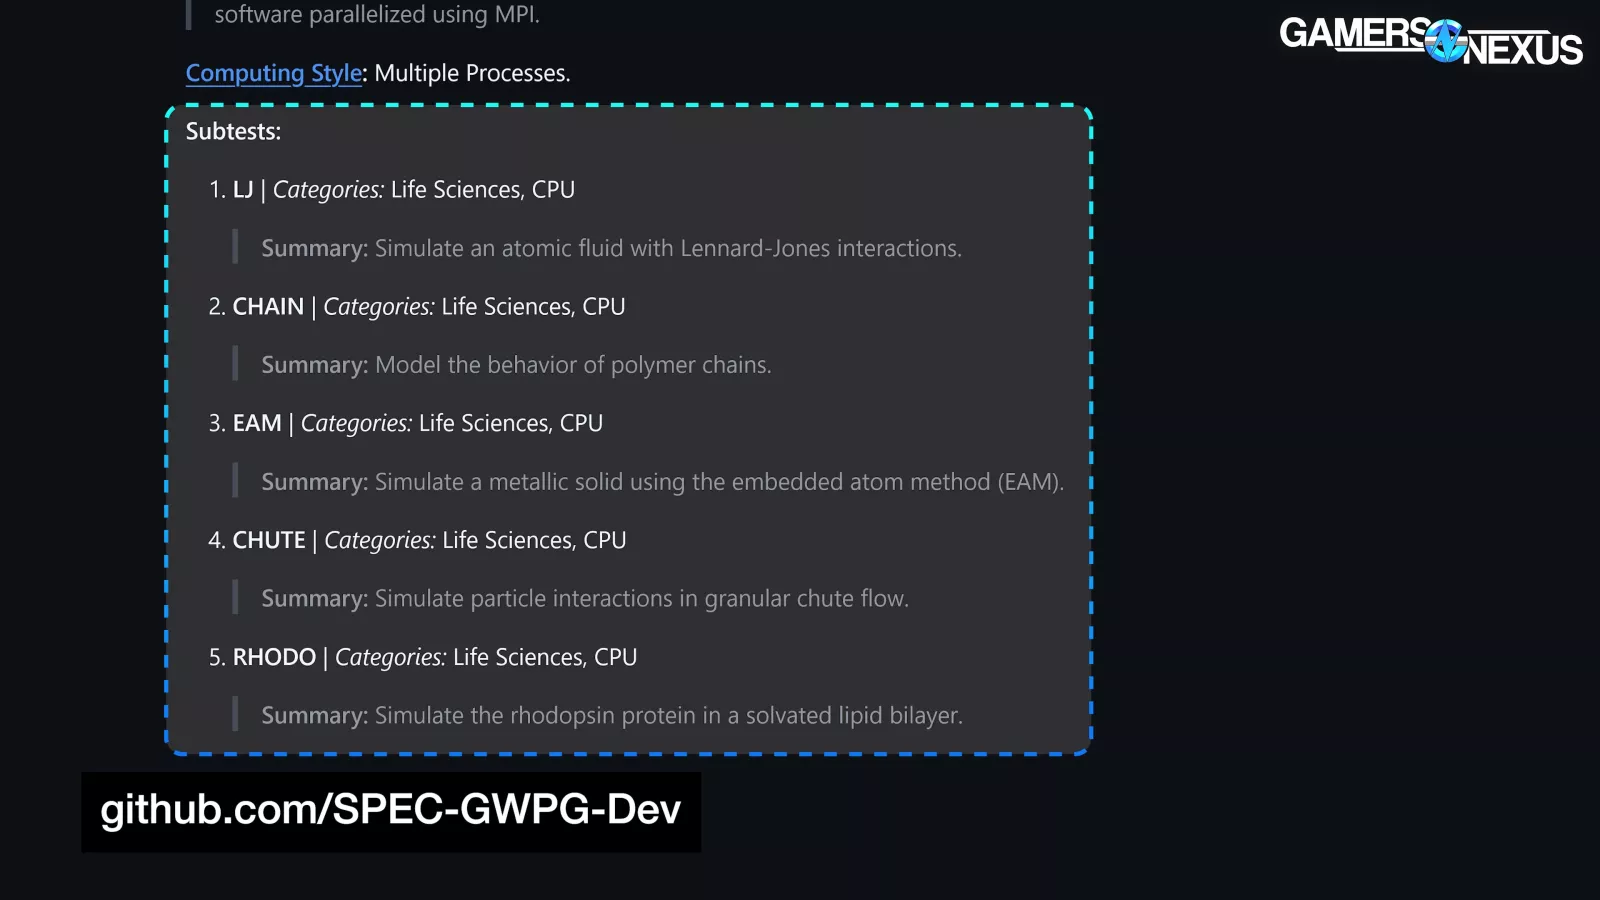
LAMMPS testing is next. According to Spec, this test is for large-scale atomic and molecular massively parallel simulation, which Spec says “utilizes MPI to scale to multiple cores to perform complex simulations.” This includes life science subtests, such as for polymer chain calculations and protein calculations for, what we assume are, medical uses.
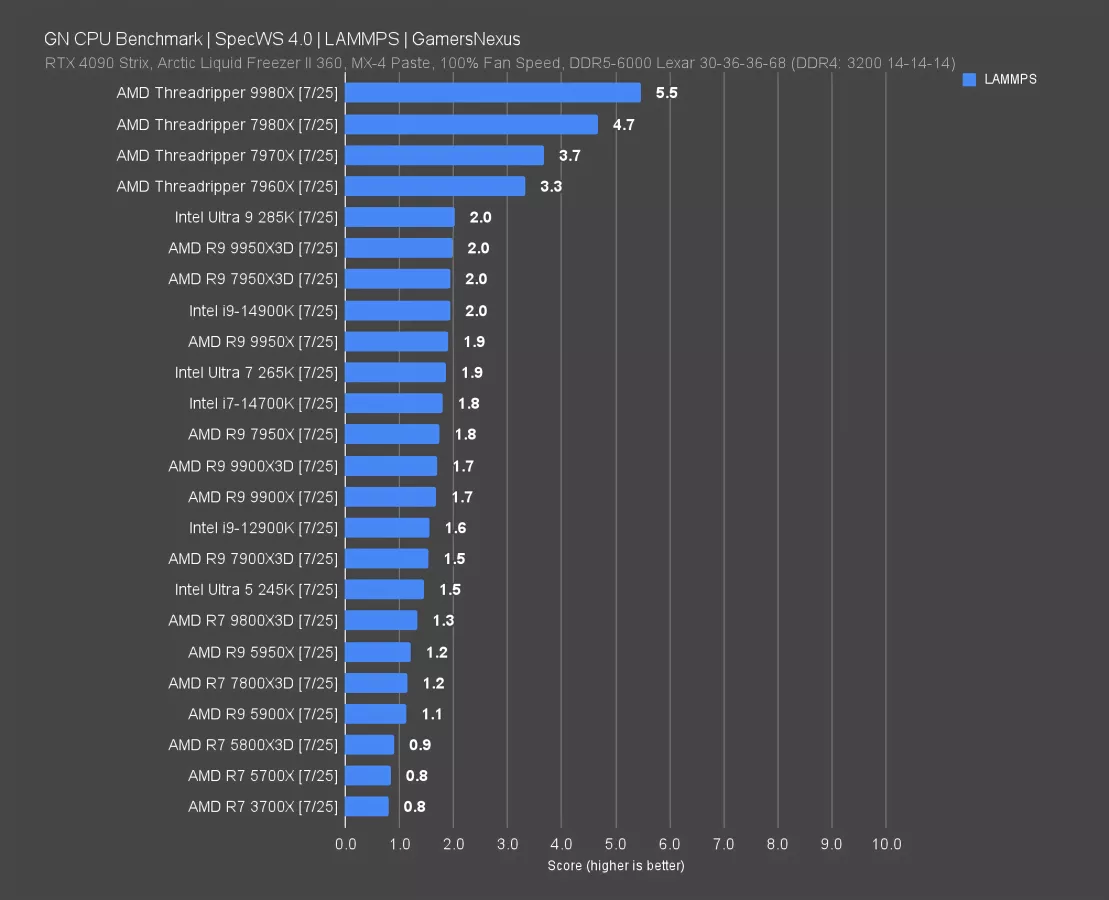
LAMMPS has the 9980X at a 5.5 score in Spec, leading the 7980X by 17%. This is close to the Options Pricing results. Although Spec has several tests where there’s no real impact, like Handbrake, it also has a higher saturation of tests with larger generational improvements.
SpecWS: Data Science

The Spec Data Science test is next. Spec says that this test “involves running a series of synthetic benchmarks that simulate real-world AI and ML workflows using the Python-based data science libraries Pandas, Scikit-learn, and XGBoost.”
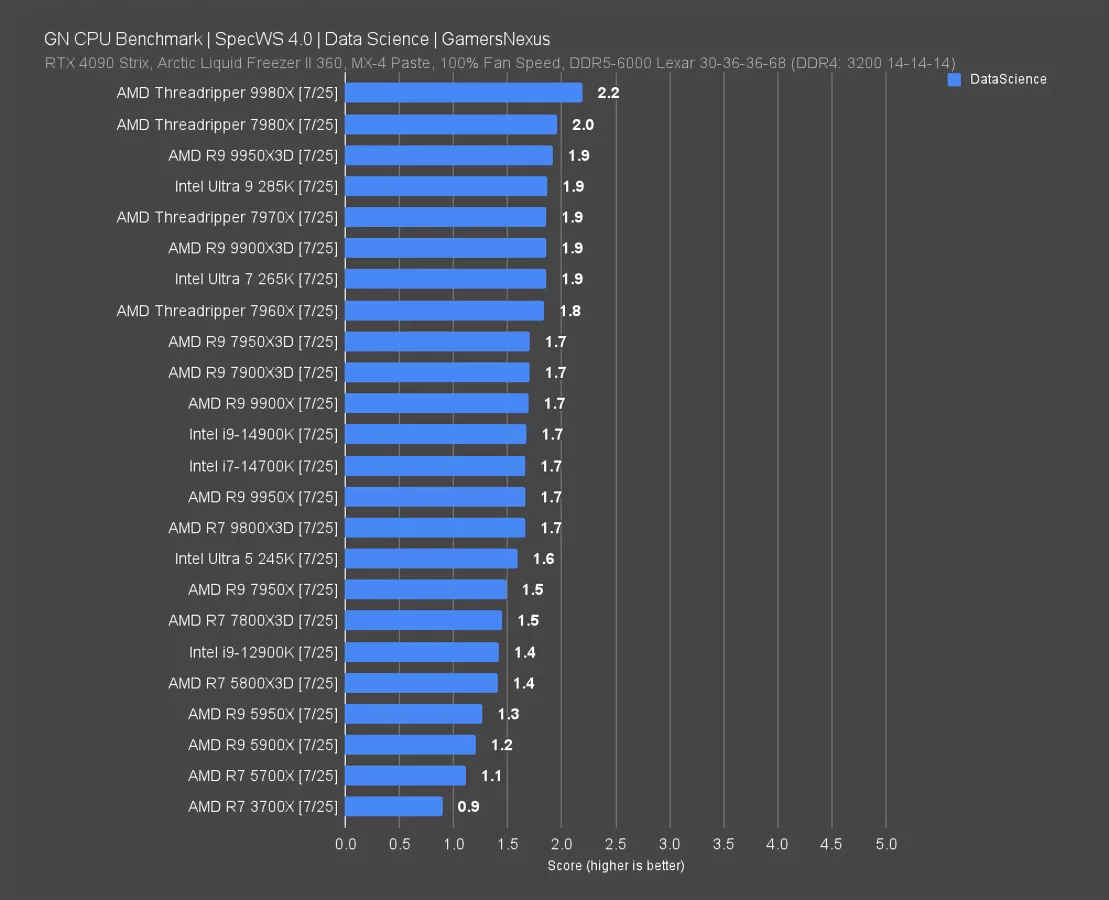
Generationally, the 9980X improves on the 7980X by 10%, going from 2.0 to 2.2 in the scoring. For reference, the 9950X improved on the 7950X by 13% at 1.7 from 1.5.
SpecWS: NAMD
NAMD is next, another test our audience liked before. This is a molecular dynamics simulator for modeling “behavior of biomolecular systems,” with Spec saying that it is “used for research in biochemistry, pharmacology, and molecular biology.”
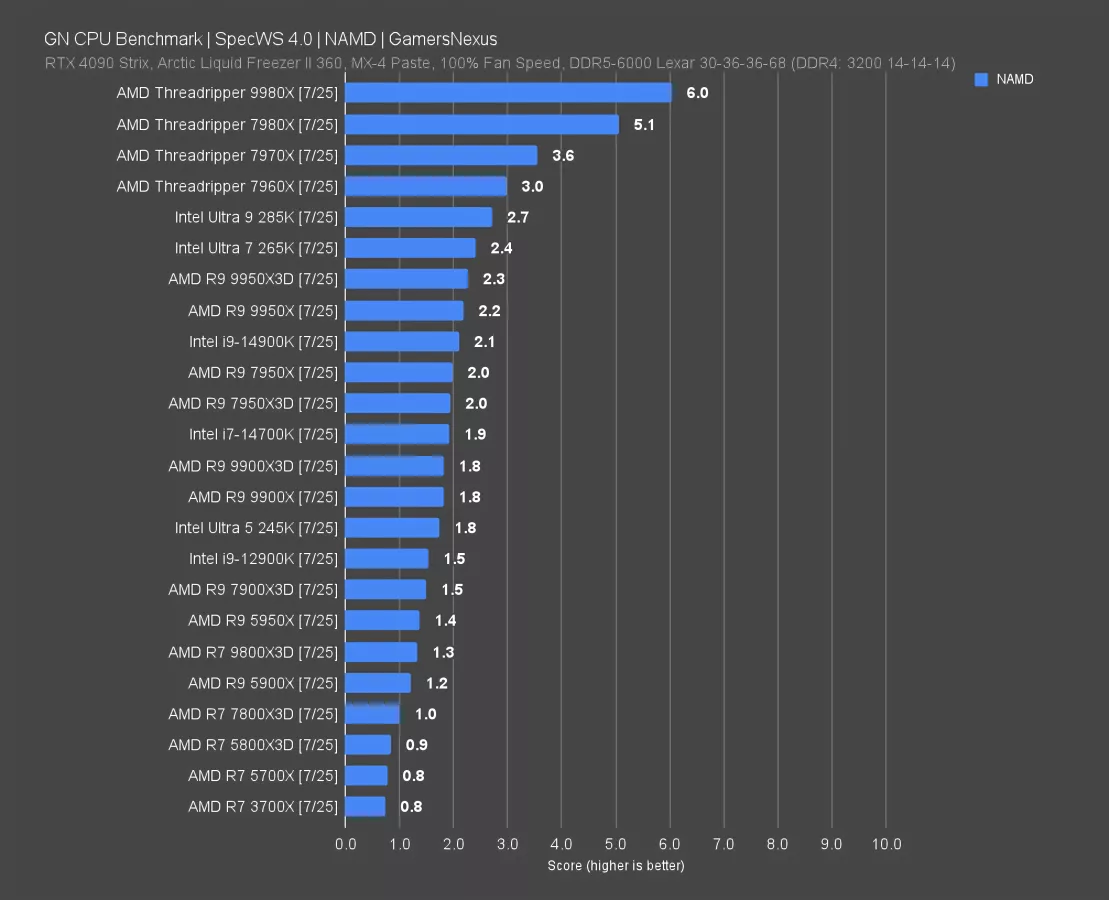
The 9980X scored 6.0, with the 7980X at 5.1. This is an improvement of almost 18%, which aligns again with LAMMPS and options pricing benchmarks.
SpecWS: RodiniaCFD
We have a lot more Spec results, but we’ll close on one that’s less interesting to bring it back down to earth and balance the higher results. This is for RodiniaCFD, which the site explains has a pre-euler subtest that “executes an unstructured grid finite volume CFD solver for 3D euler equations for compressible flow.”
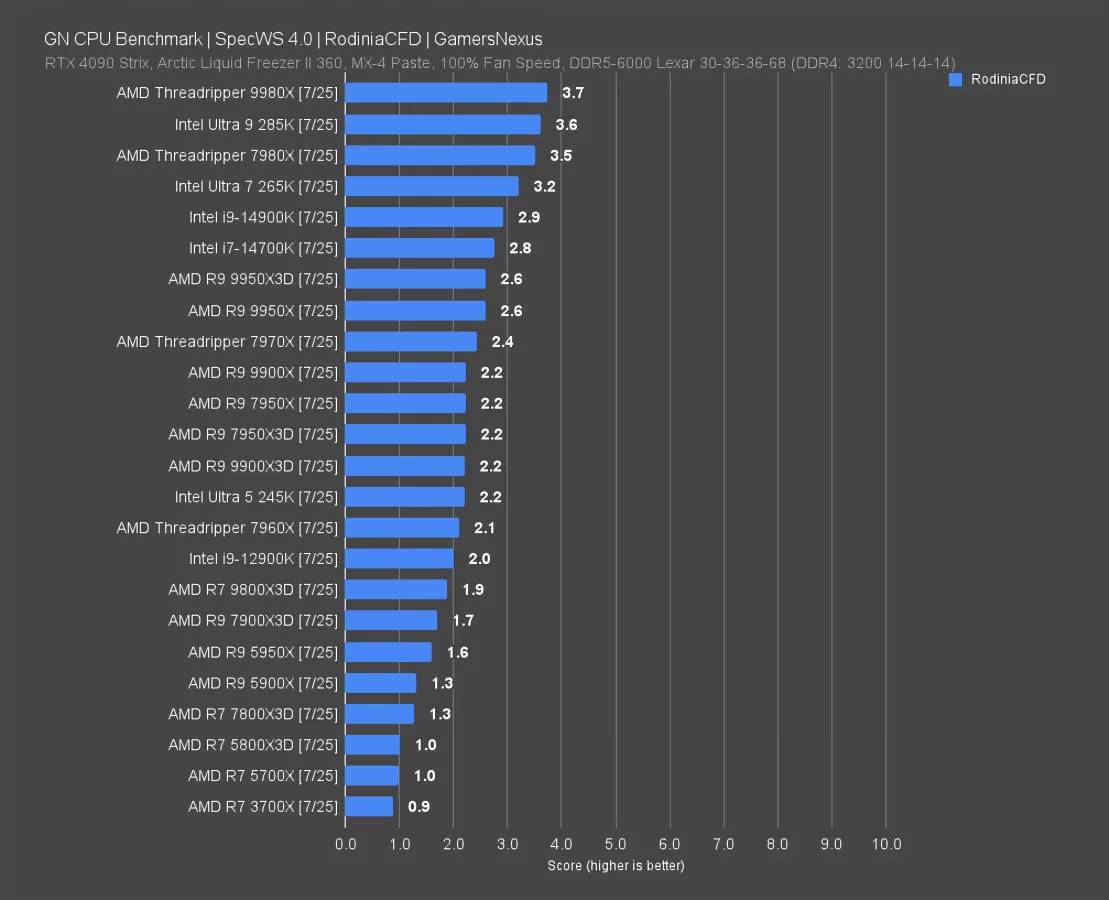
The 9980X scored 3.7 here, with the 7980X at 3.5. This is one where the improvement is less exciting, back down to about a 5-6% improvement generationally.
Chromium
Up next is Chromium code compile. There are a lot of types of code compile, just like there are a lot of types of video encoding or photo editing or 3D rendering workloads, so we’re just representing one here as we do with any other production test.
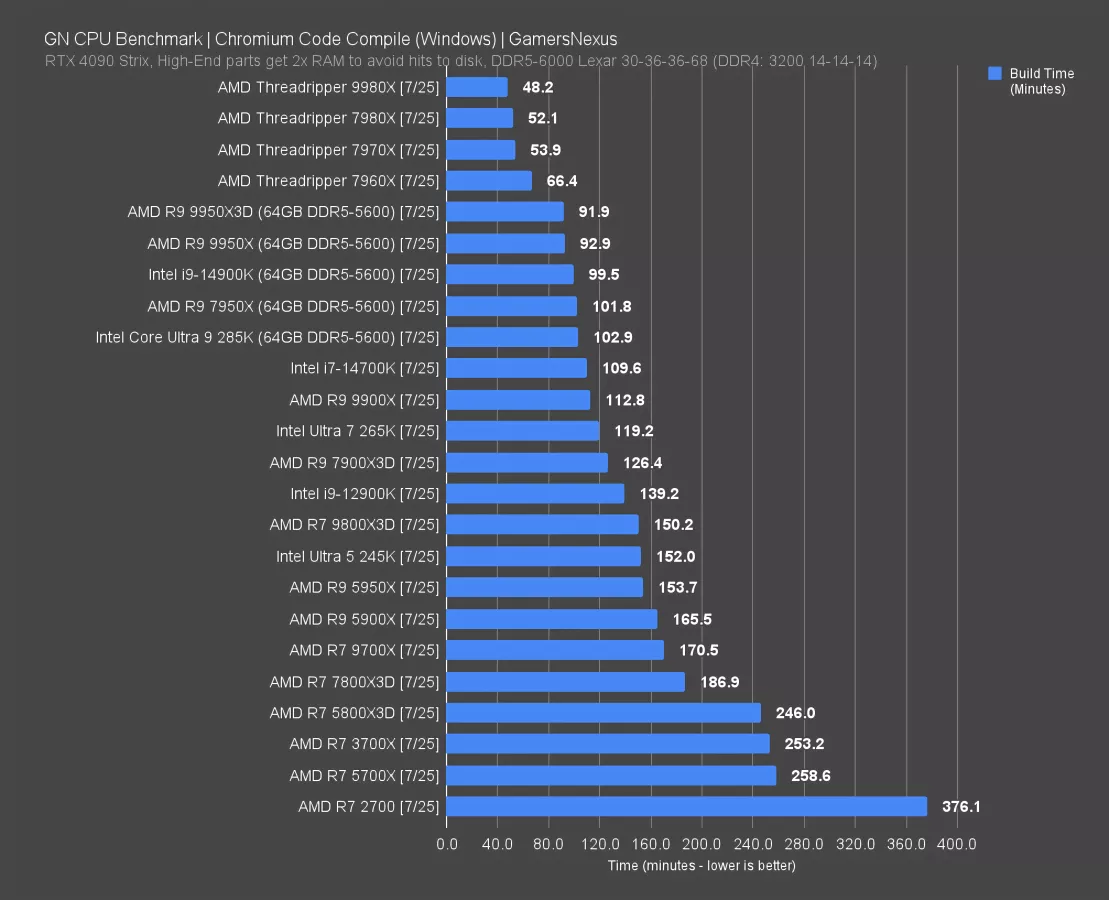
The 9980X completes the compile the fastest, at 48 minutes total. The compile time is 7.5% reduced from the 7980X. Elsewhere, with the newer version of this test, we’re seeing reduced impact compared to prior test iterations. The 7980X and 7970X are relatively close to each other, with the 9950X3D and 9950X also near each other. Some of these CPUs are running with reduced memory speed as they required higher memory capacity and had more trouble holding our usual settings, so those are noted where true.
The 14900K is Intel’s best performer, requiring 100 minutes to complete the compile. The 9950X outperforms this.
Blender
Blender tile-based rendering is up next.
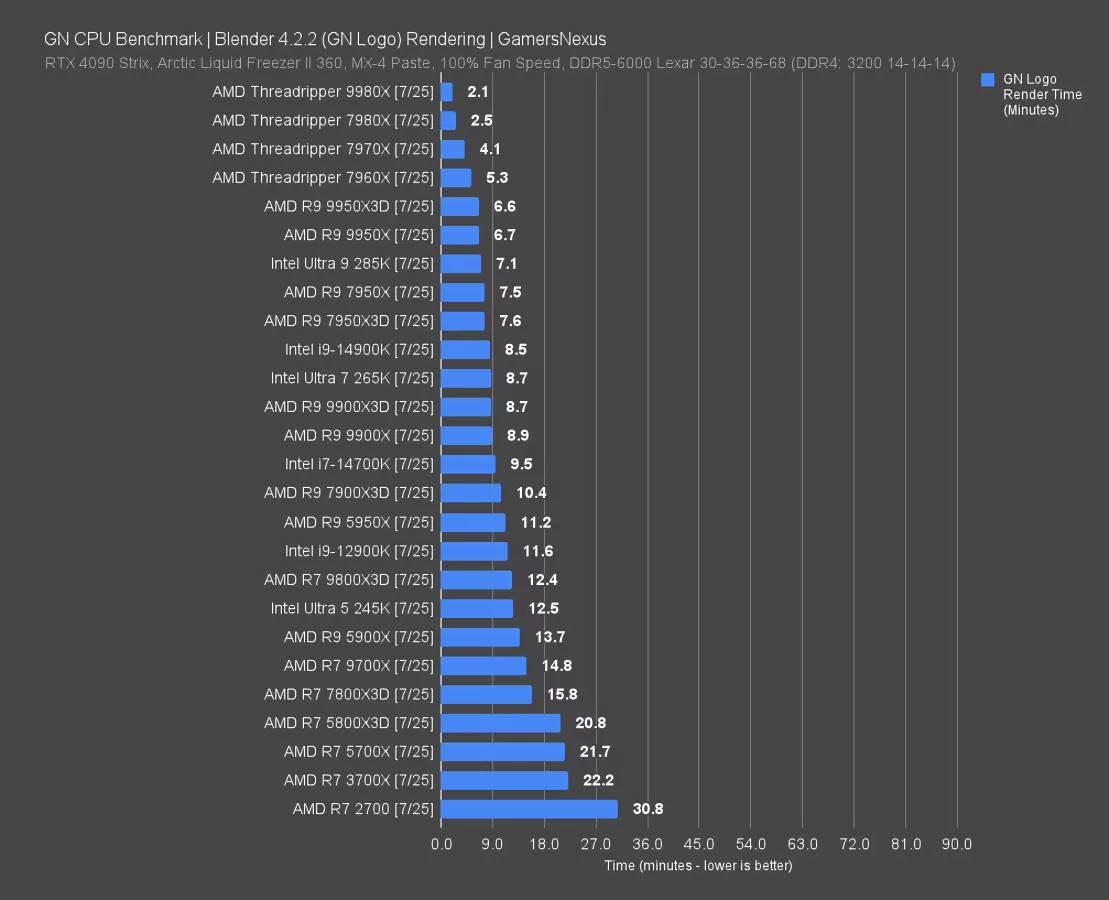
For this process, the 9980X is the new chart-topper at 2.1 minutes to complete a render of a single frame from the GN intro animation logo. The next fastest is the 7980X at 2.5 minutes, which makes sense: This test is heavily thread-dependent, so threads will outrank frequency where large differences emerge.
Intel’s newer generation does OK in this test, with the 285K between the 9950X and 7950X. It’s also one of the tests where Intel doesn’t see regressive performance, though we still wouldn’t recommend the 285K. That entire platform is dead, anyway.
Photoshop
Adobe Photoshop is next, tested with the Puget Suite. This uses an aggregate score of filters, resizes, and other functions within Photoshop.
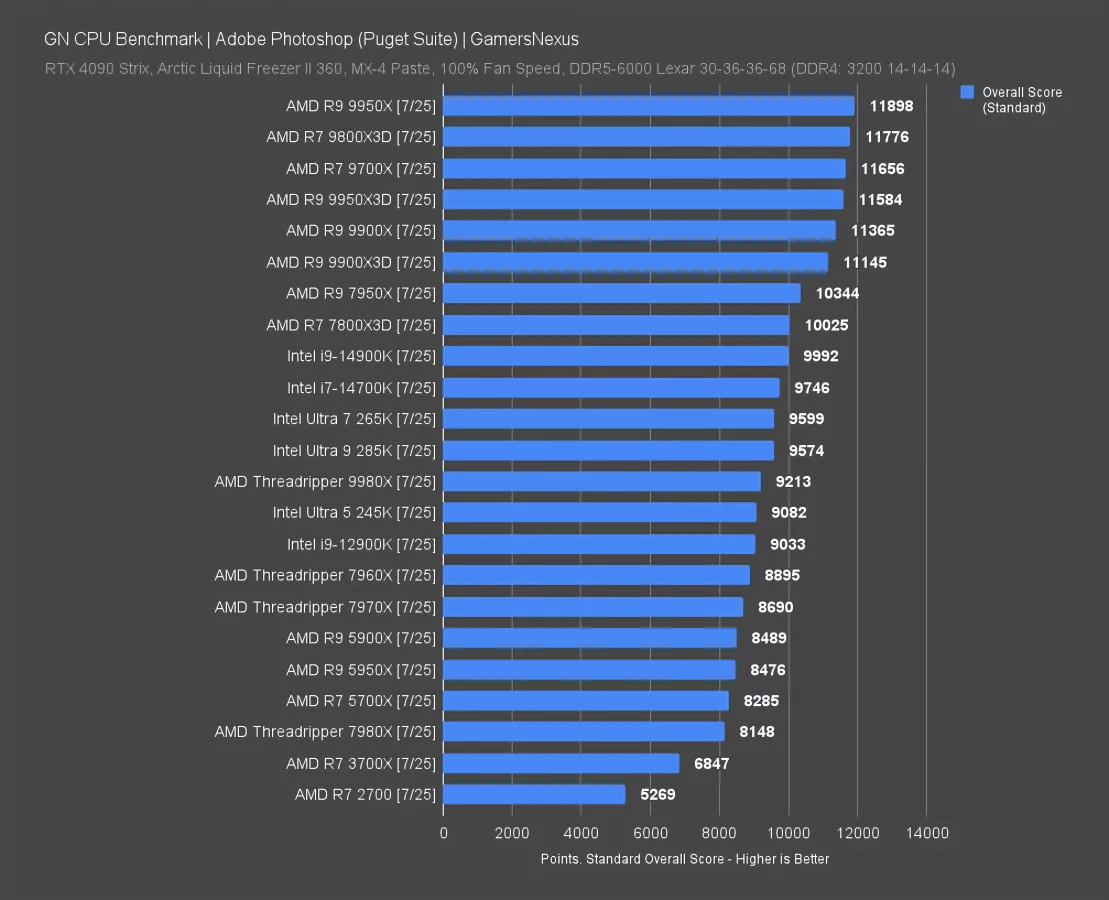
The best performer here is the 9950X, followed by other desktop CPUs. The Threadripper parts fall further down the chart, with the 9980X in particular underperforming. We’ve seen this in the past, such as with the 7980X: They just have too many threads for their own good and Photoshop isn’t able to utilize them. The 7980X is outperformed by the 7970X and 7960X, so the 9980X landing in the middle isn’t a surprise. Its main improvement comes from the frequency.
It does OK here if this is just one of many applications you use, but if Photoshop is the only thing you do, there are better and cheaper CPUs for the job.
Premiere
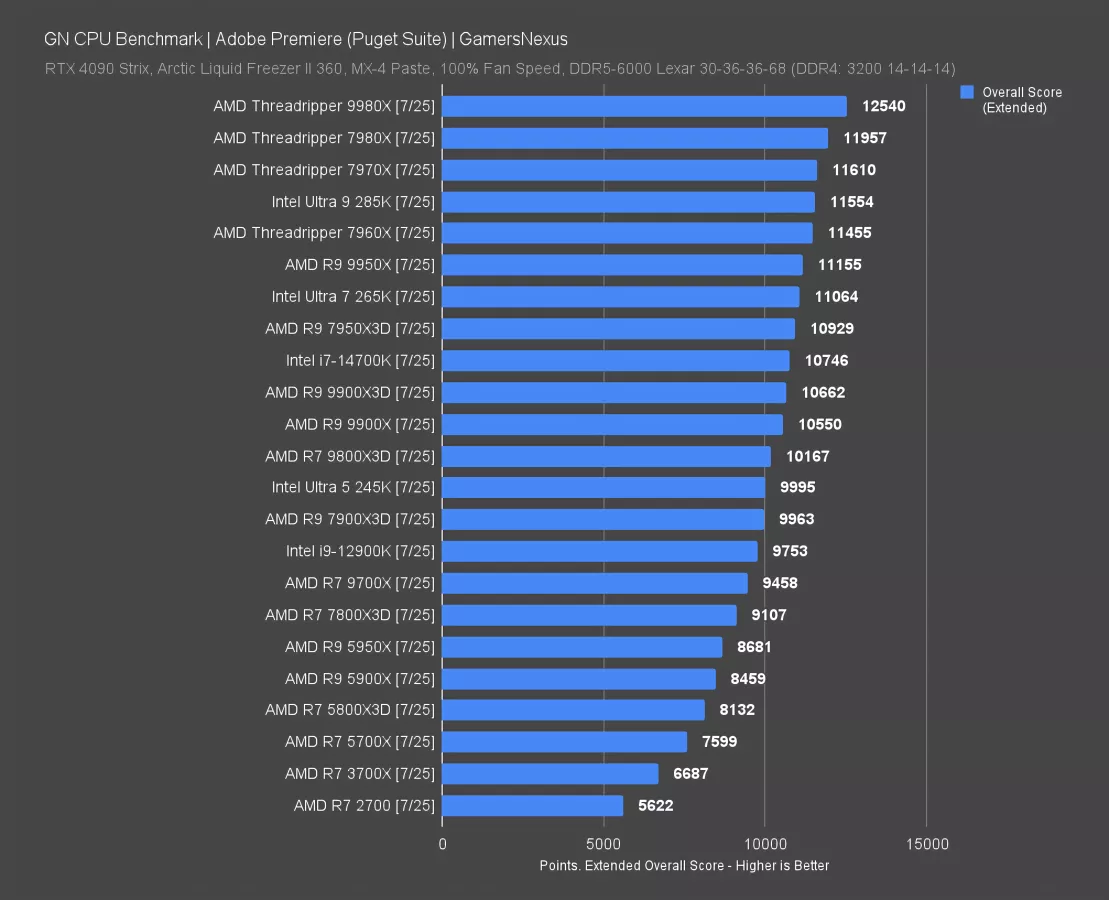
Adobe Premiere is next, our best frenemy that we see every day.
In this one, the 9980X improves upon the performance from the 7980X and 7970X, but only barely. It’s definitely not worth a single generational upgrade, though we generally don’t recommend that anyway.
The improvement is almost 5% from the 7980X to the 9980X in the extended score for Premiere. Intel’s 285K trails most Threadripper CPUs in the chart and roughly ties the 7960X. It also technically outperforms the 9950X. Intel’s biggest advantage remains in its QuickSync solution with the IGP, which would show up disproportionately in more targeted tests rather than the full sweep done here.
Threadripper does well overall here and is at least better than its Photoshop showing, but without other applications leaning on threads, a desktop CPU would get most of the same performance. The best use for Threadripper here would be assigning its excess threads to other tasks, like separate audio compositing, while running Premiere tasks.
DaVinci Resolve
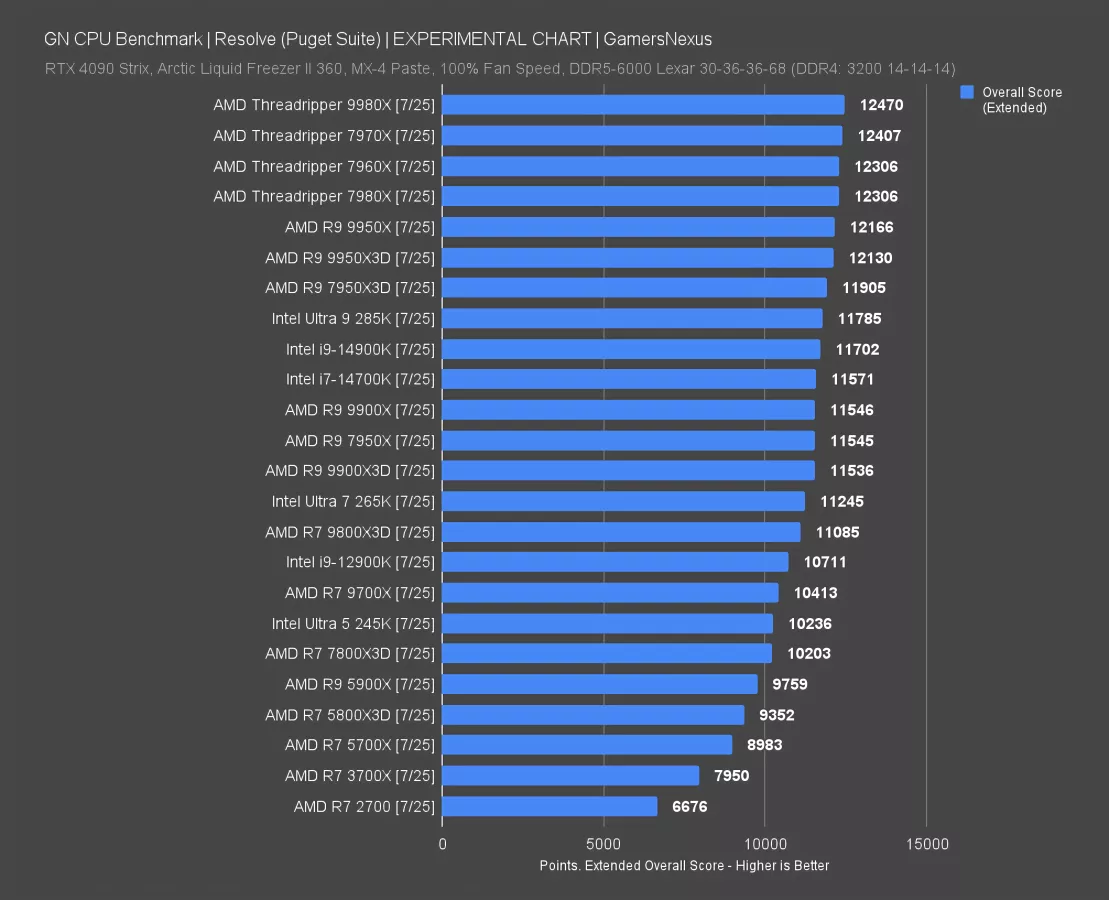
DaVinci Resolve is next. We haven’t tested this in years, so this is an experimental chart.
In this test, the 9980X’s frequency boost allows it to gain on prior Threadripper CPUs. The previous lineup had the 7960X and 7980X tied, with the 7970X marginally ahead. We saw this with the 7000-series Threadripper reviews where 64-core parts sometimes caused slight losses compared to 32-core counterparts.
The 285K falls behind the 9950X in this one, though not by a lot, with the 14900K roughly within re-run distance of the 285K.
Threadripper is at least the best performer here as well, despite not providing clear value over desktop parts. It’s just not built for these kinds of workloads, but still being the best is important.
Gaming Benchmarks

We’ll keep gaming short. The only purpose of gaming tests on Threadripper, generally, is to make sure there isn’t some major problem, but cheaper desktop parts are going to be better for pure gaming builds. Threadripper is actually detrimental if all you do is gaming.
You're going to notice that the Threadripper chips don't always follow a strictly logical order, especially when they're within a few frames per second of each other. That's because of the increased run-to-run variance causing less meaningful averaged results.
Stellaris Simulation Time
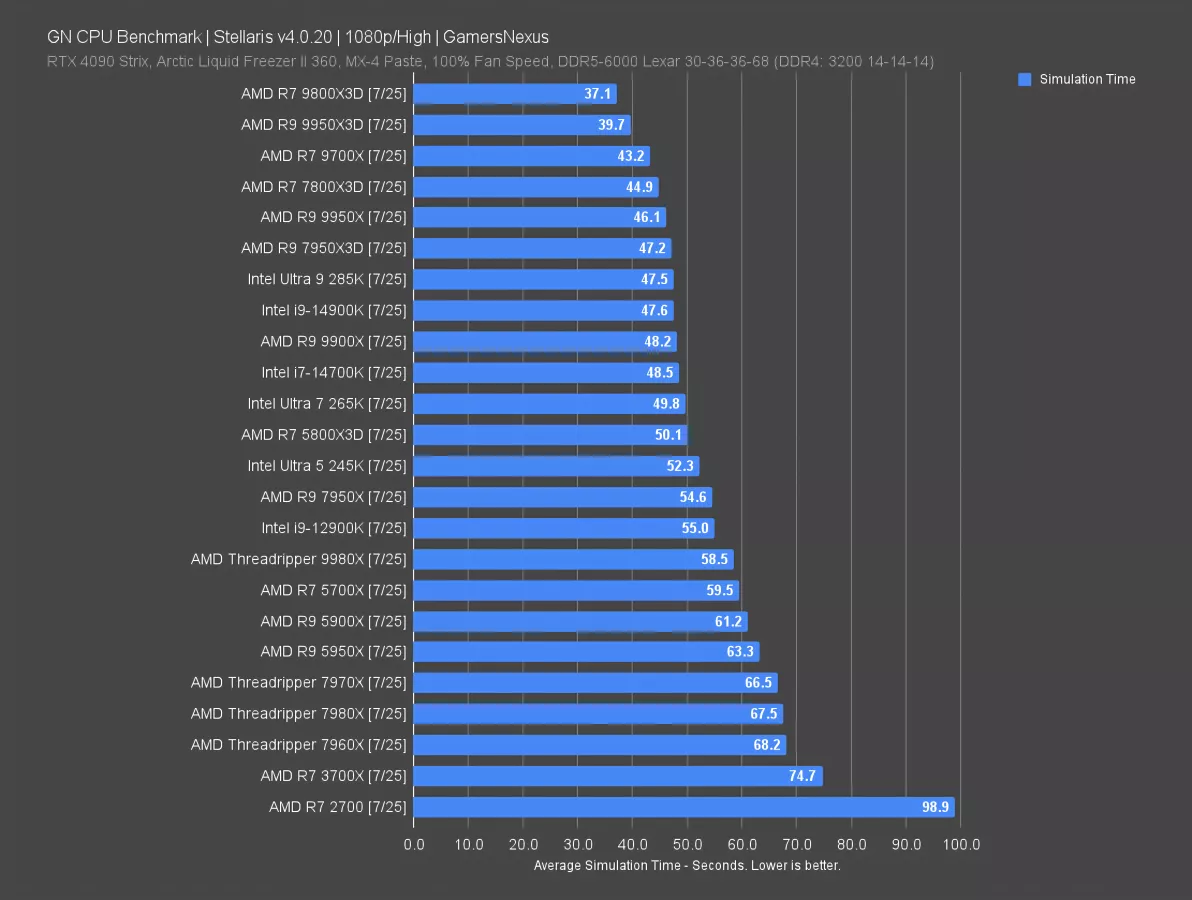
Stellaris simulation time is first. The 9800X3D is the current leader at 37.1 seconds on average for simulation time. The 9700X follows this at 43.2 seconds, benefitting from Zen 5 architectural improvements over the prior generation. The 285K isn’t what we’d call “good” here, but at least matches its predecessor.
Threadripper is way at the bottom, with the 9980X at least improving on the 7980X notably, but it’s still far worse than any other modern gaming CPU. The 5700X is nearly at the level of the 9980X. It’s just detrimental to have this CPU configuration for this game, which isn’t really news to anyone. It can at least play games, but the difference in simulation time between the 9800X3D and the 9980X would be noticeable in real game play.
FFXIV: Dawntrail - 1080p
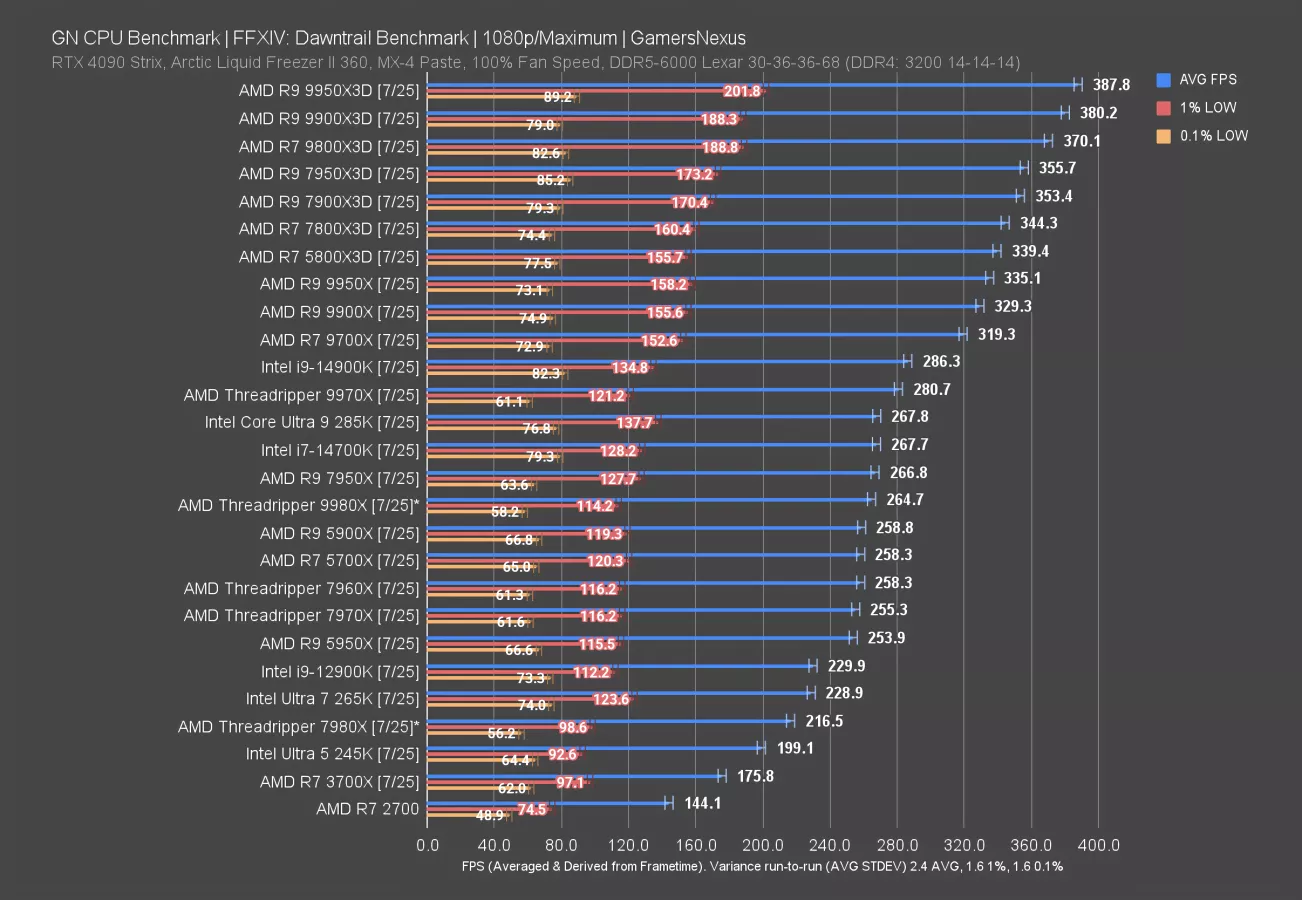
Final Fantasy 14: Dawntrail is next. The 9980X and 7980X high core-count CPUs had some major inconsistency issues in this game, so there’s an asterisk next to their entries.
We’re still showing the averages of 4 runs, it’s just that the runs are more variable than typically. The 9980X, for instance, had a range from 274 to 248 FPS AVG, which is a huge swing. Our typical standard deviation in this game is a couple frames per second for the average. The game was playable, but all over the place for the average framerate. Lows were worse overall as well, but again, technically playable.
This is why we still test games with Threadripper, though.
Dragon’s Dogma 2 - 1080p
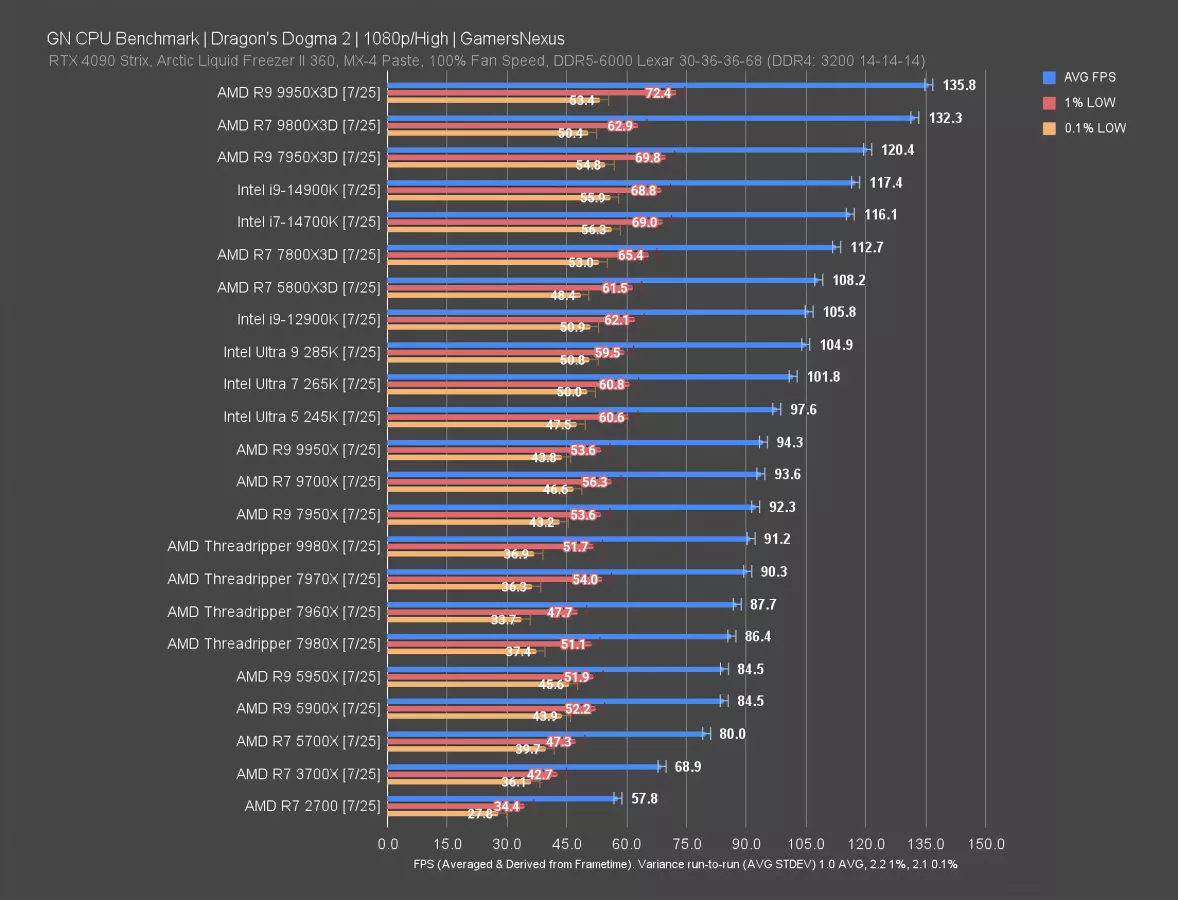
In Dragon’s Dogma 2 at 1080p, the Threadripper CPUs end up in the lower half of the chart. The 9980X is worse than the 7950X here and about the same as the 7970X. The 7980X was below the 7960X and 7970X, indicating that these extremely high core counts are detrimental to gaming performance. The higher frequency matters more than the extra cores, so the trade-offs are harmful to gaming performance here. This has been true forever with Threadripper, so none of this is news.
What matters more is that they’re still playable. Threadripper does suffer from worse lows, particularly 0.1%, but not so bad that they render the game stuttery. You could still play games on a Threadripper system, but again, gaming-only users should buy something else.
Cyberpunk 2077: Phantom Liberty - 1080p
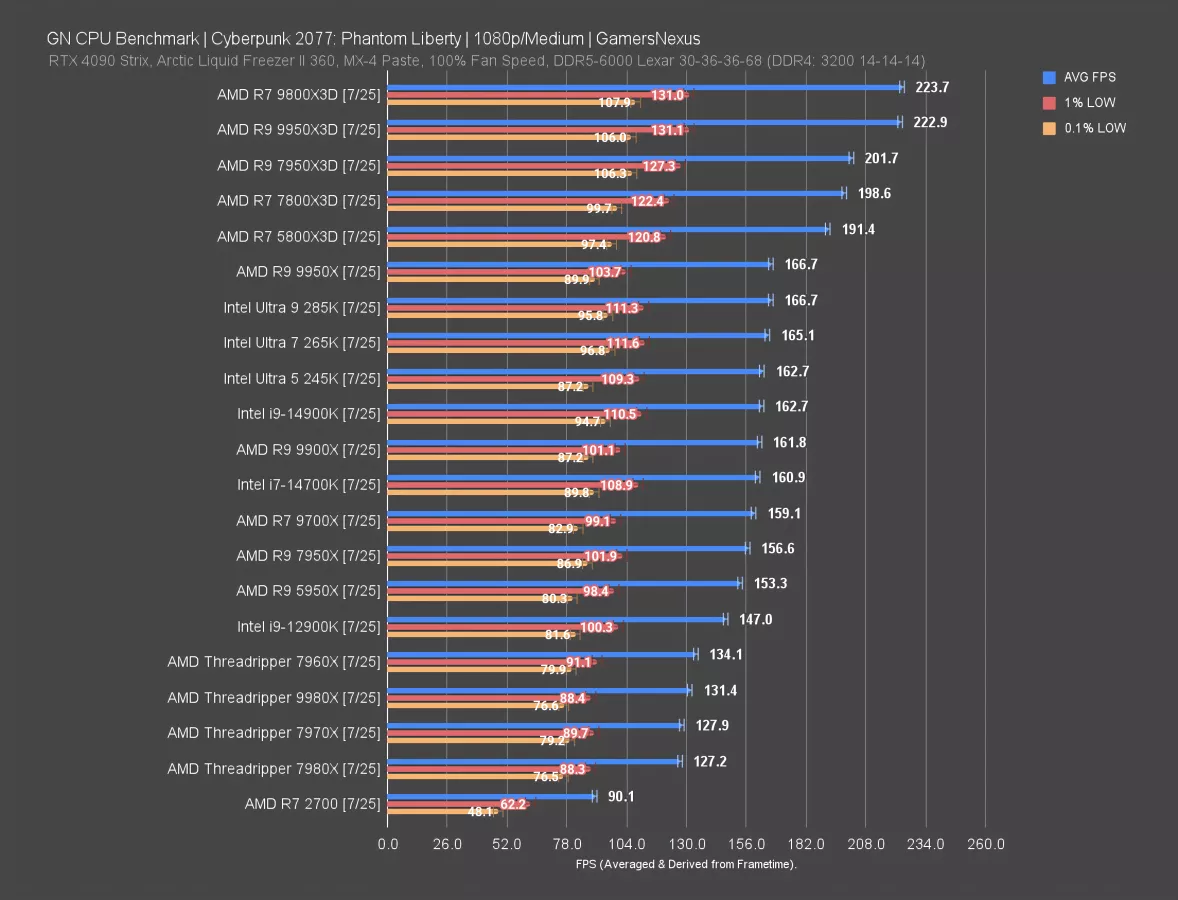
Cyberpunk is next. In this one, the 9980X outperforms the 7980X on a technicality, but both are closer to the R7 2700 than they are to the 9800X3D. The run-to-run consistency was fine, with the 9980X only exhibiting a 1.9 AVG FPS standard deviation, so it’s not like what we saw in Final Fantasy -- it’s just not particularly good. This is still a passable framerate, so in the context of a computer built for specific work tasks that can still play games when needed, it passes that need.
Baldur’s Gate 3 - 1080p
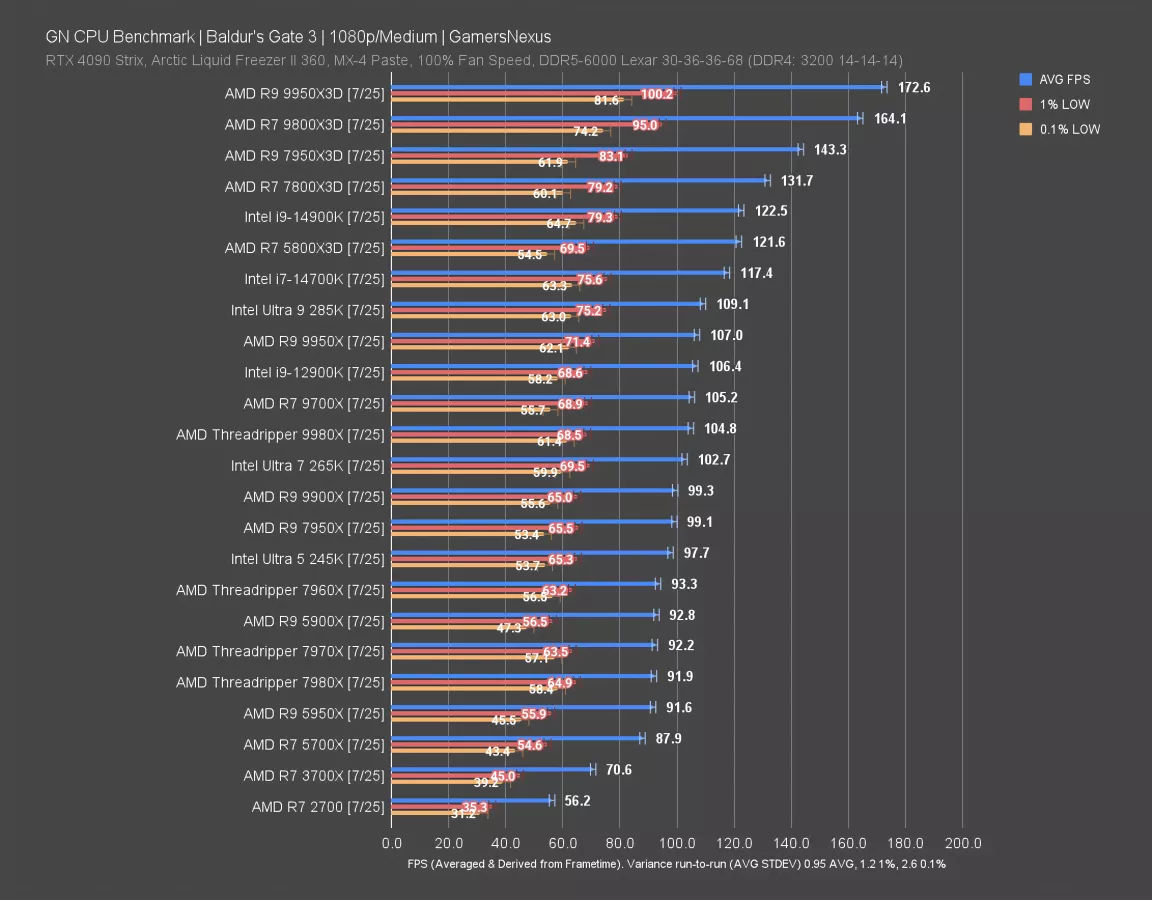
In Baldur’s Gate 3, the 9980X ends up around the level of the 265K -- which is really just more embarrassing for Intel than anything else. We already know Threadripper isn’t particularly good at gaming, despite being OK at it, but the 265K should be doing better here. This is also a game where the 285K was hugely regressive, though, at 109 FPS AVG against the 14700K’s 117 FPS AVG and 14900K’s 123 FPS AVG.
We did test other games, but they’re just not relevant beyond proving the point we already have: Threadripper is passable if gaming is not your primary need. It’s just not the best choice for it.
Power Consumption
9980X Power Consumption - Blender
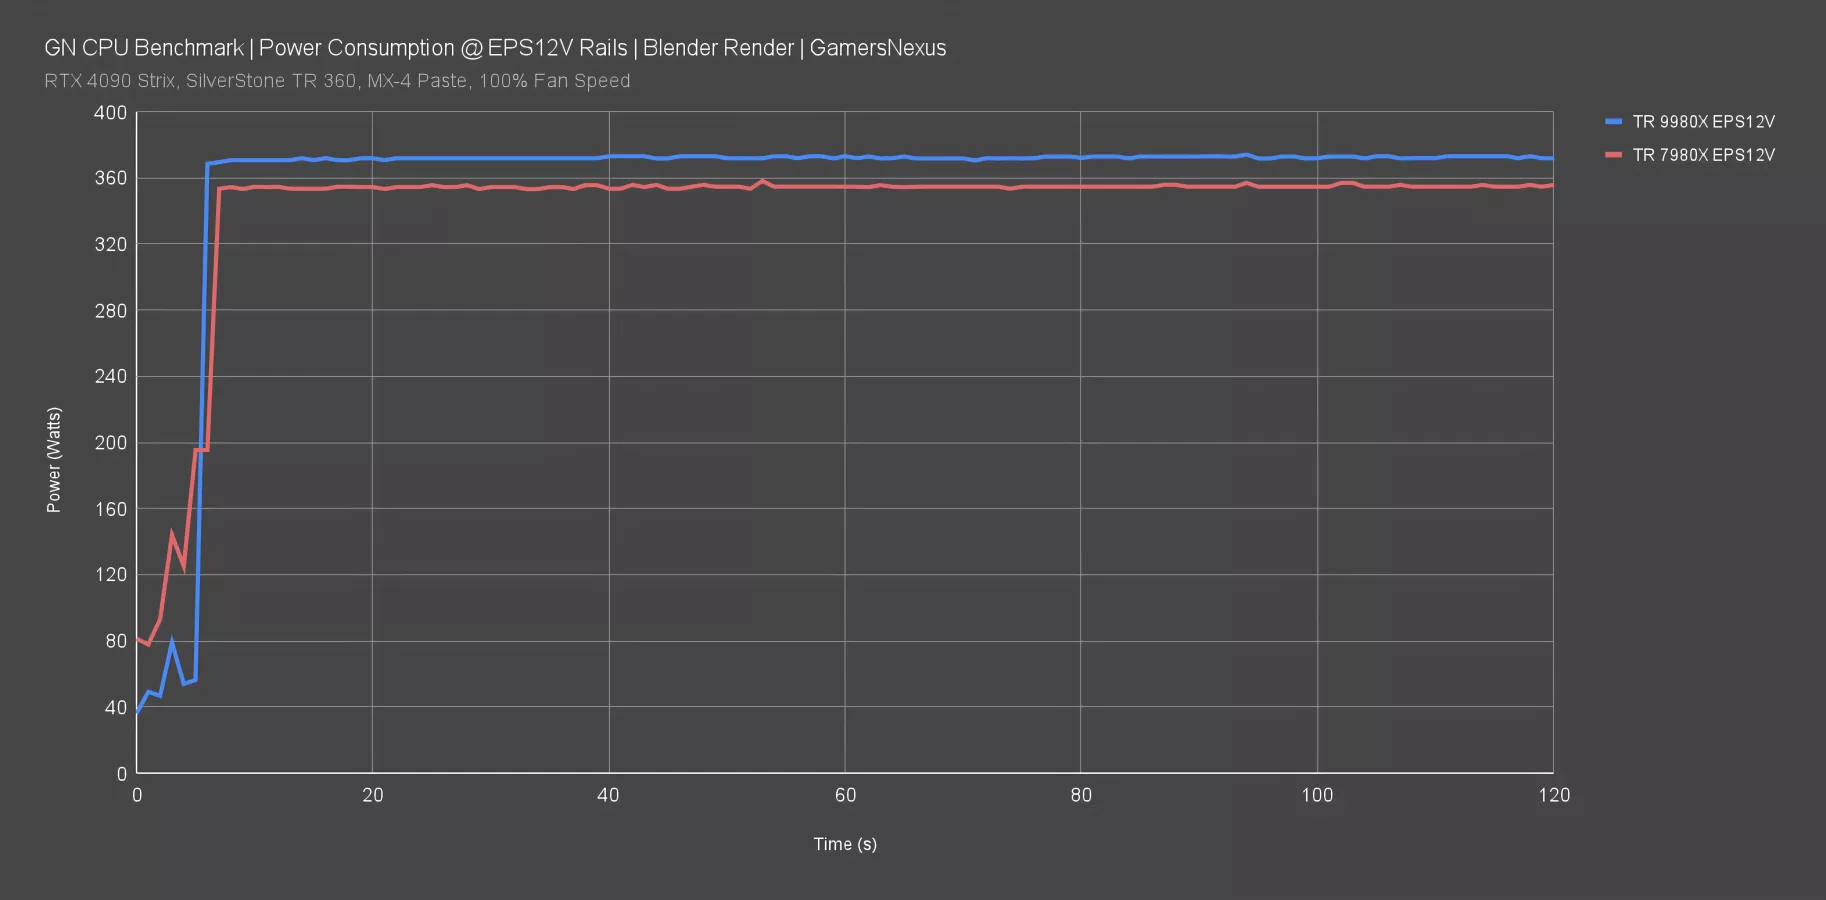
This next chart shows the power consumption as measured at the EPS12V cables with a power interposer between the motherboard and power supply. Tested with an all-core workload in Blender, we observed stable and consistent power draw across both the 7980X and 9980X CPUs, with the 9980X measuring at 371W from 354W on the last-gen Threadripper flagship. That’s a lot of power to cool.
This does not show transients.
9980X Thermals
Thermals - Blender
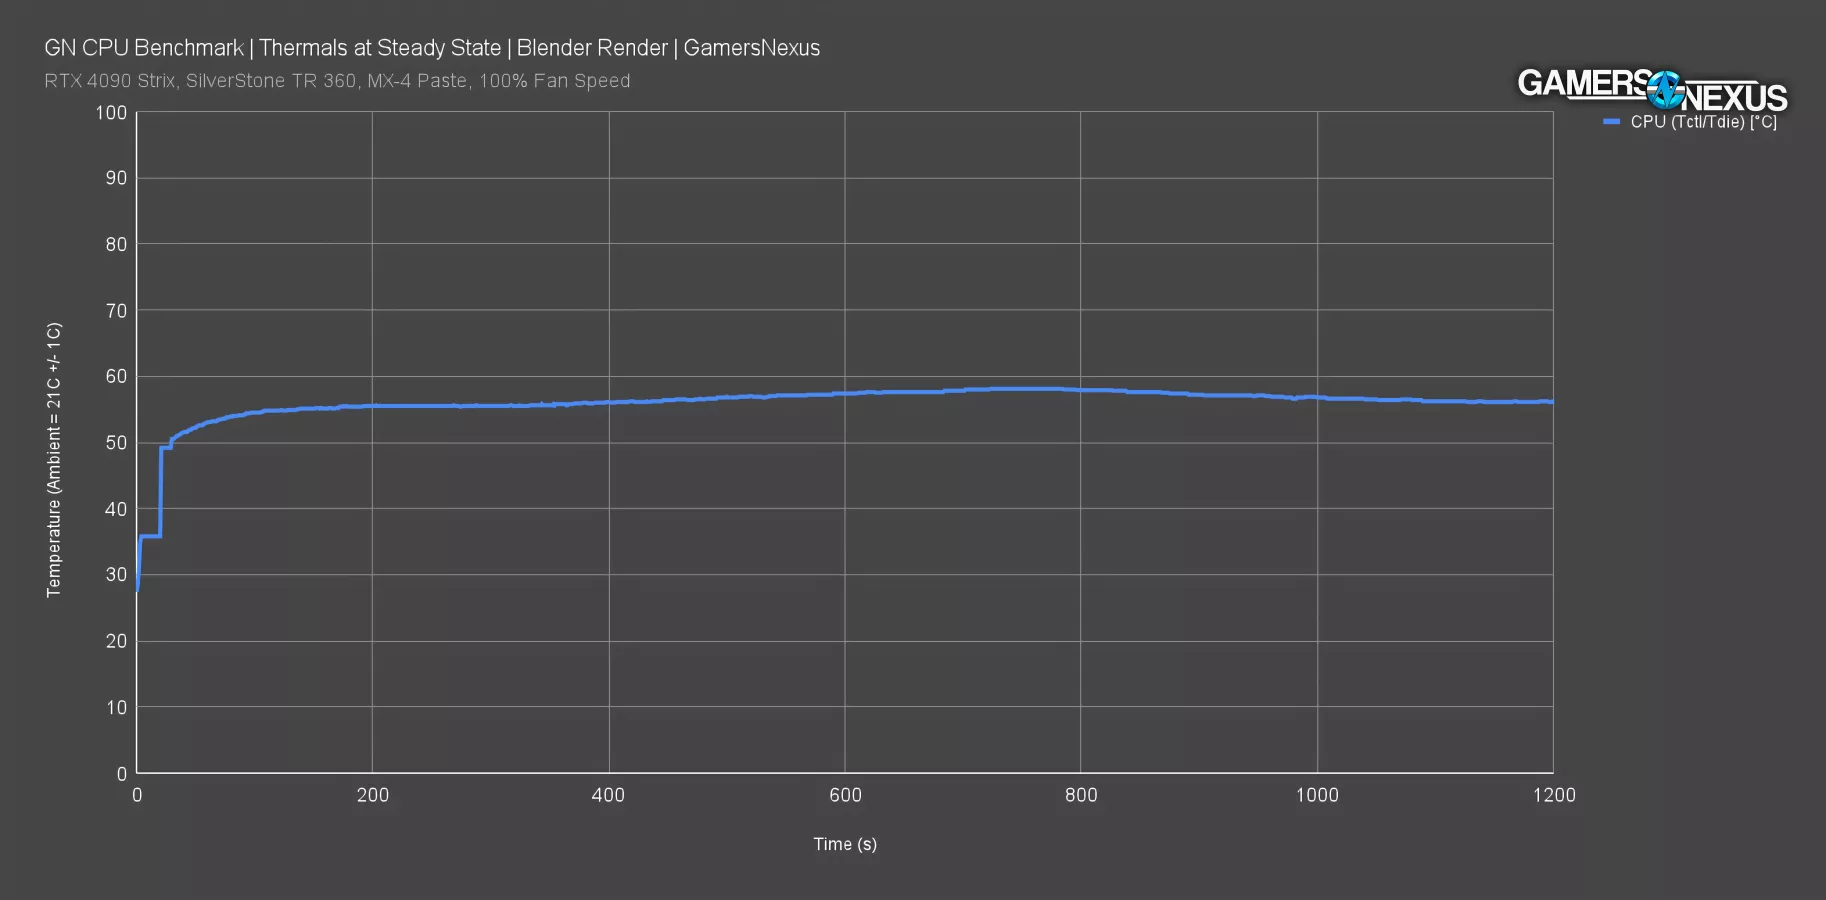
This chart shows the thermal behavior of the 9980X. We’re using a SilverStone 360mm liquid cooler with a Threadripper-sized coldplate for this, so the results are not comparable to our 7980X review thermal results from its launch. Also, as usual, thermal testing would be best done with a lot of coolers compared and noise-normalized, but this is kept simple for the review and to help get an idea (as that’d be a cooler review).
The 9980X under an all-core workload ran at around 58 degrees Celsius when running the relatively loud 100% fan speeds on the 360mm liquid cooler.
Thermals - Equilibrium
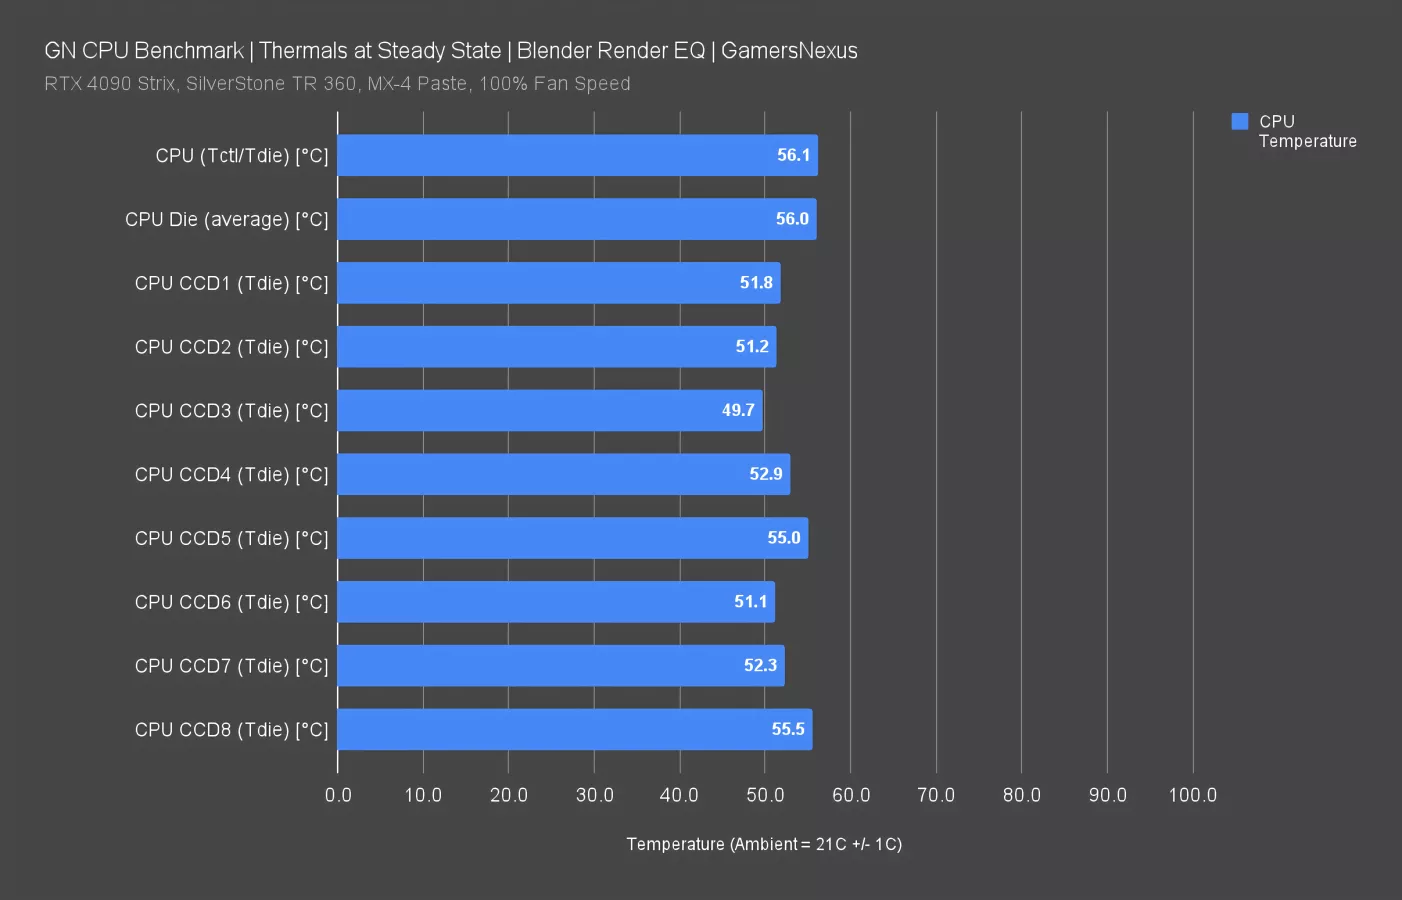
This chart shows thermals at steady state across the various CCDs. The CCD-to-CCD delta here is 6.7 degrees Celsius, at 49.7 to 56.1 degrees in an ambient of 21 degrees Celsius, +/- 1C. Generally speaking, this can be cooled at lower noise levels with 360mm coolers without major issues if assuming a well-ventilated case. The surface area is so huge on this CPU that the power is distributed across a large area, making it easier to cool than a 200W heat load might be on a normal desktop-sized Ryzen CPU with 2 CCDs.
9980X Frequency
Frequency - Blender All-Core
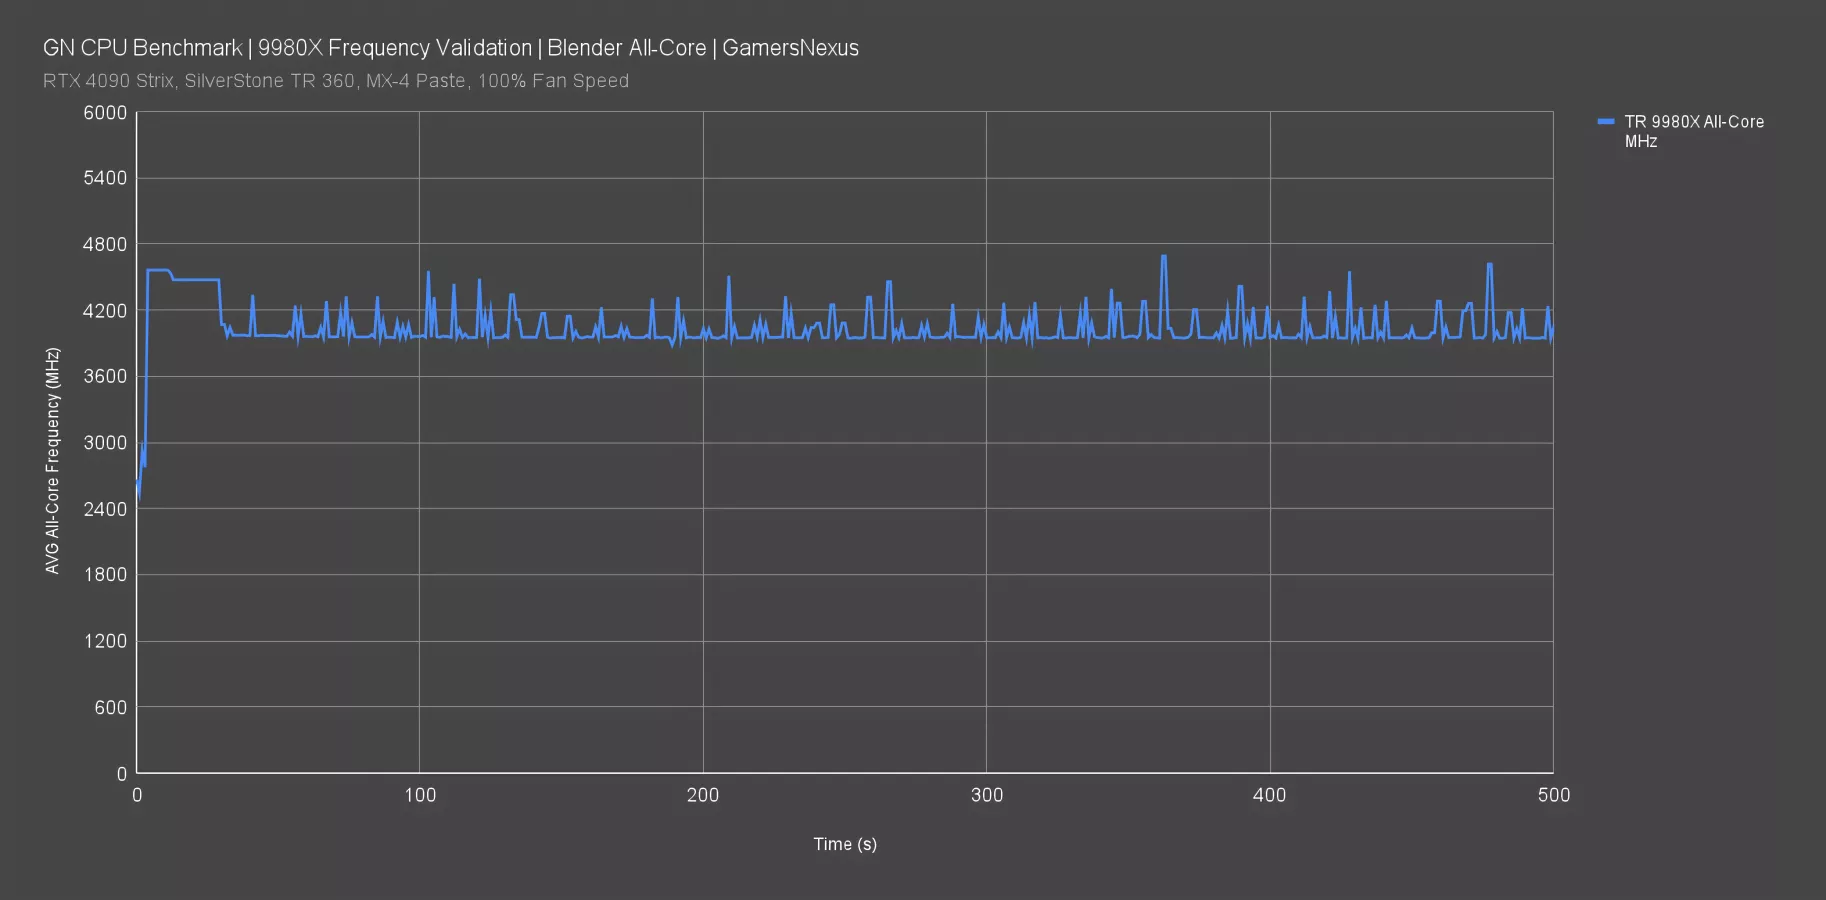
With all cores working, the CPU typically ran at around 3950 MHz, with occasional spikes to 4200 MHz while some threads were bringing in data for new tiles to render. The base clock is 3.2 GHz, so it’s not dropping that low during this particular workload, but it’s also far away from 5.4 GHz. This is typical behavior for all-core workloads.
Frequency - Blender vs 7980X
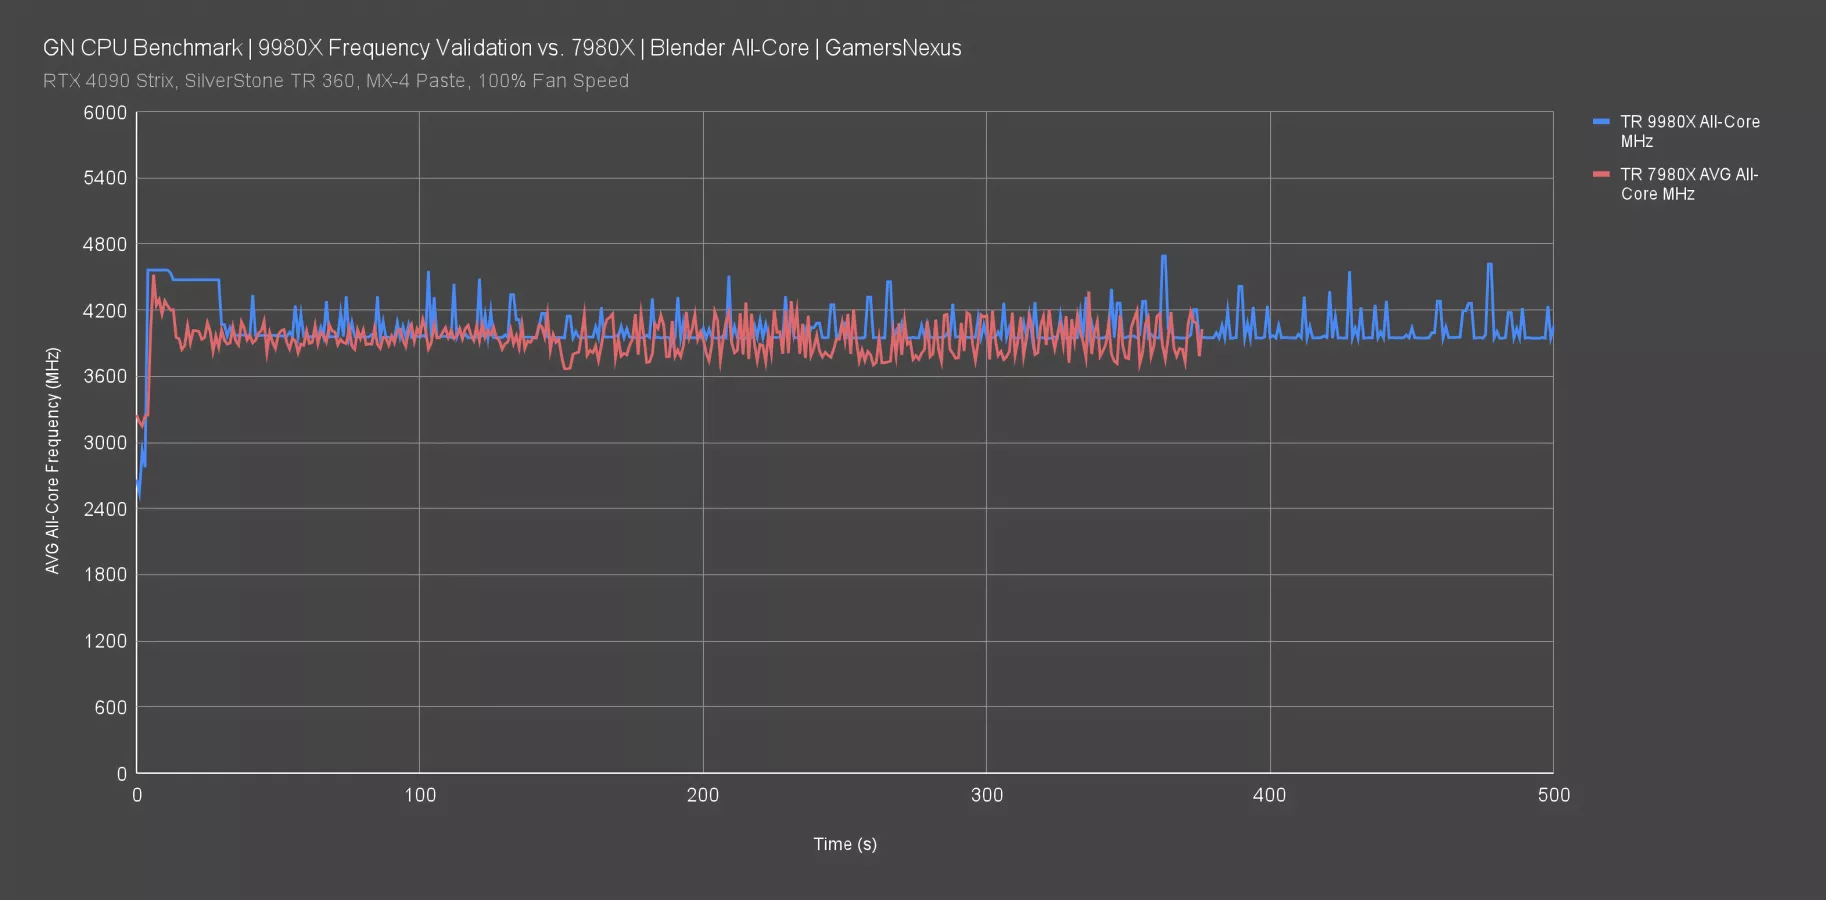
This chart shows the 7980X for the same test. The frequency bottoms-out at around 3.7 GHz, but is all over the place during this workload. The 9980X has improved upon the frequency in all-core scenarios overall.
Frequency - CB Single-Thread
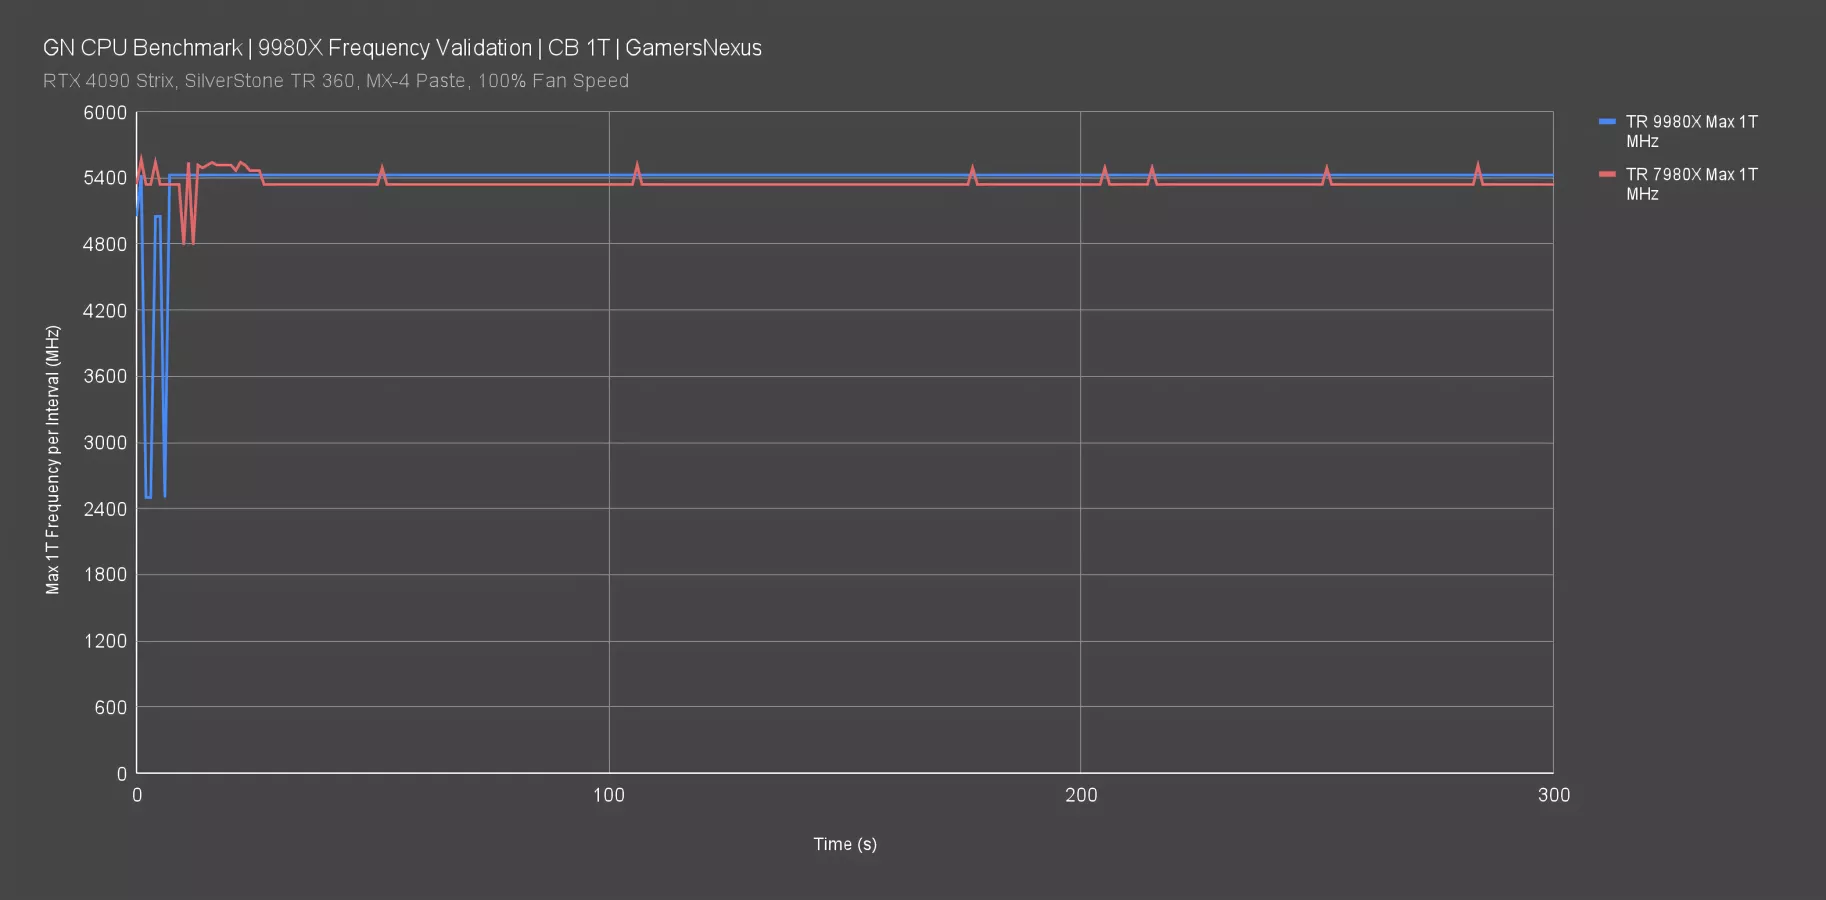
In a single-threaded test with Cinebench, the 9980X ran at 5425 MHz, exceeding the spec listing of 5.4 GHz for boost. This is also expected behavior, with the more limited load boosting higher. The 7980X in the same test ran at about 5340 MHz, so the single-thread frequency has improved generationally -- but not much, and that’s why some benchmarks only show a couple percentage points of change.
9980X Conclusion
On the gaming side, there are sometimes issues with consistency. This means, run-to-run, you don’t get the same experience. There’s far more deviation here in average frame rate and the frametime consistency is worse than traditional desktop parts. This is especially true with 64-core Threadripper CPUs. This is not really unexpected. These high core count CPUs sometimes just have so many cores that it starts causing scheduling problems. Sometimes you’ll also end up in situations where, because the clocks aren’t boosting as high (because of the higher core count), you’re losing that frequency advantage. Again, this is not unexpected. The good news is that the games we tested on the 9980X weren’t broken. They were able to run and weren’t awful experiences, which wasn’t the case with the earliest Threadripper CPUs.
Compared to the 32-core Threadripper, the 64-core part technically runs cooler. That’s because you’re taking the same power and distributing it across more silicon. This means you’re going to get lower temperatures per die per hot spot. That remains true here where the 64-core CPU can be cooler than the 32-core processor.
With its prices, these Threadripper CPUs aren’t something you’re buying for “value.” The target demographic for these processors is probably making money with their computers.
Threadripper also has the benefit of PCIe lane availability for machines with multiple accelerators or a lot of I/O, which are more limited with traditional desktop CPUs.
64 cores don’t always scale well. Sometimes a 32-core CPU can be a better fit. Make sure to do research online for your needs. For example, we found out that a 32-core CPU would work better for us while using Adobe Premiere for video production. So it’s best to research these CPUs with your needs.