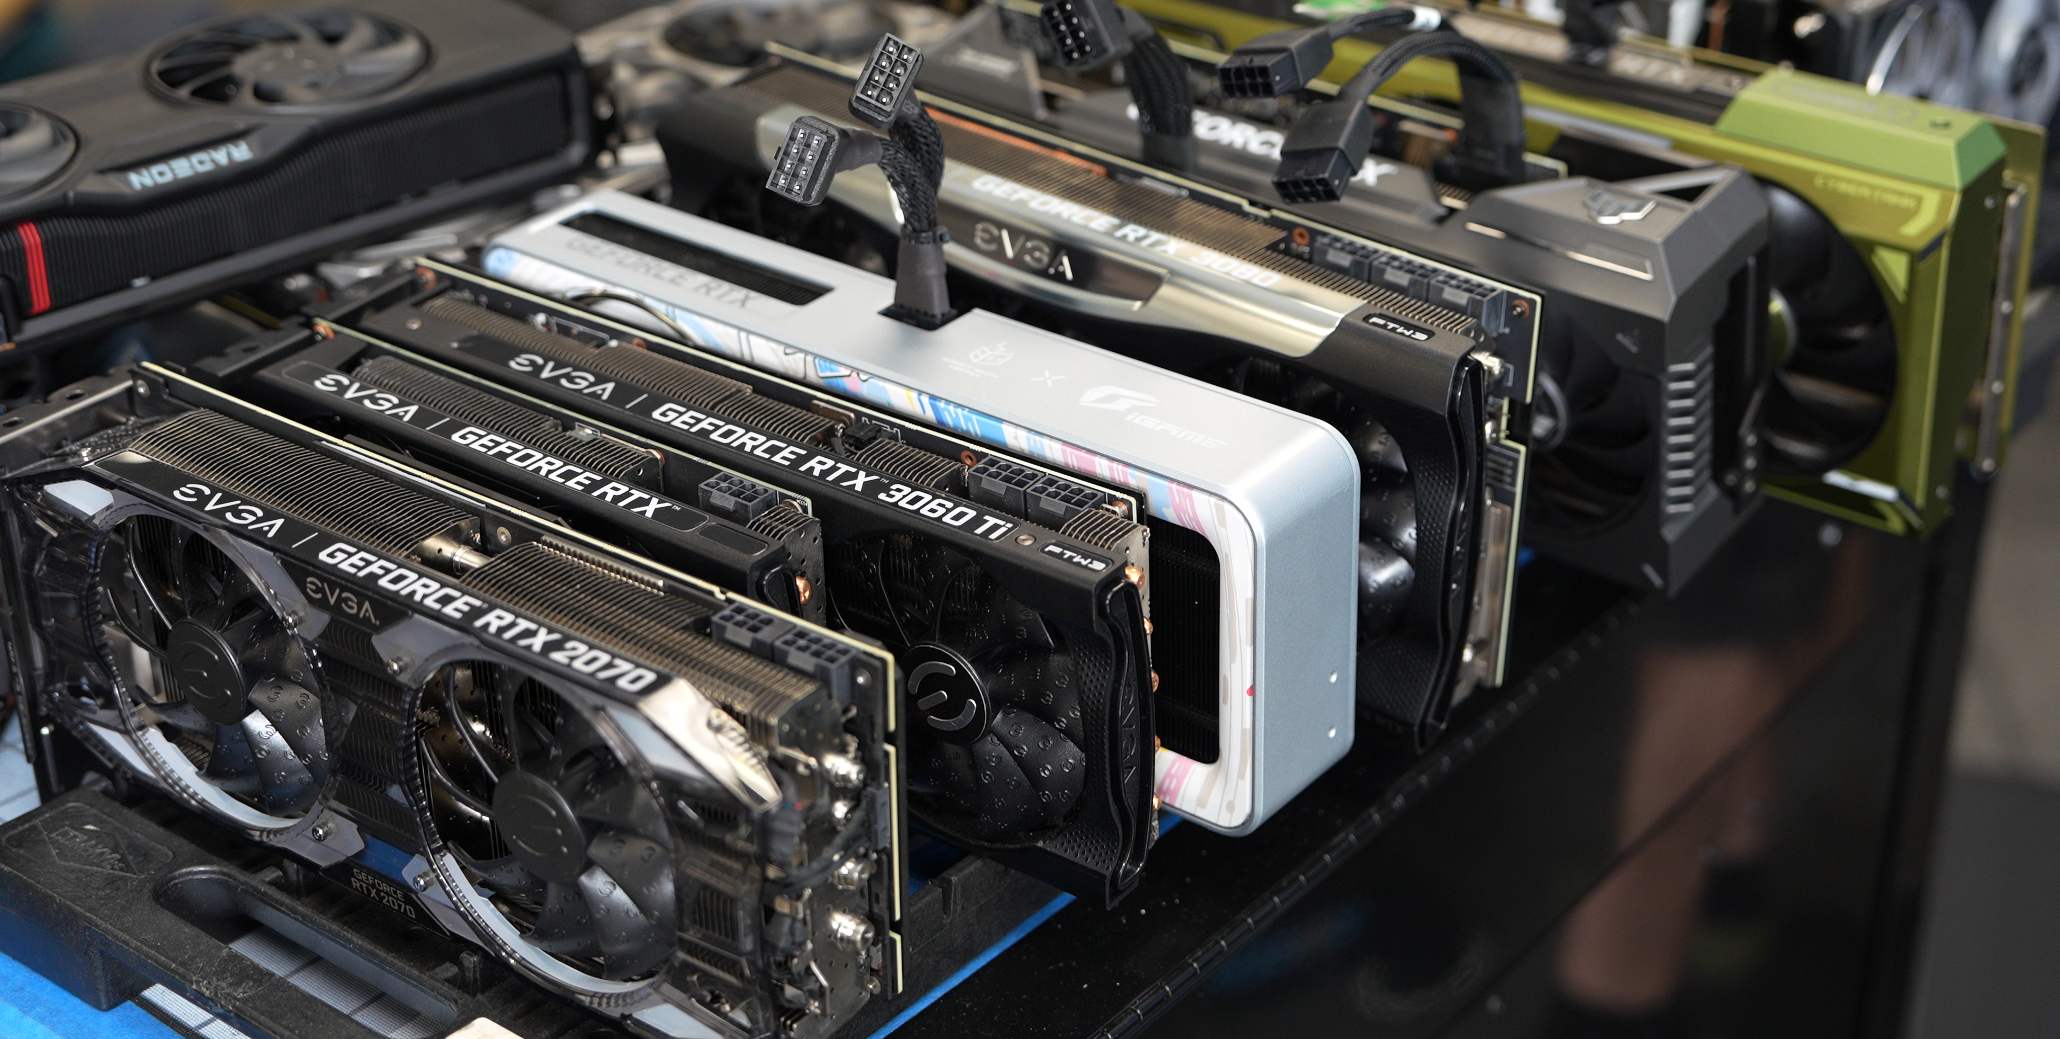
GPU benchmarks included dozens of video cards, represented from the NVIDIA RTX 20 series and AMD RX 5000 series through the RTX 50 and RX 90 series GPUs.
The Highlights
- This is our long-term support dataset of video card gaming performance
- The data is collected, processed, and written-up by people, not "AI," and is vetted by experienced technicians and authors
- The newest data goes to reviews and benchmark videos, while this retains long-term reference data
- This is a part of our Mega Charts series. The Features page includes more of these.
- Please consider supporting this work on Patreon or our GN Store.
Table of Contents
- AutoTOC

This GPU Mega Charts page is a permanent URL that you can reliably visit for updated long-term support benchmark charts featuring GPUs. This data set is maintained as our long-term stable reference data, meaning it is less 'fresh' than reviews but will contain more GPUs. We often run additional benchmarks that go unpublished, sometimes for internal validation against old data (checking for drift or reference material) and sometimes just because we can't justify the time of a full video production; however, we'd still like the data to be out there, so we move to publish that data in our Mega Charts series.
The GPU Mega Charts database spans generations going back to the NVIDIA RTX 20 series and AMD RX 50 series. We have additional data with the GTX 10 series, but that's found in a separate piece here. We may revisit it again for this page at some point.
Other Mega Charts pages include:
- Mega Charts: Computer Cases
- Mega Charts: CPUs
- Mega Charts: CPU Power Consumption
- Mega Charts: CPU Coolers
This data is provided for free and without third-party ads, despite evidence that our website and videos are being scraped by Large Language Models ("AI") constantly and piped back into systems that pay us nothing. We produce these benchmarks internally, analyze them, and write them fully by people, without any LLM use in this testing or writing process. We are able to continue funding our team and equipment without AI slop, without third-party ads in articles, and without paywalls because of your support on Patreon and on our GN Store. This effort is subsidized by our deep-dive content and our supporters. If you want to continue to see this exist and this effort in maintaining single pages with chart dumps, like the Internet used to be, consider buying one of our:
- Wireframe V2 Mouse Mats with a 3D mesh 'city skyline' of PC parts, designed exclusively by our team and artist
- Project & Soldering Mats with high-heat capable silicone, multiple vibrant colors, and molded-in tool holders and spool holders. Great for painting and crafting as well as soldering
- Retro I/O 3D Coaster Packs for your drinks, featuring our team's artwork of retro computer components and cases as soft, 3D coasters
- Large PC Building Anti-Static Modmat from our product line that we've been selling for over 8 years now
For more detailed discussion of NVIDIA vs. AMD vs. Intel GPU choices, you'll want to check individual reviews. This serves less as analysis and more as just raw data.
Credits
Test Lead, Host, Writing
Steve Burke
Testing
Patrick Lathan
Mike Gaglione
Mega Charts for GPUs
This data includes our 2025-TBD test bench for video card reviews and benchmarks, which features a 9800X3D. You can read about some test processes here (although this page also has a pending update).
Mega Charts are updated infrequently and serve as a long-term data dump of GPU results. Our most recent GPU benchmarks, game benchmarks, or GPU reviews and revisits will have the most recent ("Active") data set, whereas this will contain the long-term data.
How to Use This
Data maintains relevance even as it ages, but obviously there are some caveats as to how it's used. Older GPUs in particular tend to (mostly) stop receiving performance-changing updates, and so become somewhat stable with time. One critical exception is that game updates post-launch can add better support for older devices, but even still, we tend to capture that within the first few patches and then rarely see further improvement. That makes older products even more stable (in most cases) due to stagnated driver development and lower focus from game developers, but doesn't solve the fact that driver updates and game updates can still frequently impact new GPU performance. Of course, old as well, just less frequently. Windows patches are also an ongoing challenge: Major Windows updates get full suite retesting in our benchmark process, but are less relevant if locking a Windows version for a set of data and sticking on it (which is what you're seeing in these charts).
It's a balance between long-term support charts and active charts, with the active charts being more involved in maintenance and updates for games, drivers, and Windows. We've chosen to split our charts between these two data sets after being inspired by Linux OS branching years ago, which has enabled us to still provide quantity of data via LTS charts and recency of data via Active charts. That's the best compromise we can strike as a small team. The Active charts receive more frequently re-runs.
As of 2026, all data is considered "Active," meaning it is still recent. If you're reading this in 2027, then this data has likely reached "Long-Term Support" status.
Is Your GPU Missing From This Data? Here's What to Do
There are obviously a lot of GPUs. We do our best to run as many as we can, but can't run them all. The best bet to approximate positioning (other than just checking other reviews) would be to think through the data that is present and deduce the placement. This is a pretty simple approach that can get "good enough" approximations for someone just trying to figure out how big of an upgrade some other GPU would be. This process can be applied to anyone's charts.
For examples of how to approximate data and position on charts for an absent device, see our CPU Mega Charts page. That will walk you through a few methods for doing so with good accuracy.
DISCLAIMER: Data Accuracy Standards & Reduced Vetting Practices
Standalone reviews with full video production standards and expenses involve extensive quality control processes that take several days. These are time- and cost-intensive and maintain accuracy of our mainline reviews, where we never skip steps for production.
But, the reality of publishing more data that we collect outside of the mainline reviews process (in the hopes of helping people with purchasing decisions, but at no meaningful profit driver since this is free of third-party ads) is that we can't do that full process for every single data point in long-term support charts with bonus data. We don't like publishing "extra" data in mainline reviews since it lacks the same intensive validation steps, so anything not fully vetted gets withheld. Sometimes, we never find the time to go back and thoroughly vet the "extra" or "bonus" data, leading to it never being seen.
To try and reach a balance that would still benefit a lot of people knowing where some 'random' device, like the RX 7650, lands on the charts, we publish that data here with a slimmed-down QC process to at least get it out there. It's still quality controlled and checked, but not by as many people. Typically, our data validation process involves checks by at least 3 (and sometimes 4) people separately, with two Editor-in-Chief passes over that data at the start and end, including hand calculations to ensure it all lines-up with previous expectations (e.g. GPU A vs. GPU B expected performance gaps).
If you want to fully understand the differences in our QC process for data between Mega Charts and mainline reviews, you can read about our full chart vetting process in our CPU Mega Charts page.
TLDR: We need to enable our small team to continue working on important mainline reviews and deep-dive reports without skipping upcoming projects, but we still want to try and help provide the additional data people request (with reduced focus and removed from mainline review data). There's also a large cost component to this these days, as in-depth reviews are challenging to pay for in such an anti-consumer climate for PC DIY. Fortunately, we subsidize this work with our investigations and deep dives, and so can provide it as a service even when at a loss. Data which exists on Long-Term Support Mega Charts but not on Active Charts should be understood as being more likely to have data confidence issues or deviation from expectations; however, this is still unlikely overall due to our rigorous methods, but more likely than active mainline review charts. We just want to be transparent about that.
If you see anything that looks out of order, you are welcome to email us at team at gamersnexus dot net.
Find our vetting processes here.
Games Present
We test more games than present in this data set for our reviews, but these are our results that we view as more stable or reliable.
| Game | Year Released | Settings |
| Crimson Desert | 2026 | High, Cinematic, Ultra |
| The Outer Worlds 2 | 2025 | Very High/SoftwareRT |
| The Elder Scrolls IV: Oblivion Remastered | 2025 | Ultra Raster/Low SoftwareRT |
| Kingdom Come: Deliverance II | 2025 | Ultra |
| FFXIV Dawntrail (Final Fantasy 14) | 2024 | Maximum |
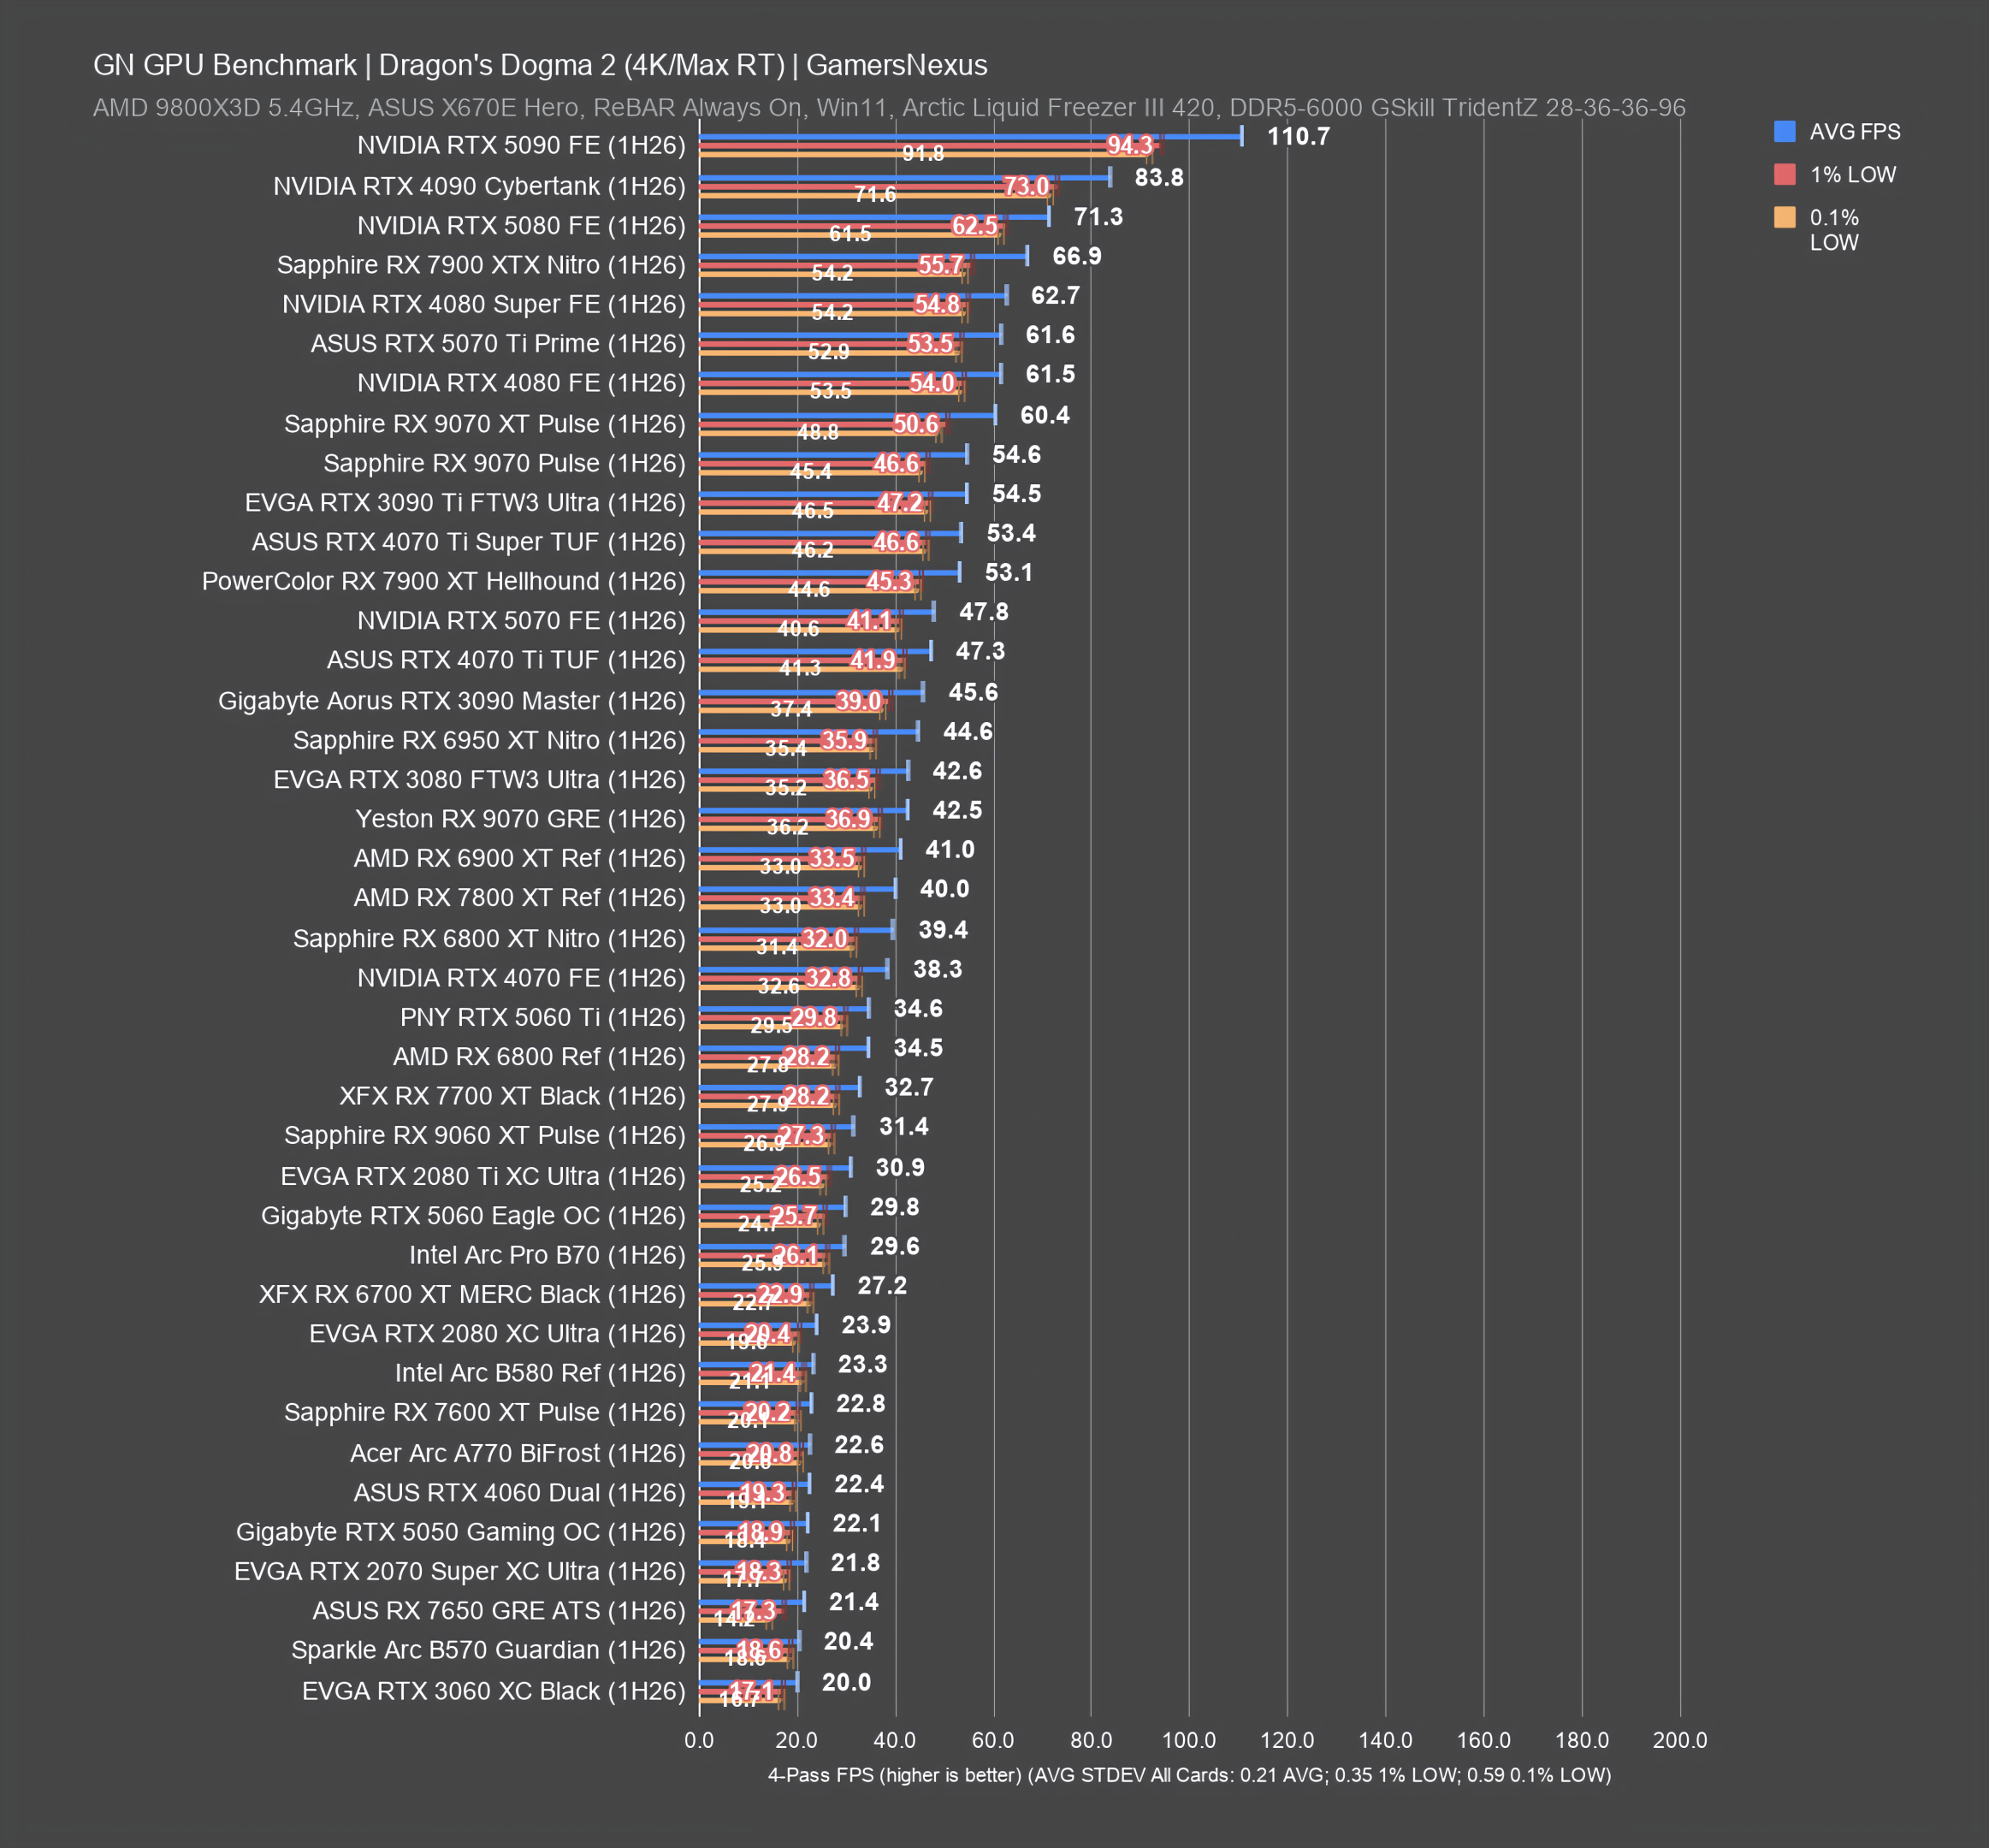
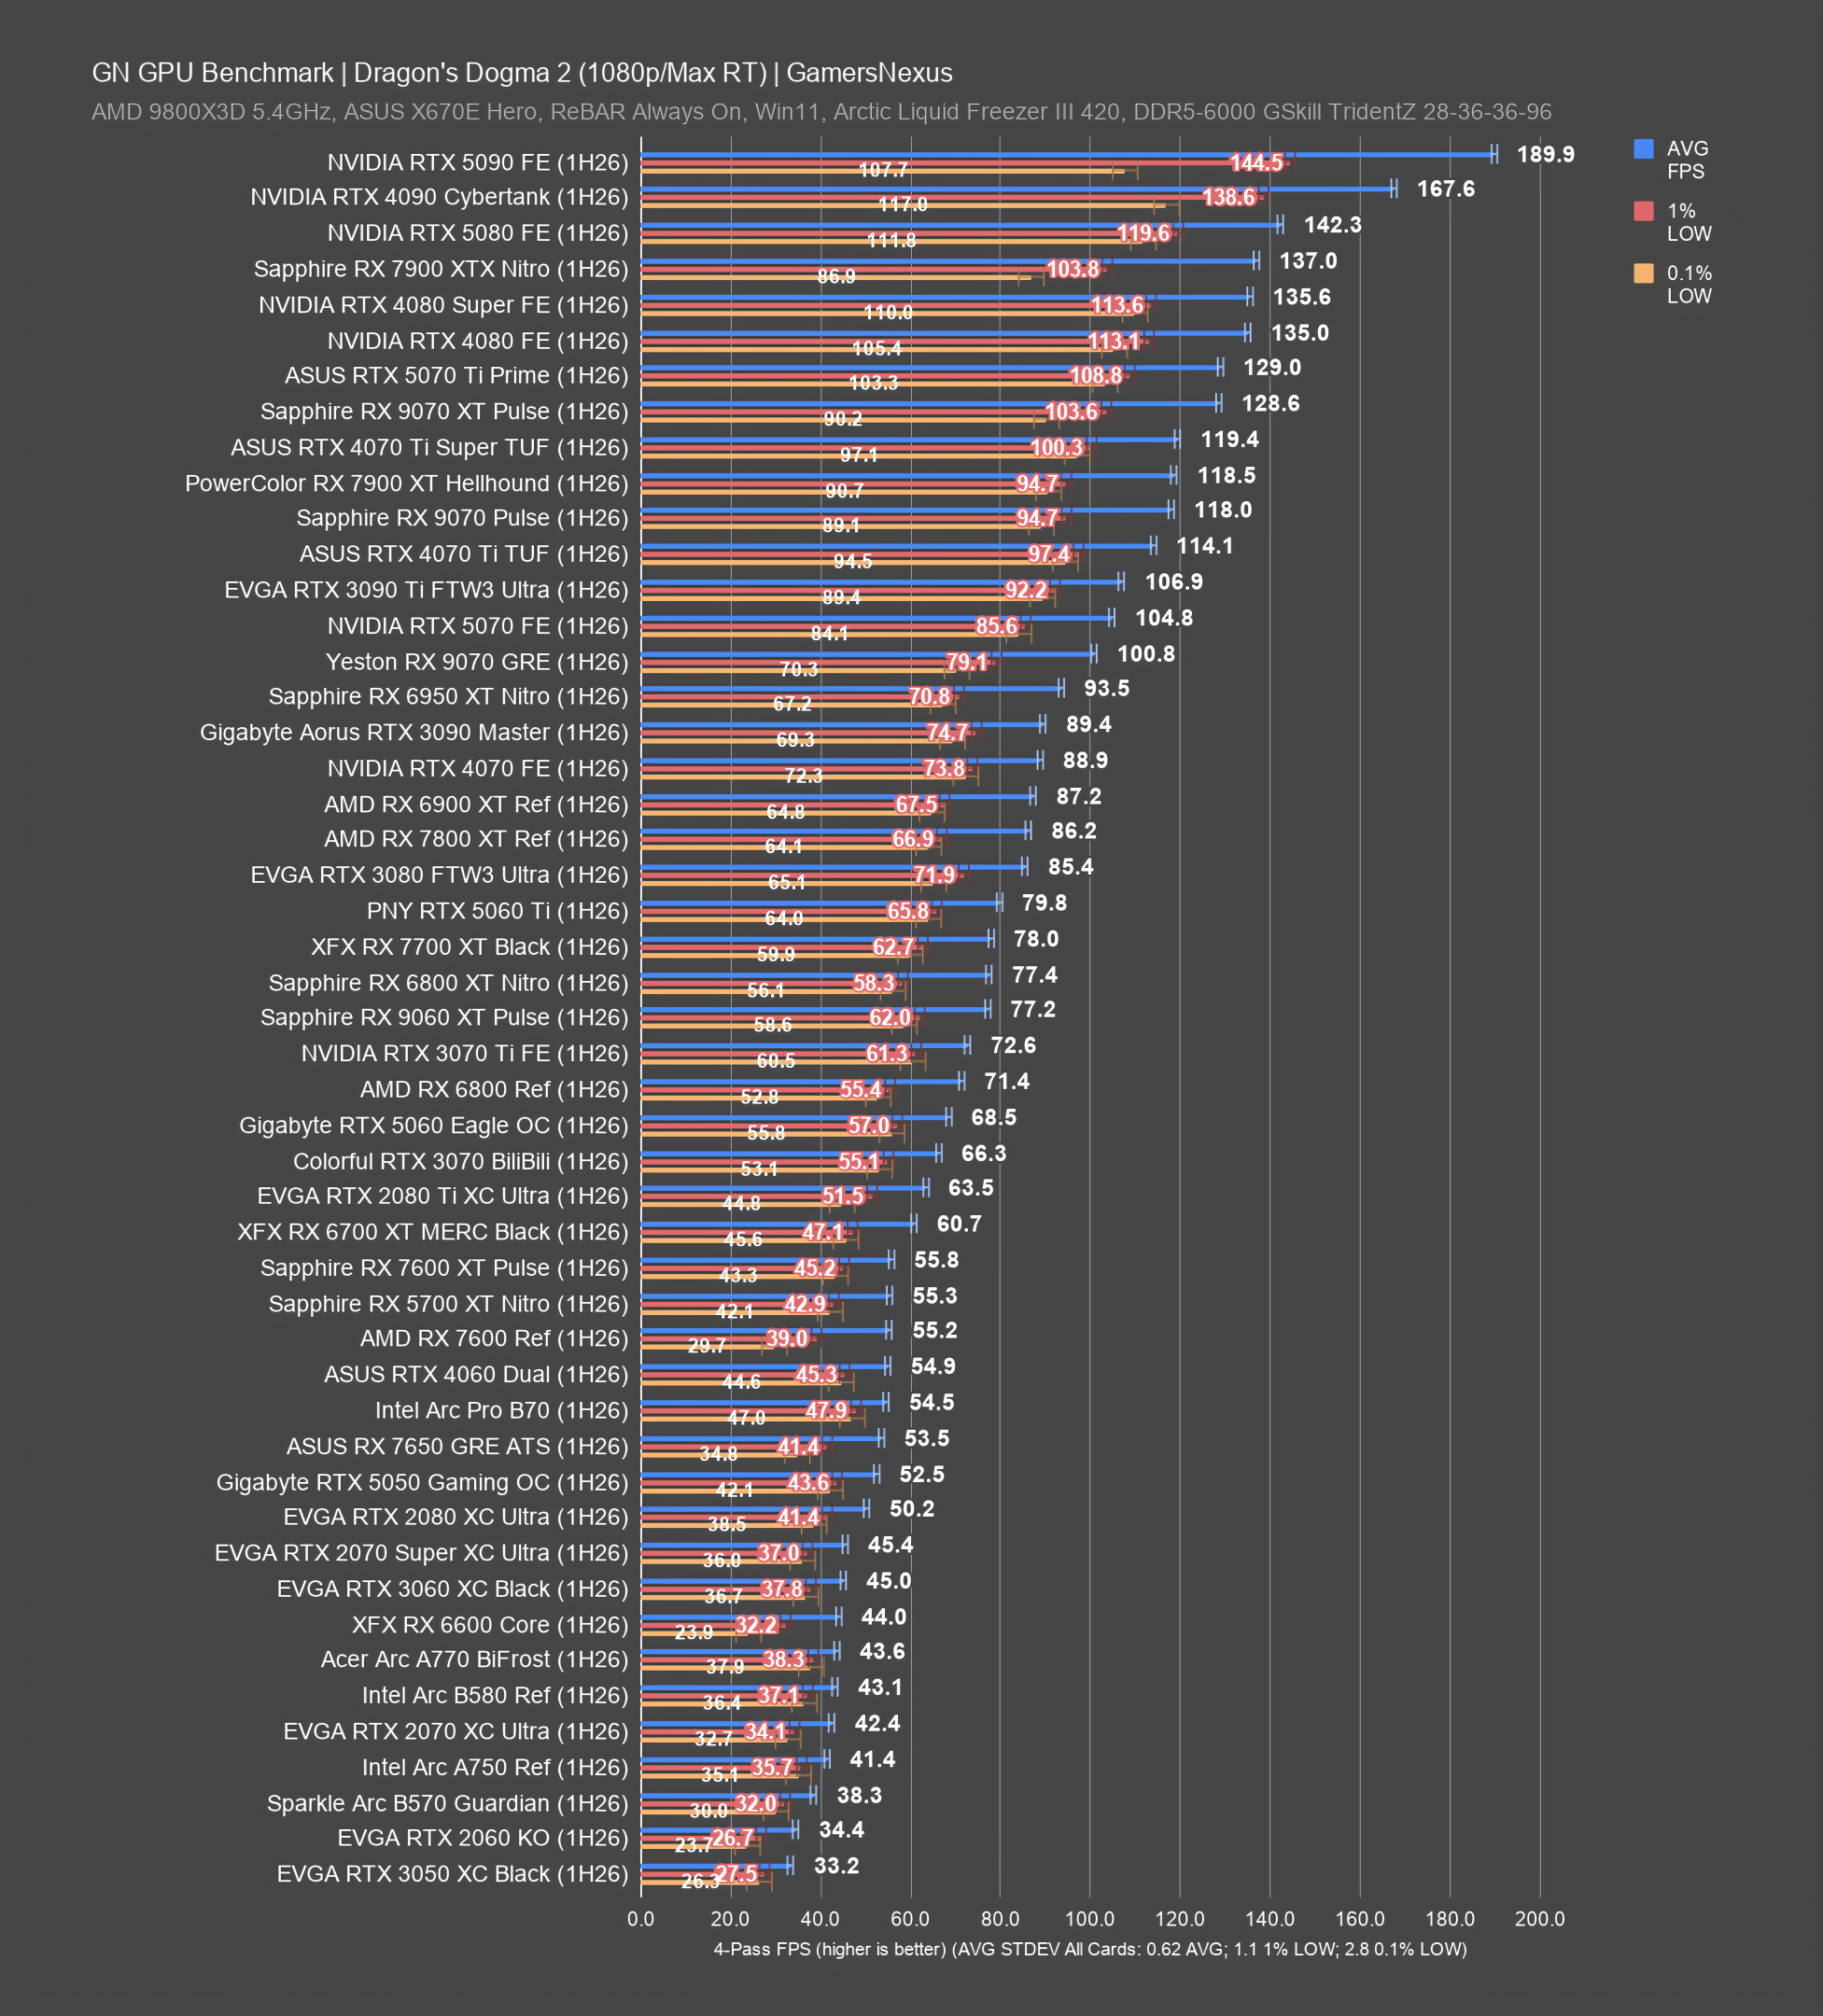
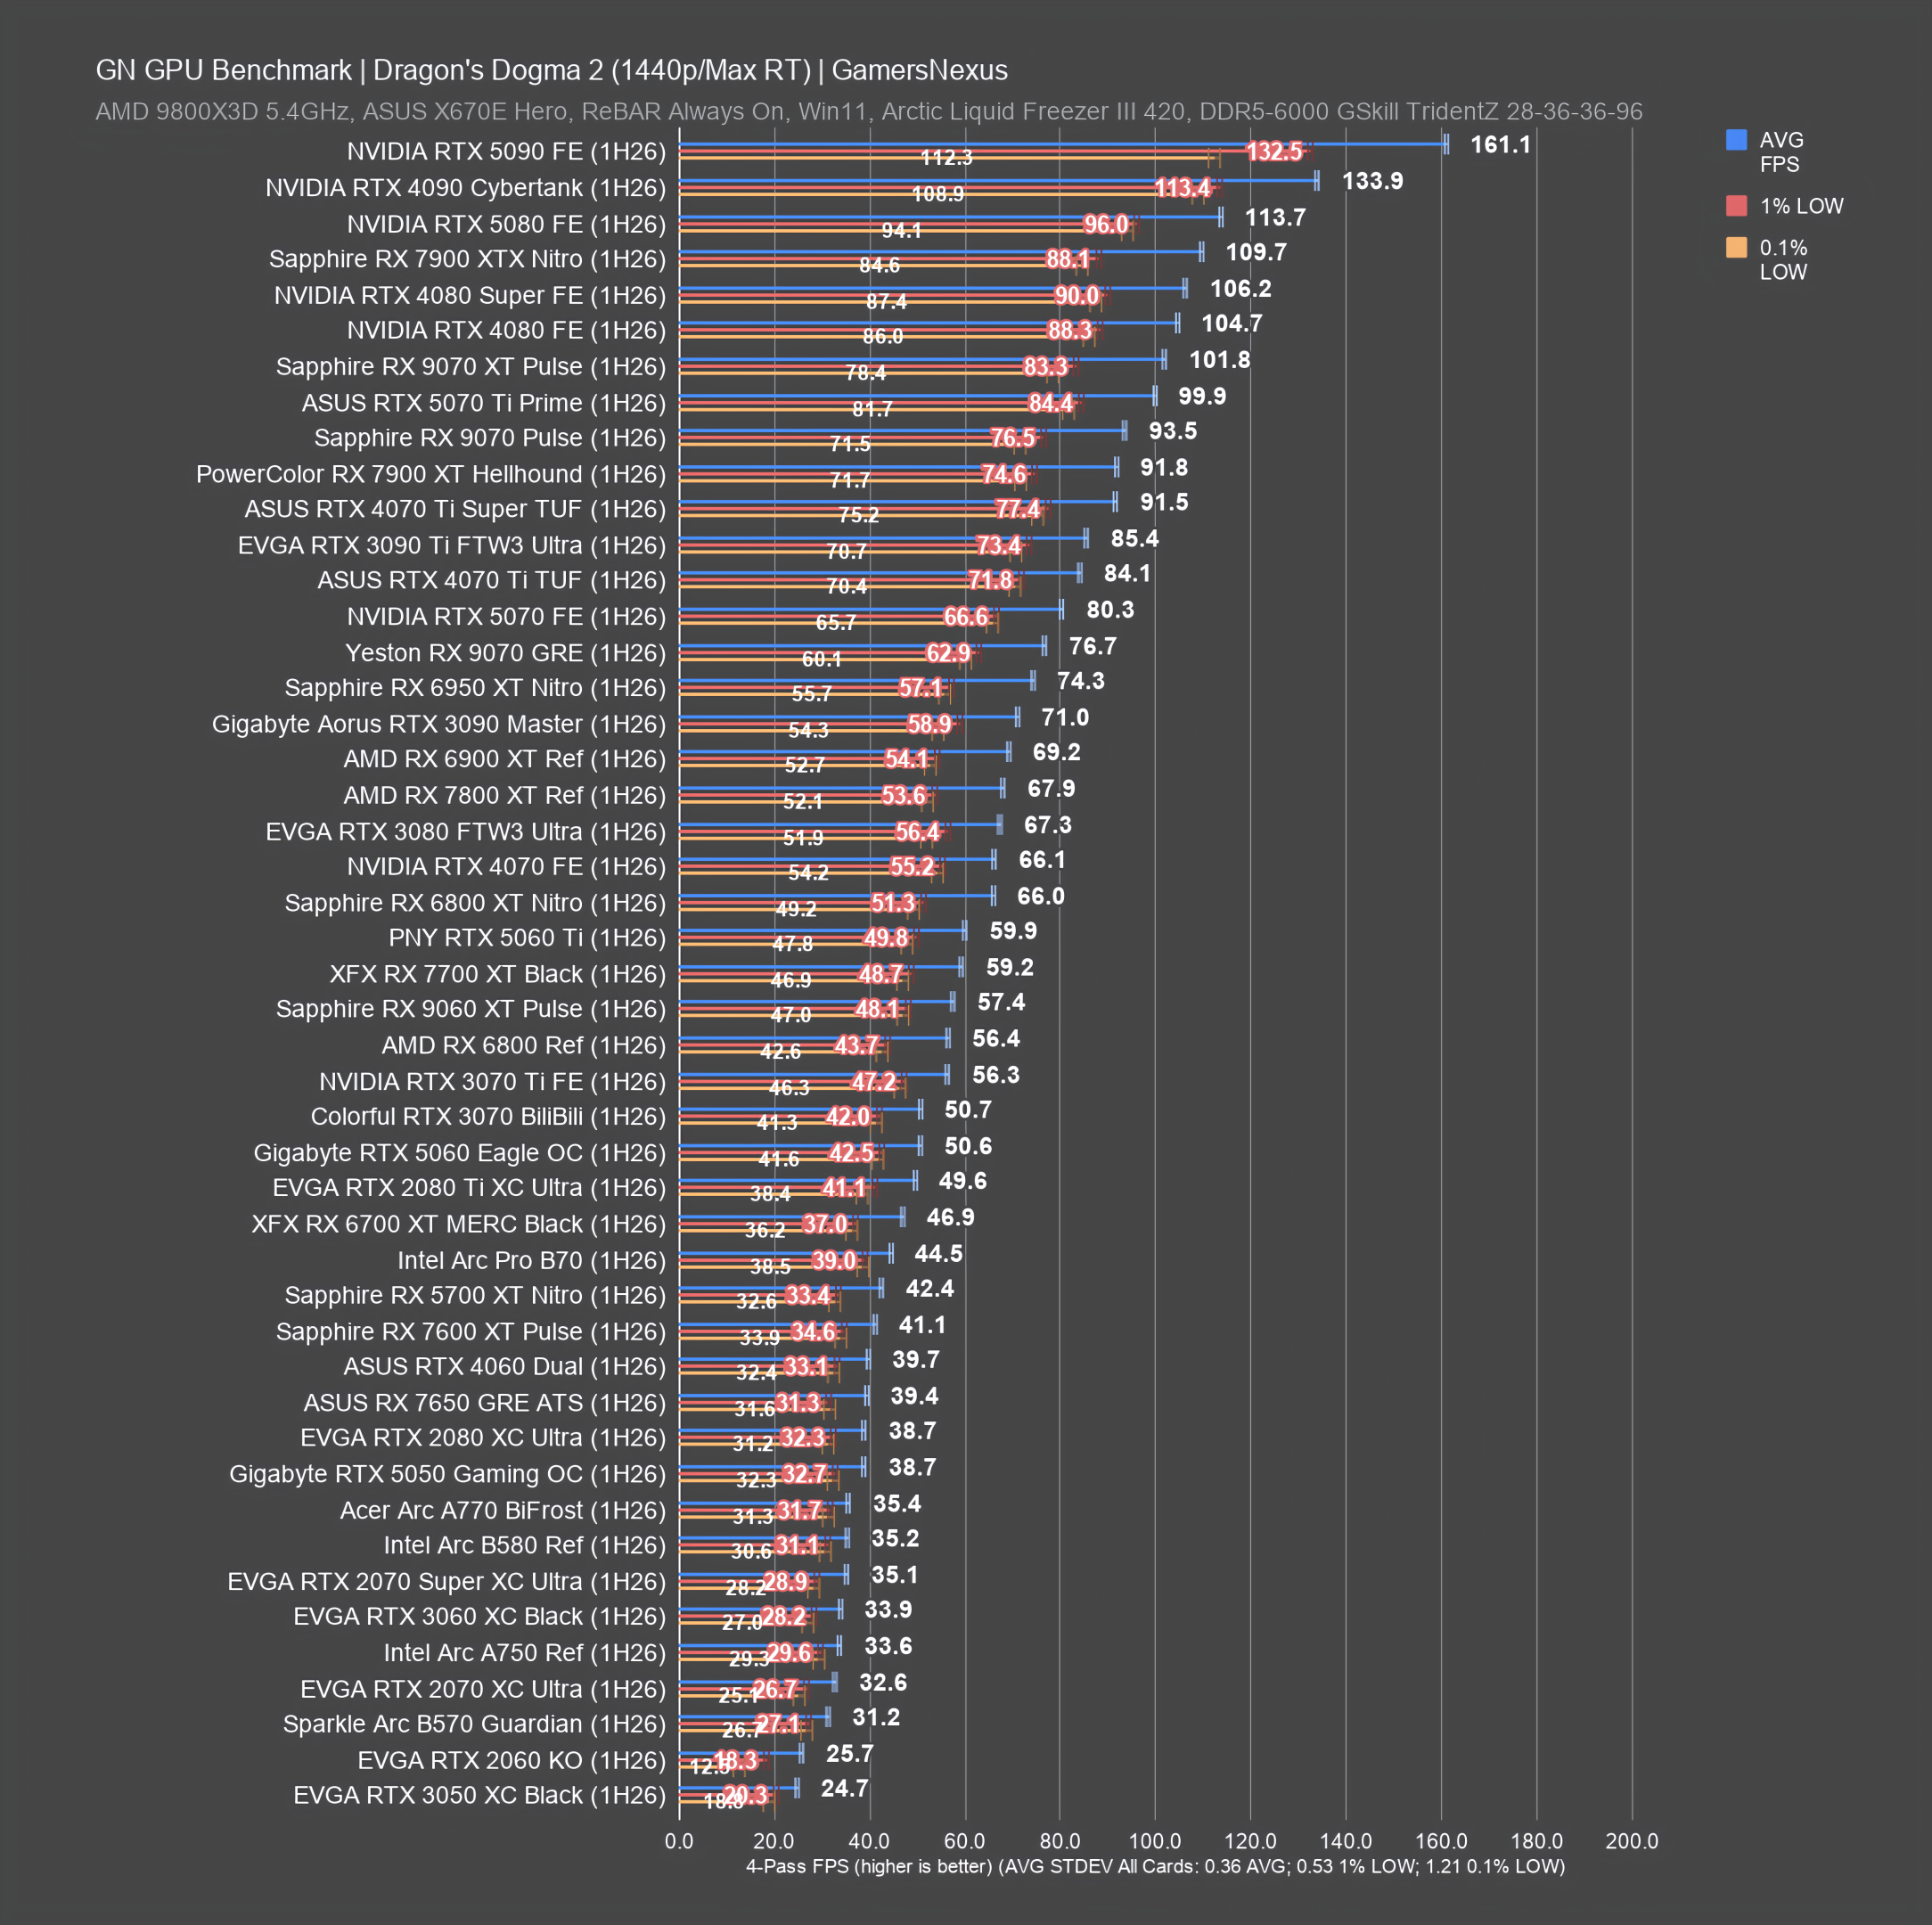
| Dragon's Dogma 2 | 2024 | Raster: Maximum RT: Max RT |
| Black Myth: WuKong | 2024 | Raster: High RT: High Raster, Medium RT, FSR Quality |
| Starfield | 2023 | Ultra |
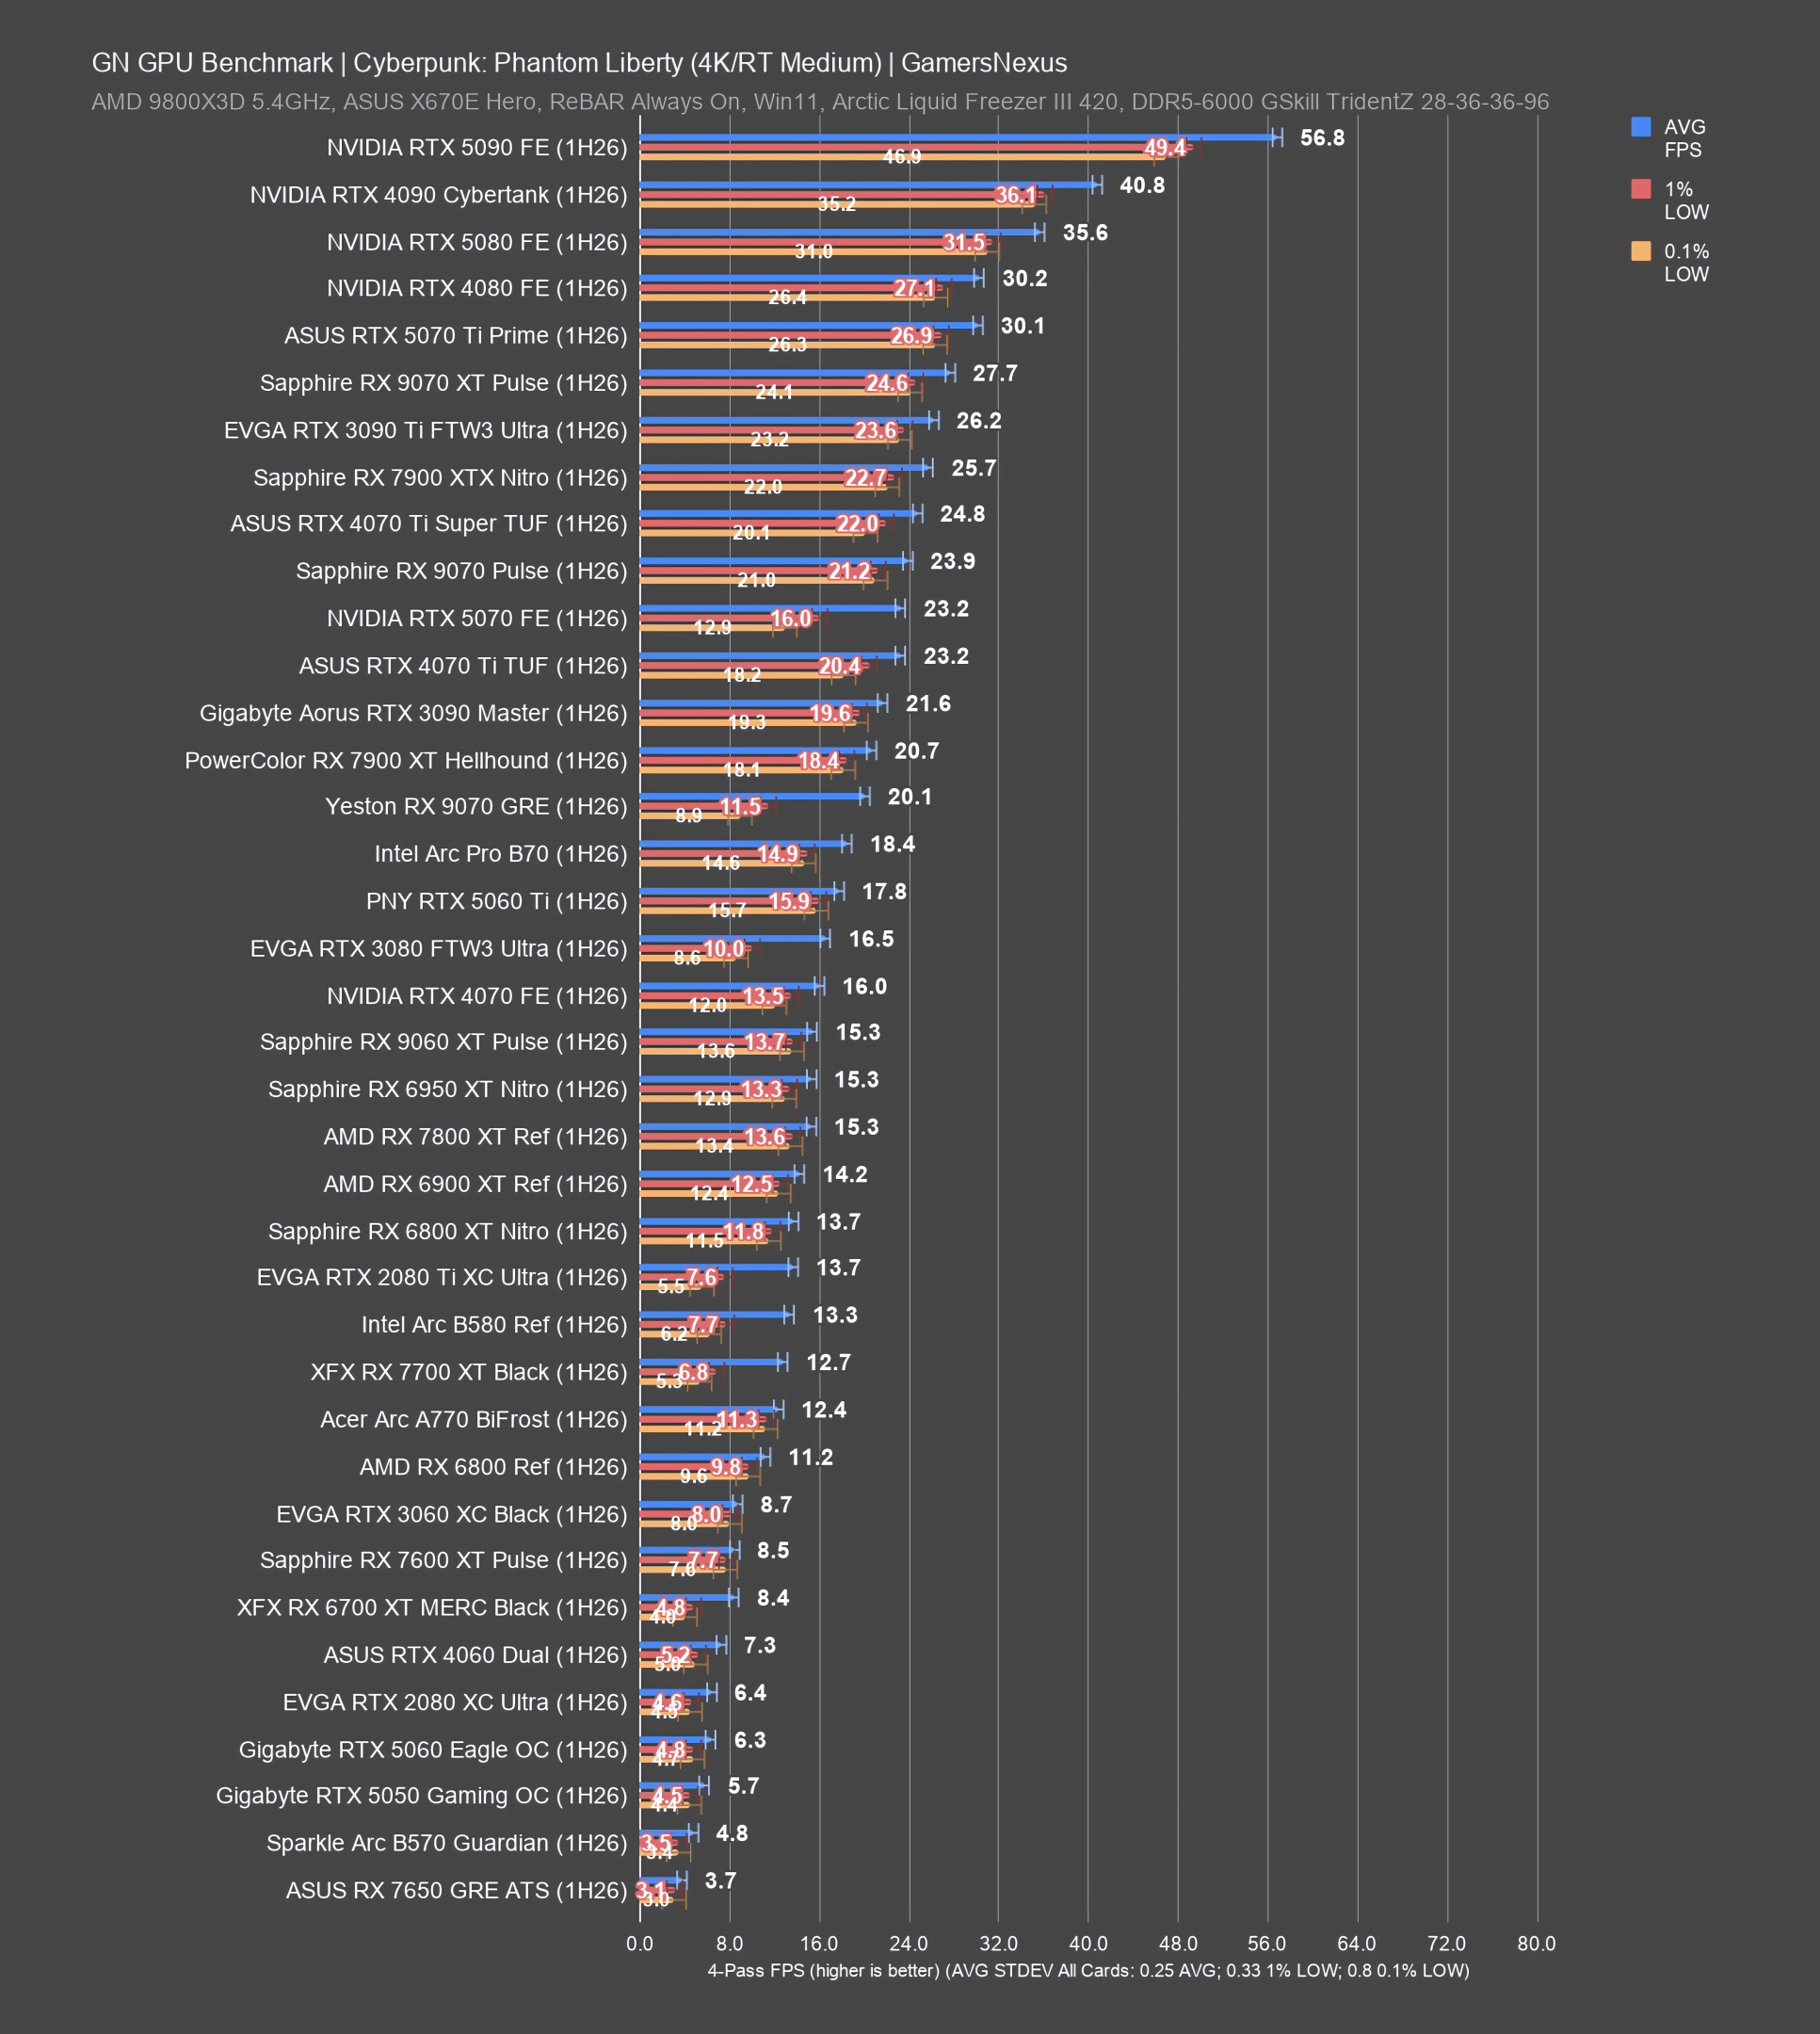
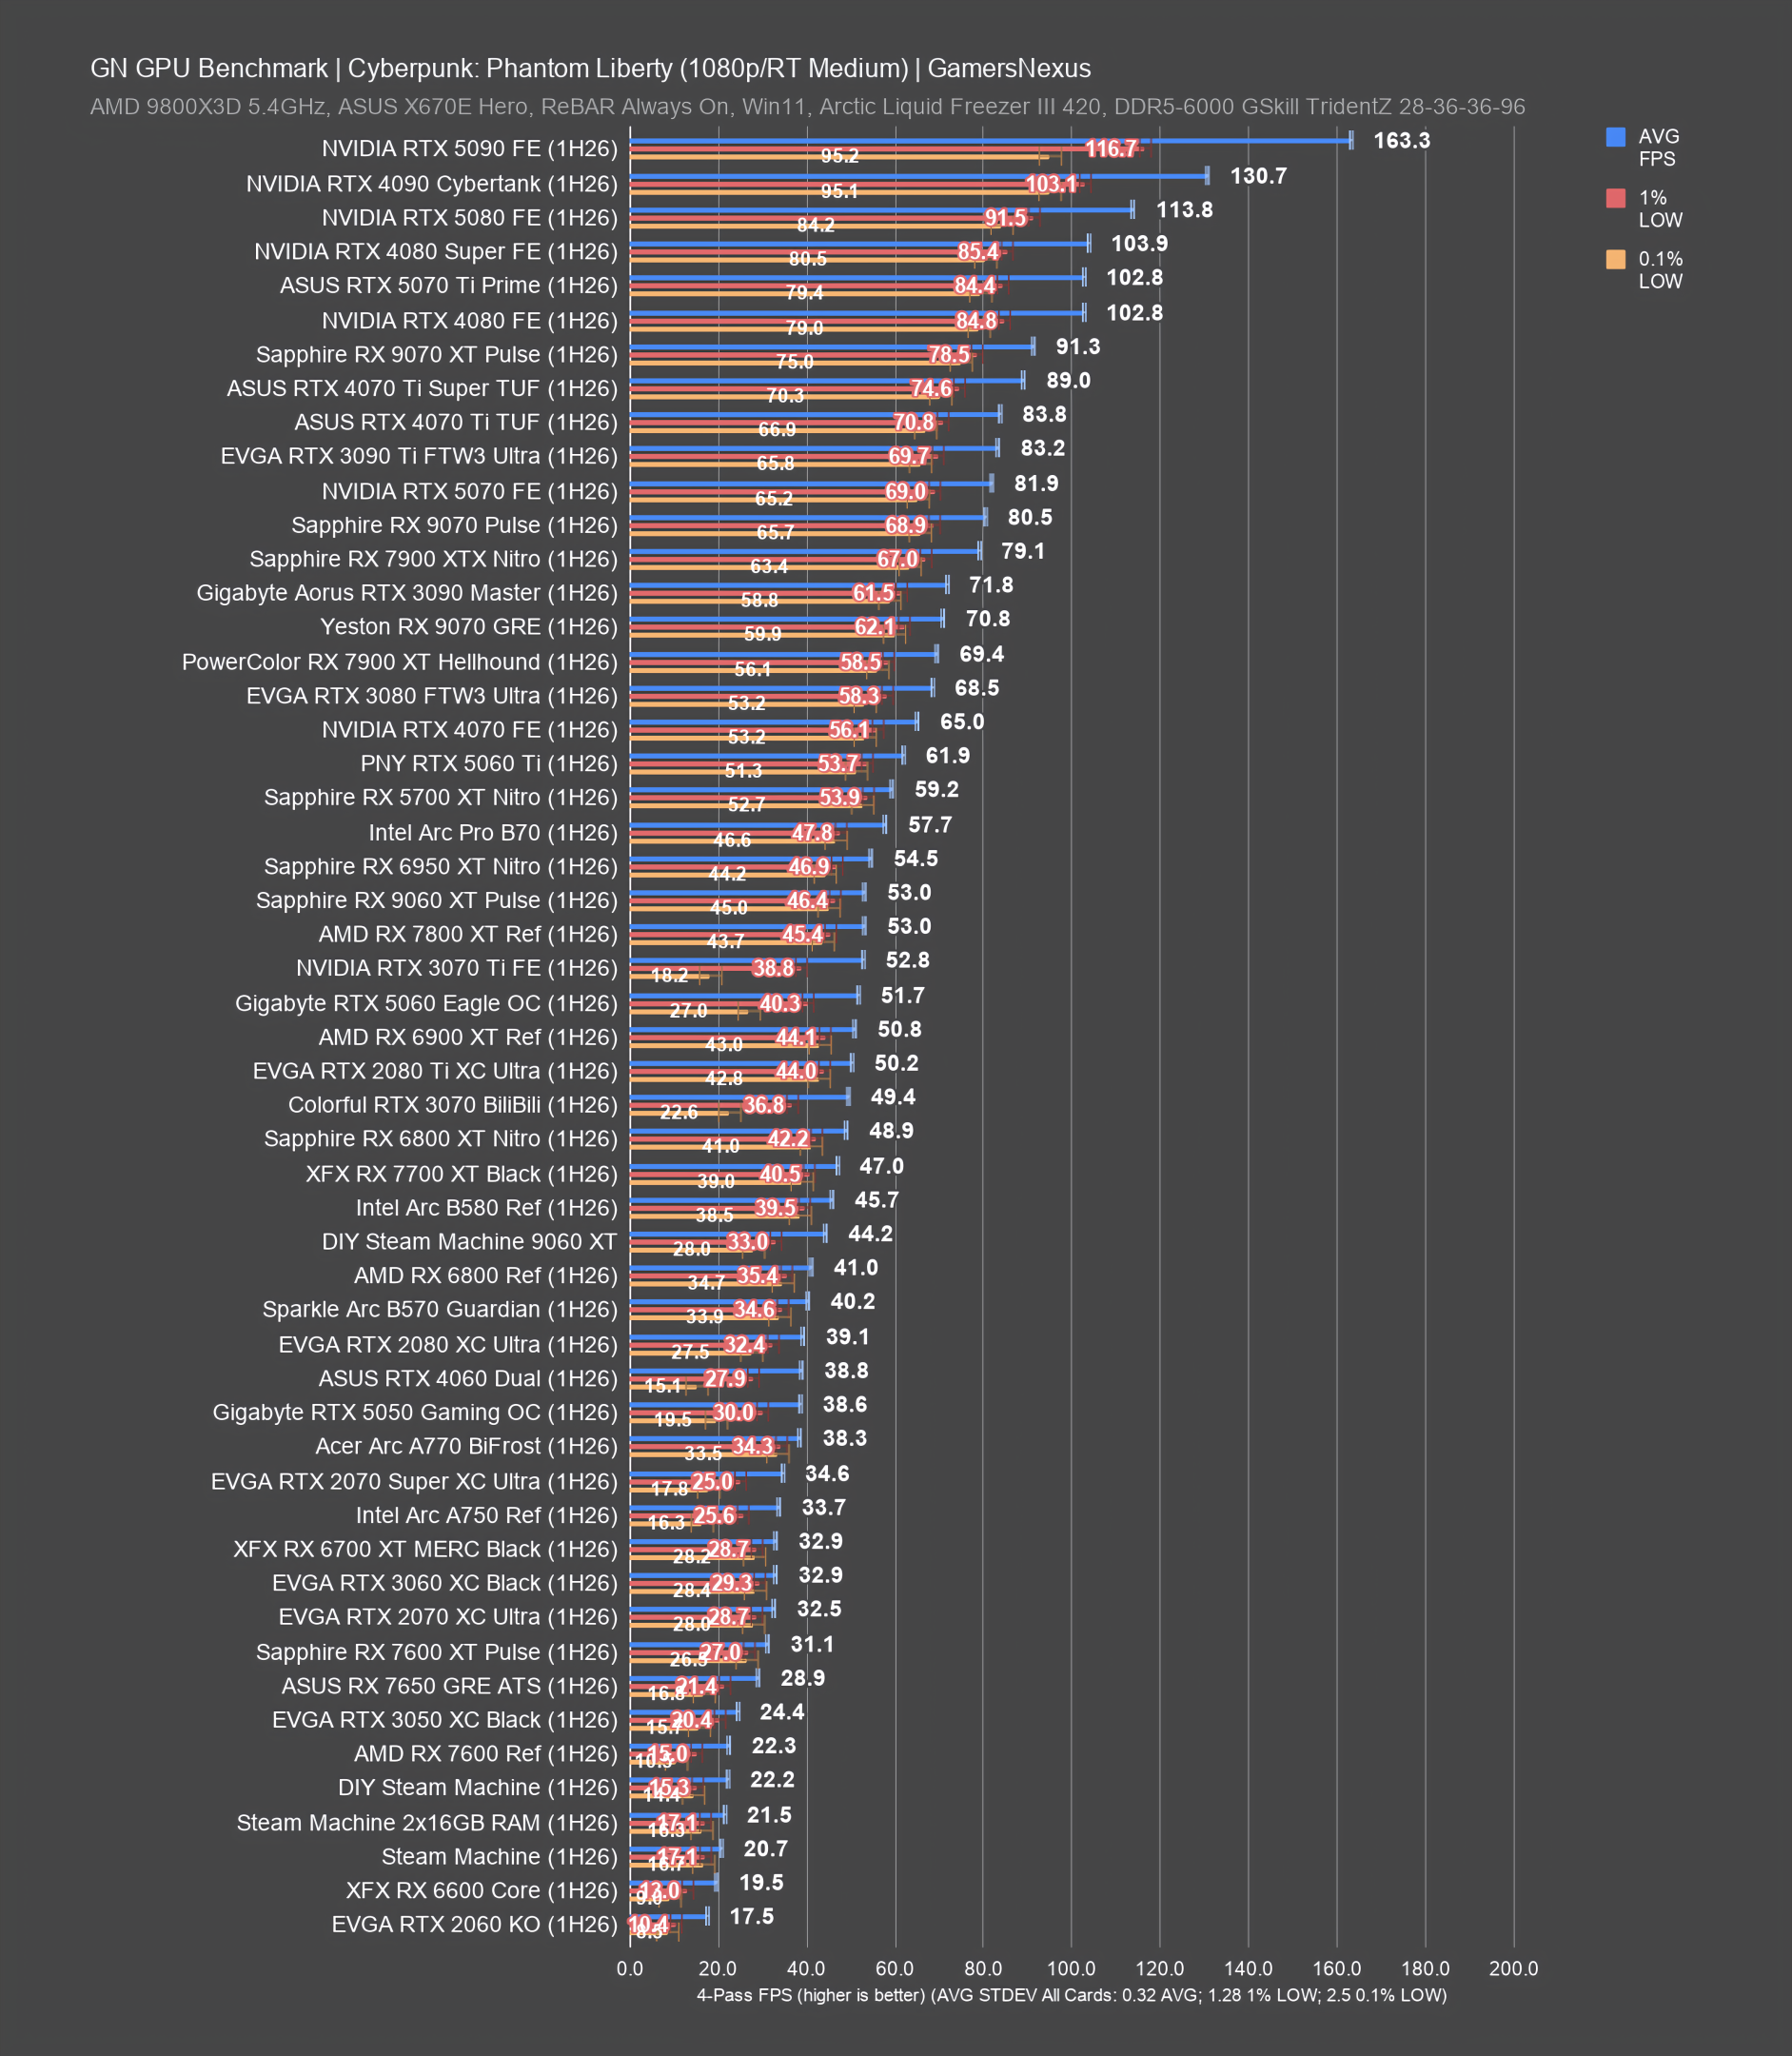
| Cyberpunk 2077: Phantom Liberty | 2023 | Raster: Ultra RT: RT Medium |
| Baldur's Gate 3 | 2023 | Ultra |
| Dying Light 2 | 2022 | High-Custom |
Rasterized GPU Benchmark Charts (2H26)
The below charts will help you determine the best gaming GPU for your PC build or upgrade. These span several generations of GPU, but obviously not all of them; however, we do have data for most (mainstream) GPUs even when not present here, it just may be on older charts and in older content. For example, our GTX 1080 Ti revisit from 2024 contains 10-series results and is still representative of performance today. Specific ray tracing (RT) benchmarks are further down and in a separate section.

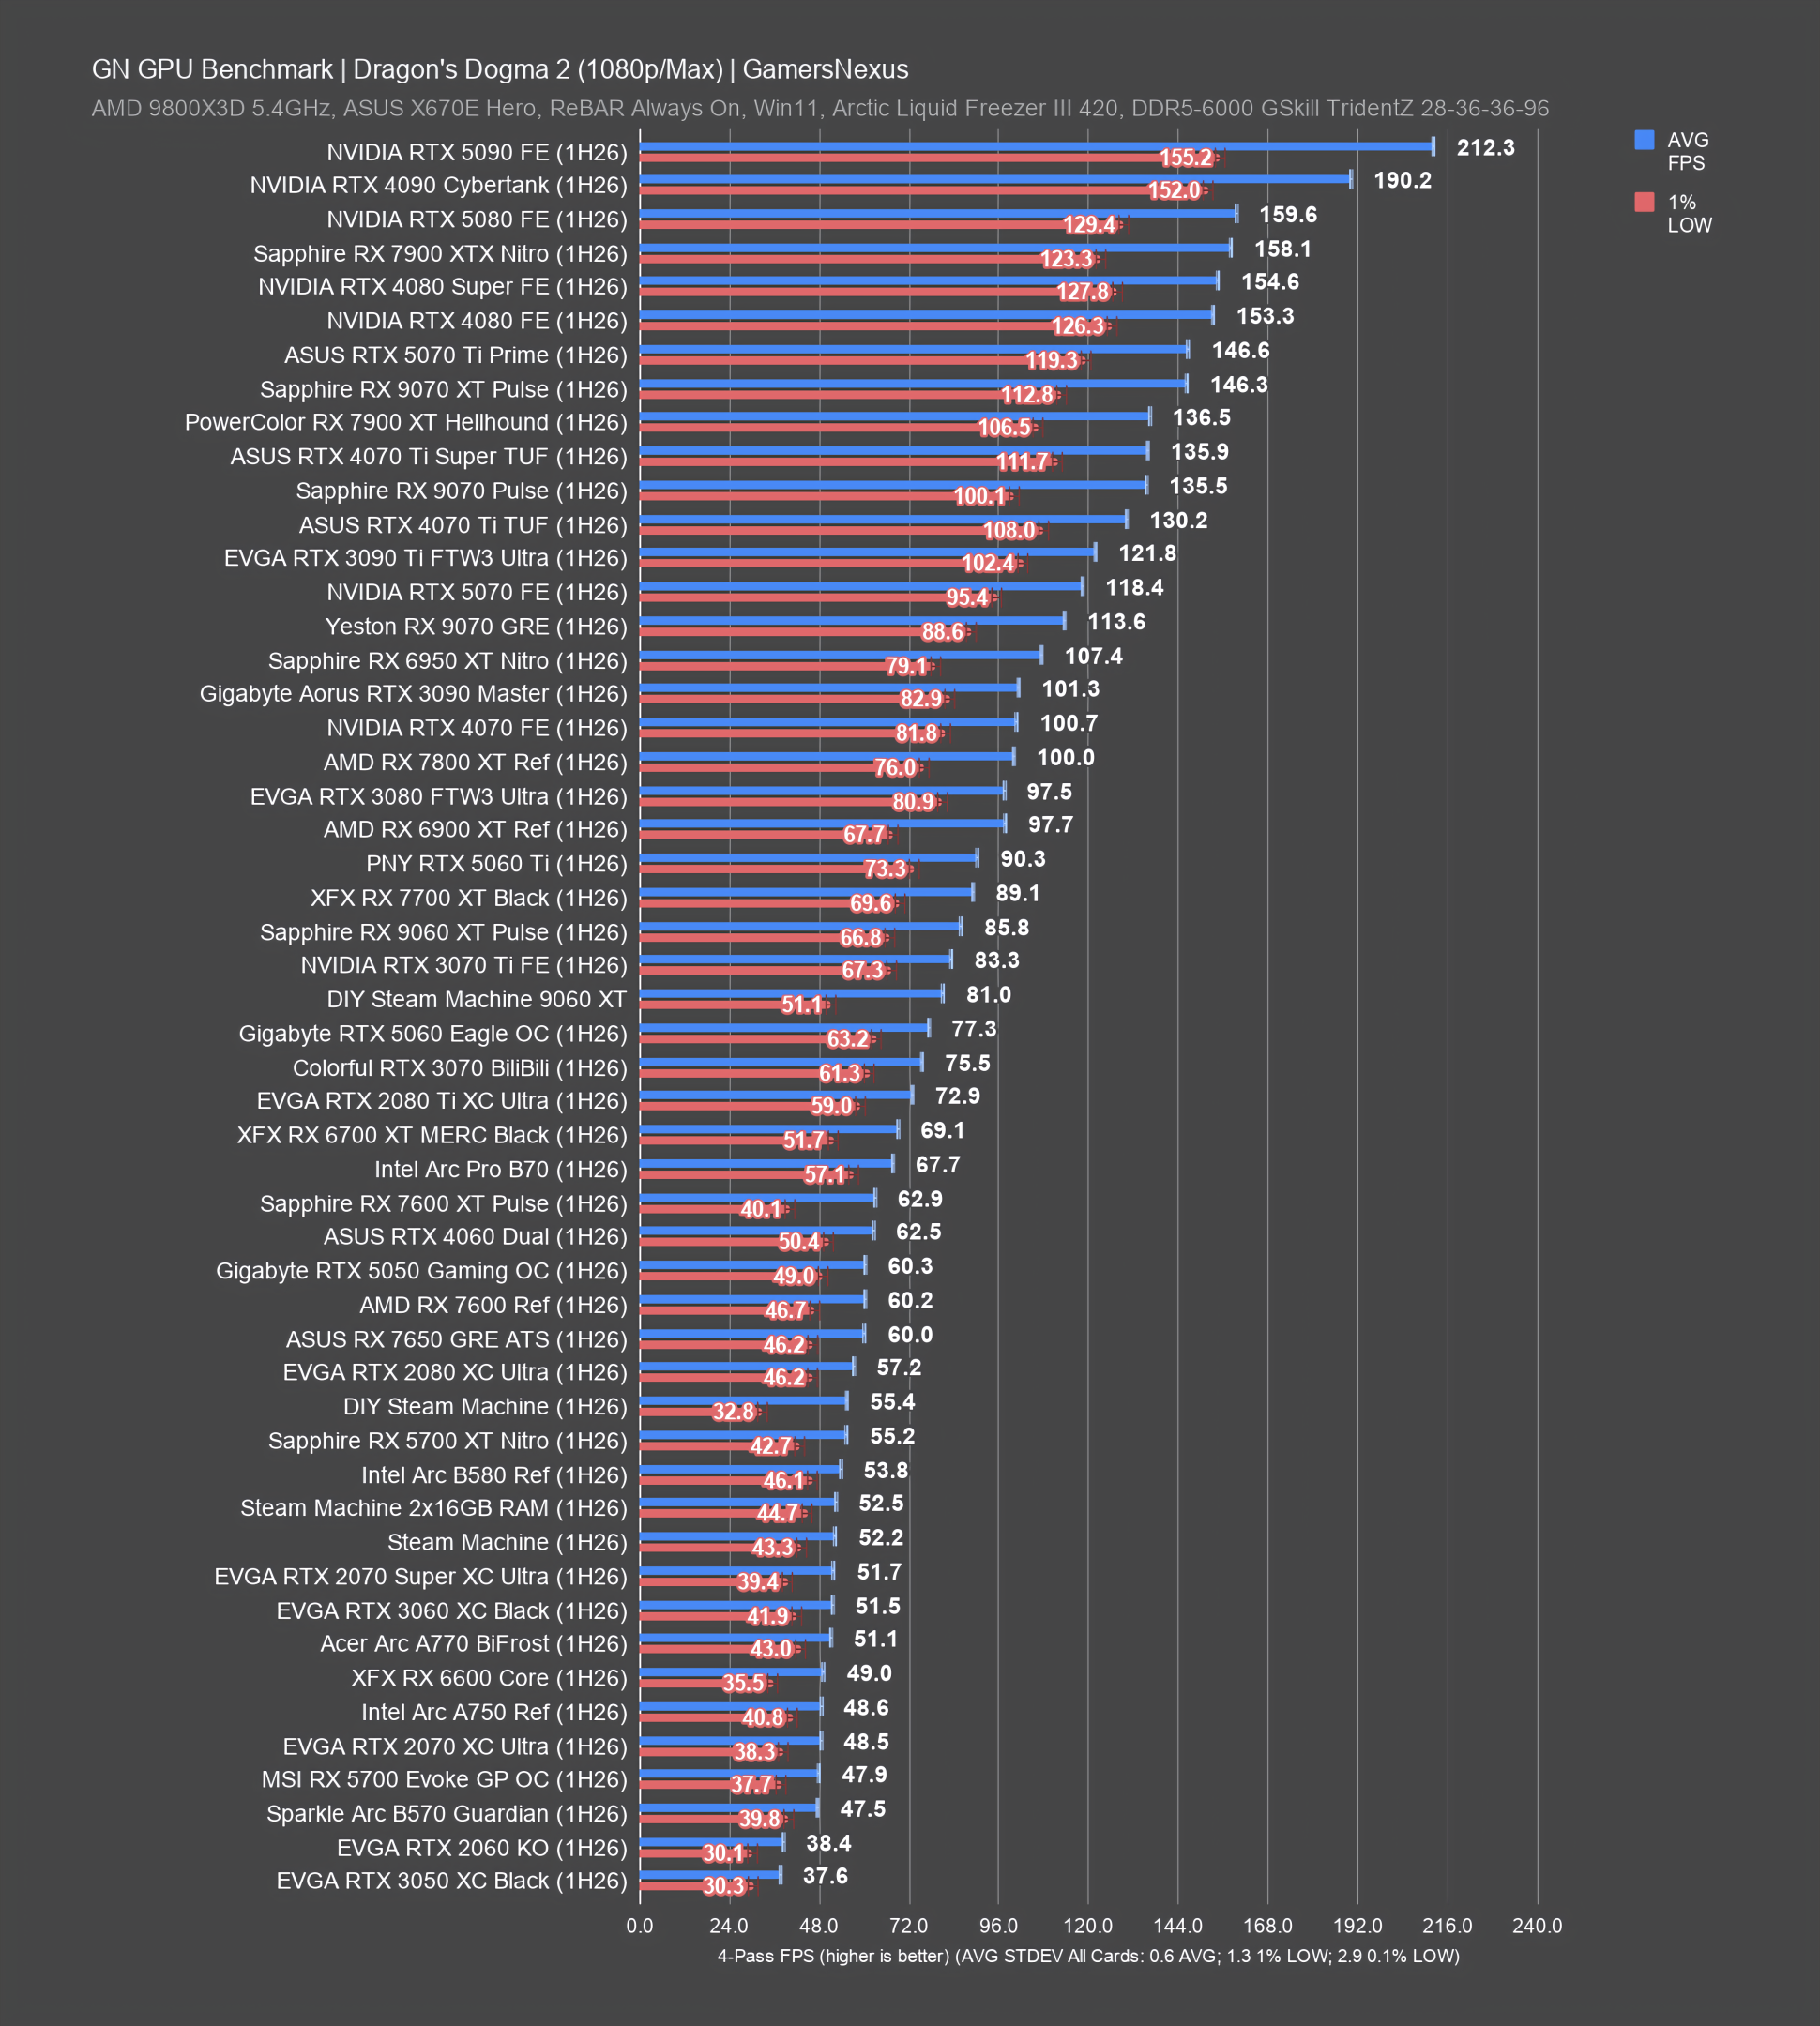
Dragon's Dogma 2
These tests are for the game Dragon's Dogma 2, which we've found to be reliable and repeatable for both GPU and CPU benchmarking charts. We perform Dragon's Dogma 2 GPU testing in the fields outside of a castle, as the grass is intensive to render. CPU testing is performed within a city, which increases CPU load due to additional NPC pathfinding and routing. We previously published a research piece and deep-dive on Dragon's Dogma 2 here.
4K GPU Benchmarks
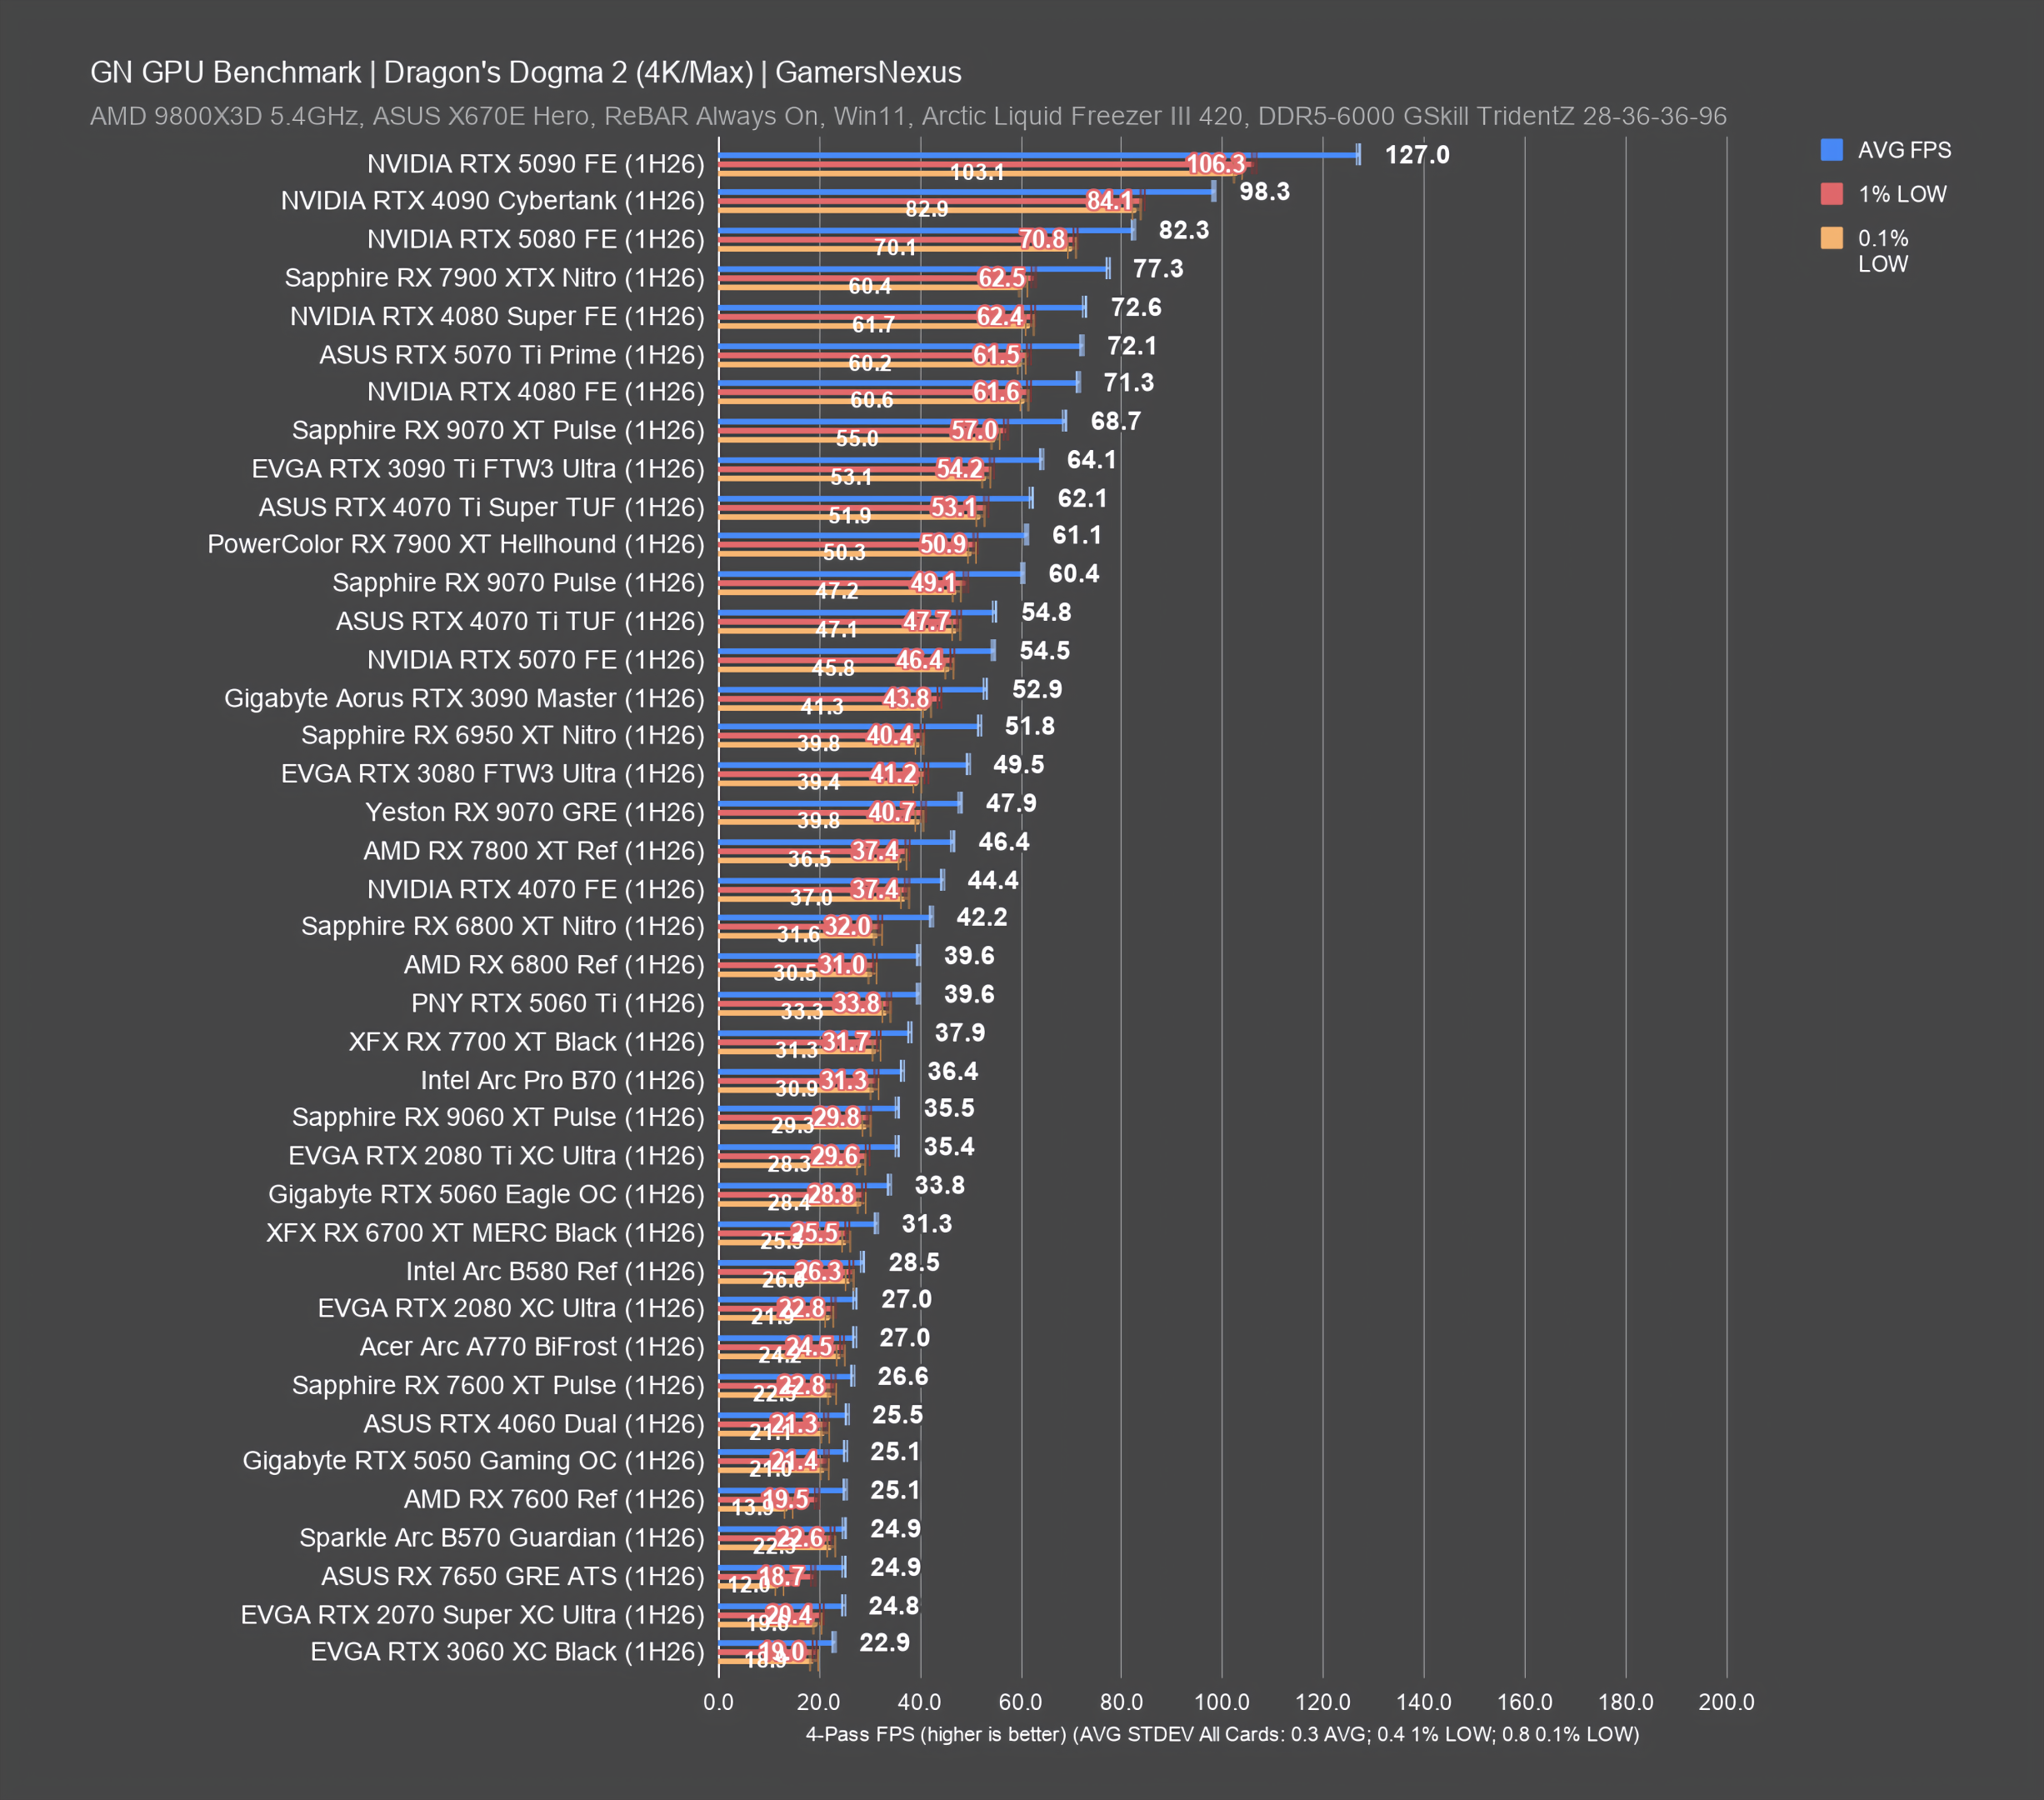
1440p GPU Benchmarks
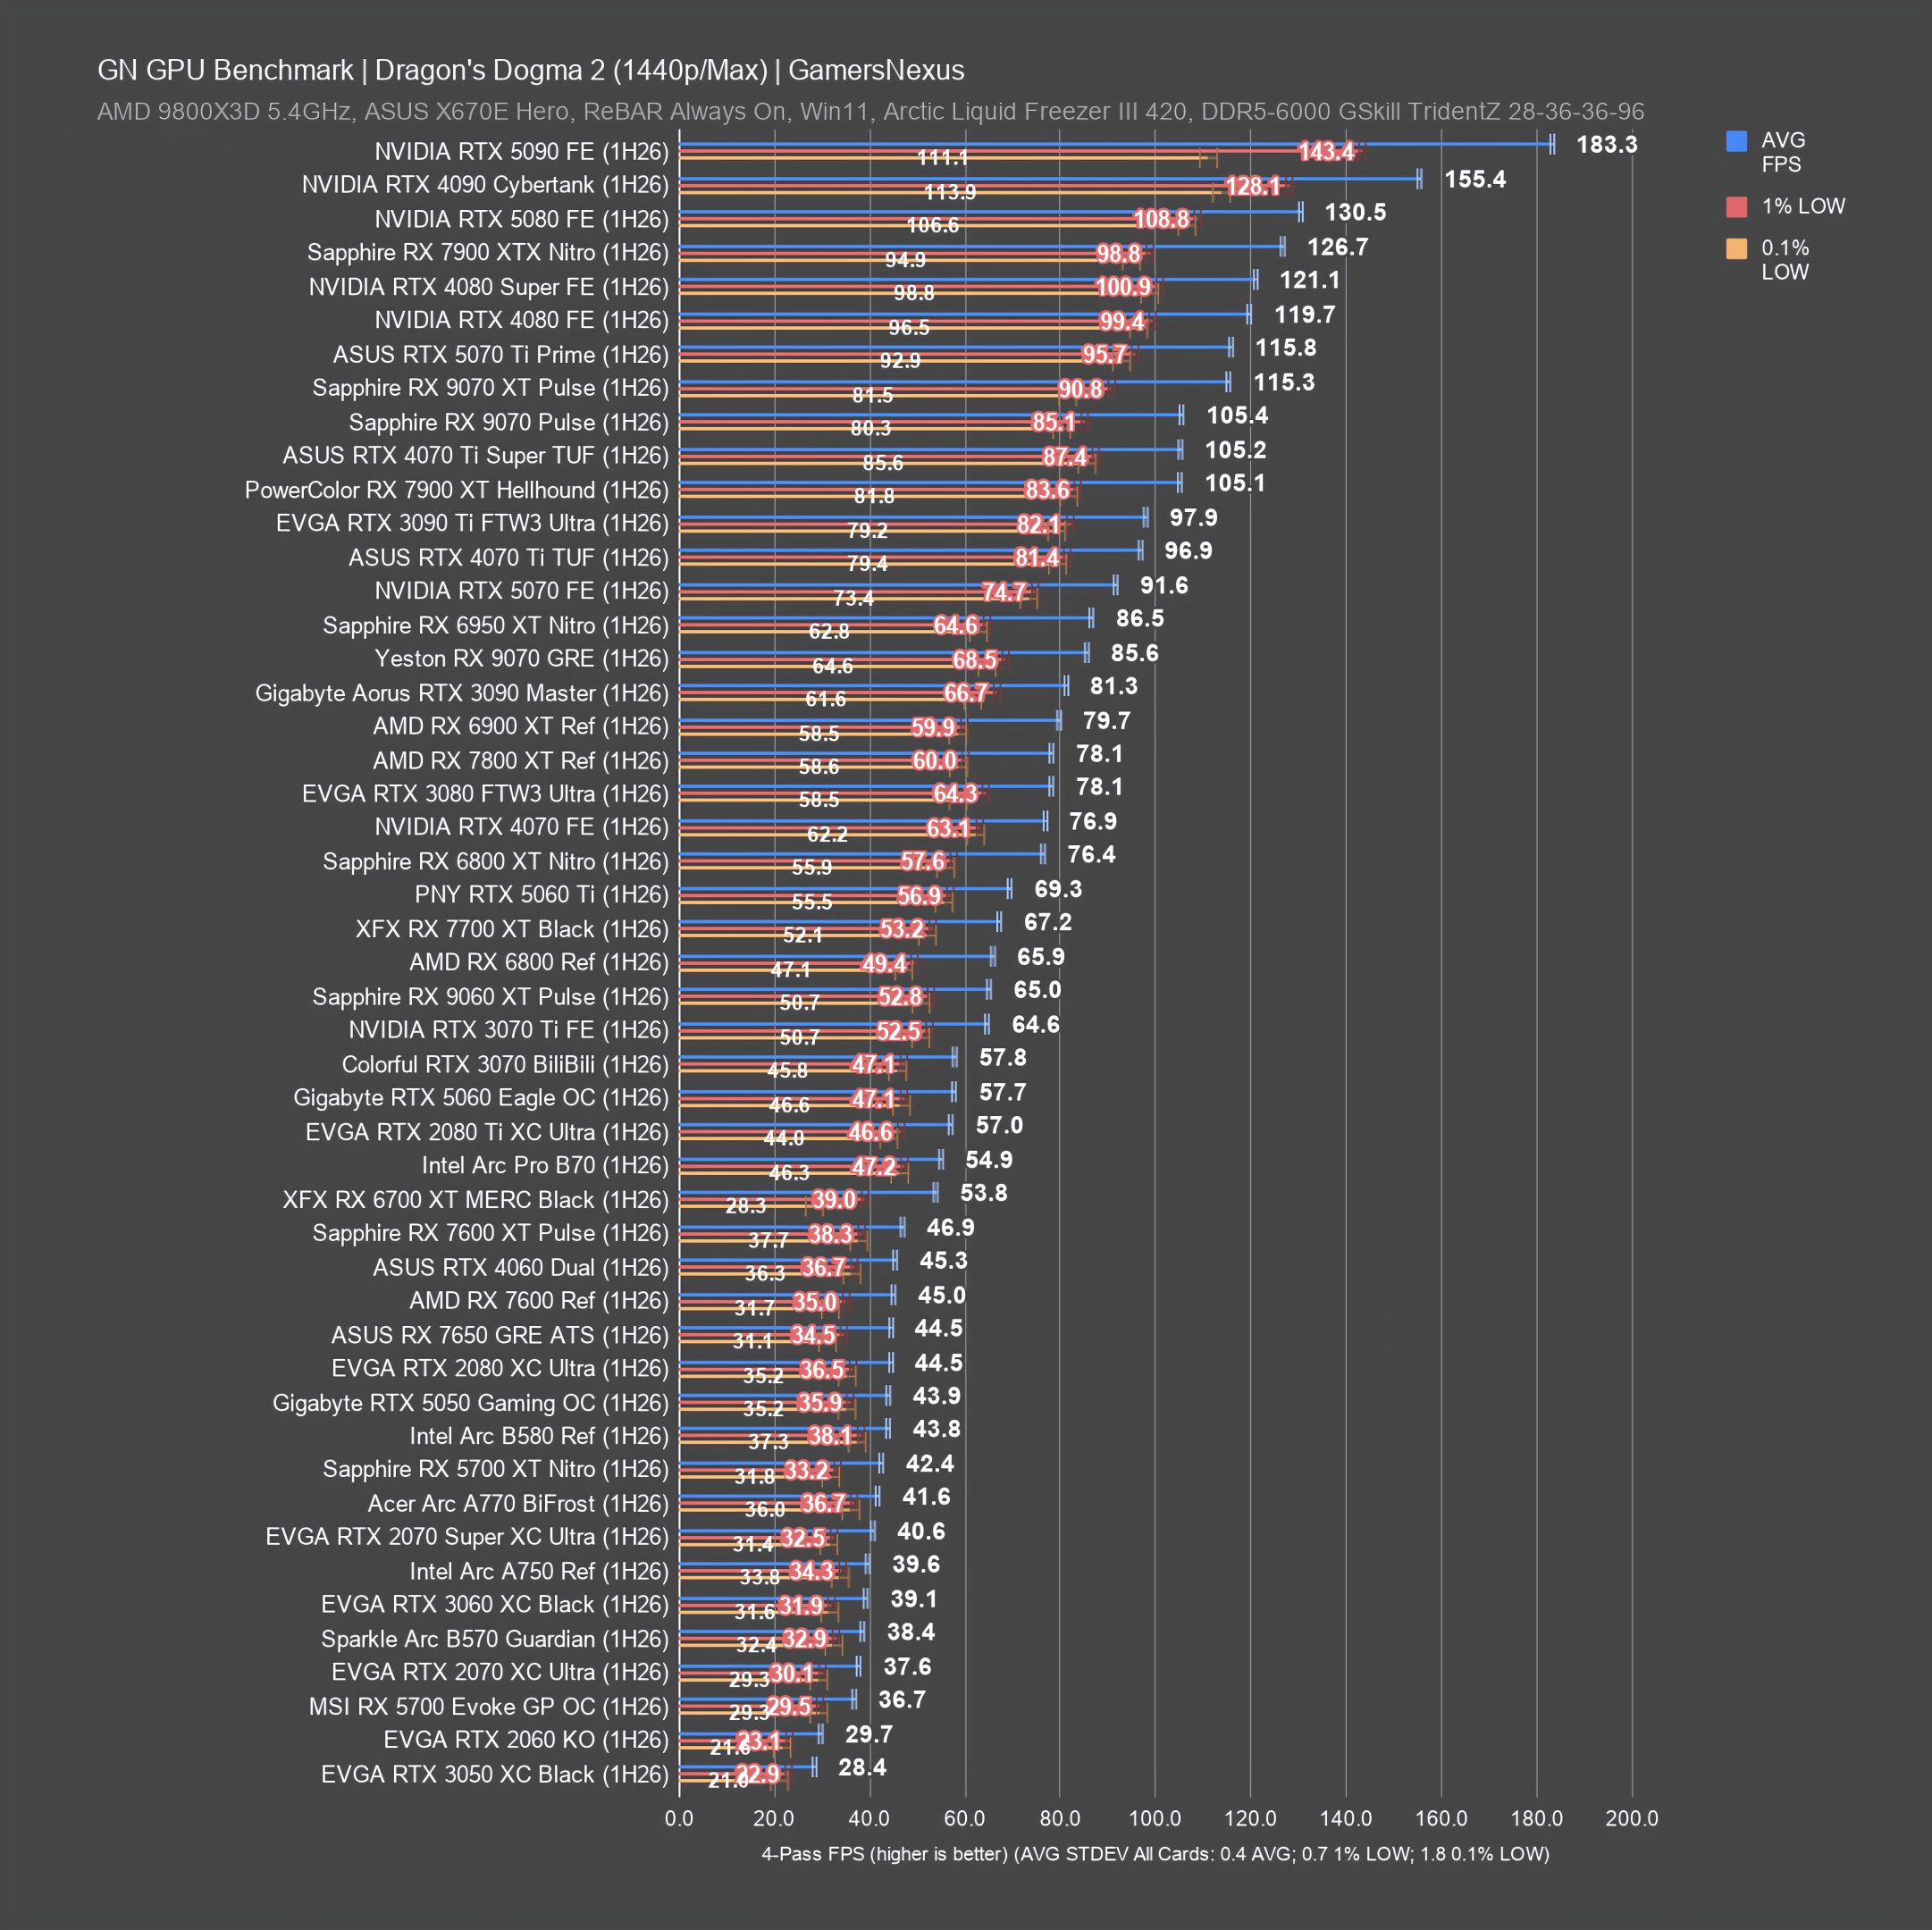
1080p GPU Benchmarks
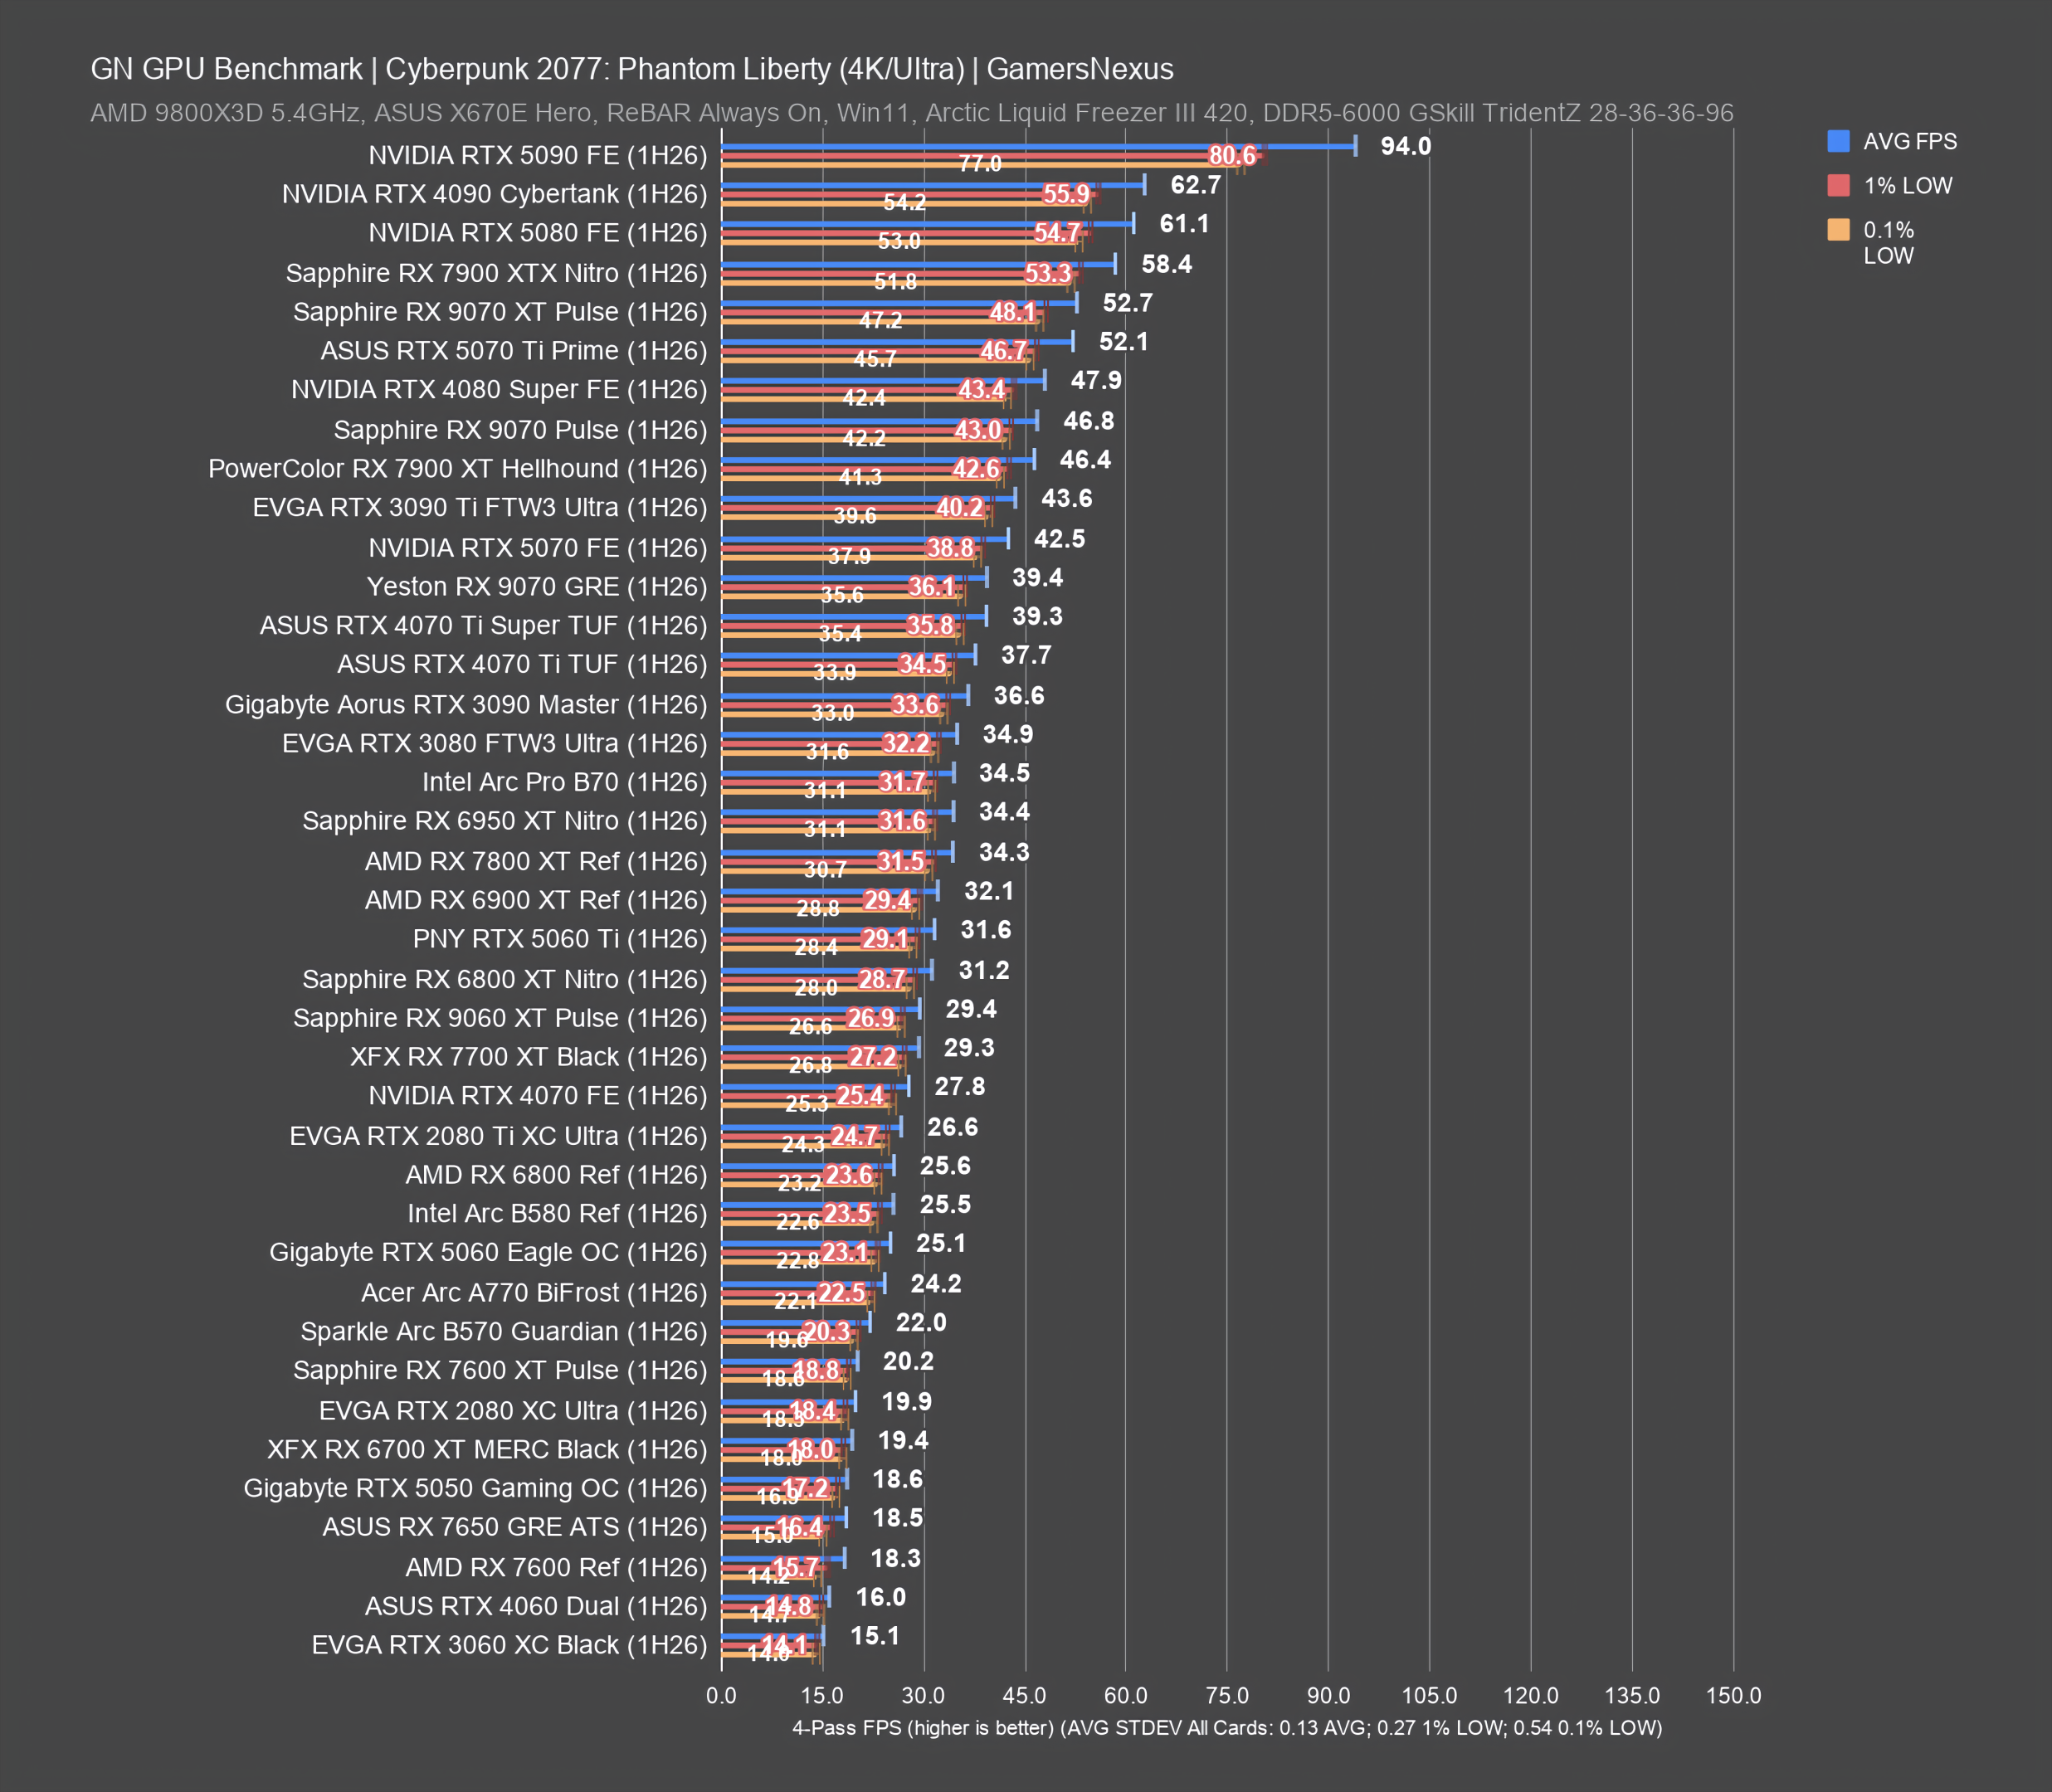
Cyberpunk 2077: Phantom Liberty Best Gaming GPUs
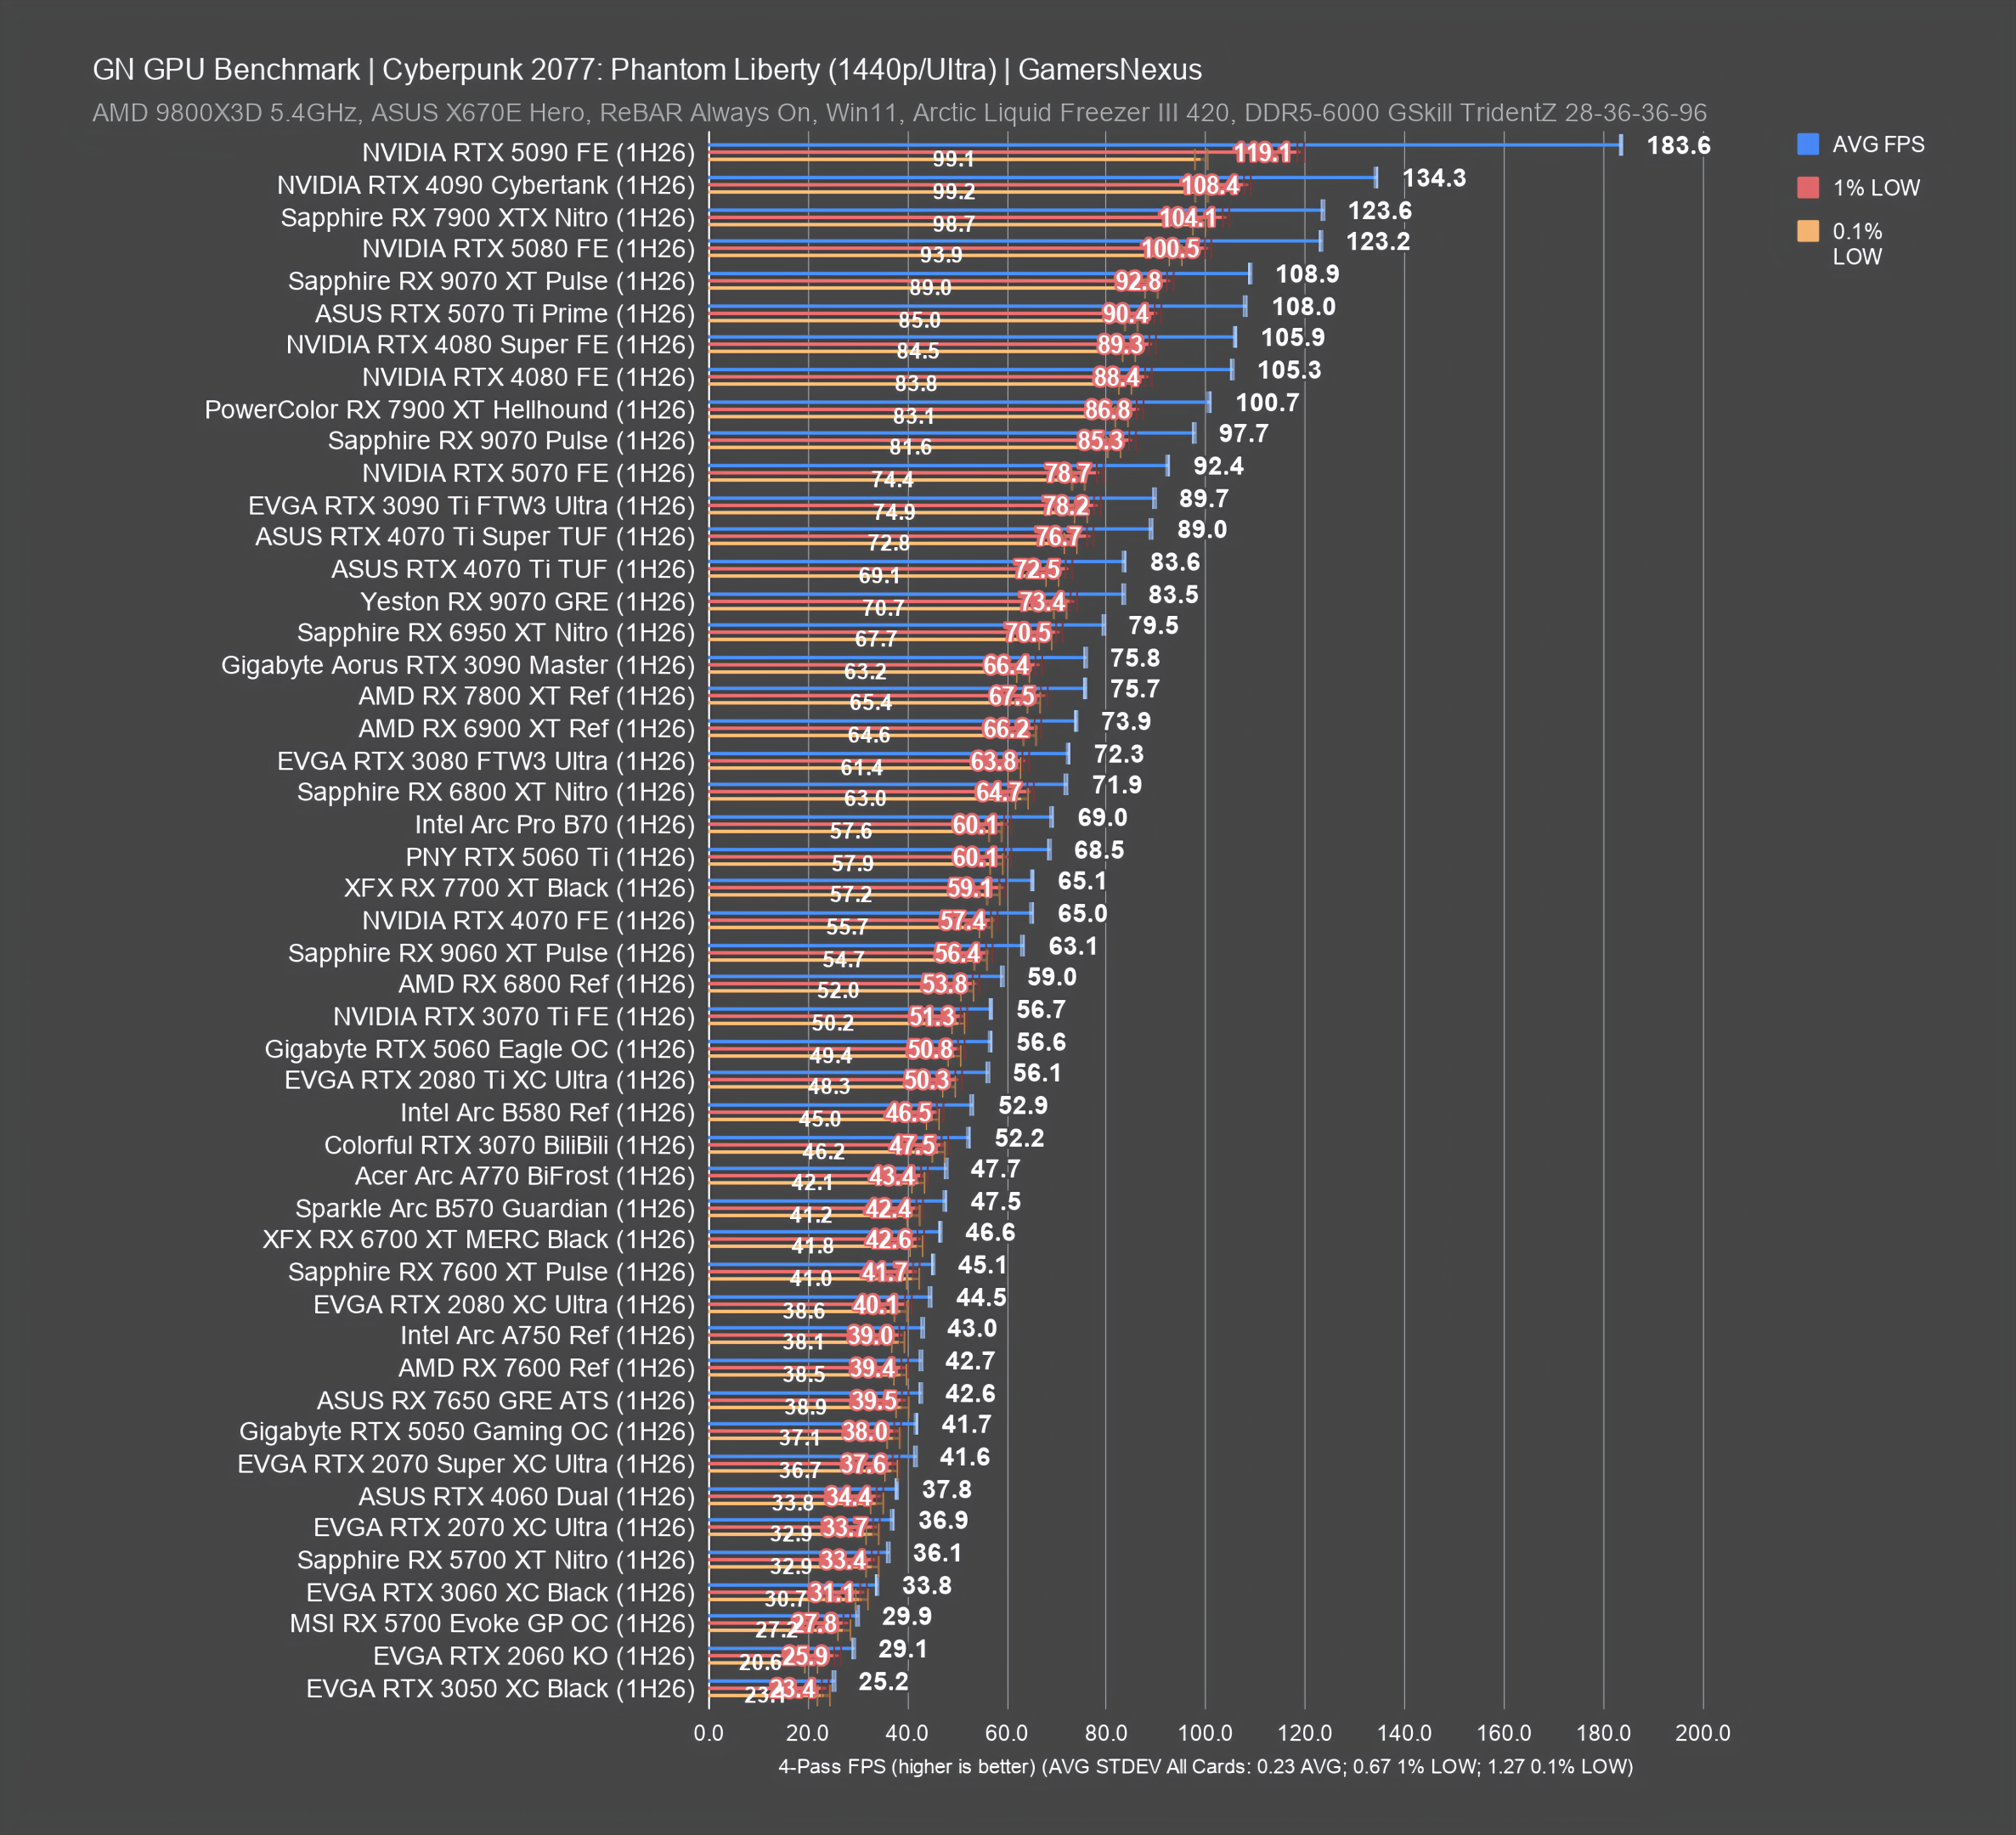
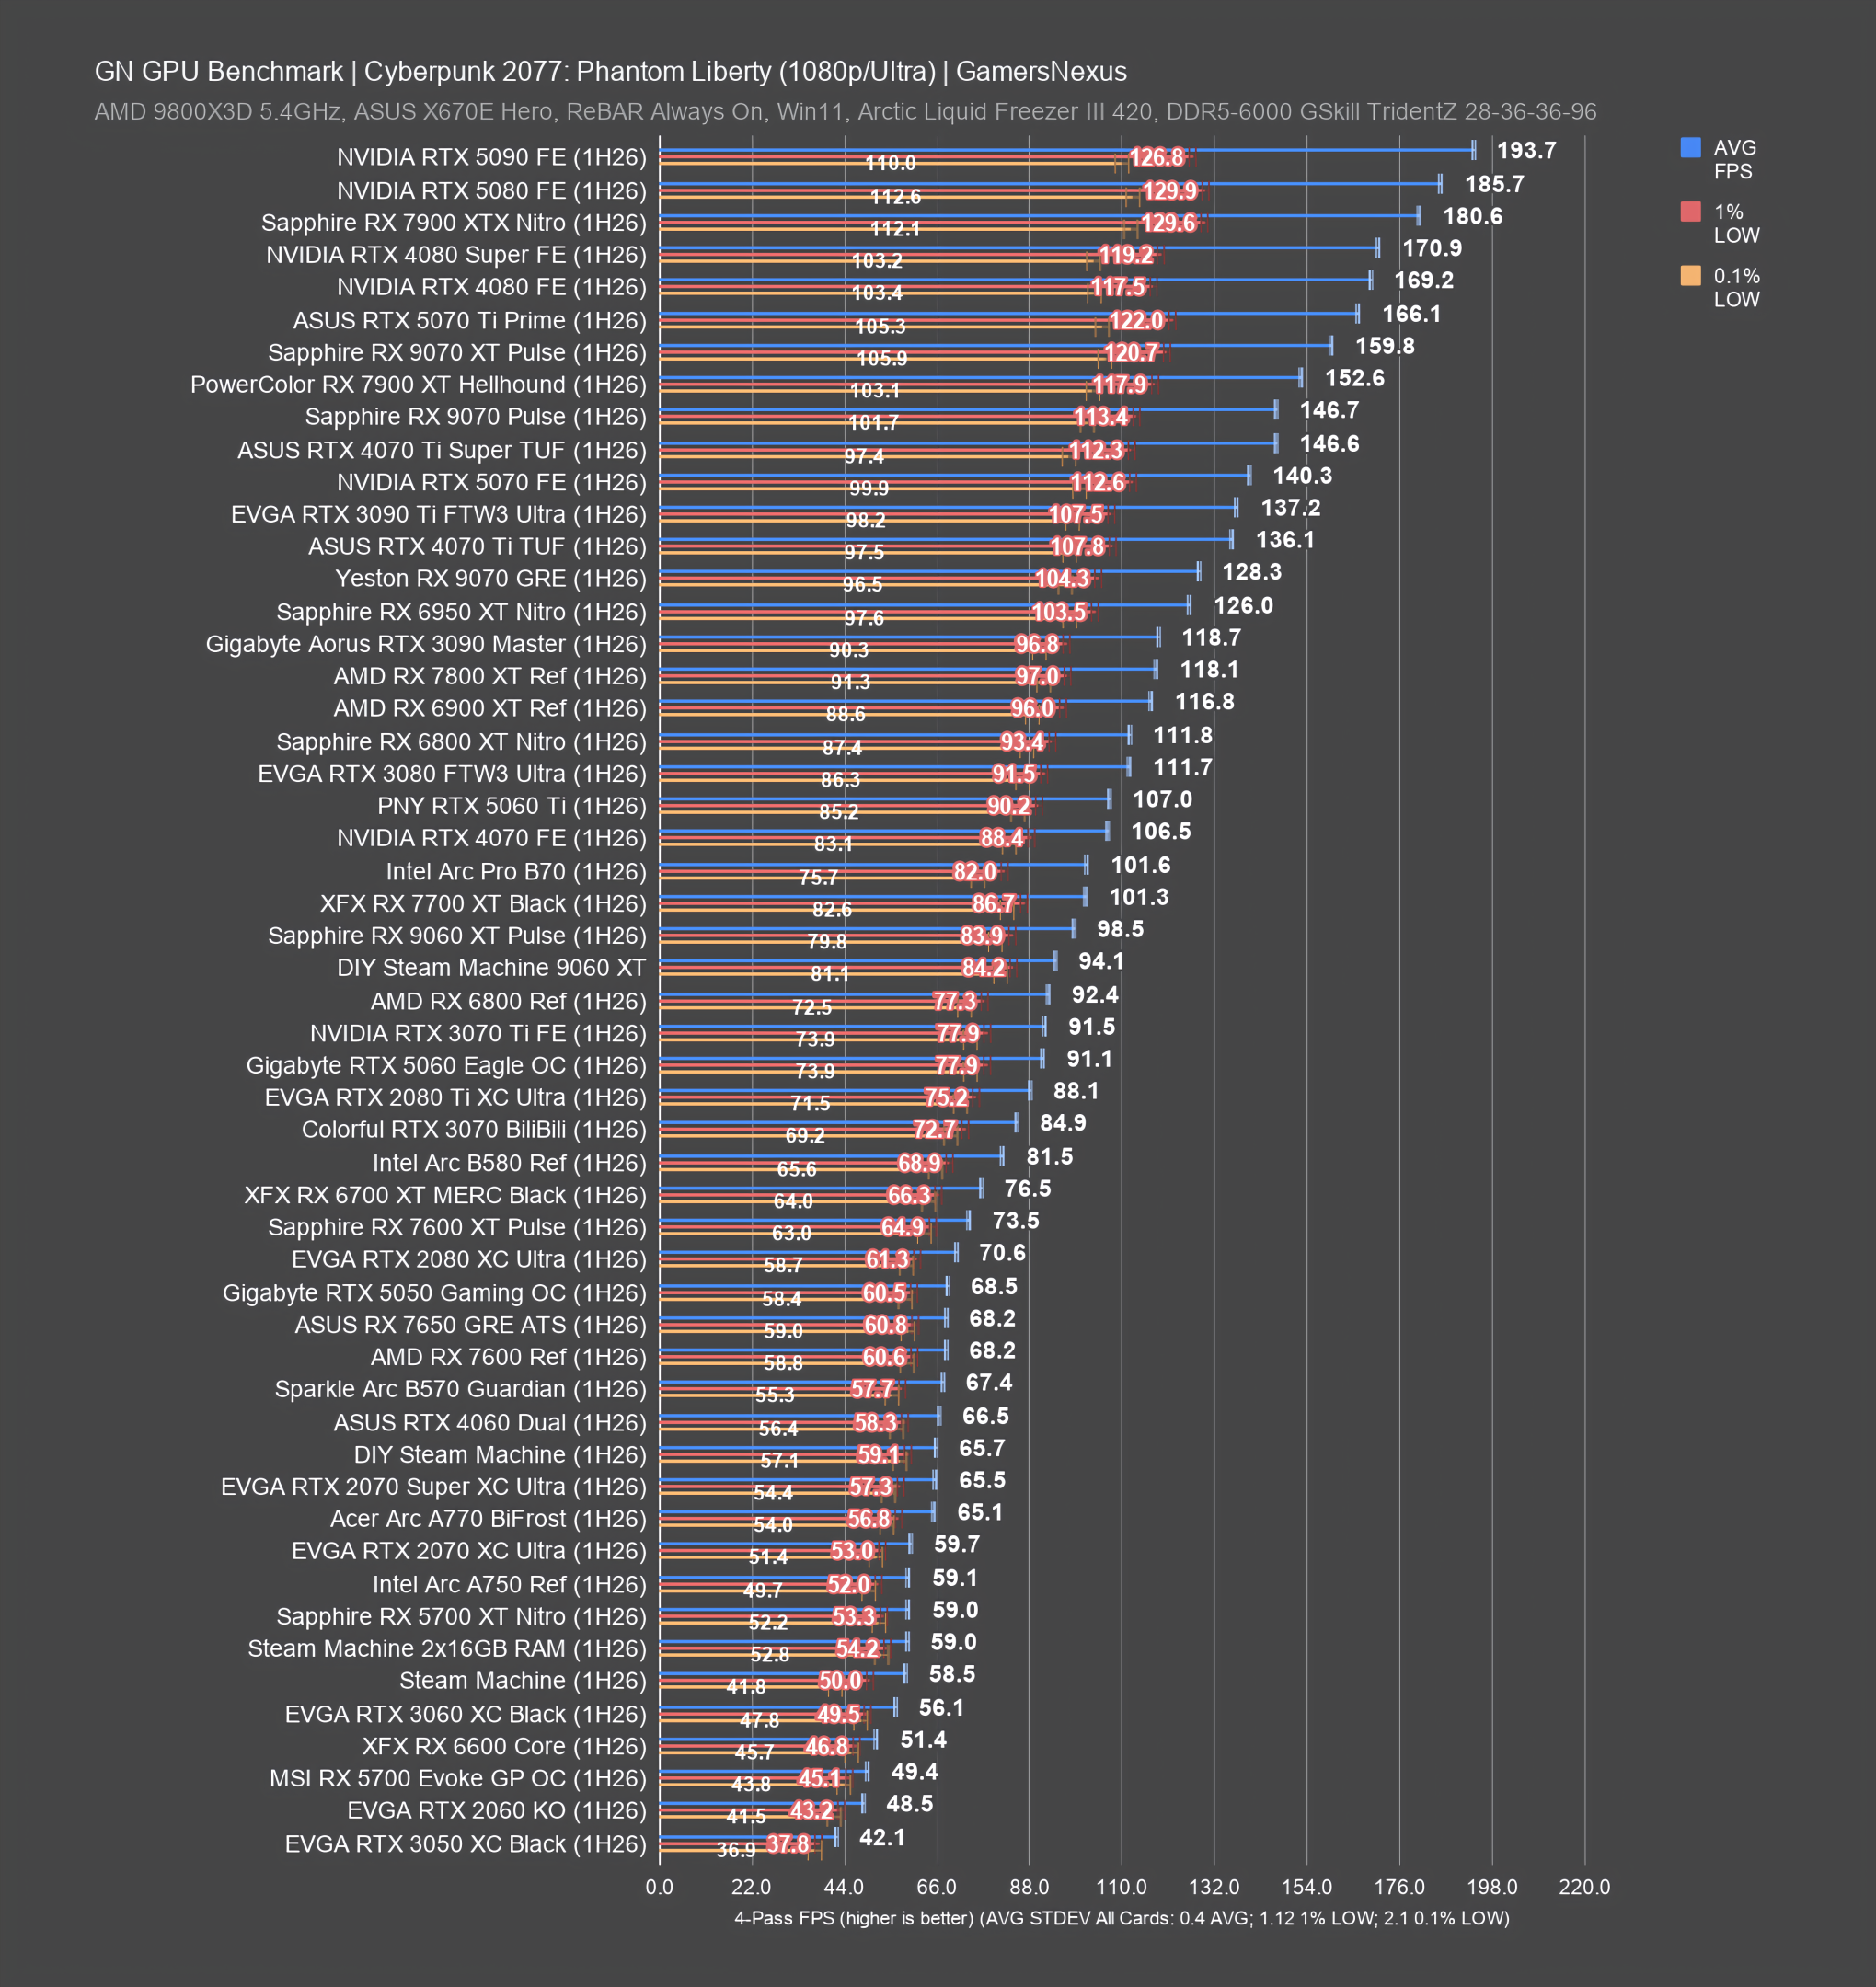
The below benchmark charts are for Cyberpunk 2077: Phantom Liberty without ray tracing. Ray tracing is further down. Cyberpunk remains an intensive game to benchmark and has historically been problematic with a touchy settings menu that doesn't always accept changes, even between game reboots (which we always perform when changing settings). Overall though, the game has become more reliable than it used to be and now serves as a regular to our CPU and GPU charts.
4K GPU Benchmarks
1440p GPU Benchmarks
1080p GPU Benchmarks
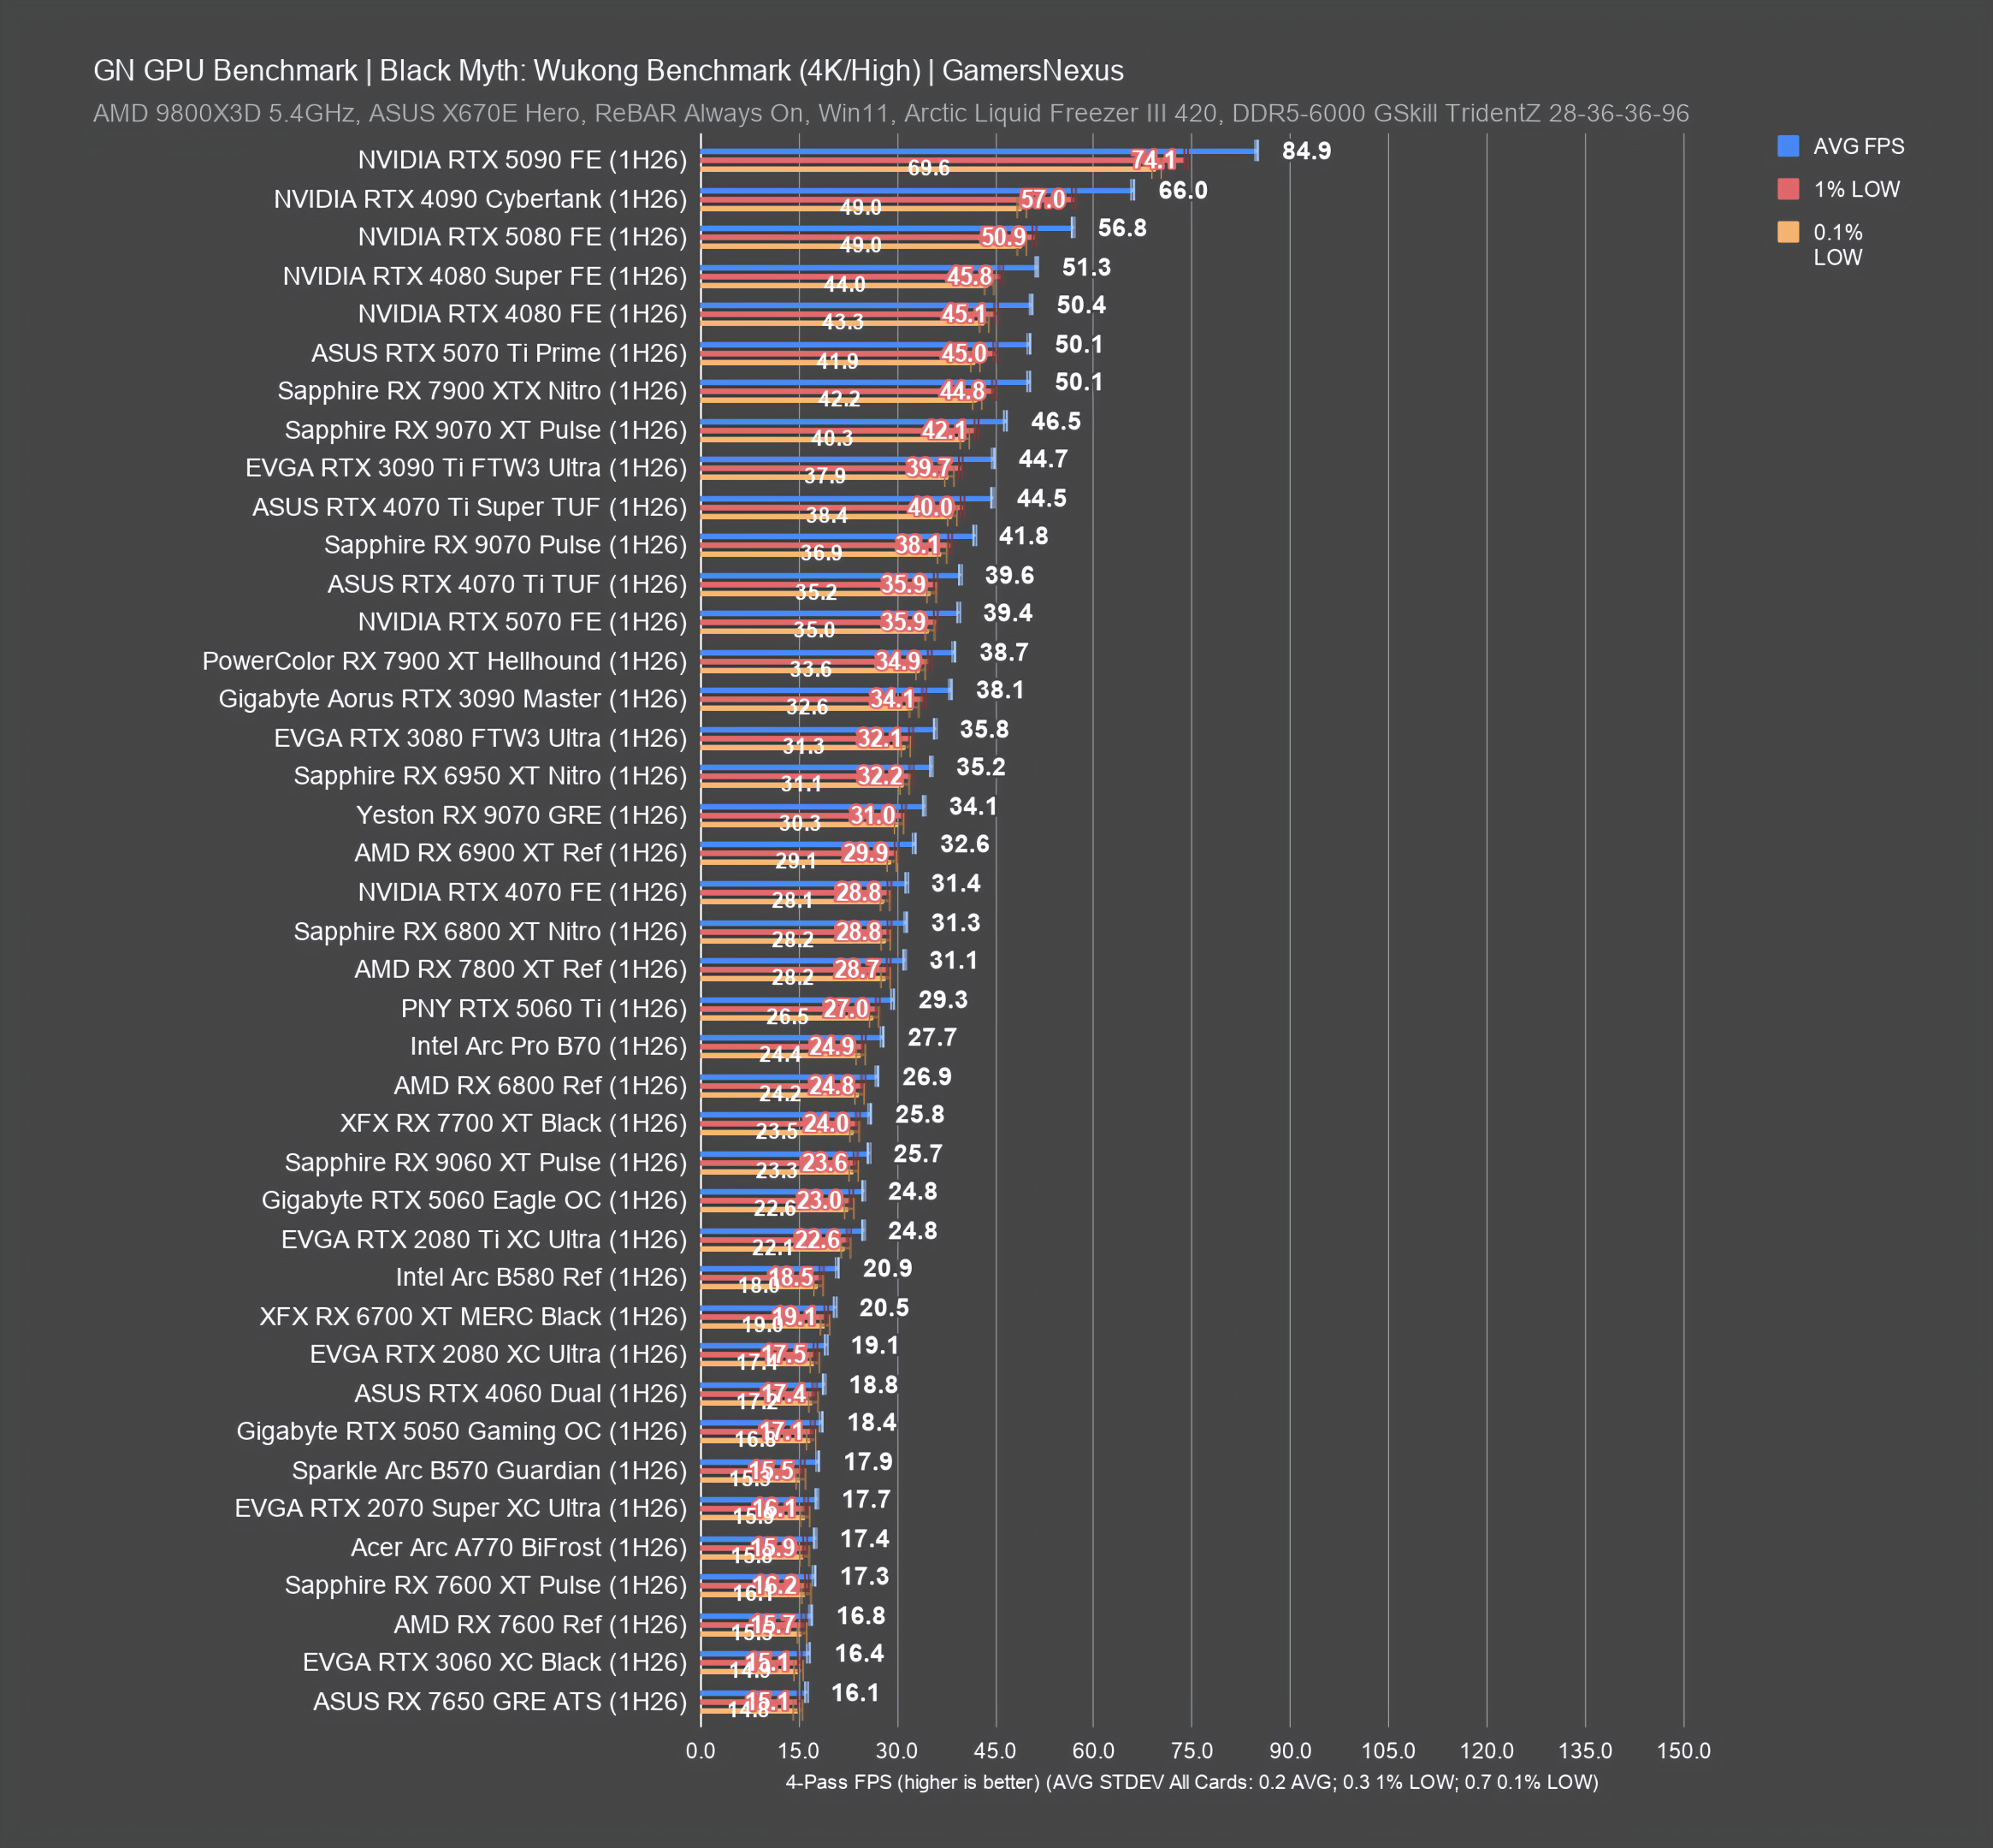
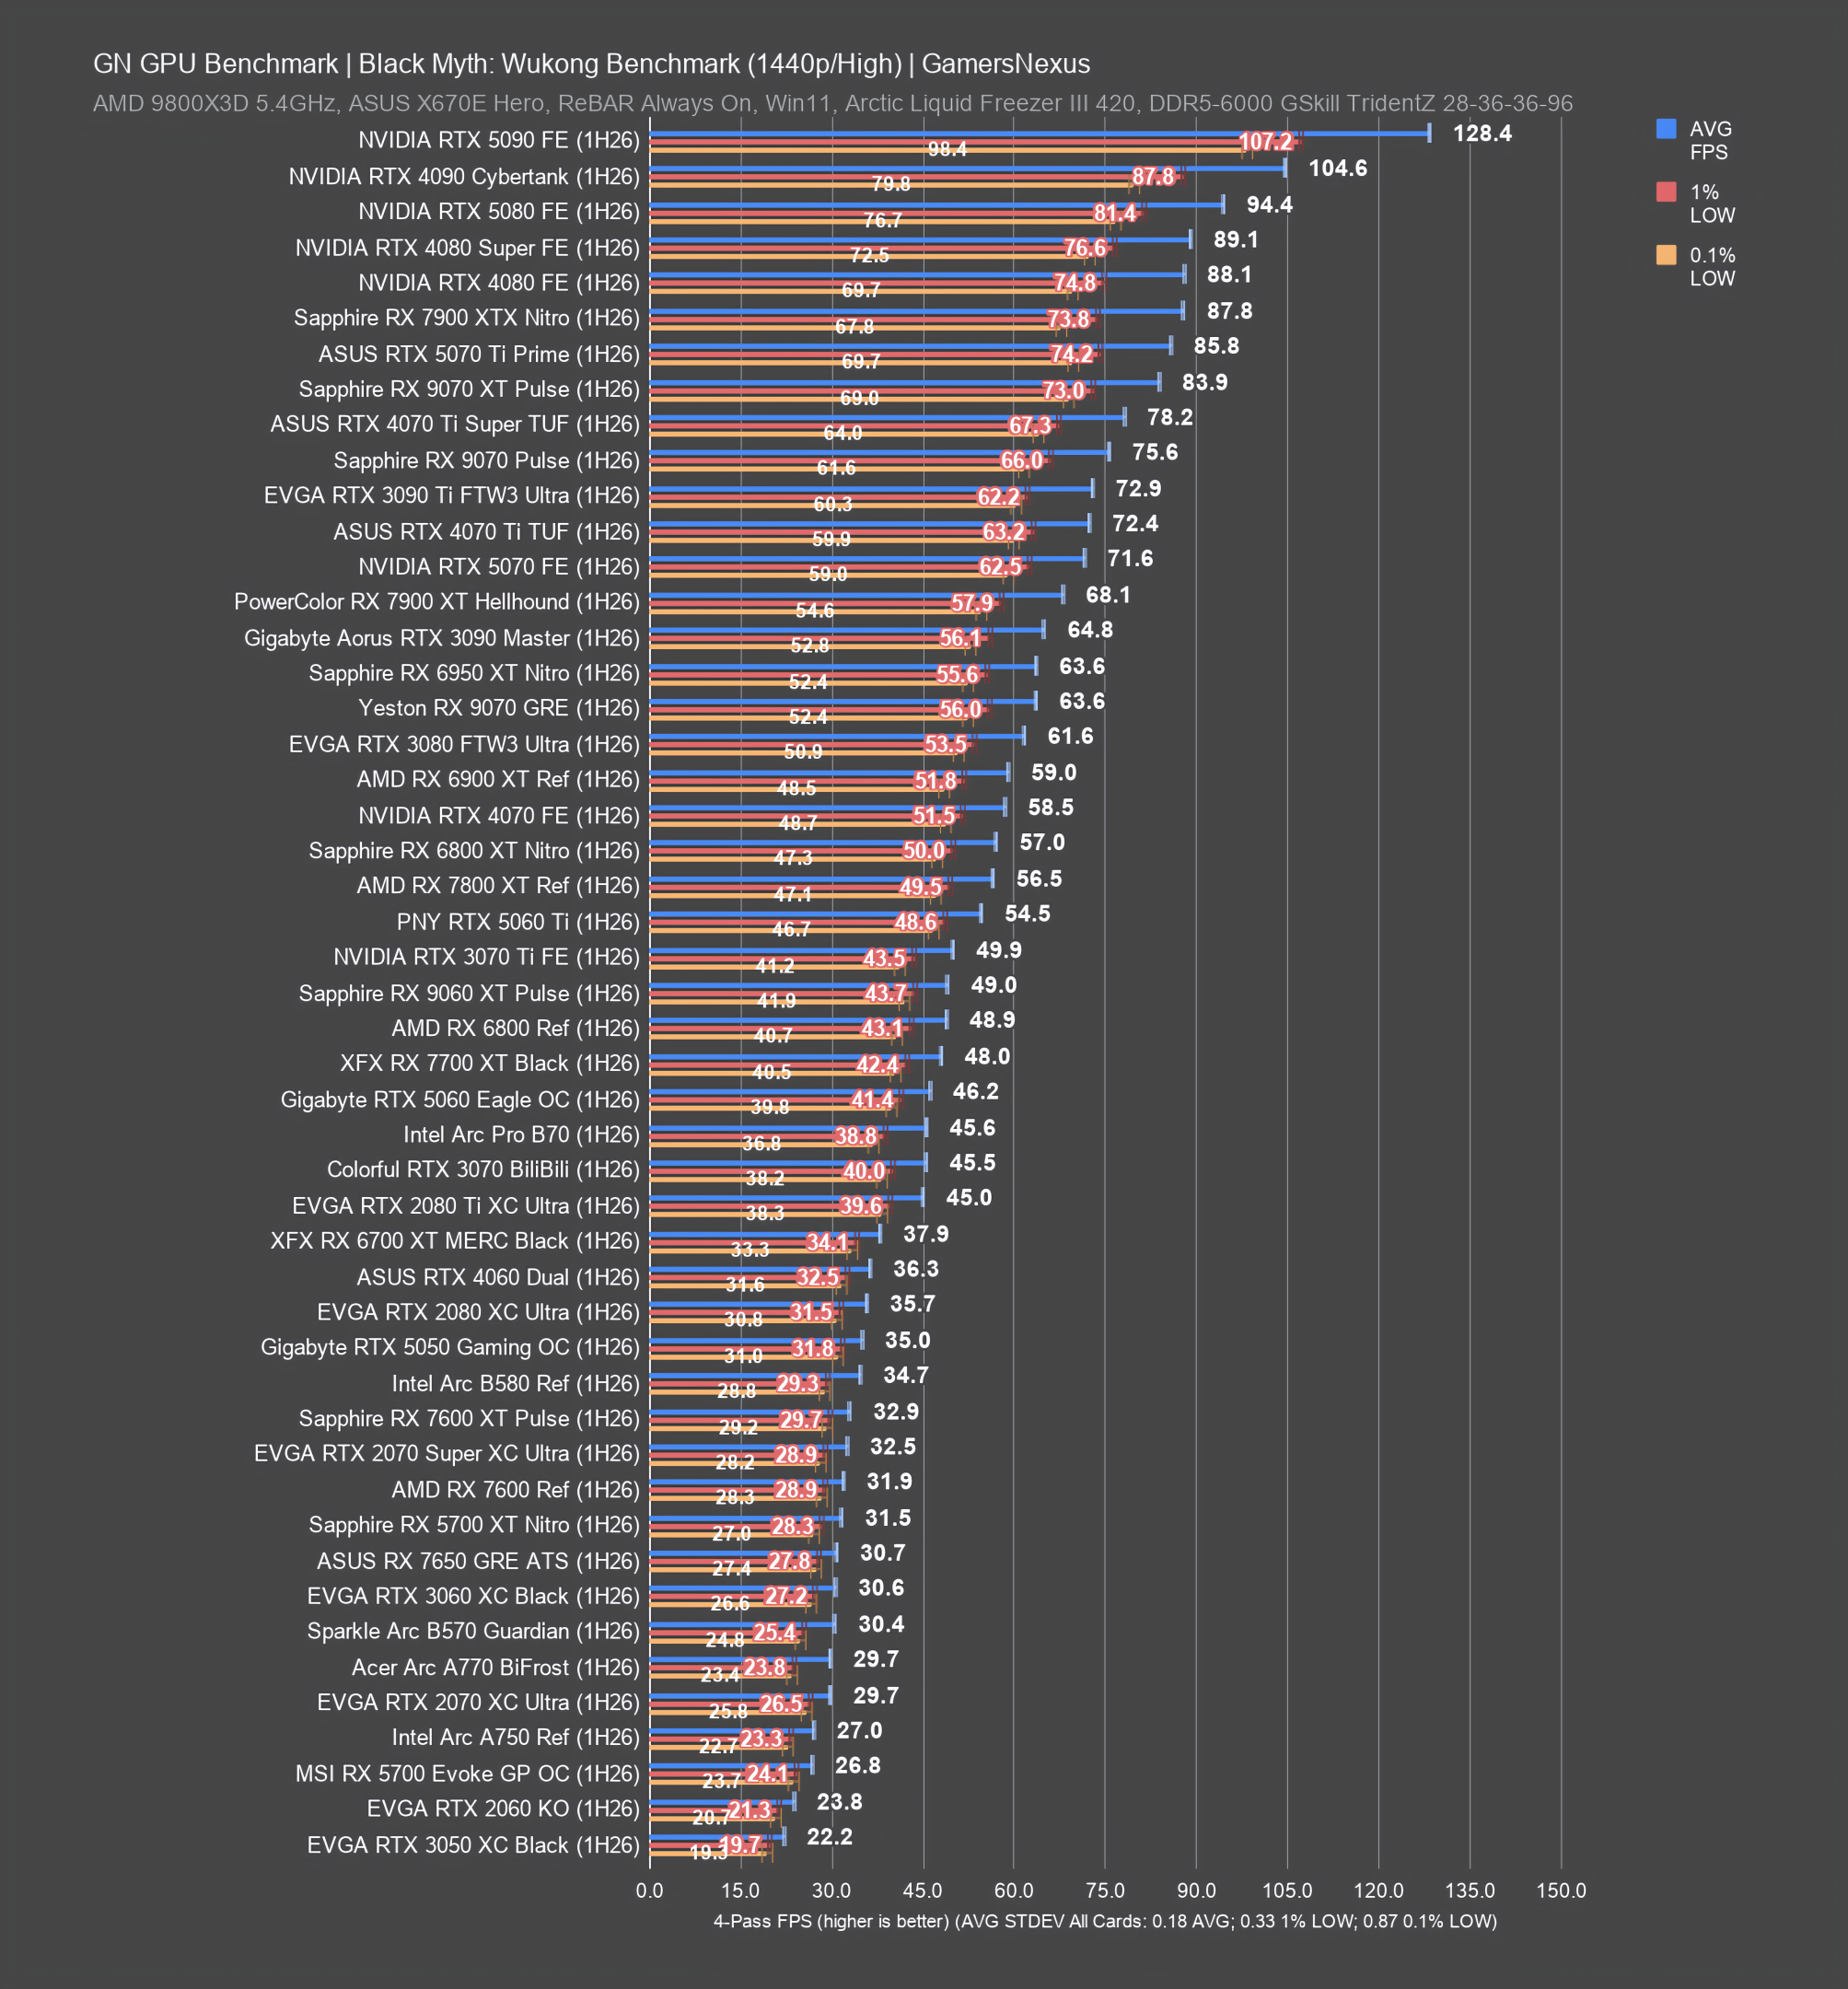
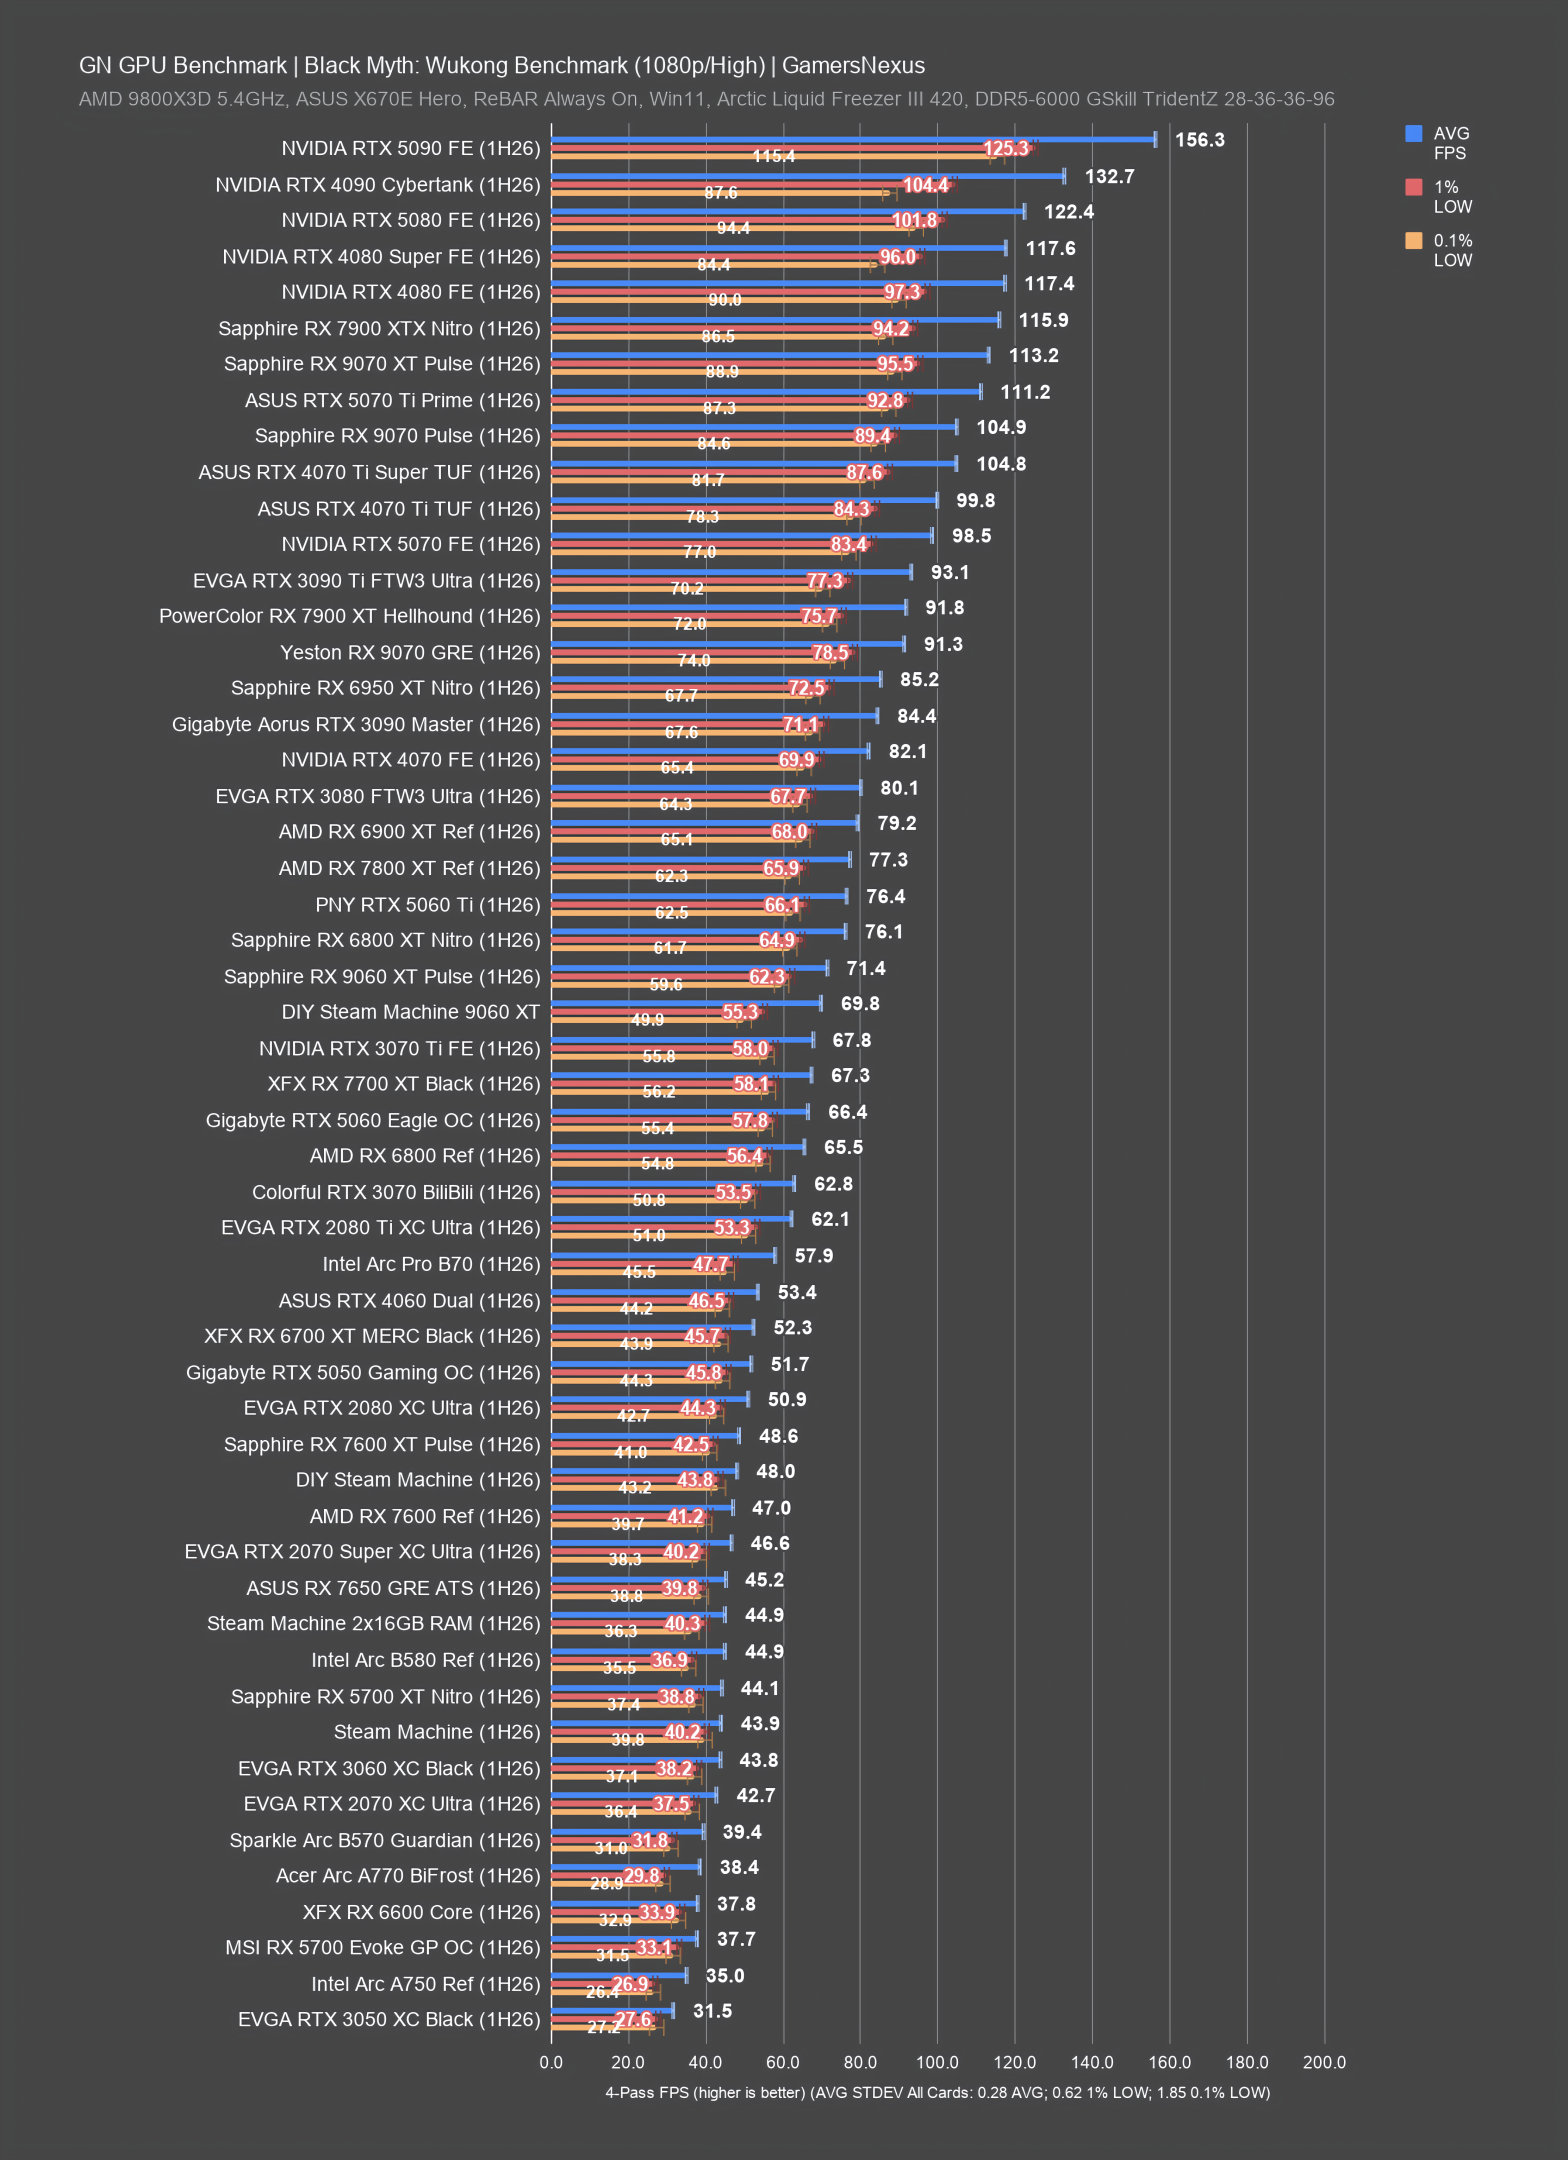
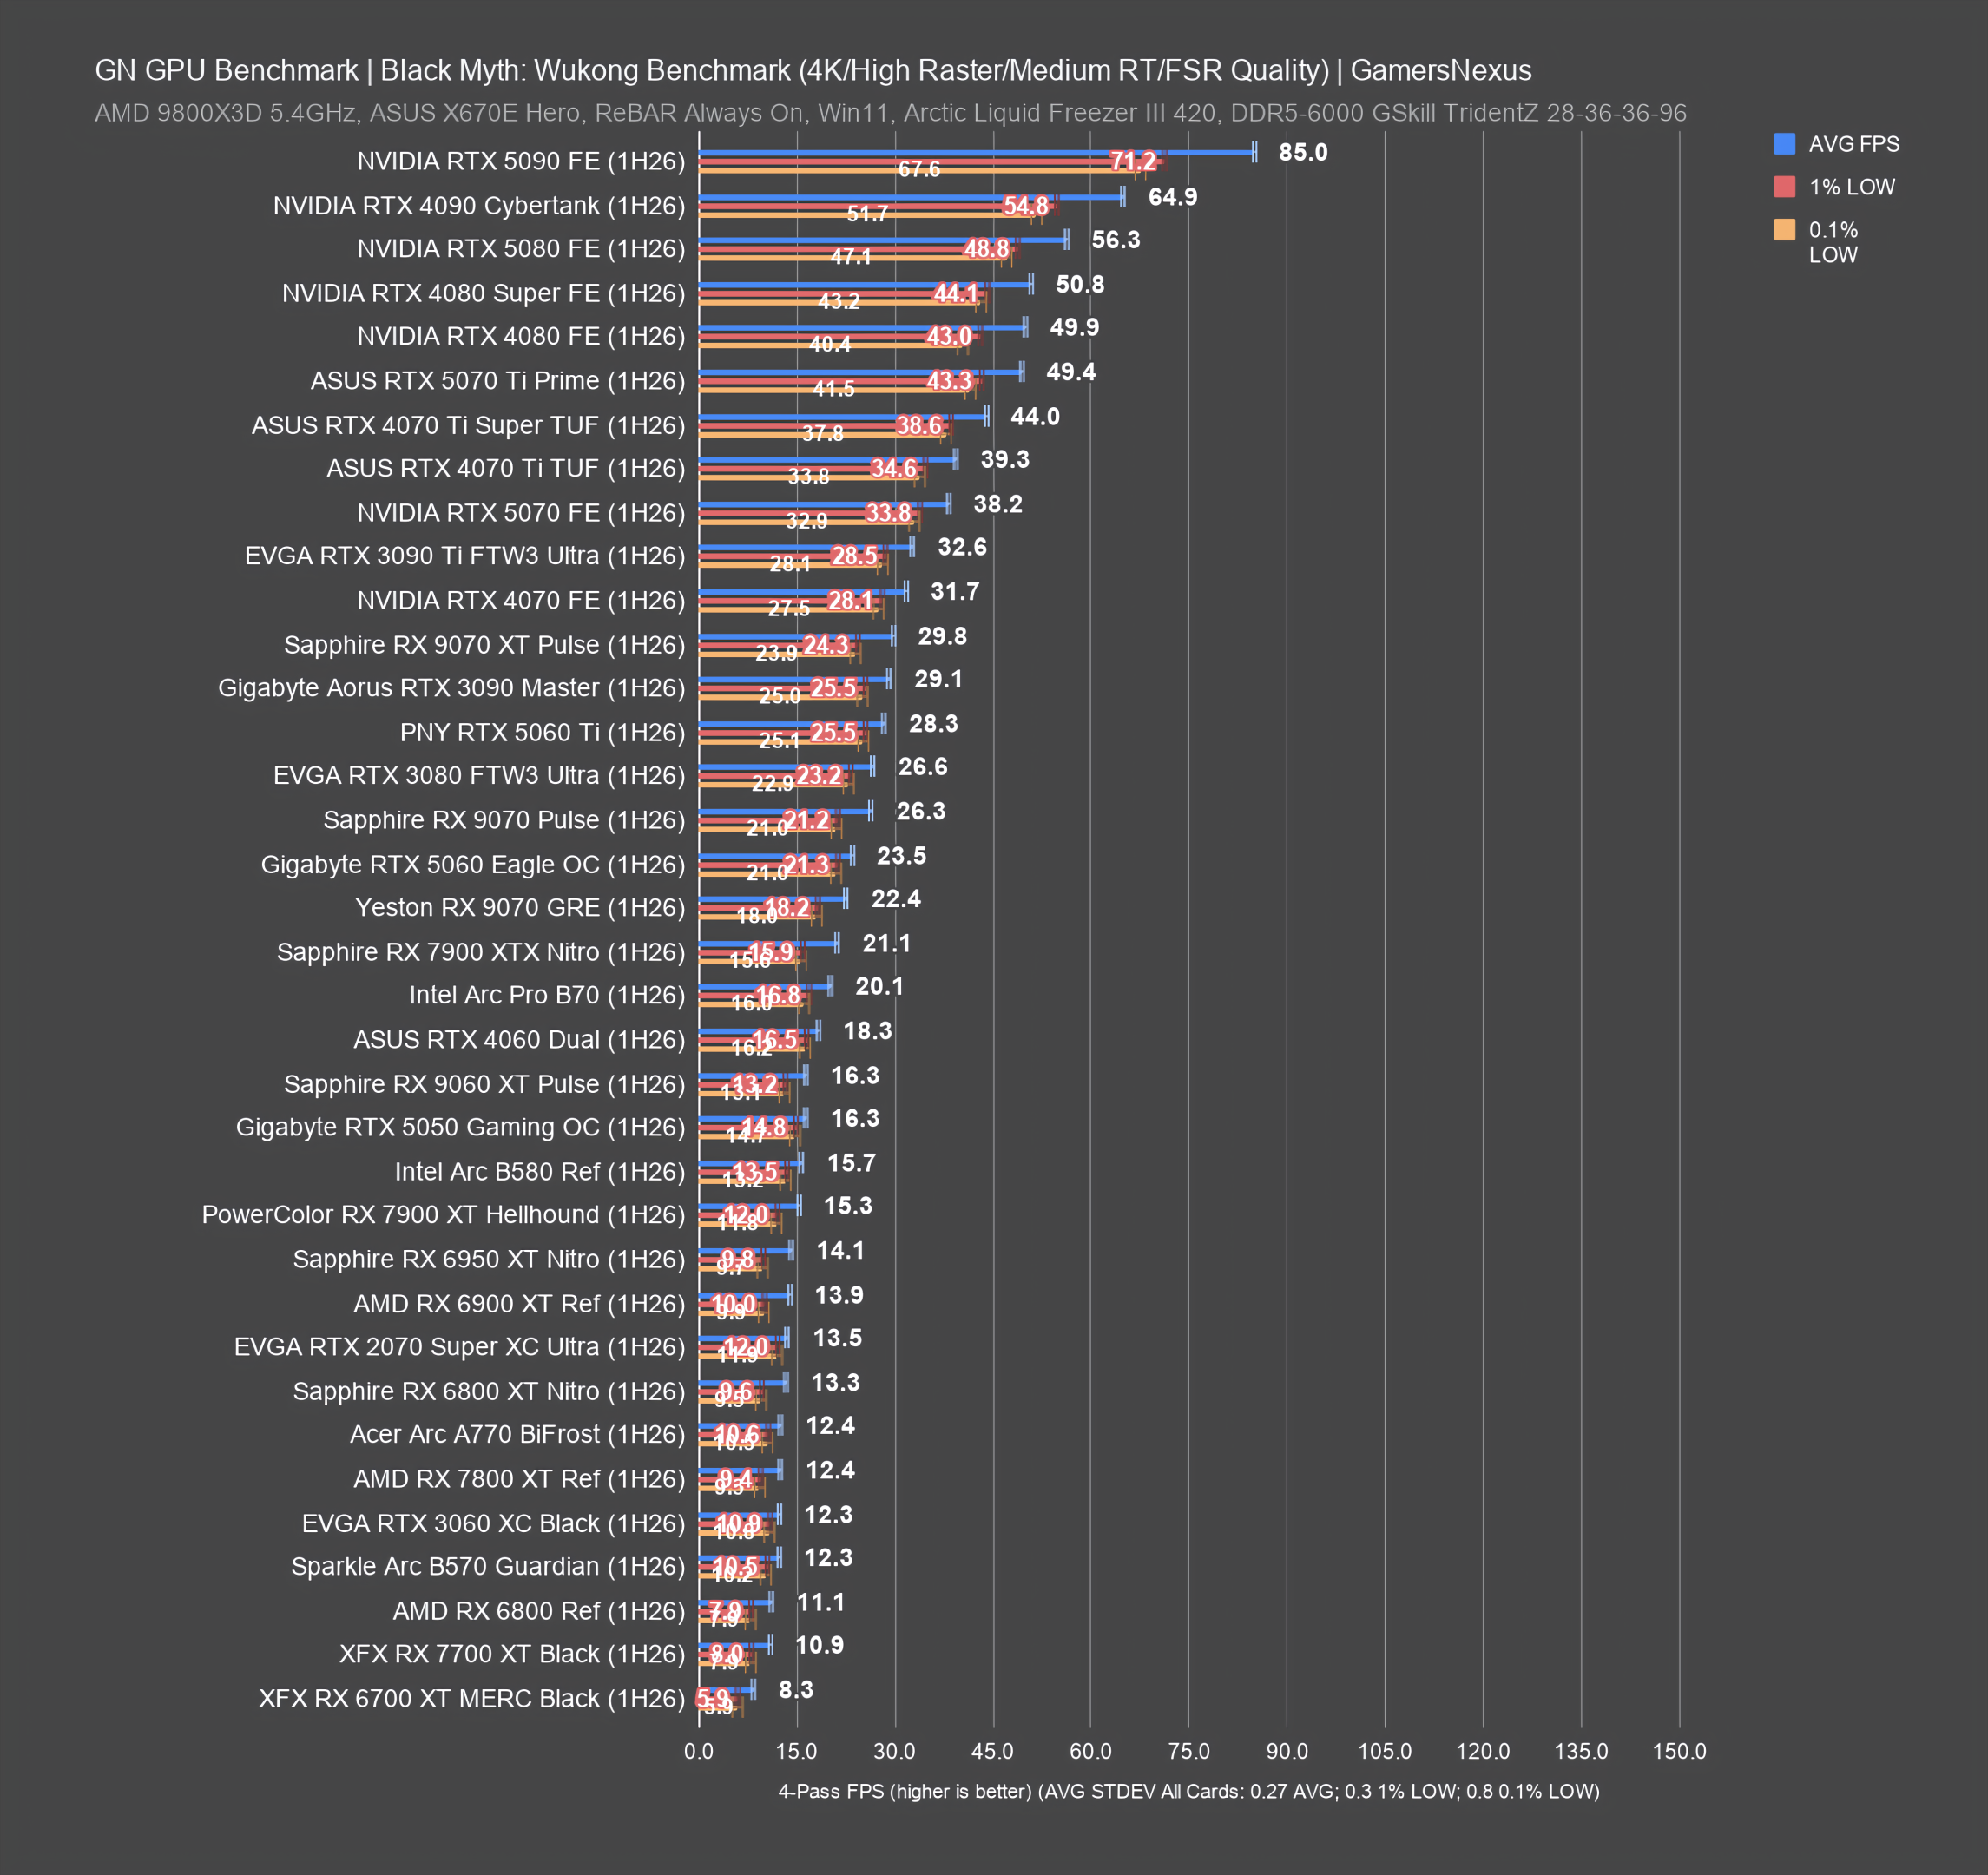
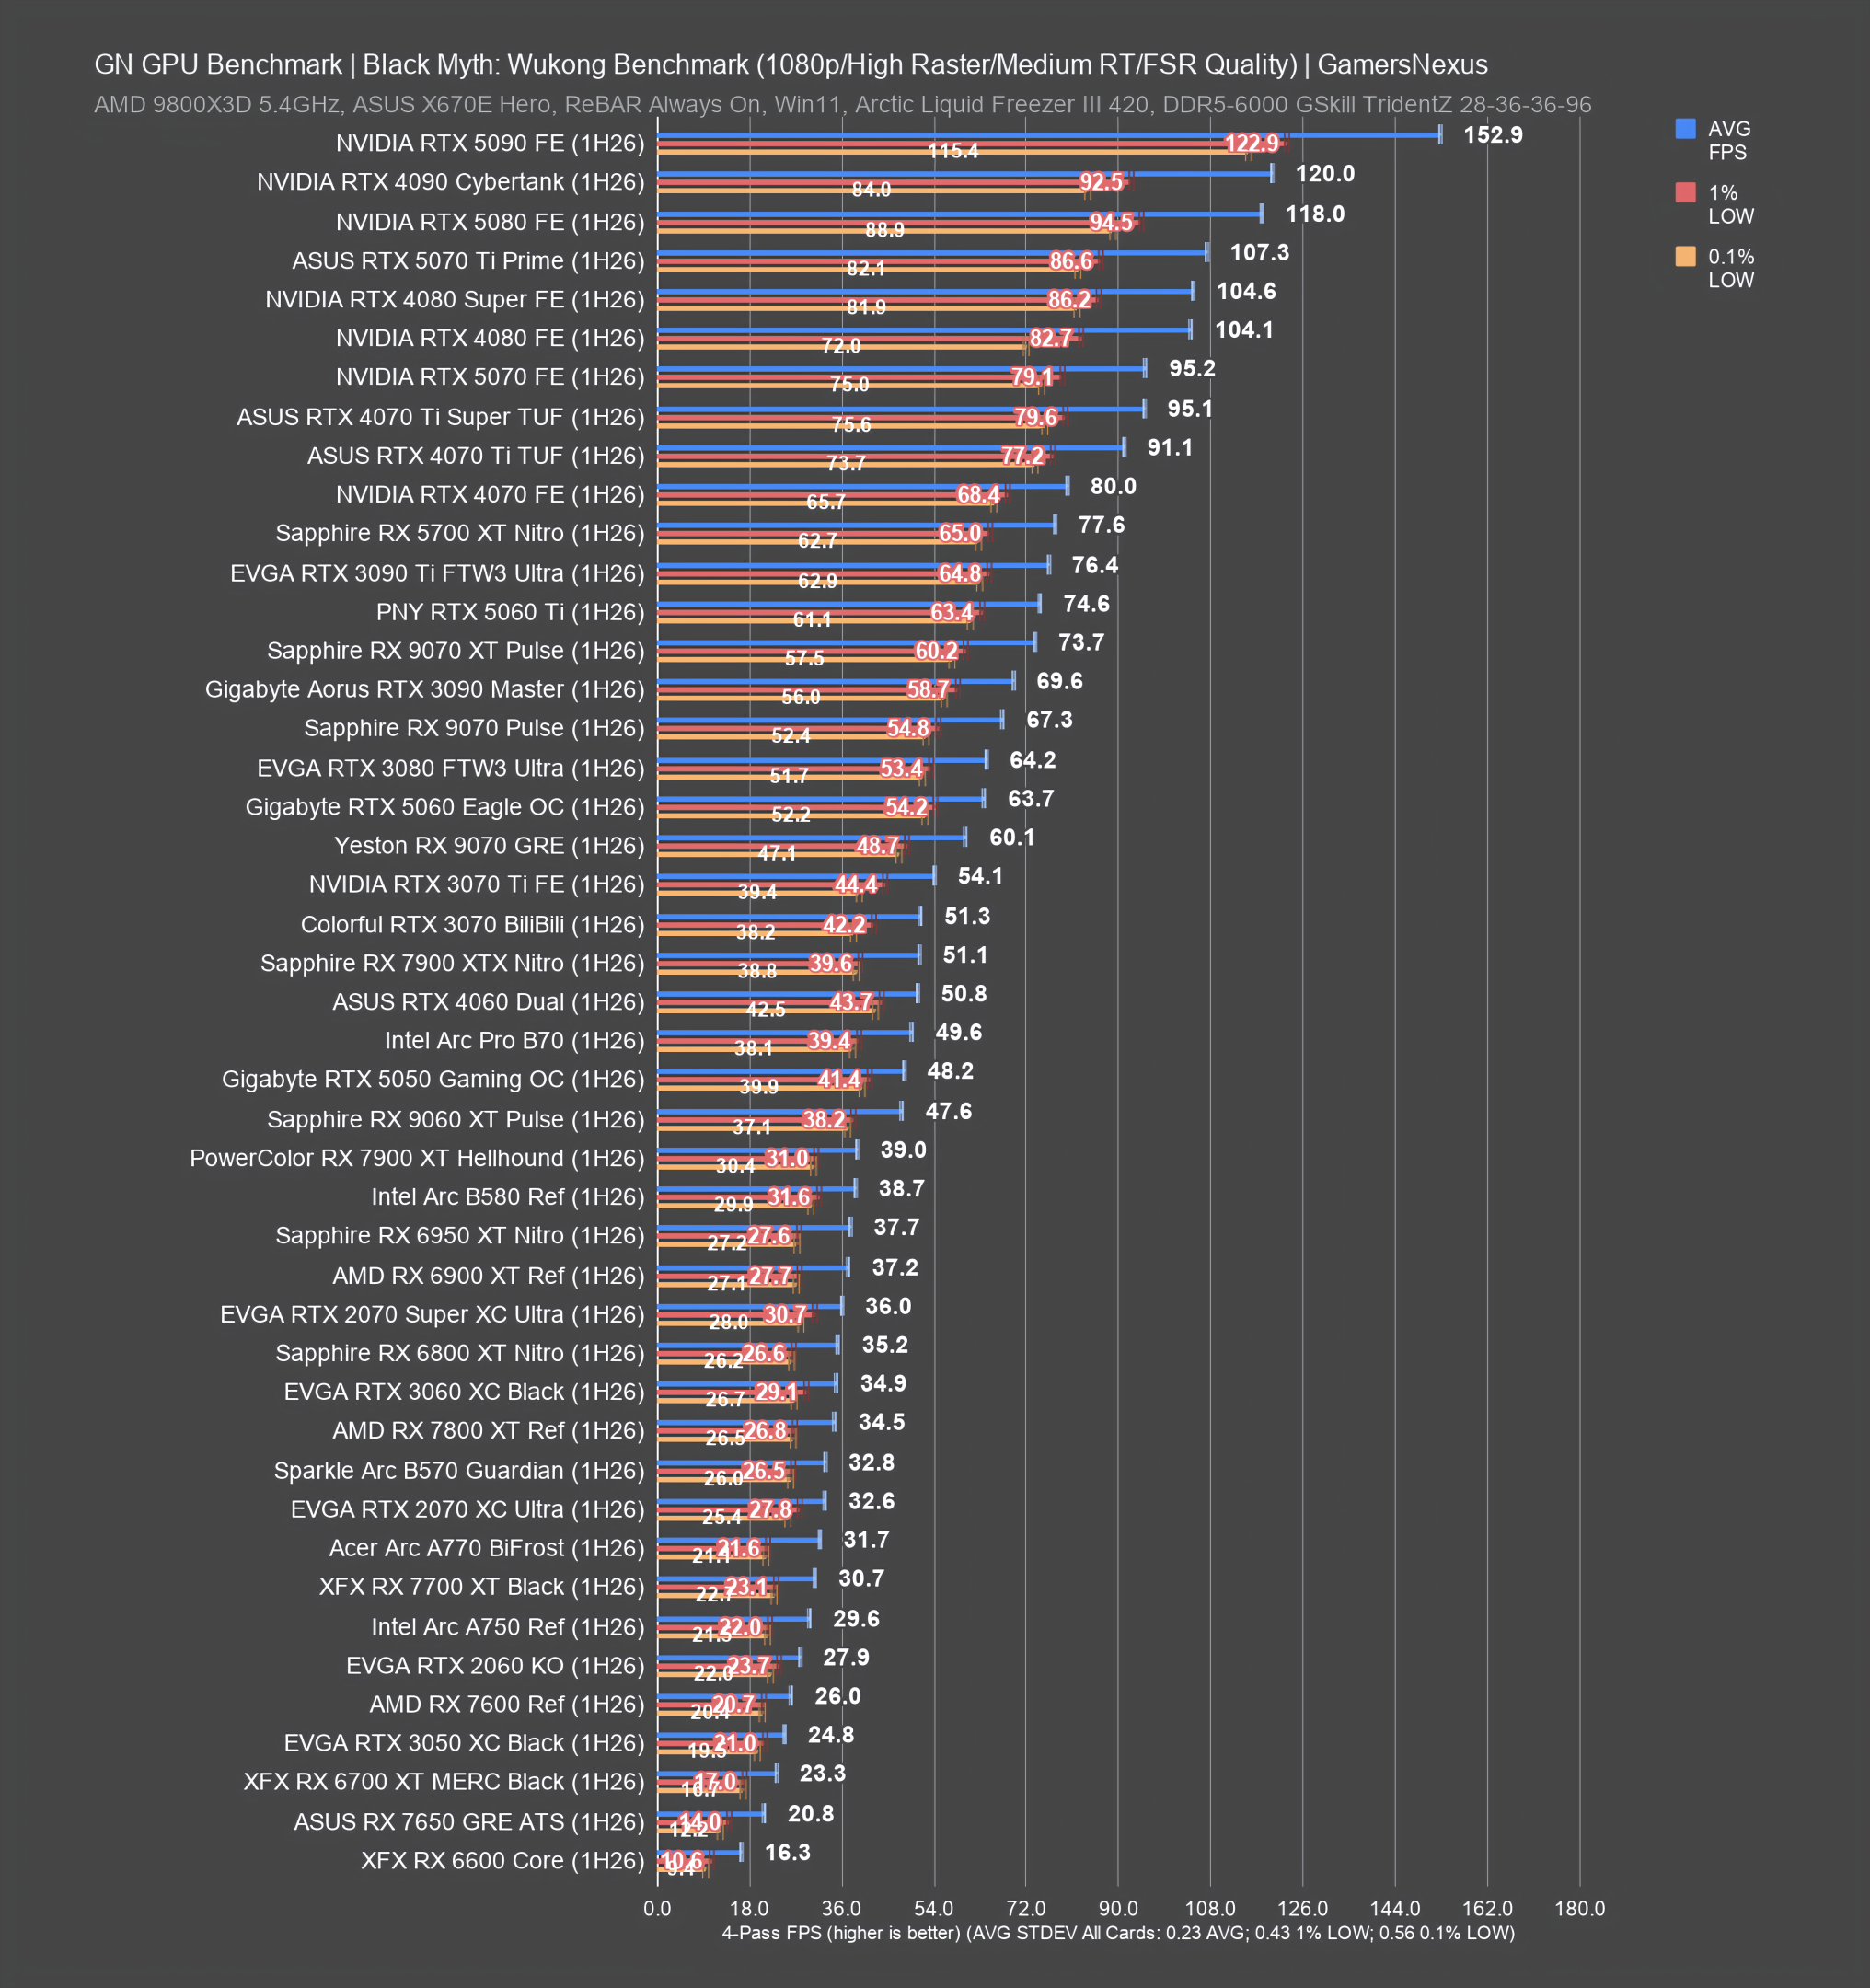
Black Myth: WuKong GPU Benchmarks & Best GPUs
The next chart looks at Black Myth: WuKong without ray tracing. This game remains one of the heaviest in our benchmark suite currently, with its ray tracing benchmarks standing as the single heaviest workload. NVIDIA is advantaged in Black Myth: WuKong (which was an NVIDIA partner title), and particularly pulls ahead disproportionately in ray tracing.
4K GPU Benchmarks
1440p GPU Benchmarks
1080p GPU Benchmarks
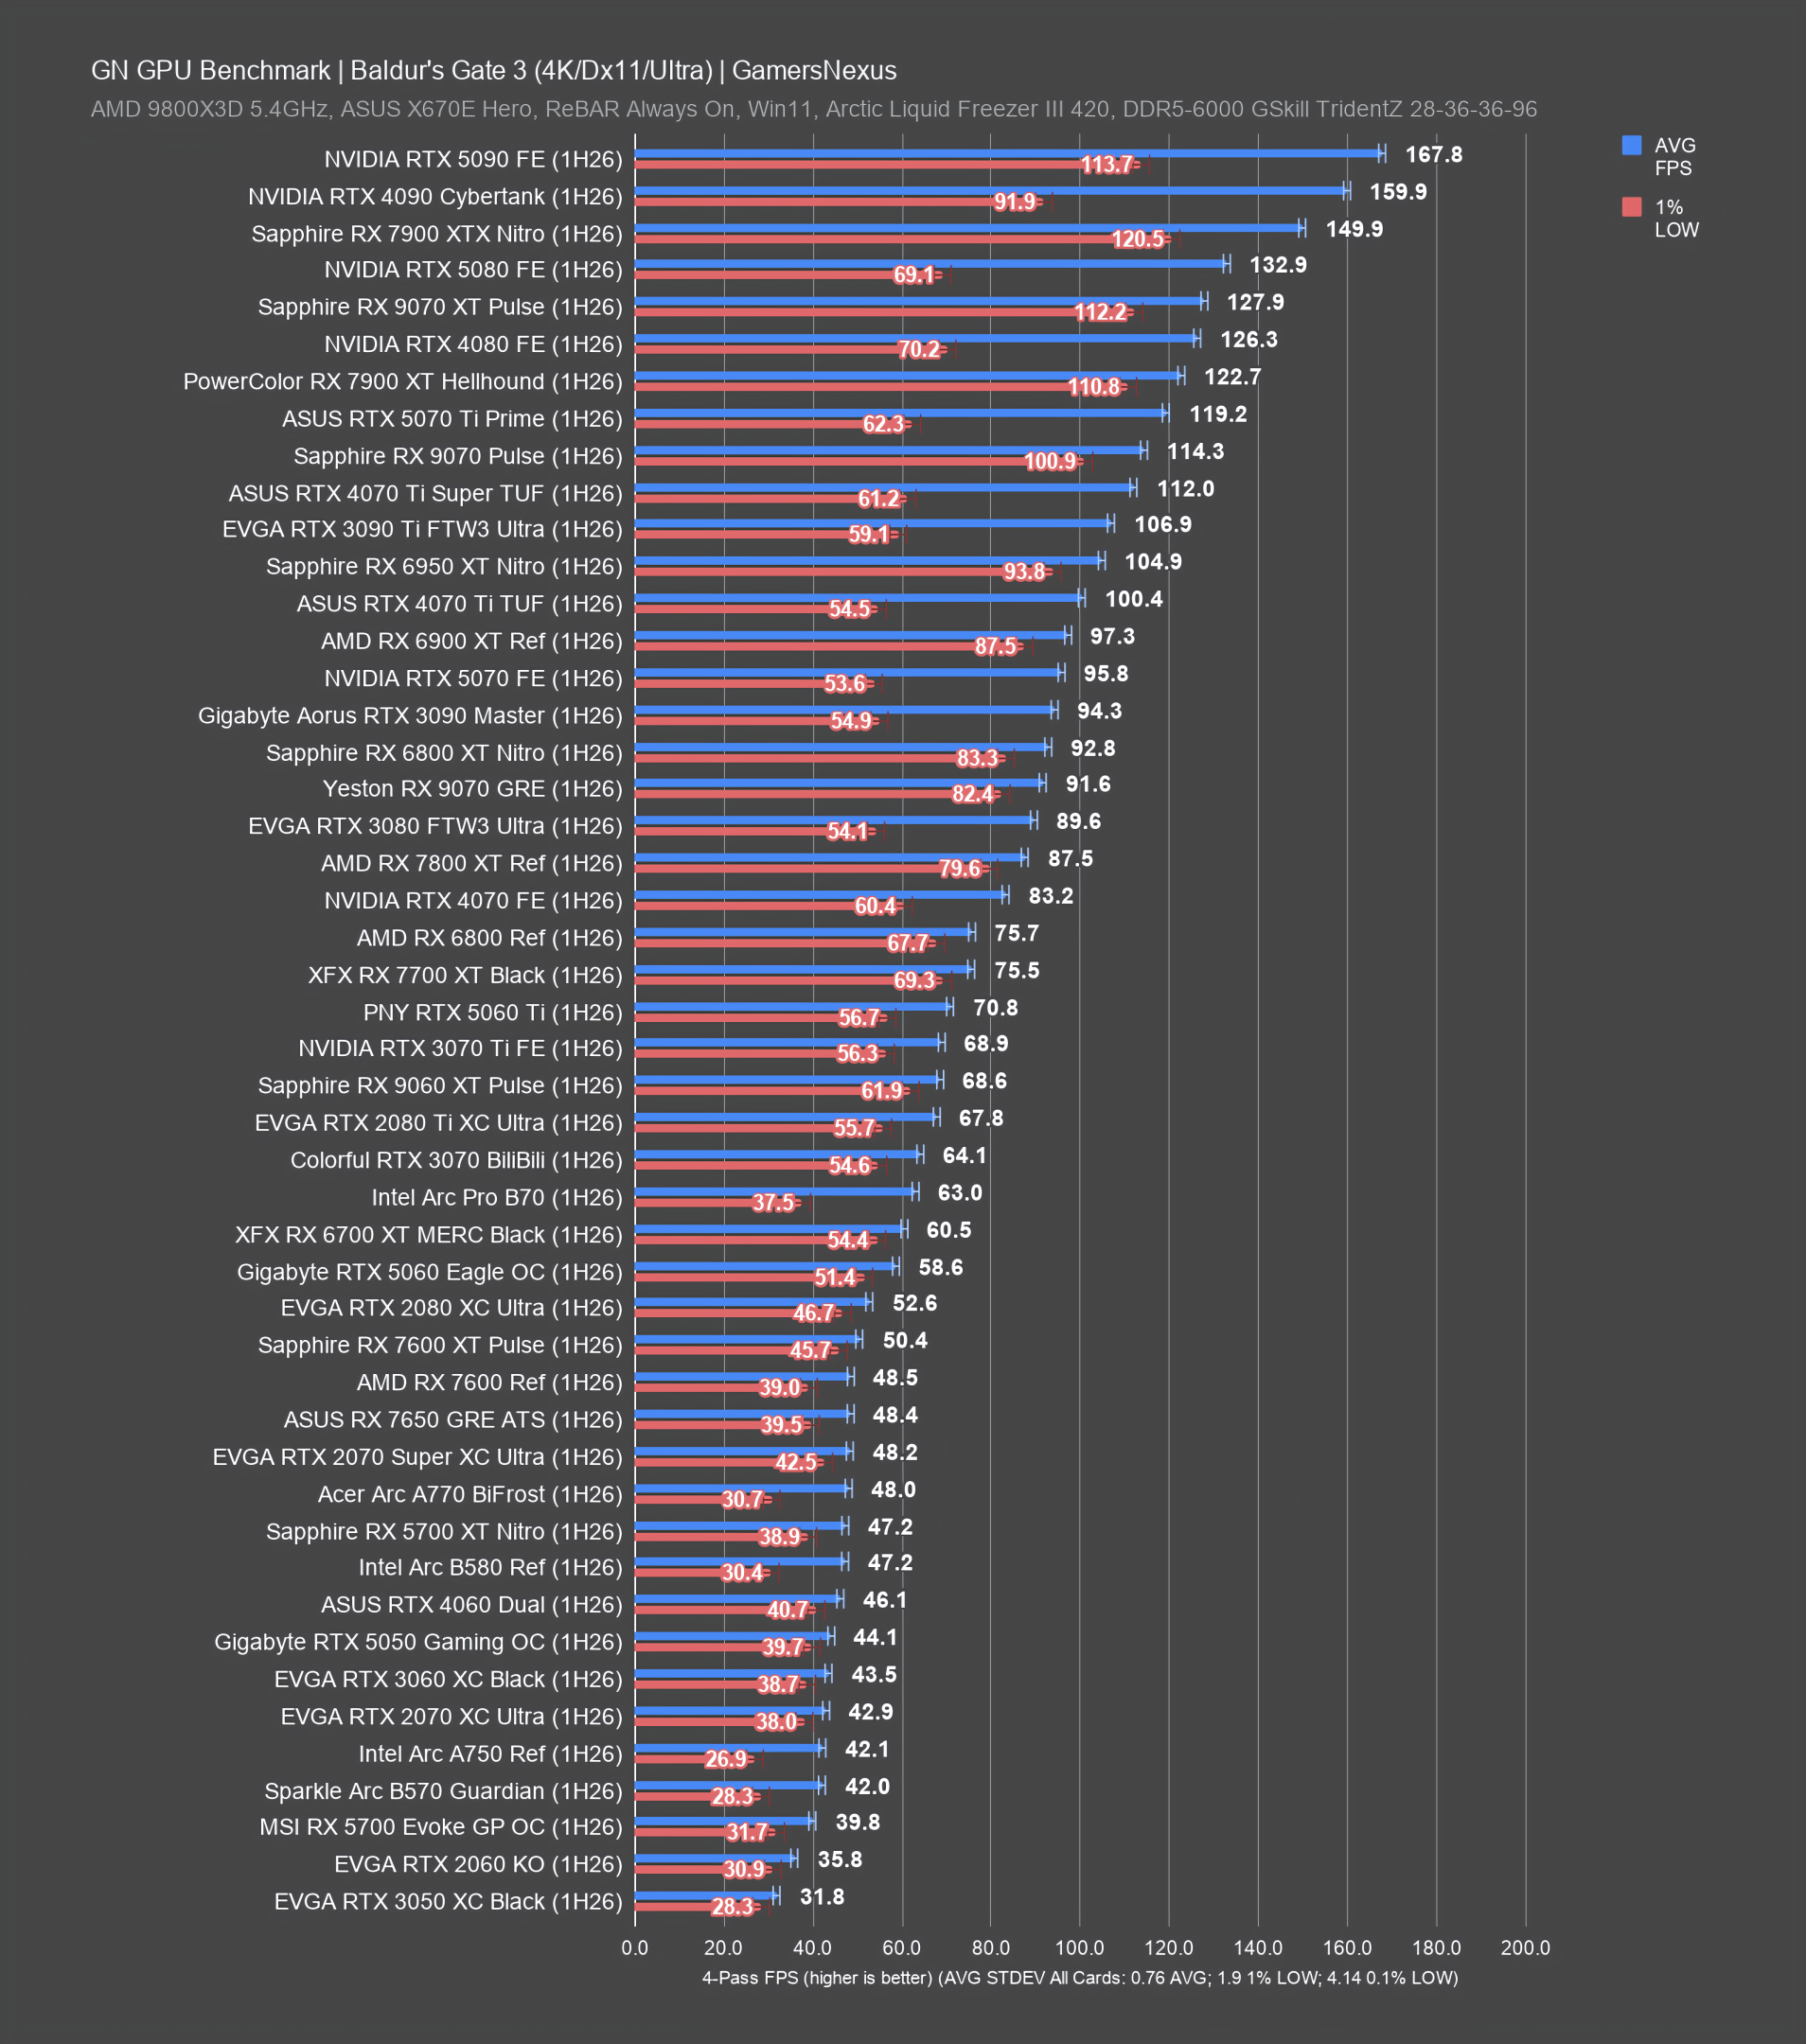
Baldur's Gate 3 GPU Benchmarks
Baldur's Gate 3 is an excellently-written RPG that received multiple awards -- and deserves them -- for its focus on making an actual game people like first-and-foremost. As a result of this approach though, the game also runs on nearly anything. BG3 has stood as a good gaming CPU benchmark and is OK for GPUs, but mostly for anything mid-range and below. There's not much reason to expect large gaps in the high-end here. At the top-end (even at 4K), you're seeing the 5090, 4090, 5080, and 4080, along with AMD's 7900 XTX, converging on a bottleneck created by other components (like the CPU -- and to some extent, the engine). We're not able to get as much test resolution on those. Broadly speaking, we've also observed lows to be somewhat scattered in this game, but broadly favoring AMD devices.
4K GPU Benchmarks
Dying Light 2 GPU Benchmarks
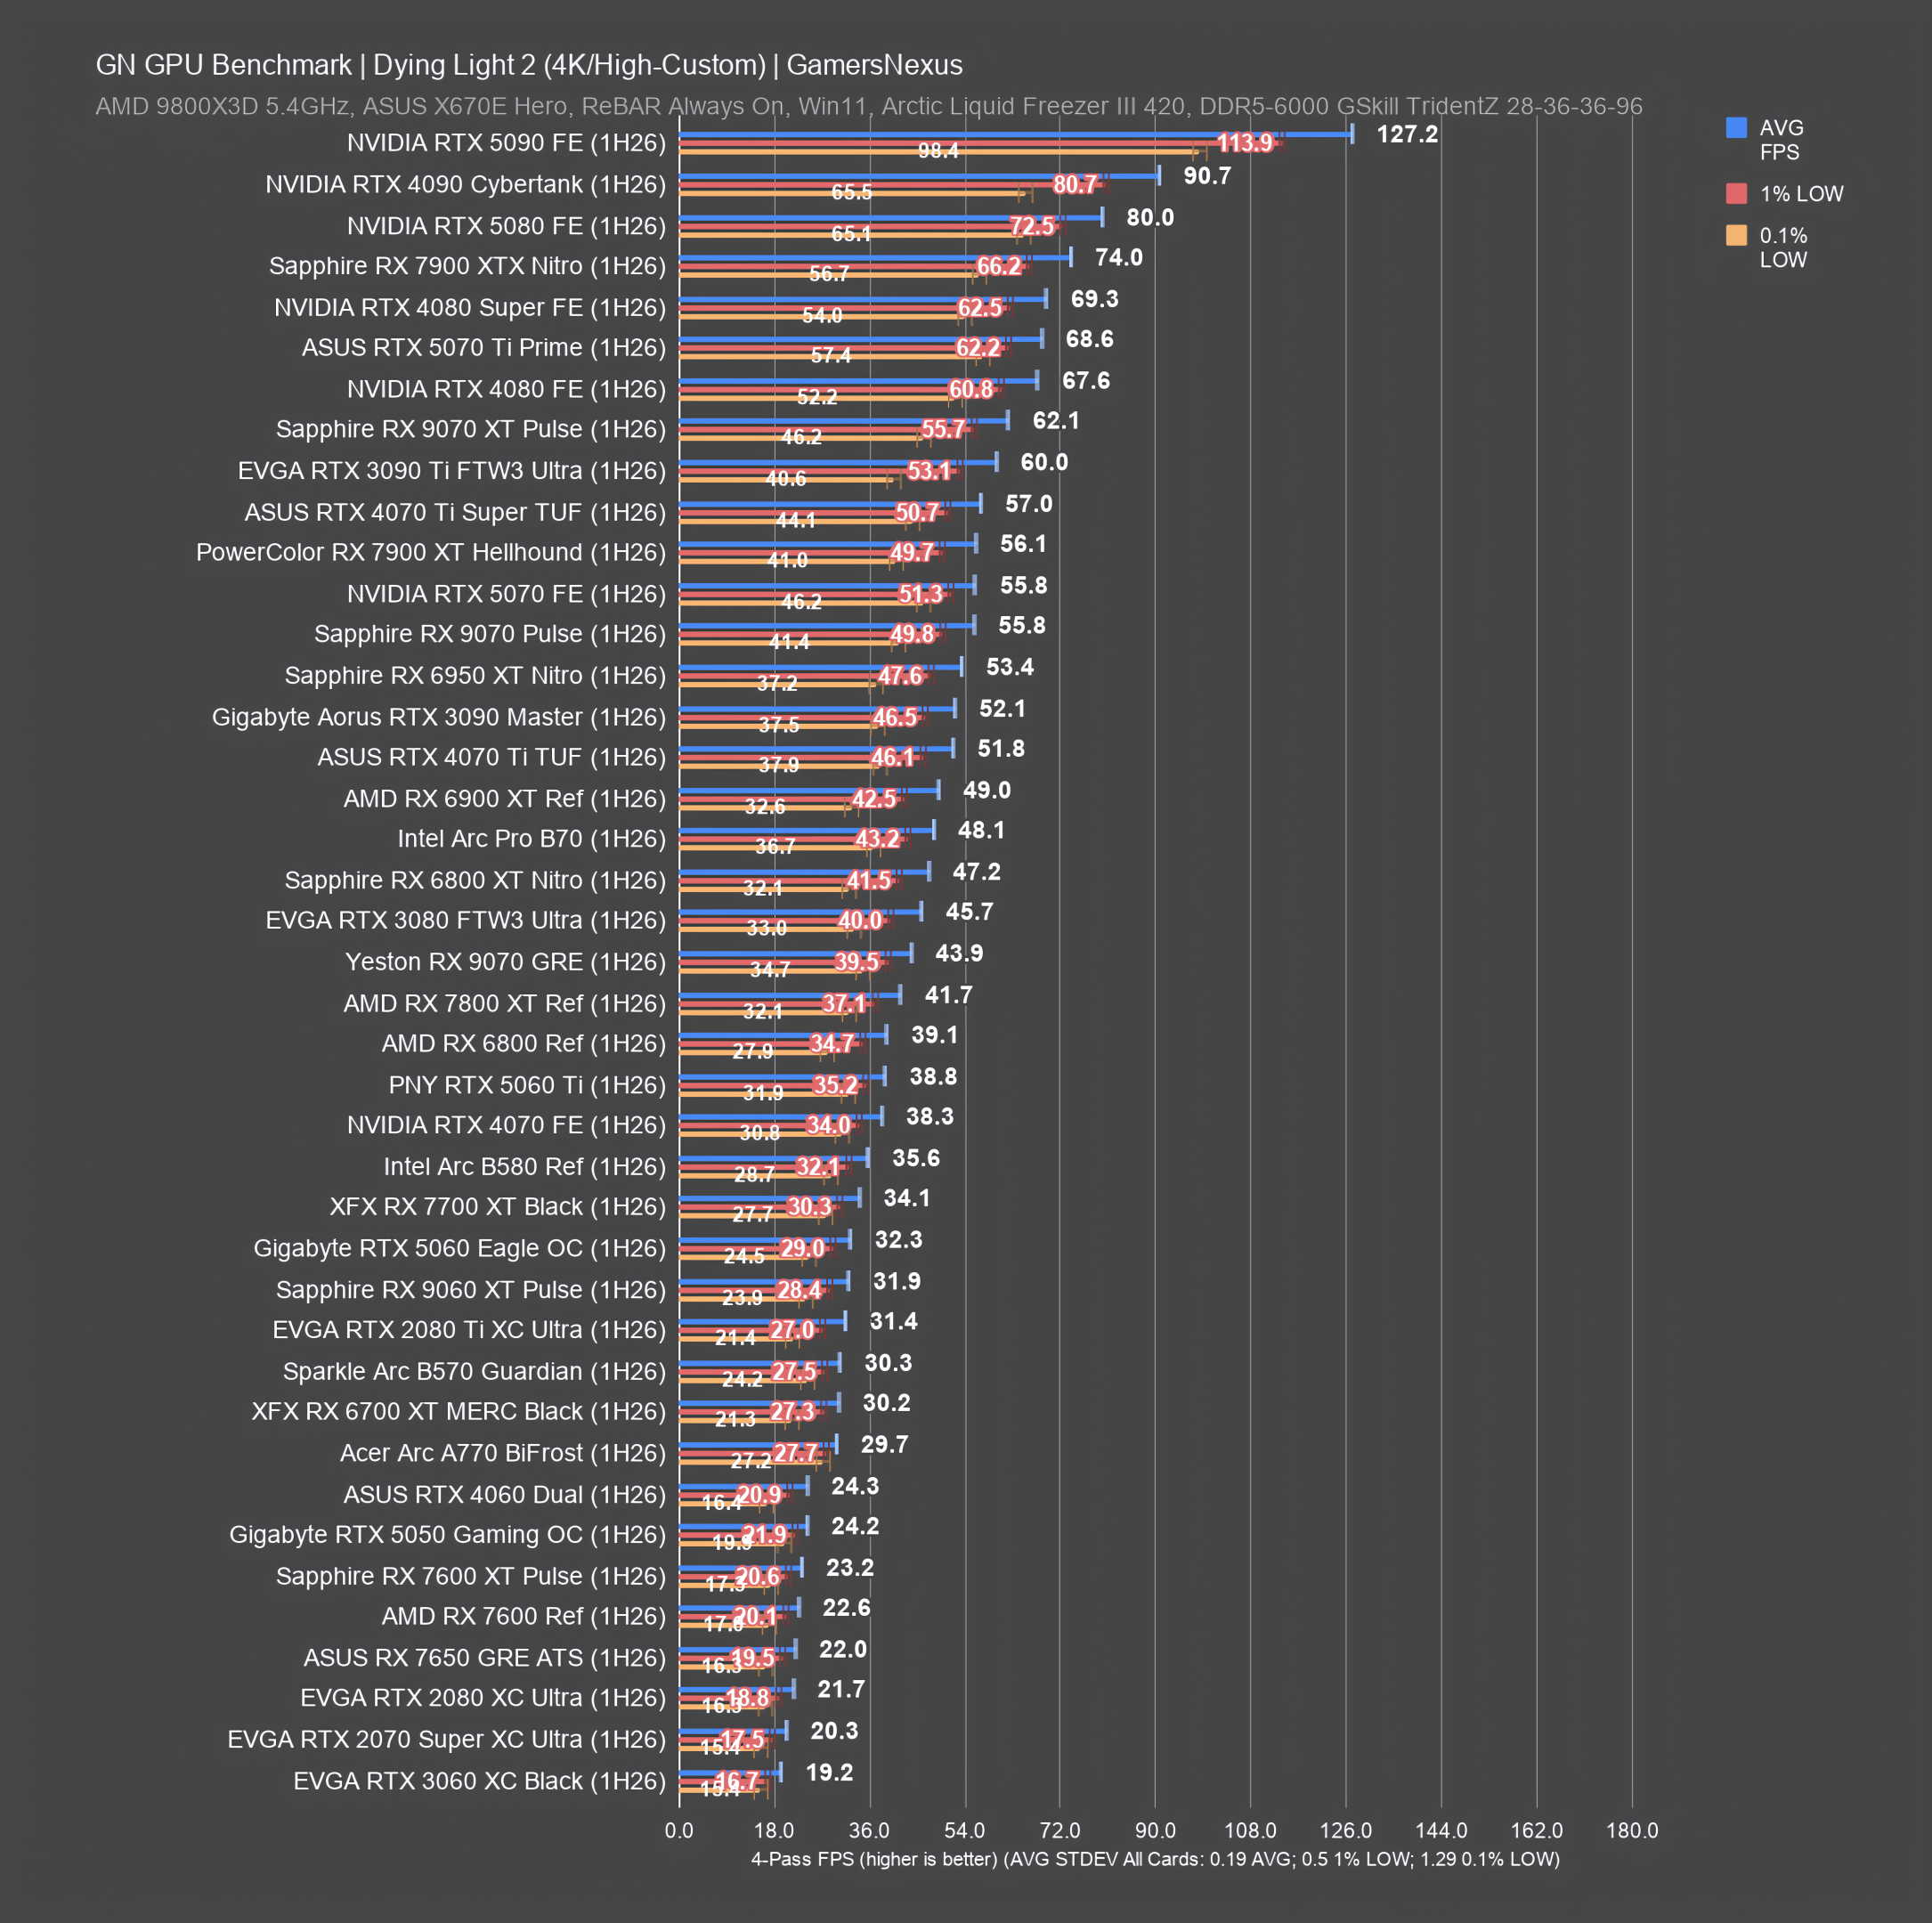
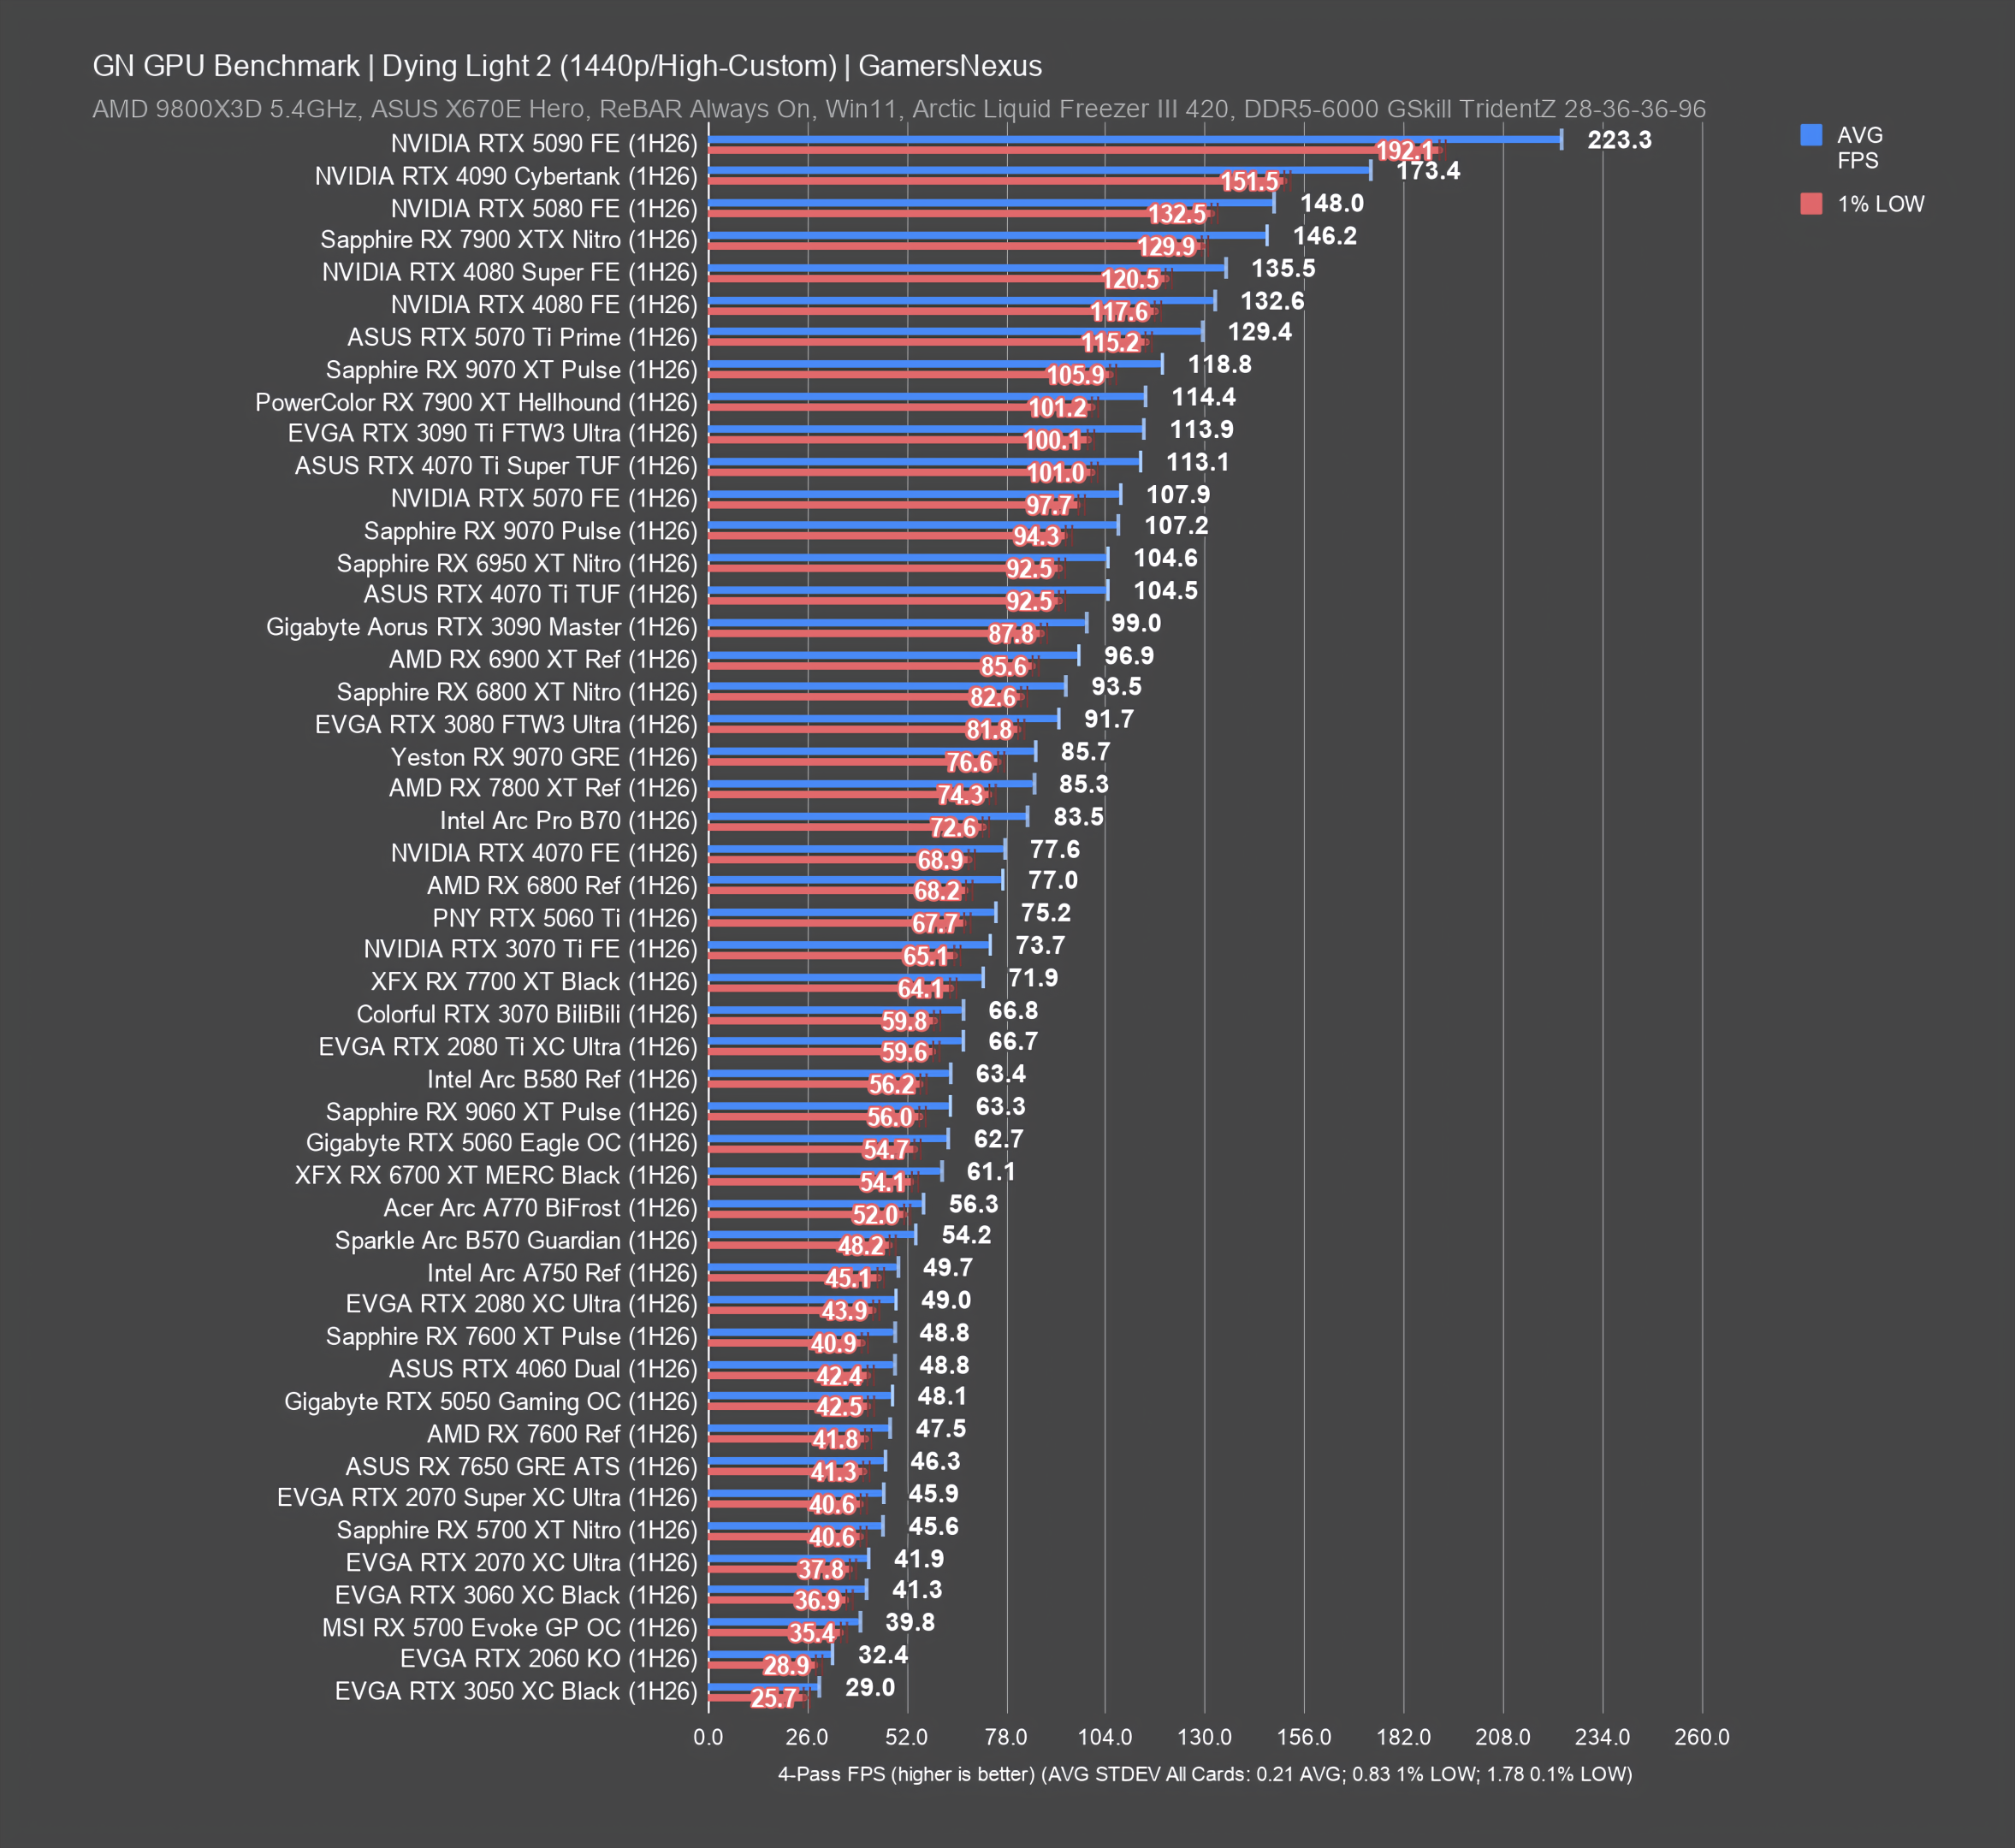
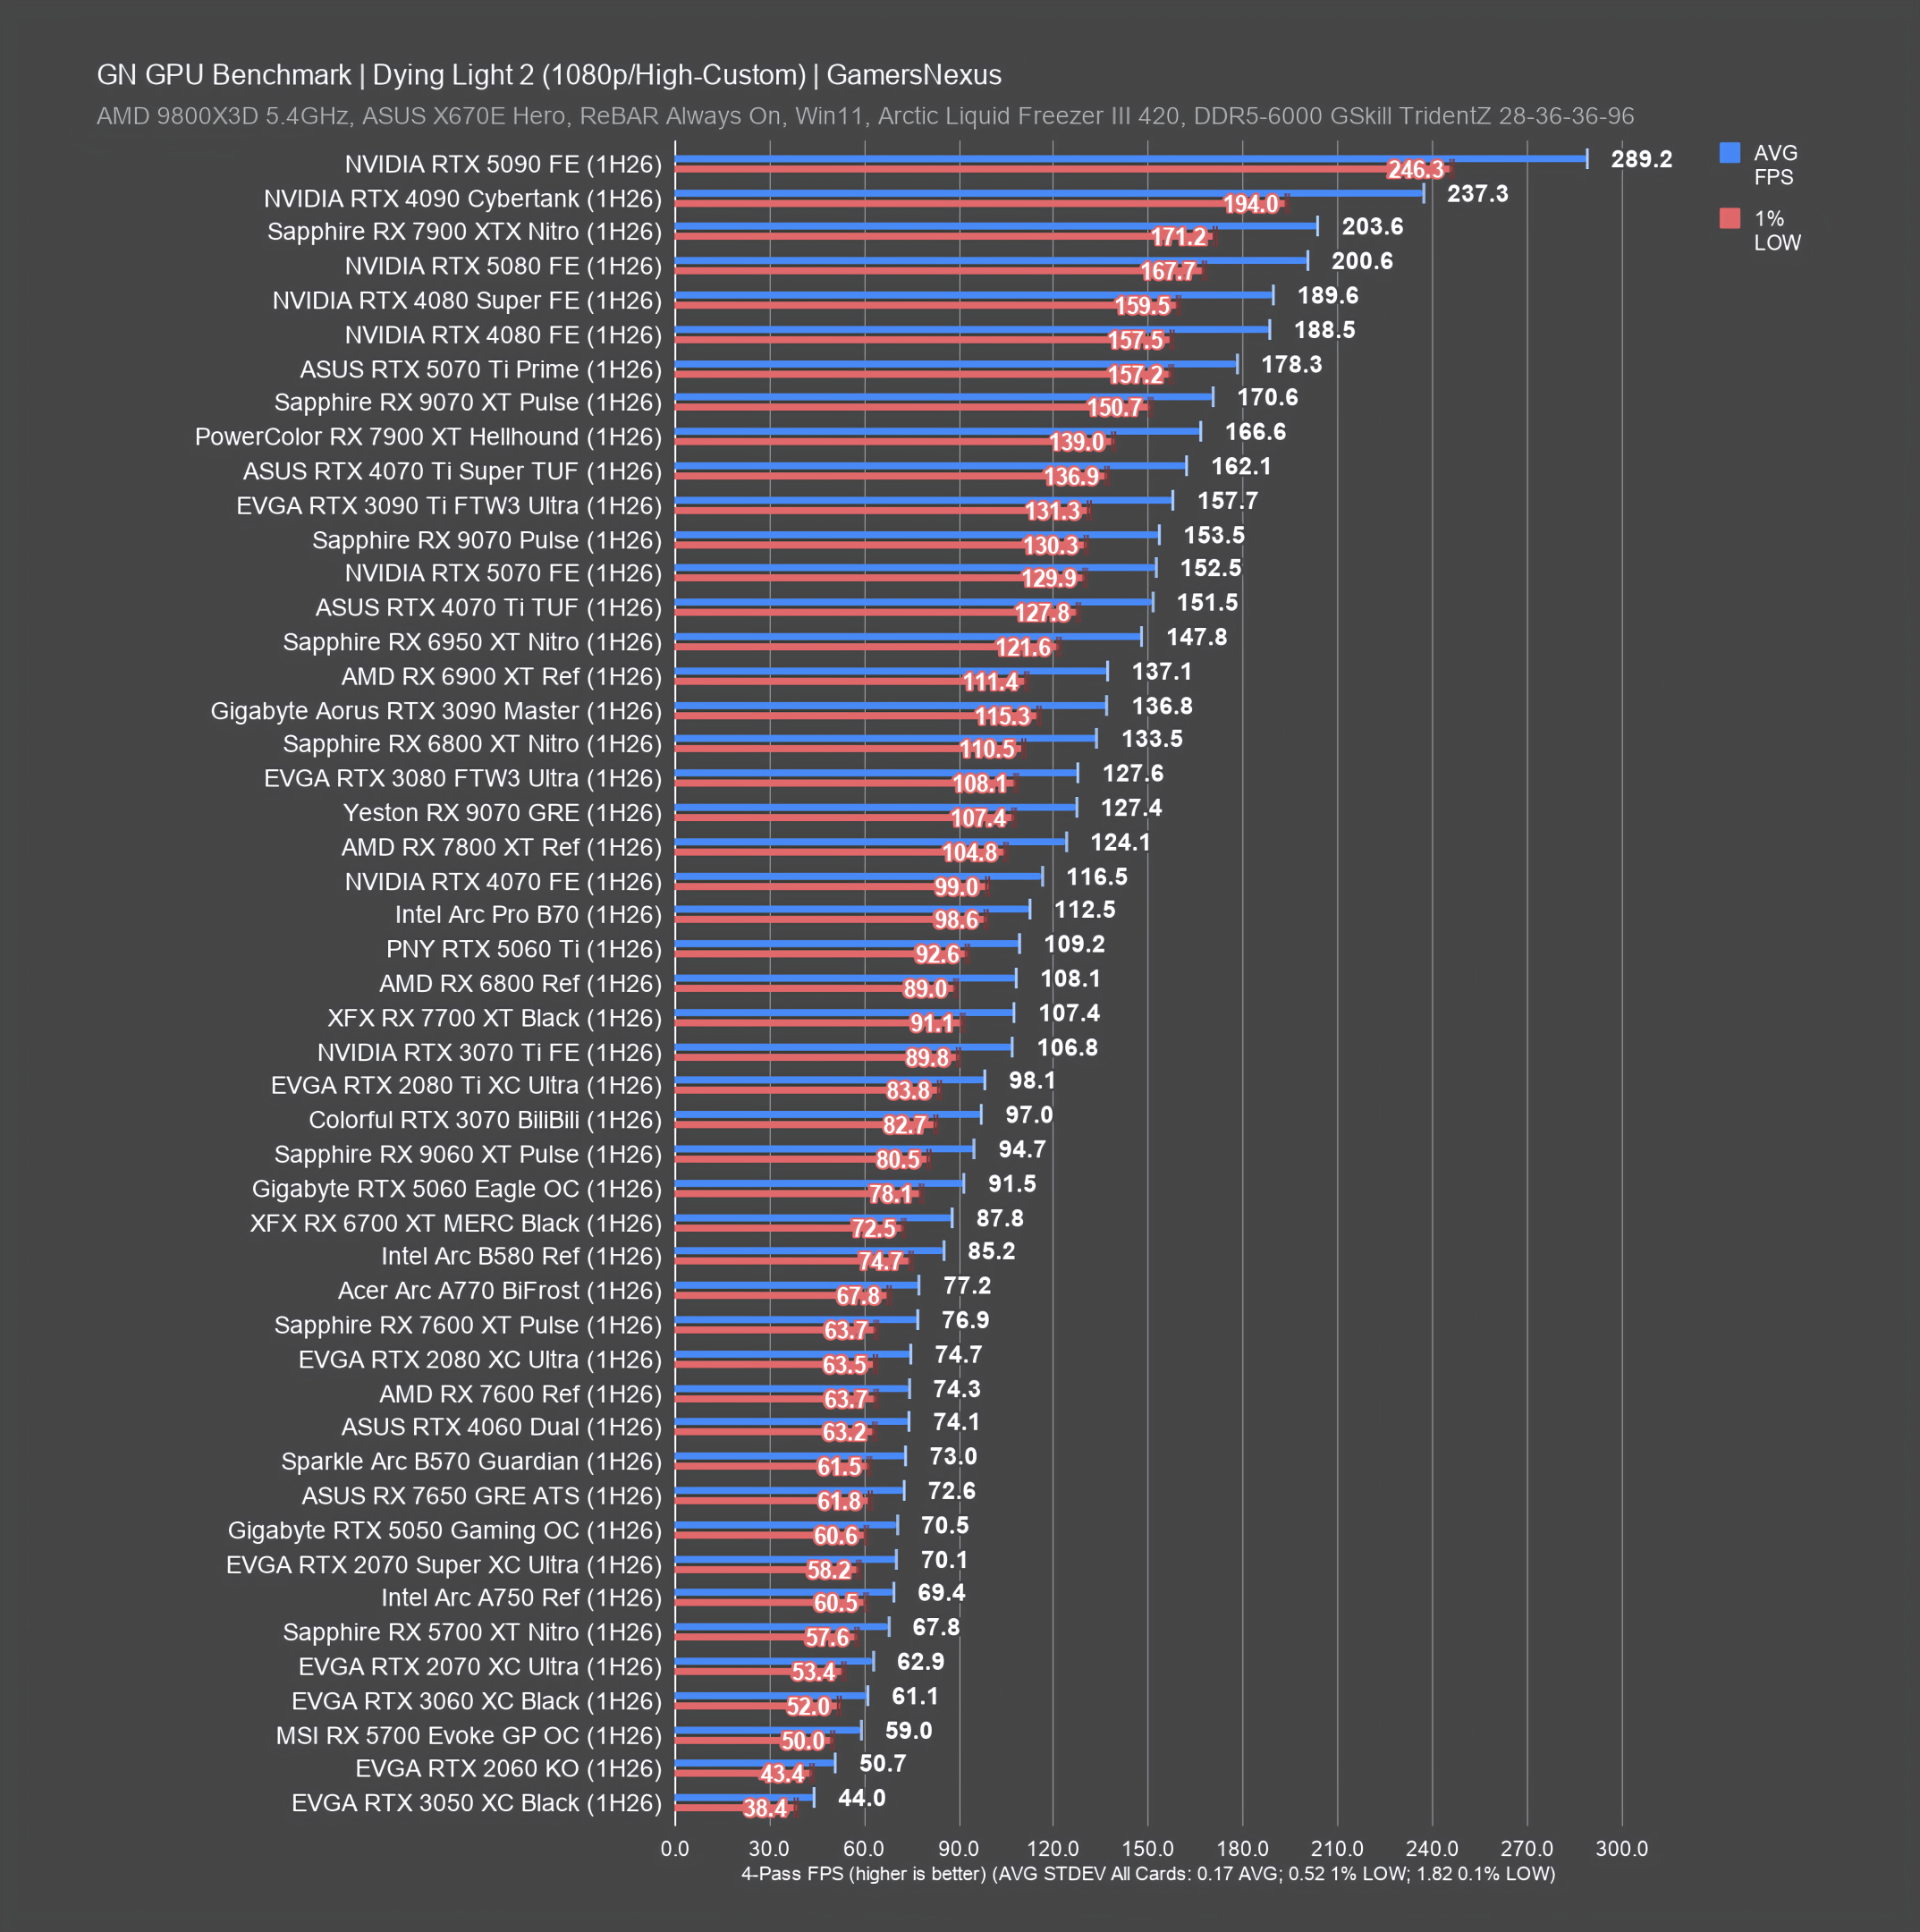
Dying Light 2 is overall heavy and has been in our benchmark suite for a long time. An upside to its age in our charts is that it features the likes of the RTX 50, RTX 40, RTX 30, and RTX 20 series, alongside AMD GPUs dating back to the RX 5700. The RTX 2060, RTX 2070, and RTX 3060 all make important appearances here on NVIDIA's side, with AMD's important older parts including the RX 5700 XT as a former flagship. Intel is also present with both Alchemist and Battlemage GPU architectures, including the B580, B570, A770, and A750.
4K GPU Benchmarks
1440p GPU Benchmarks
1080p GPU Benchmarks
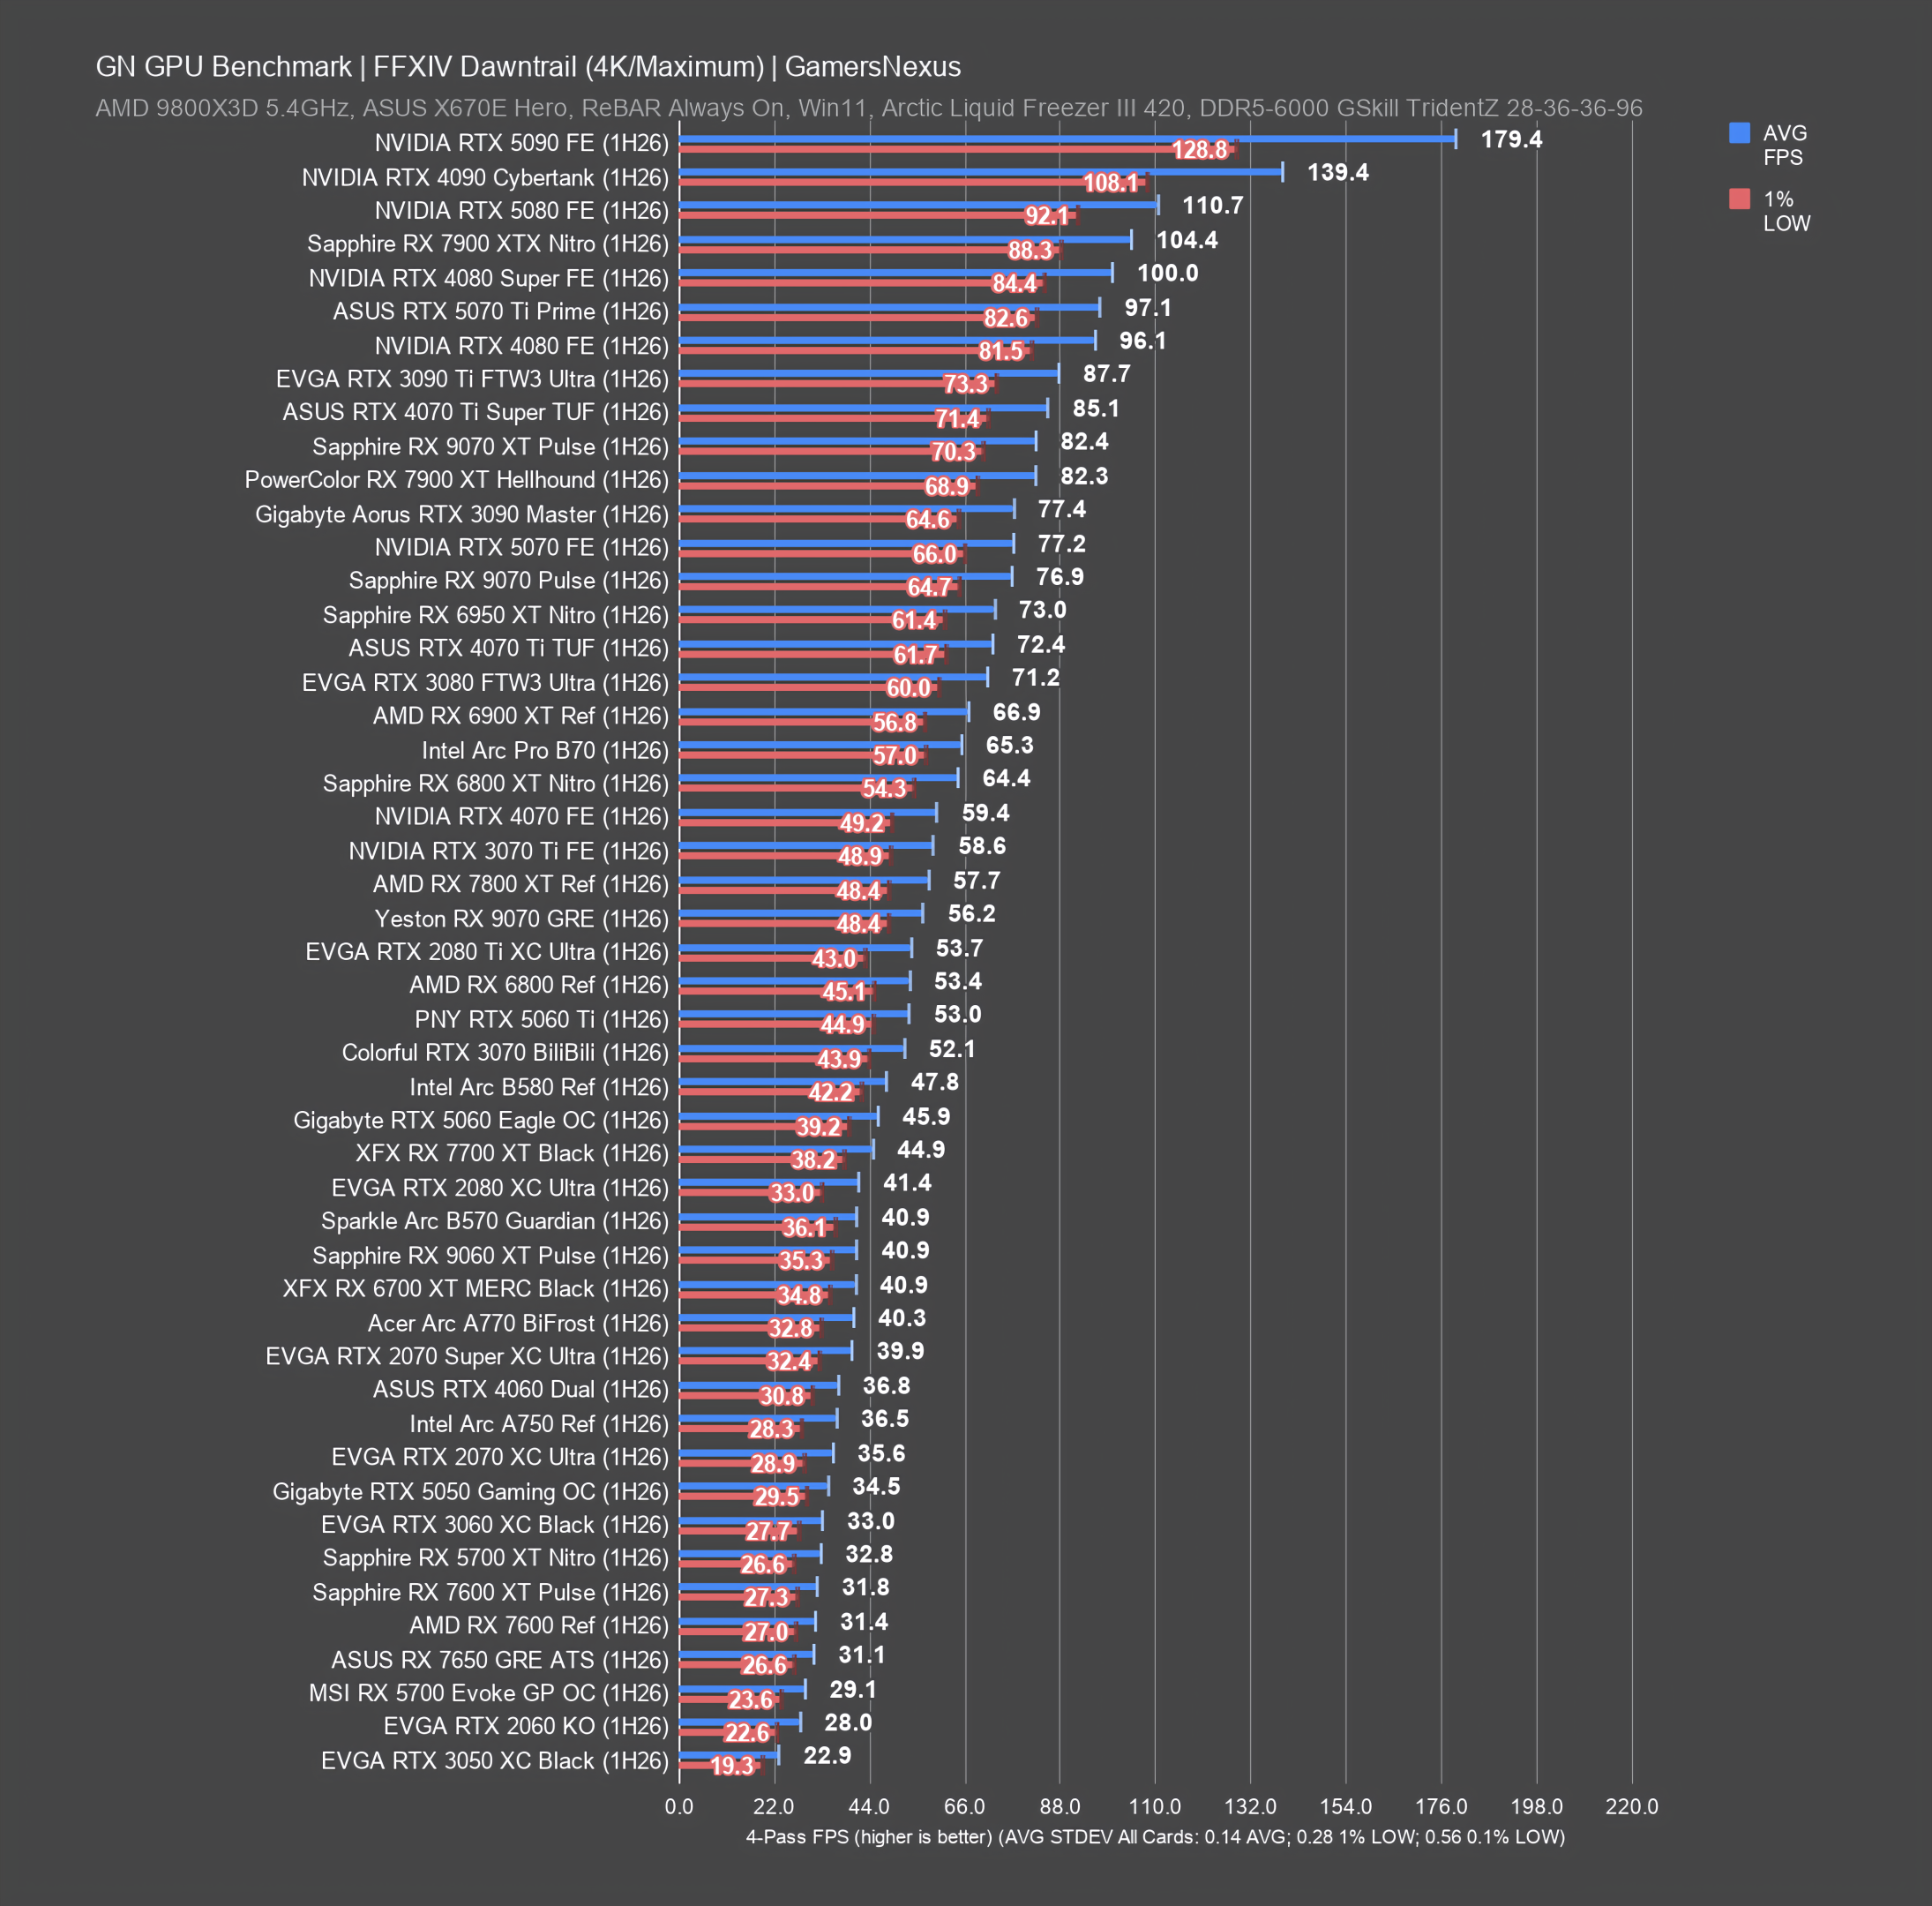
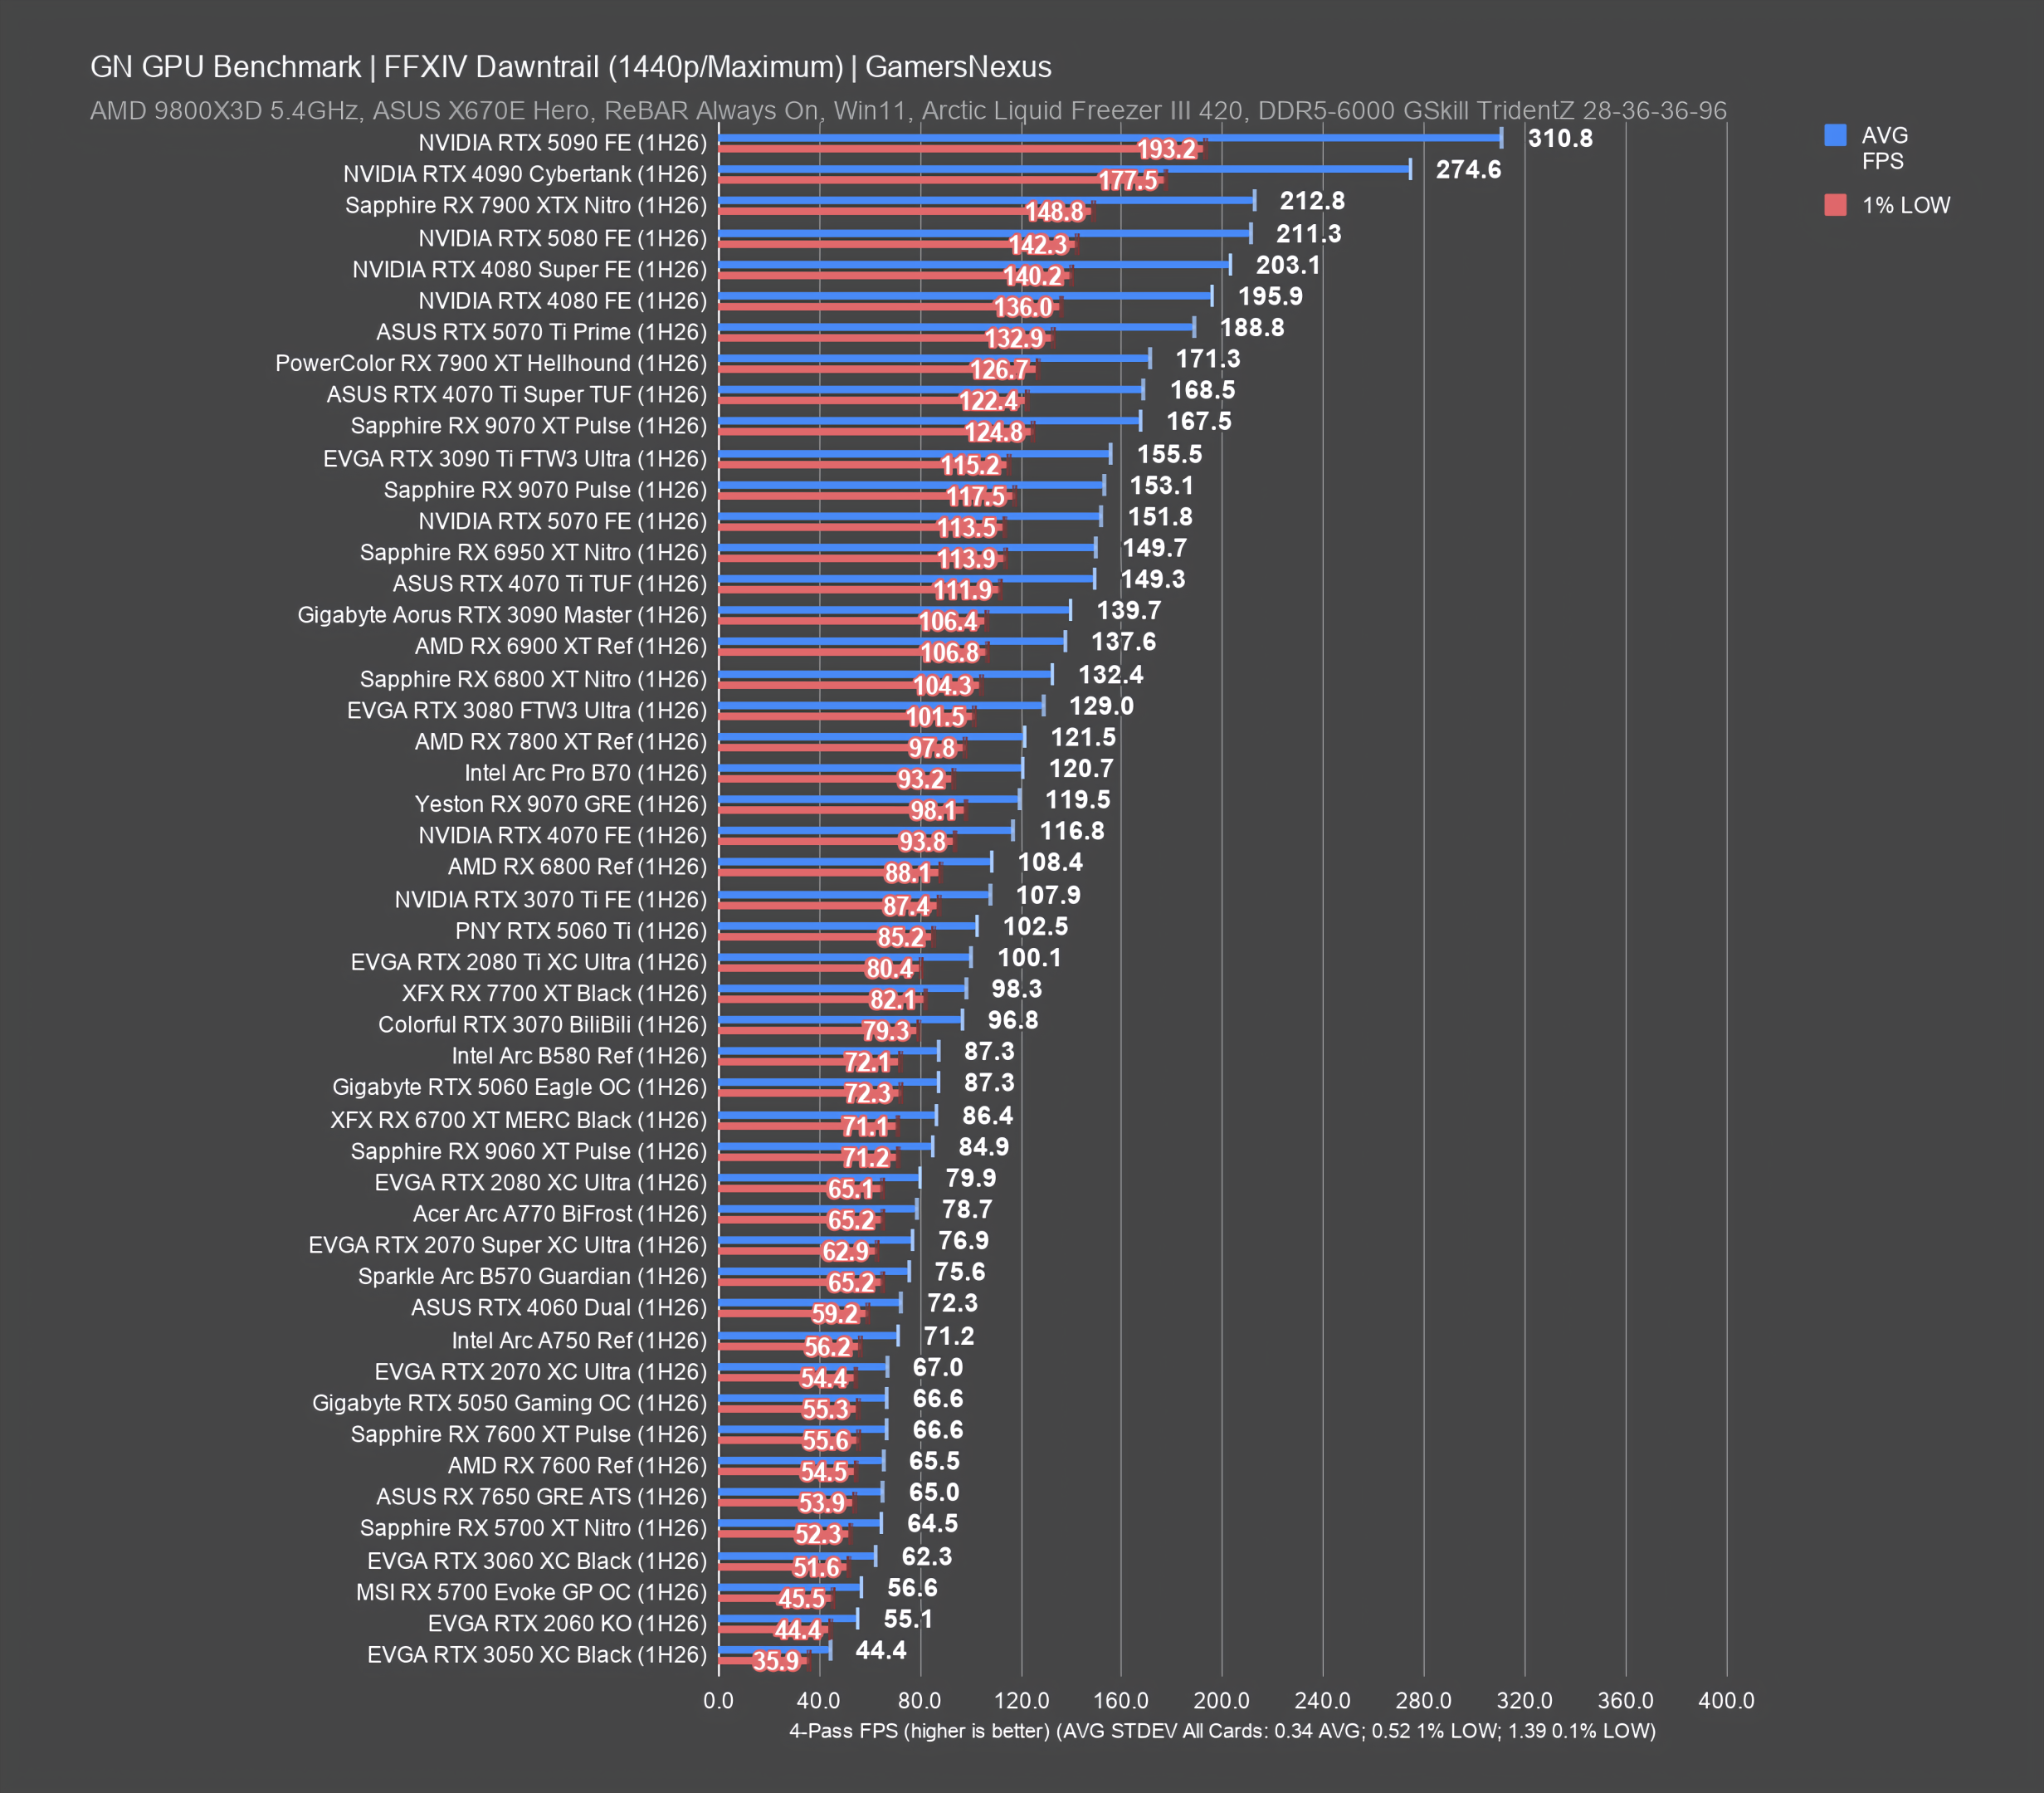
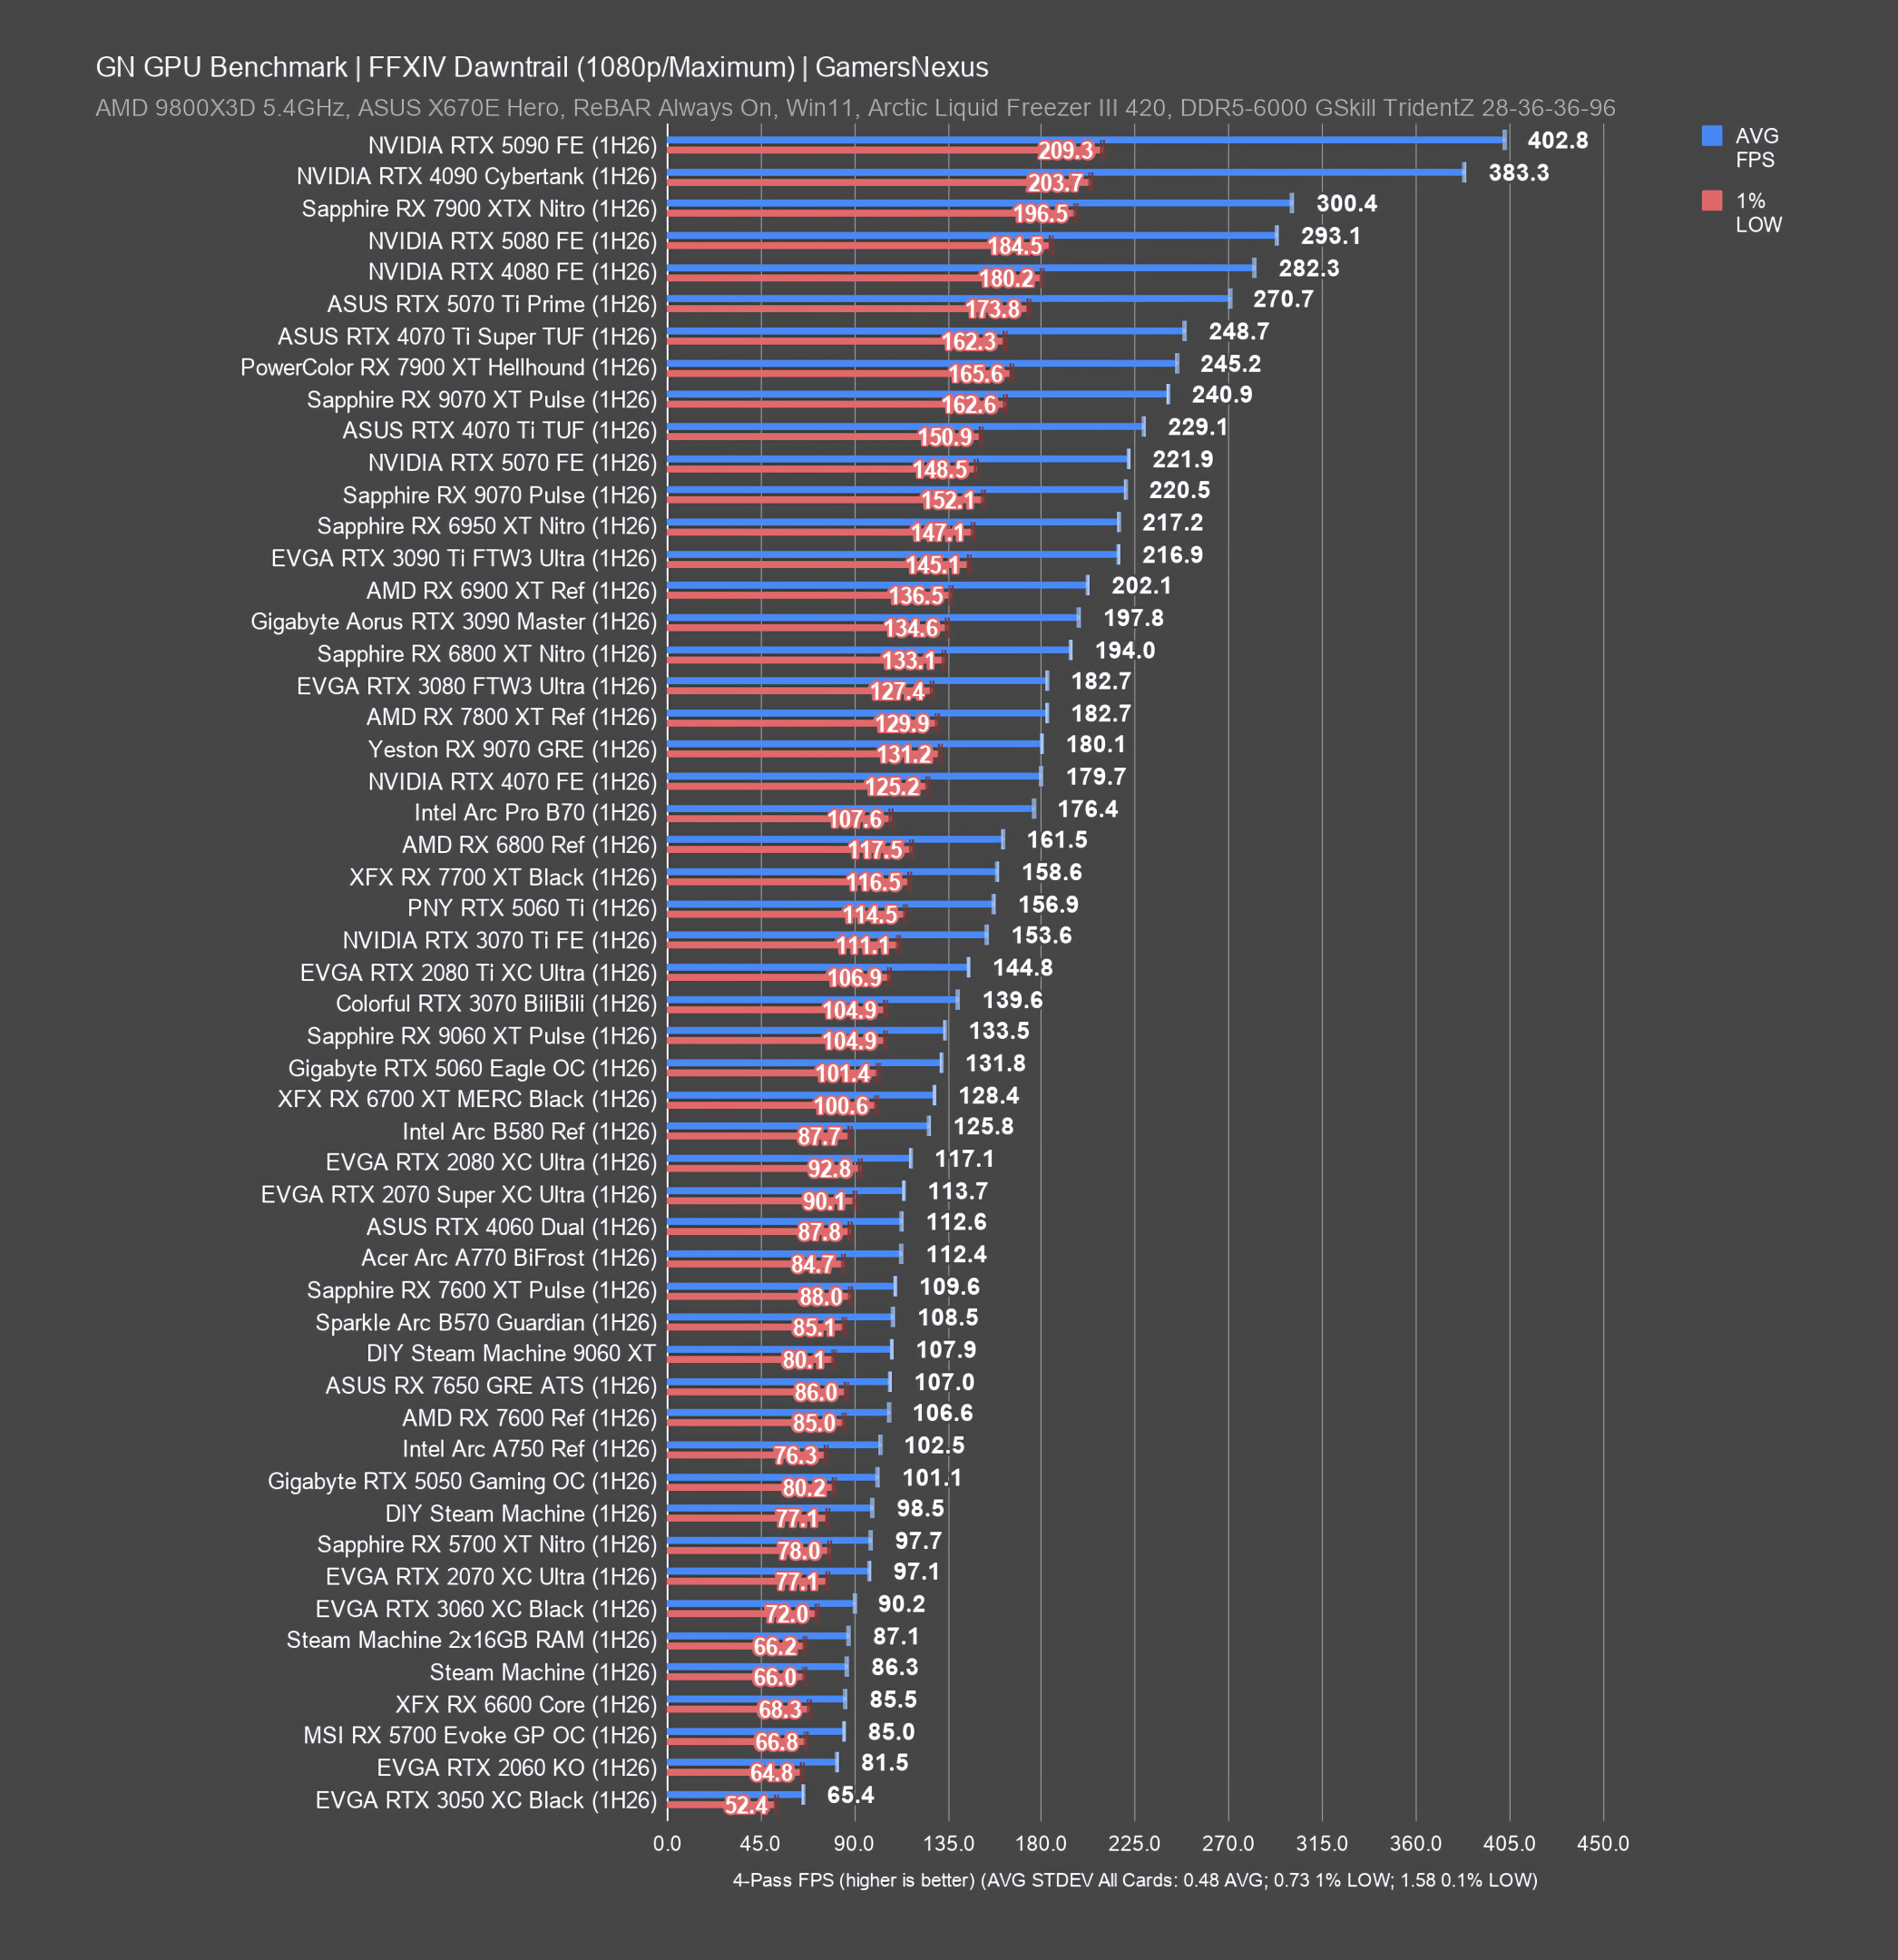
FFXIV: Dawntrail Benchmarks
Final Fantasy 14 (XIV) Dawntrail is up next, tested using the standalone benchmark tool at 4K, 1440p, and 1080p. This testing also goes back to the NVIDIA RTX 2060 and AMD RX 5700. The testing is more recent (in our 1H26 data suite), but games that have been on our benchmark roster longer are easier to run.
4K GPU Benchmarks
1440p GPU Benchmarks
1080p GPU Benchmarks
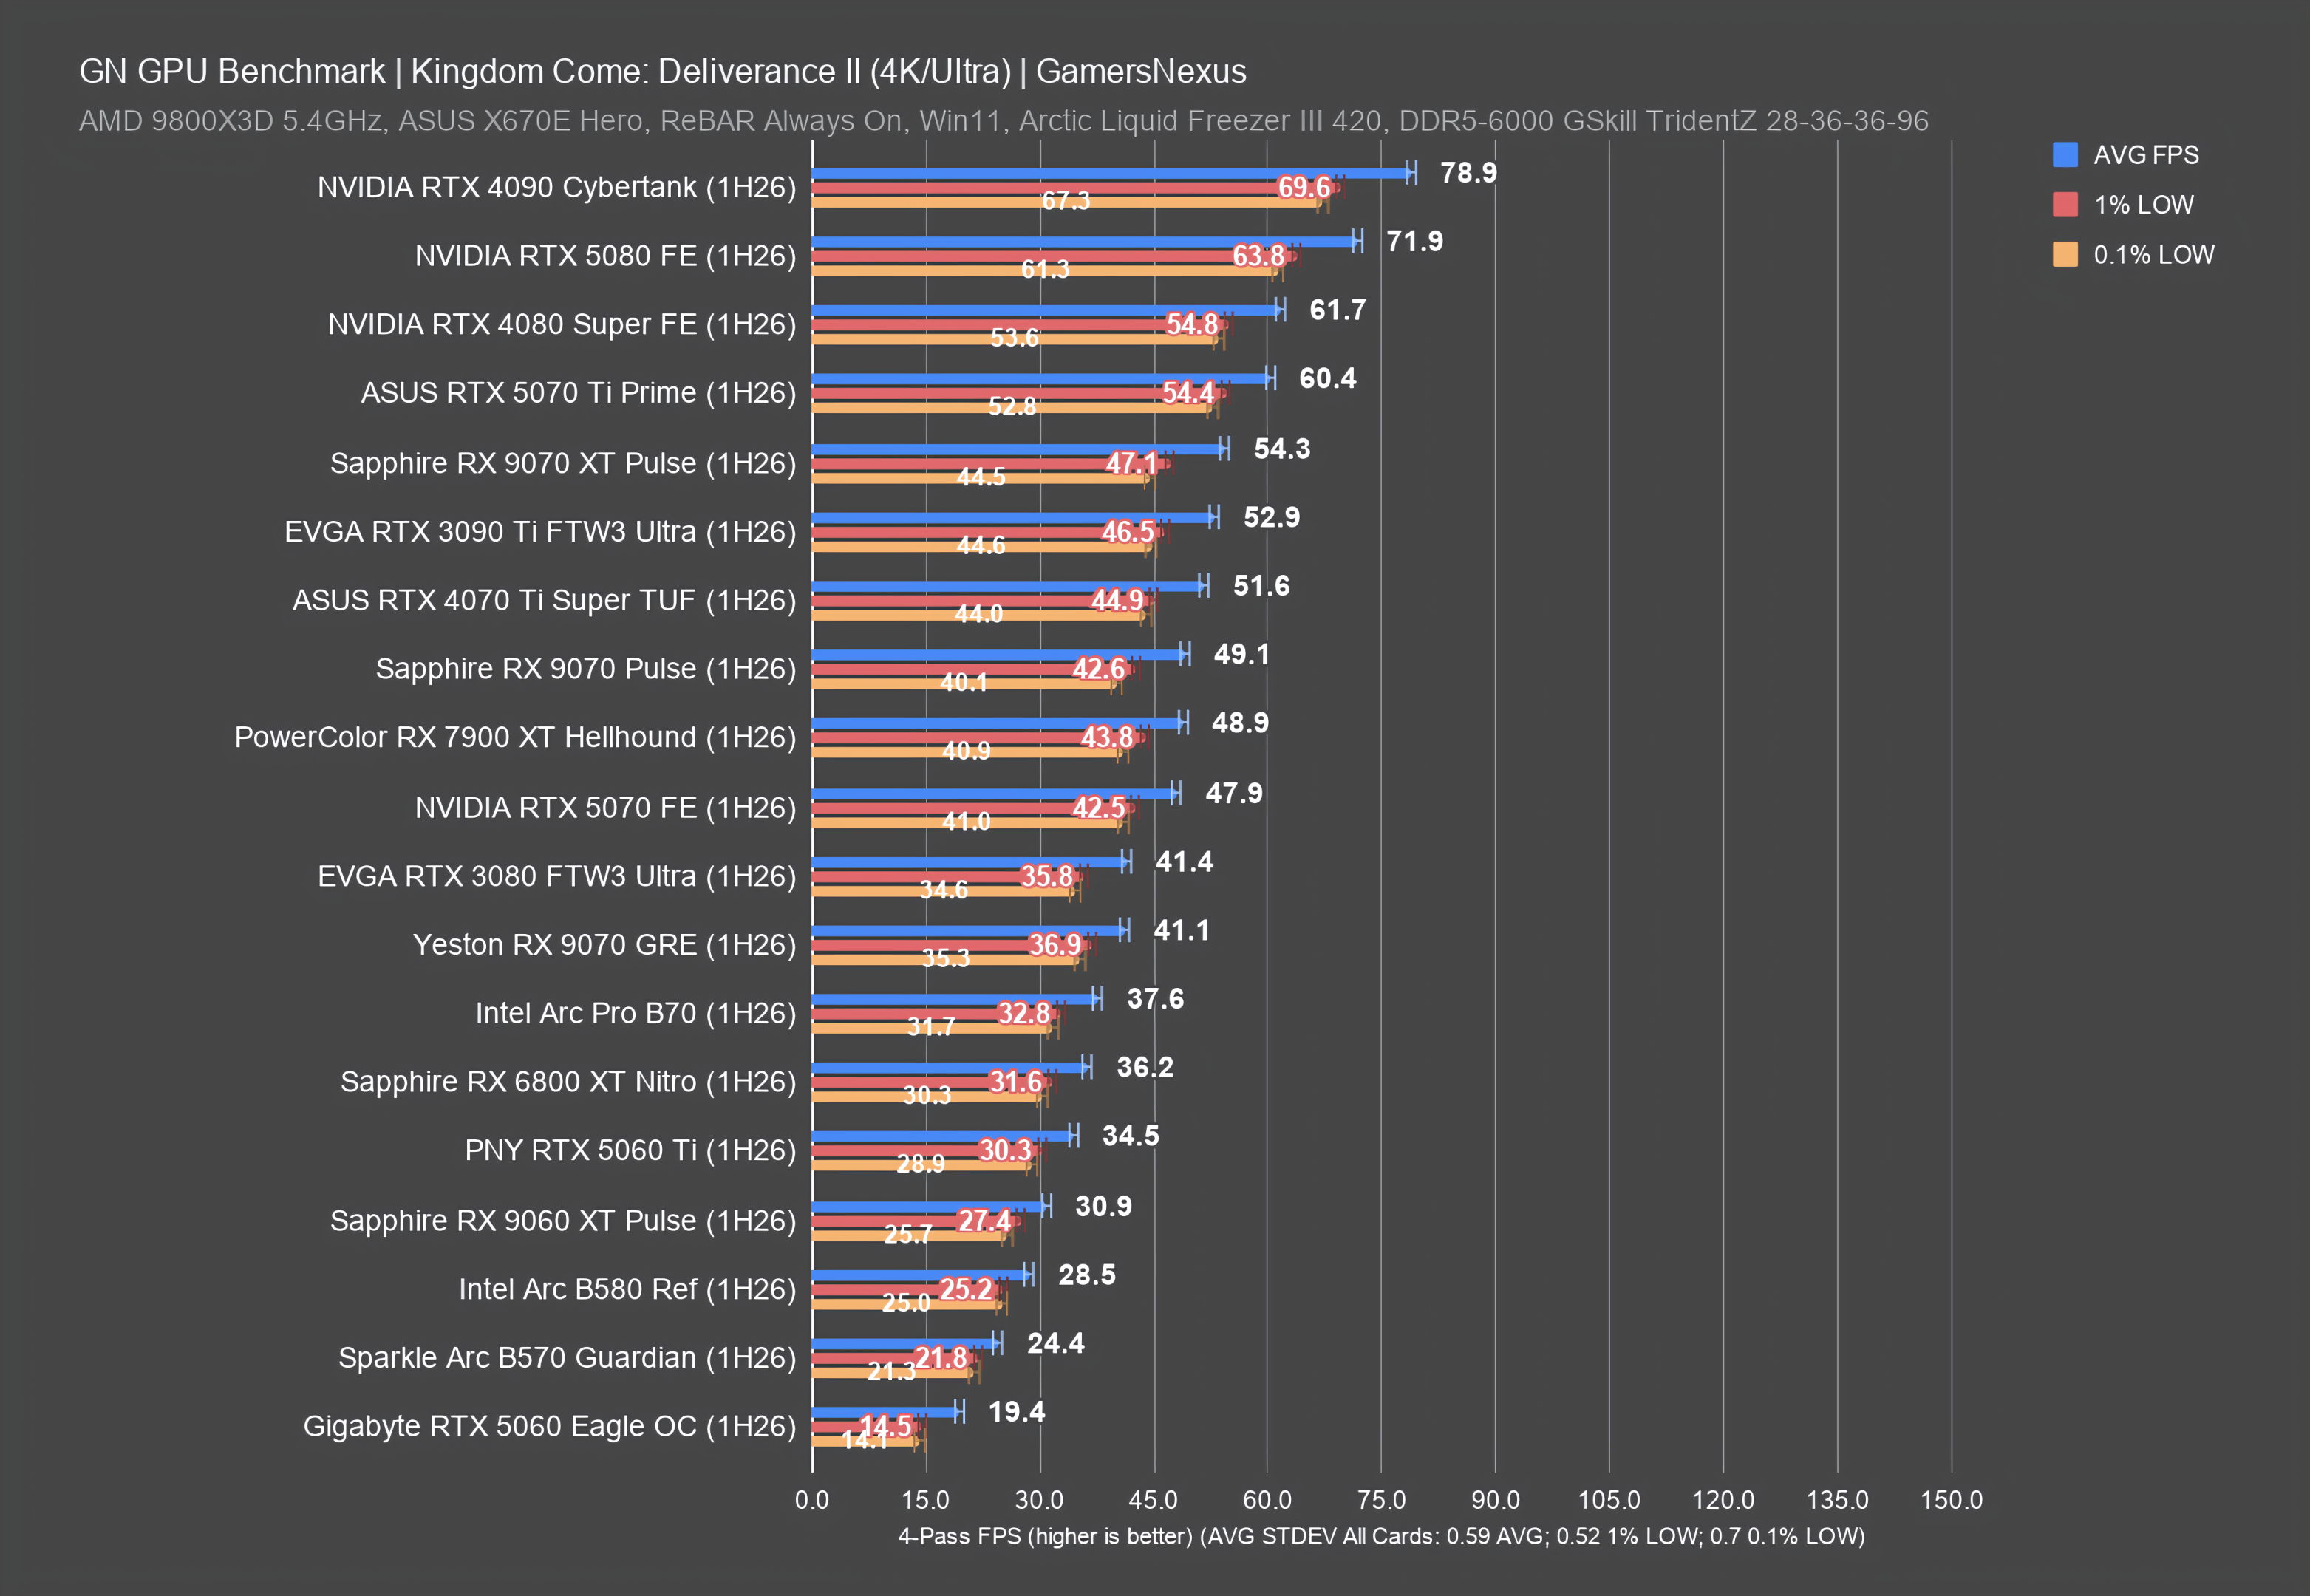
Kingdom Come: Deliverance II
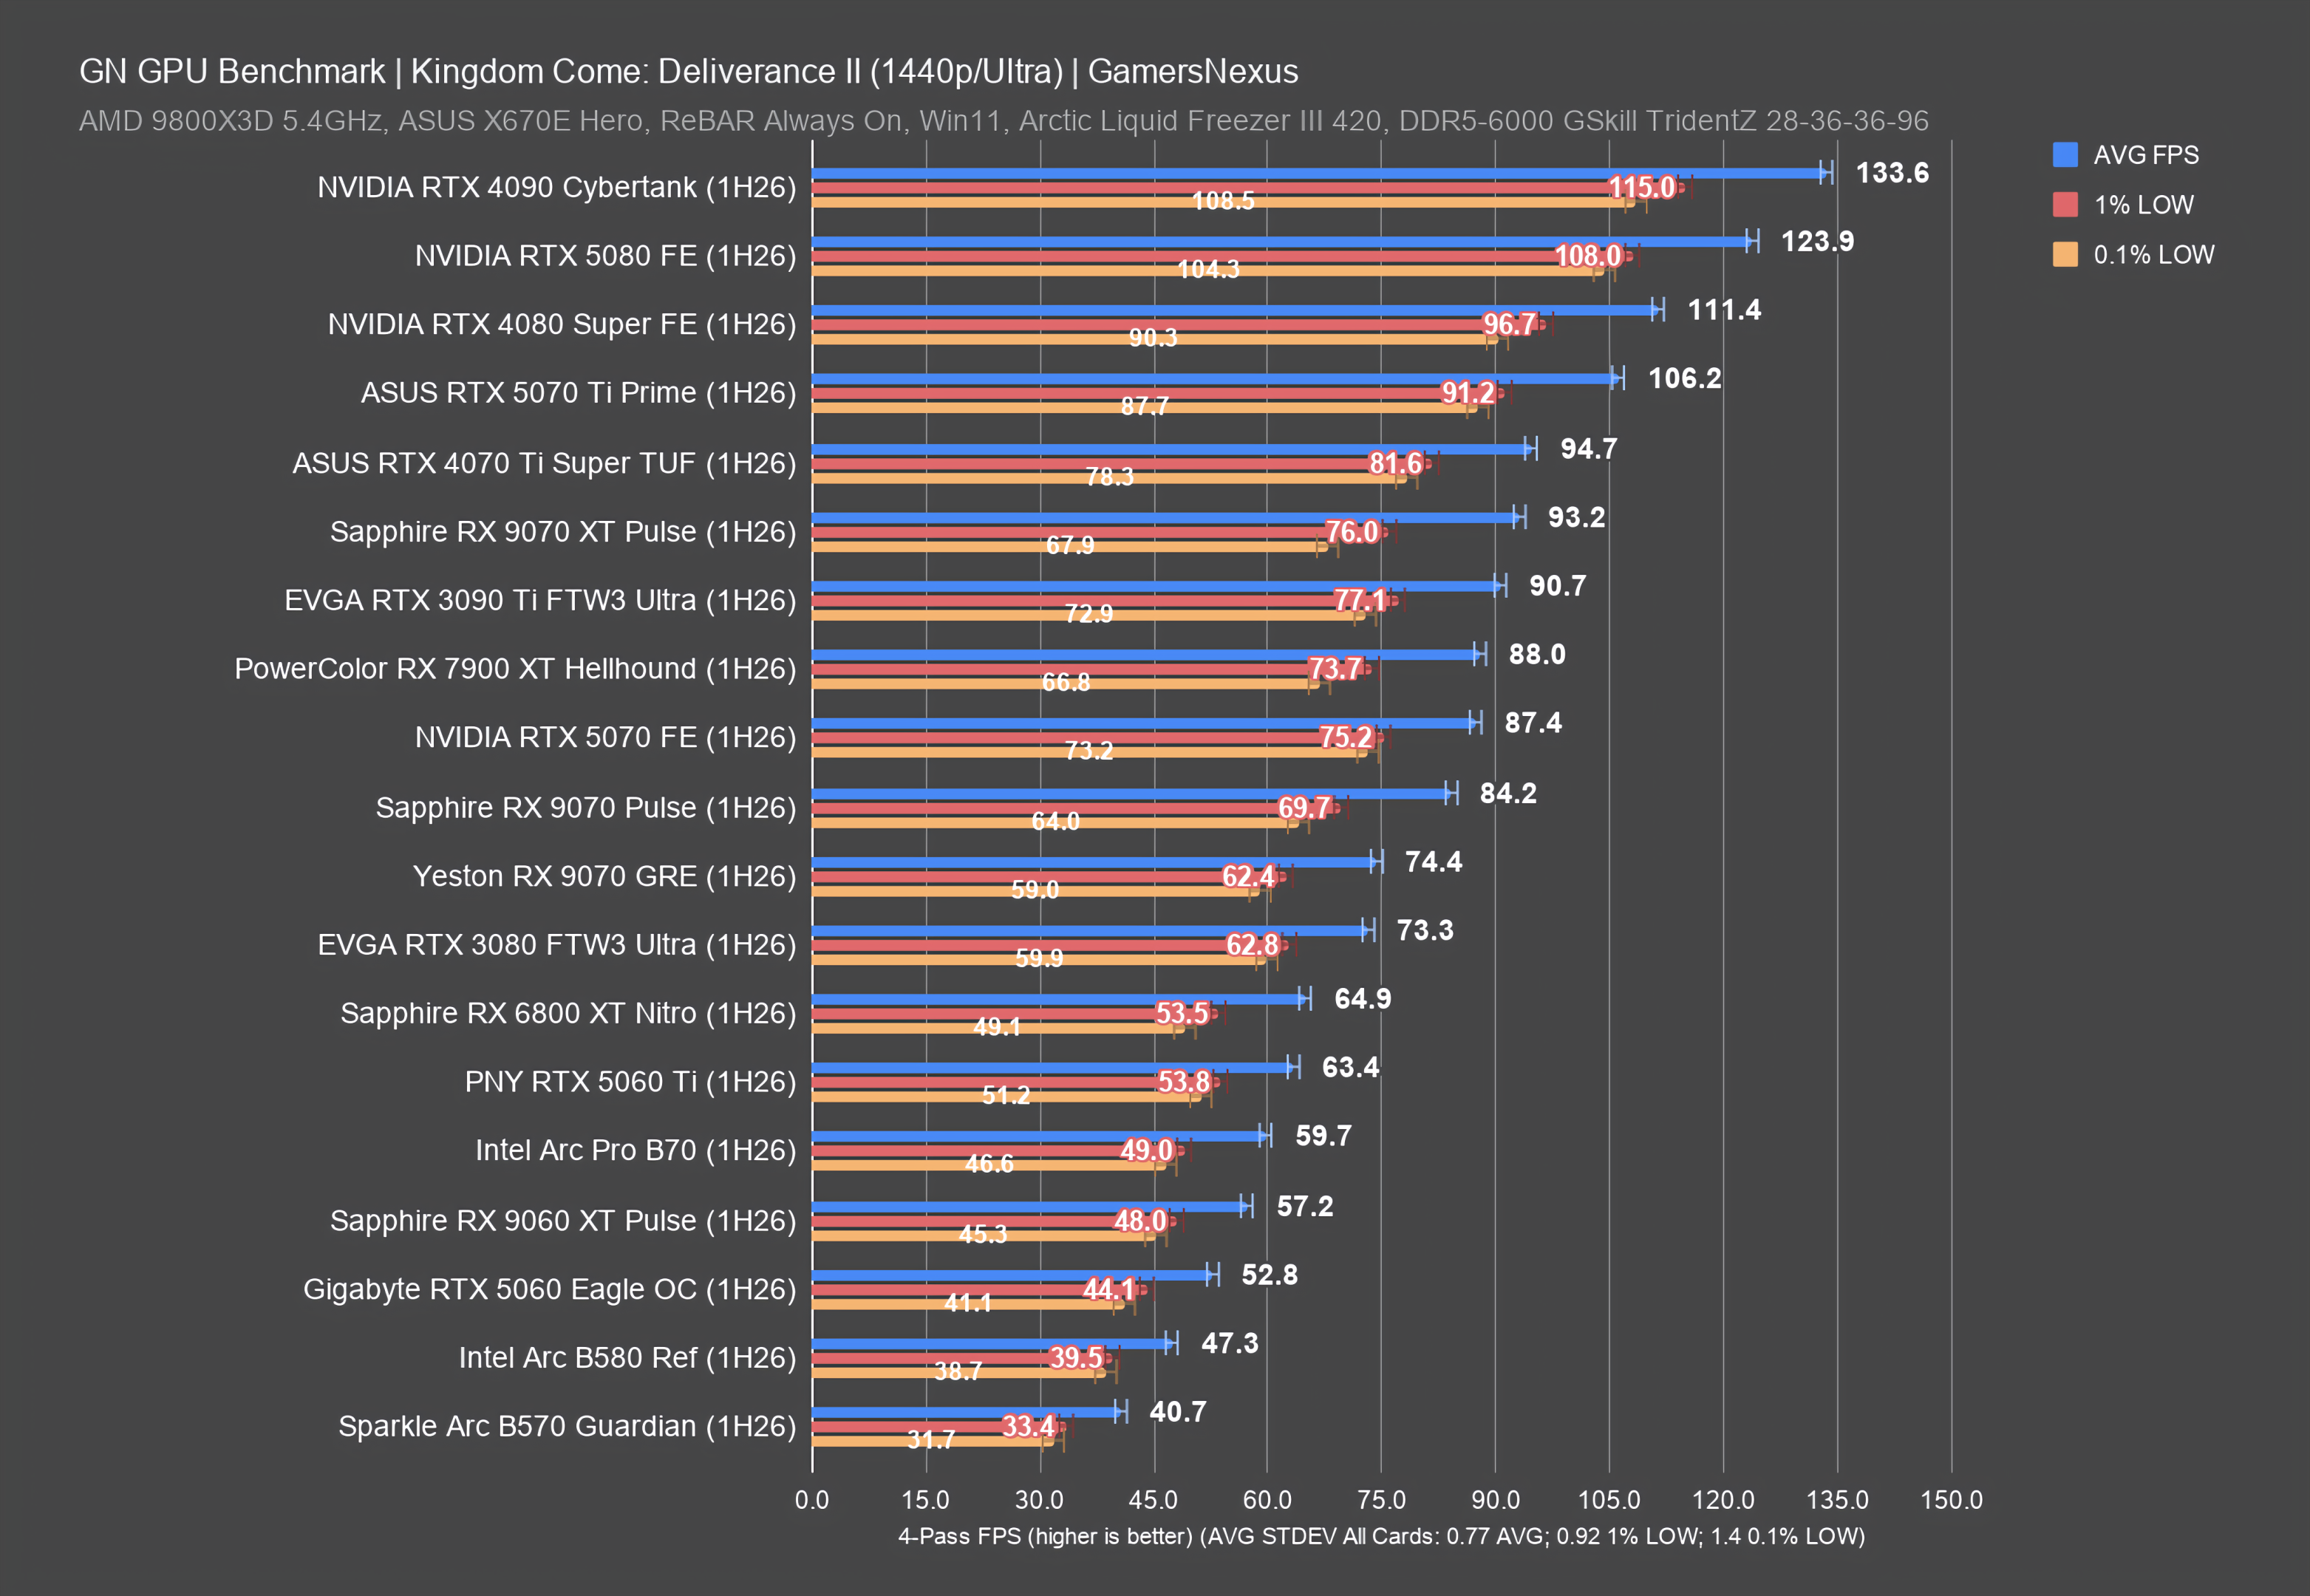
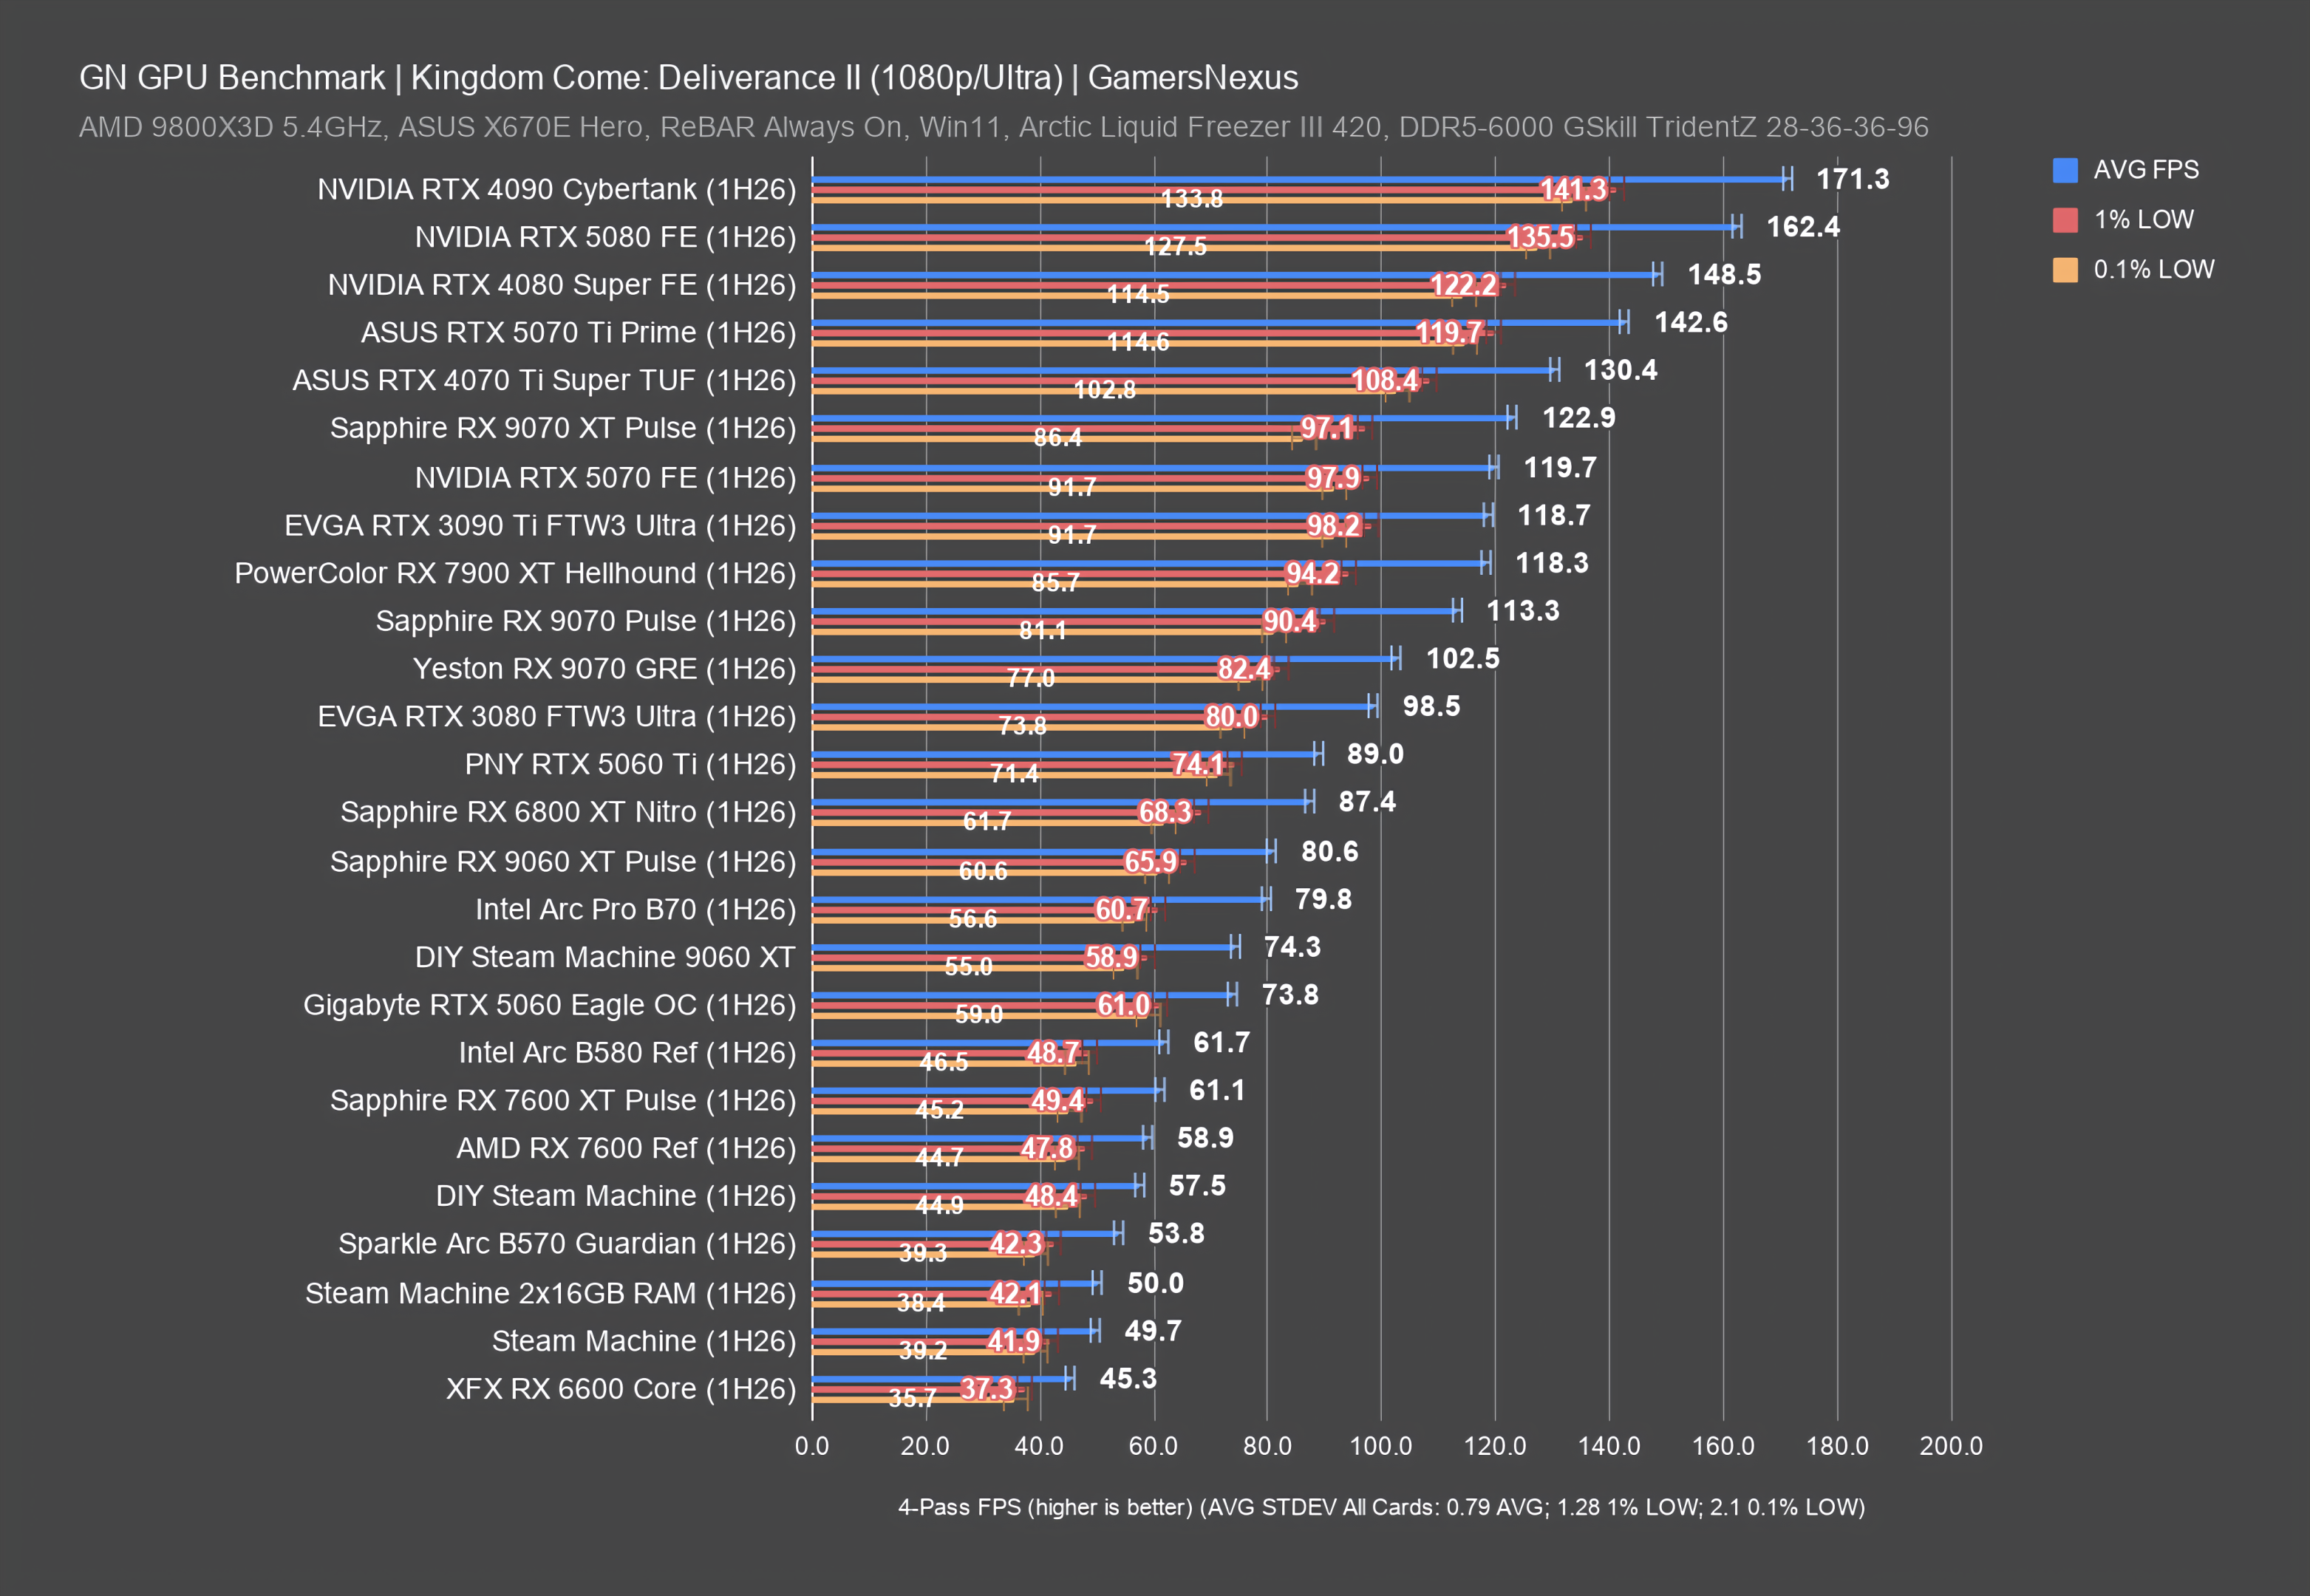
Kingdom Come: Deliverance II is newer to our benchmark suite. We've been running this 2025 title for the past year or so and have found it to be overall reliable for benchmarks, while also being new enough and heavy enough to load modern GPUs without becoming unplayable on older GPUs. Because it's newer to our suite, we have fewer tests with it. That's because the game has updated more significantly recently than the other titles, resulting in incomparable data that causes us to rotate our results more frequently. The below is the most recent set of results on a newer version of the game.
4K GPU Benchmarks
1440p GPU Benchmarks
1080p GPU Benchmarks
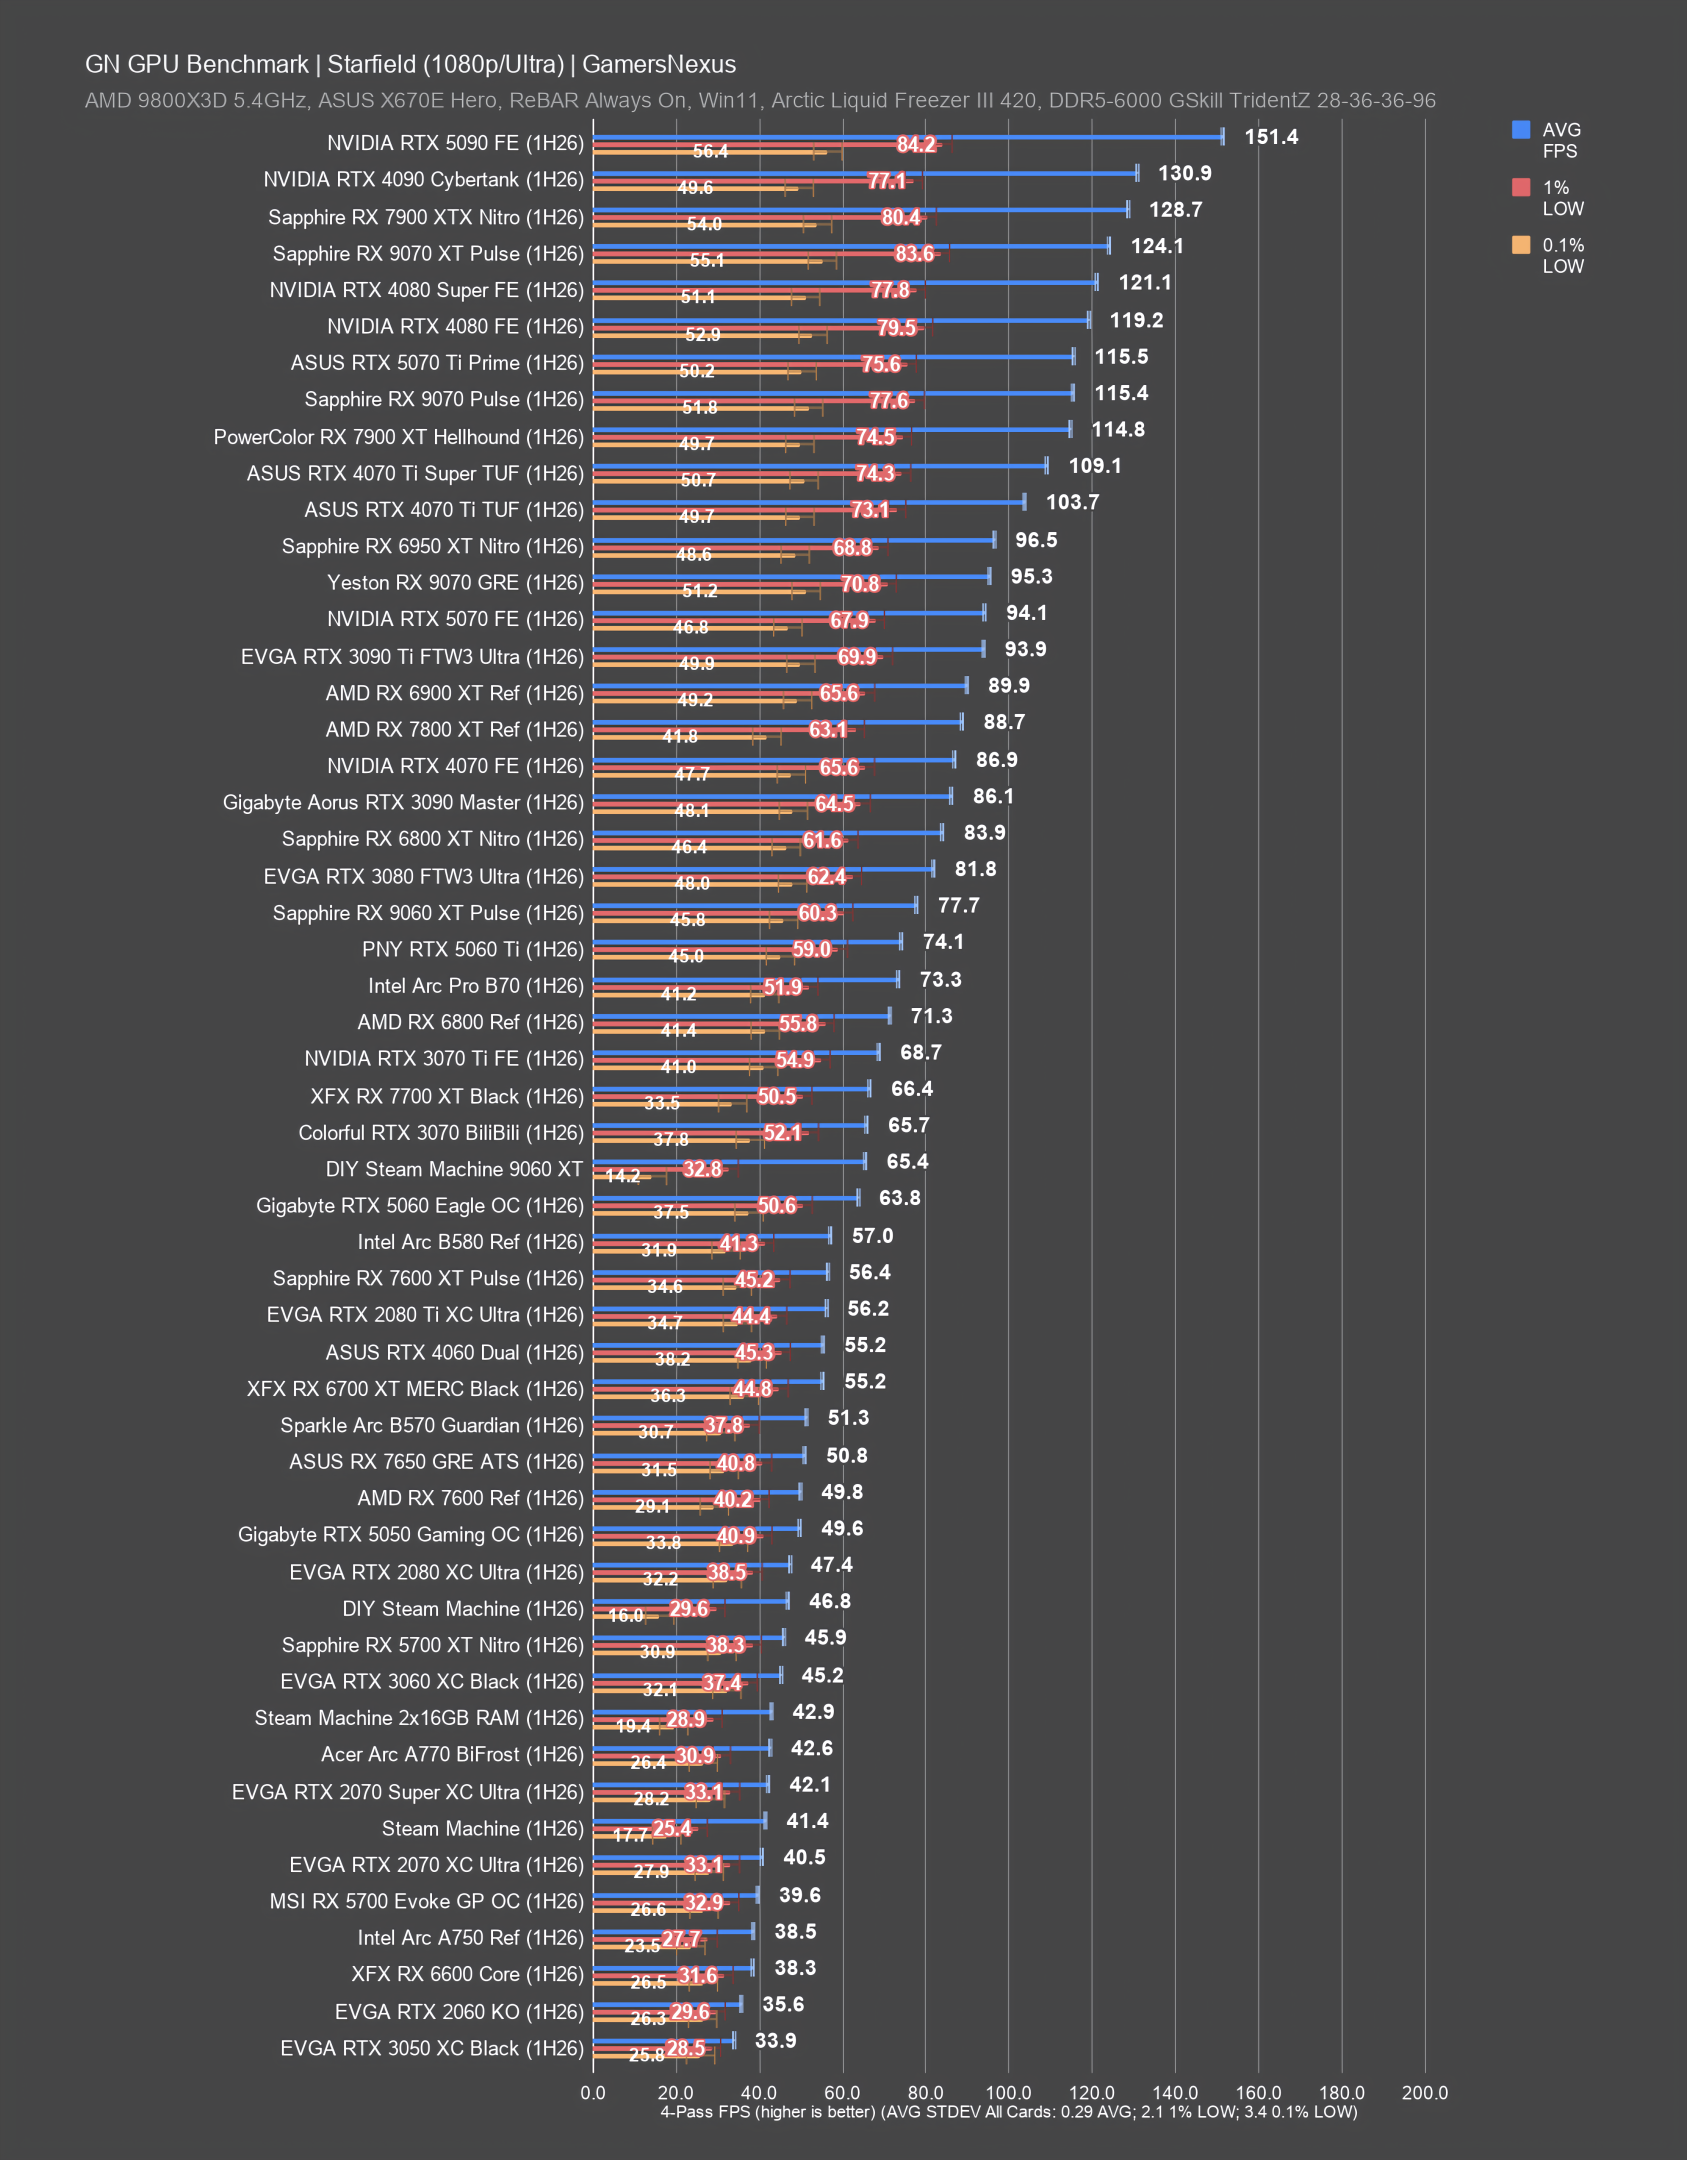
Starfield GPU Comparison
Starfield is up next. The game got memed on at launch -- often by us, mostly because it was more of a loading screen simulator than a game -- but remains overall stable as a benchmark platform.
4K GPU Benchmarks
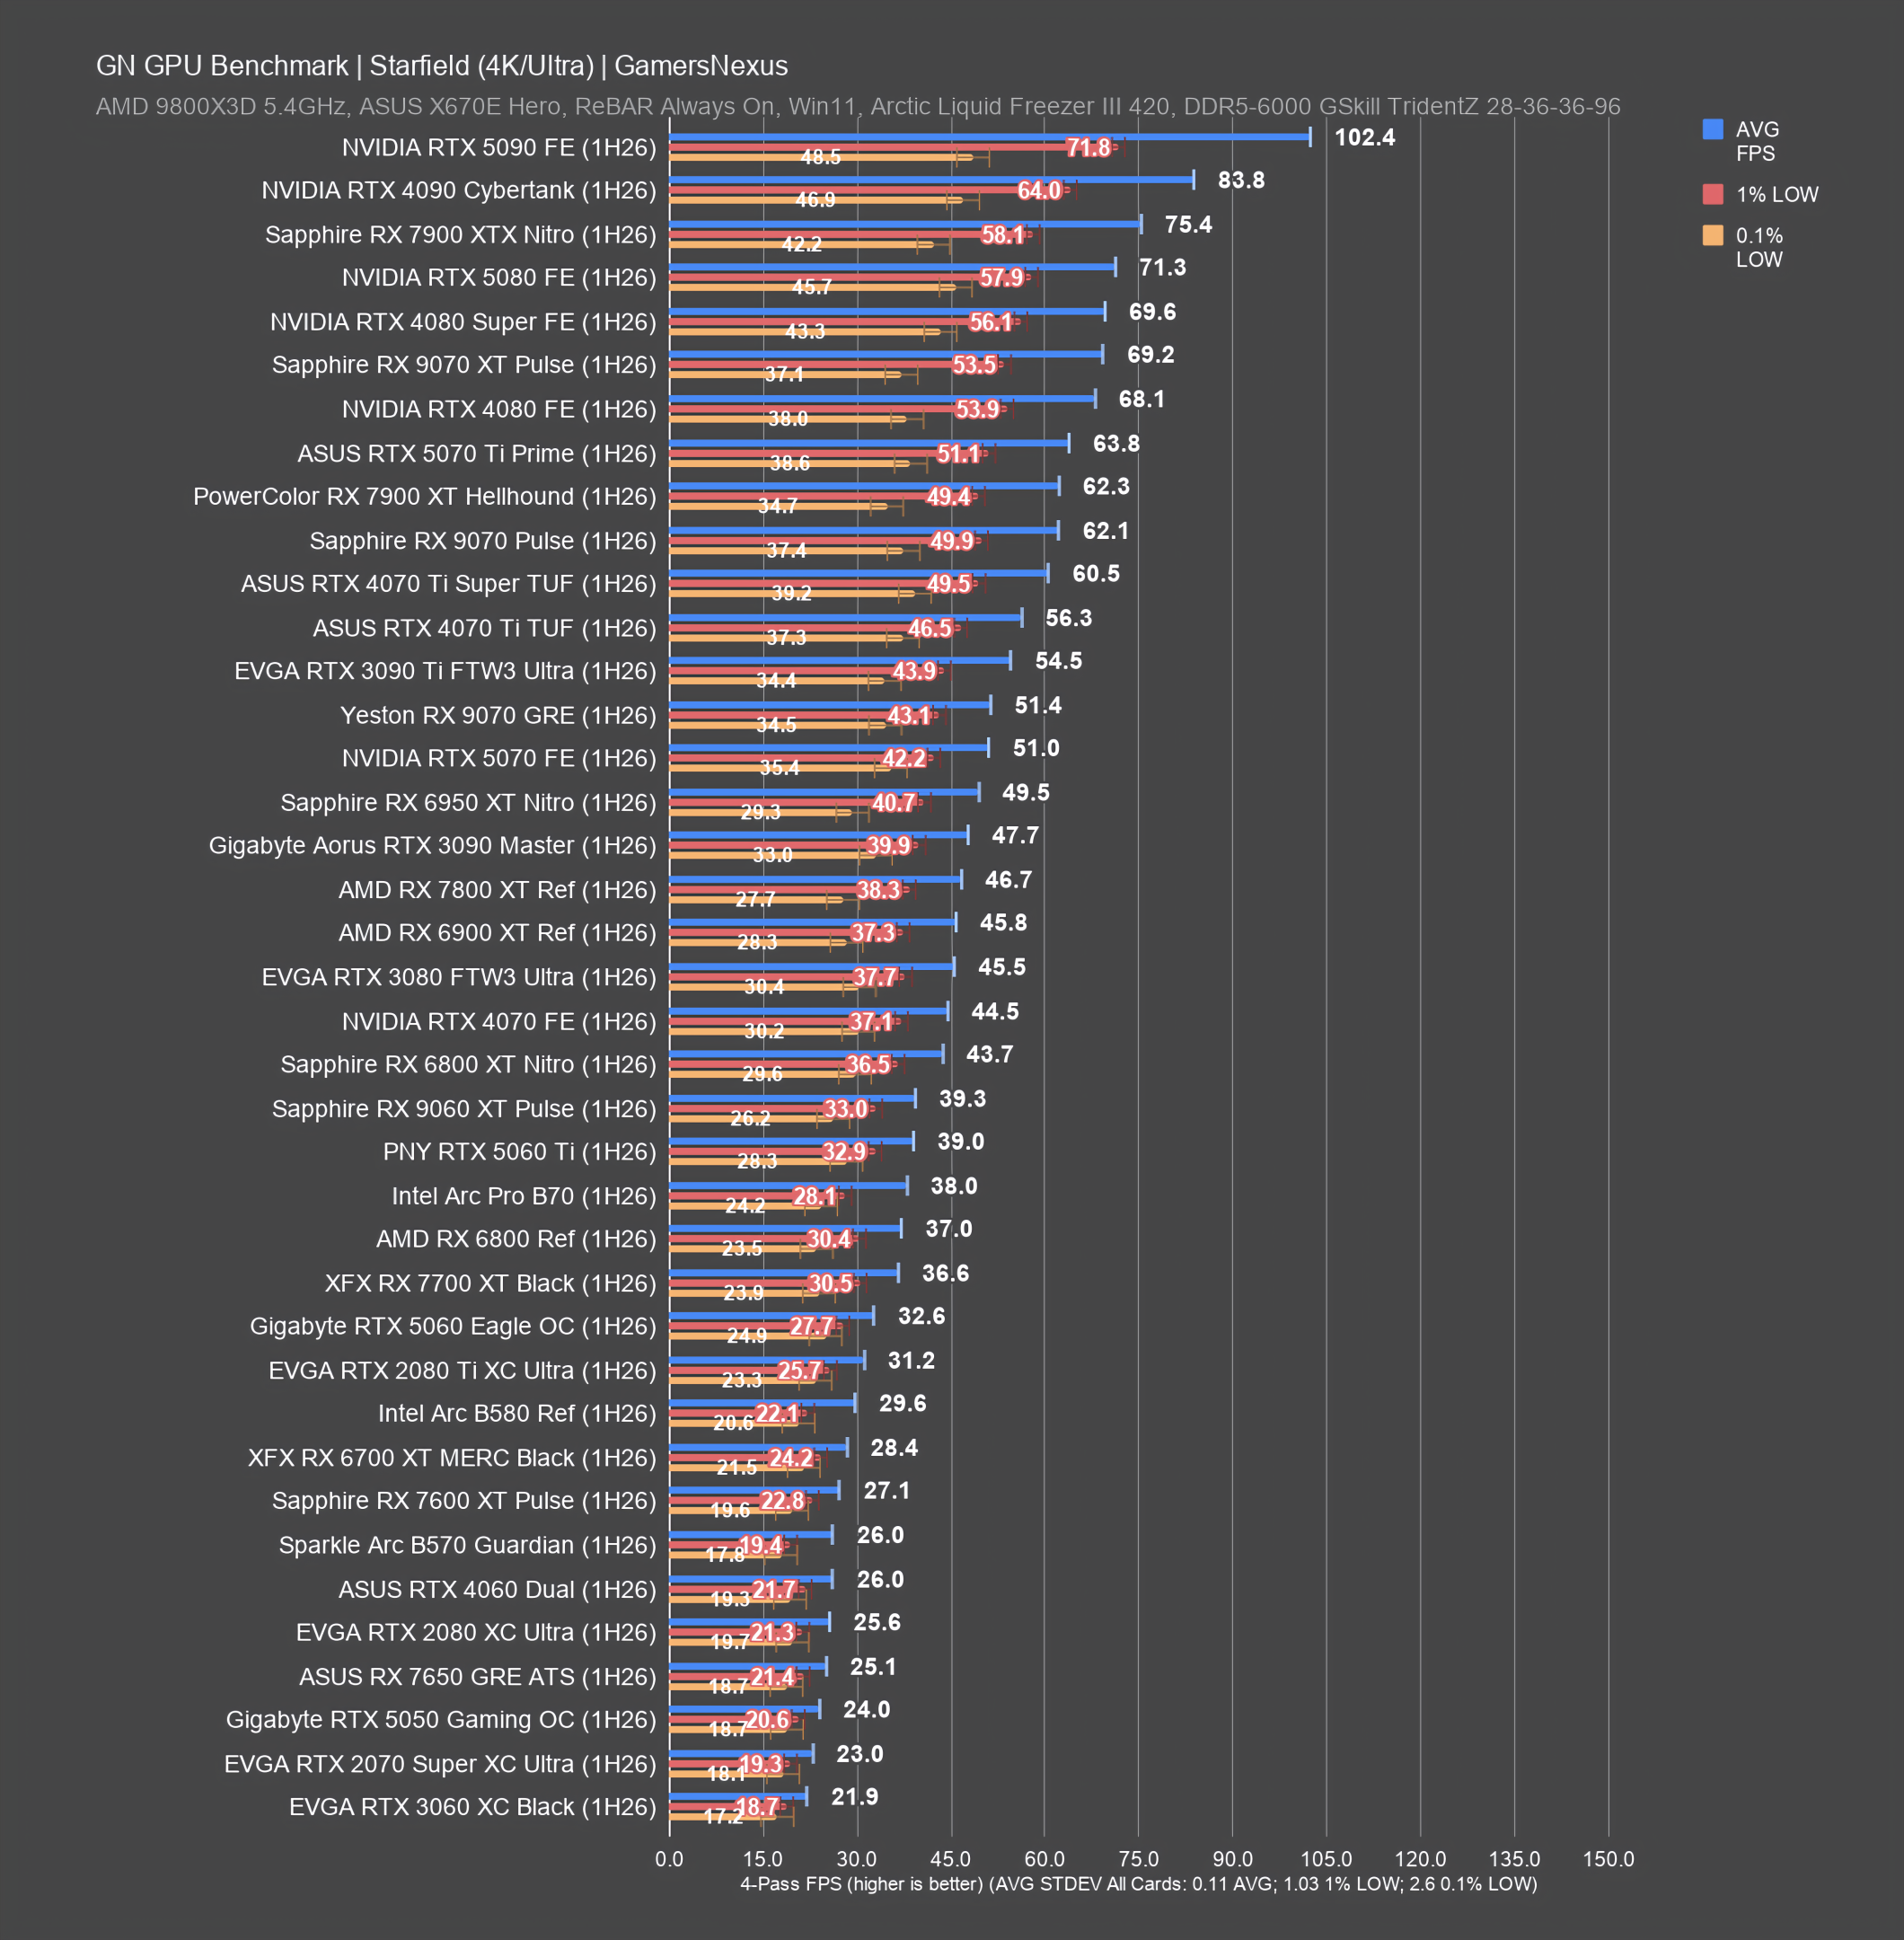
1440p GPU Benchmarks
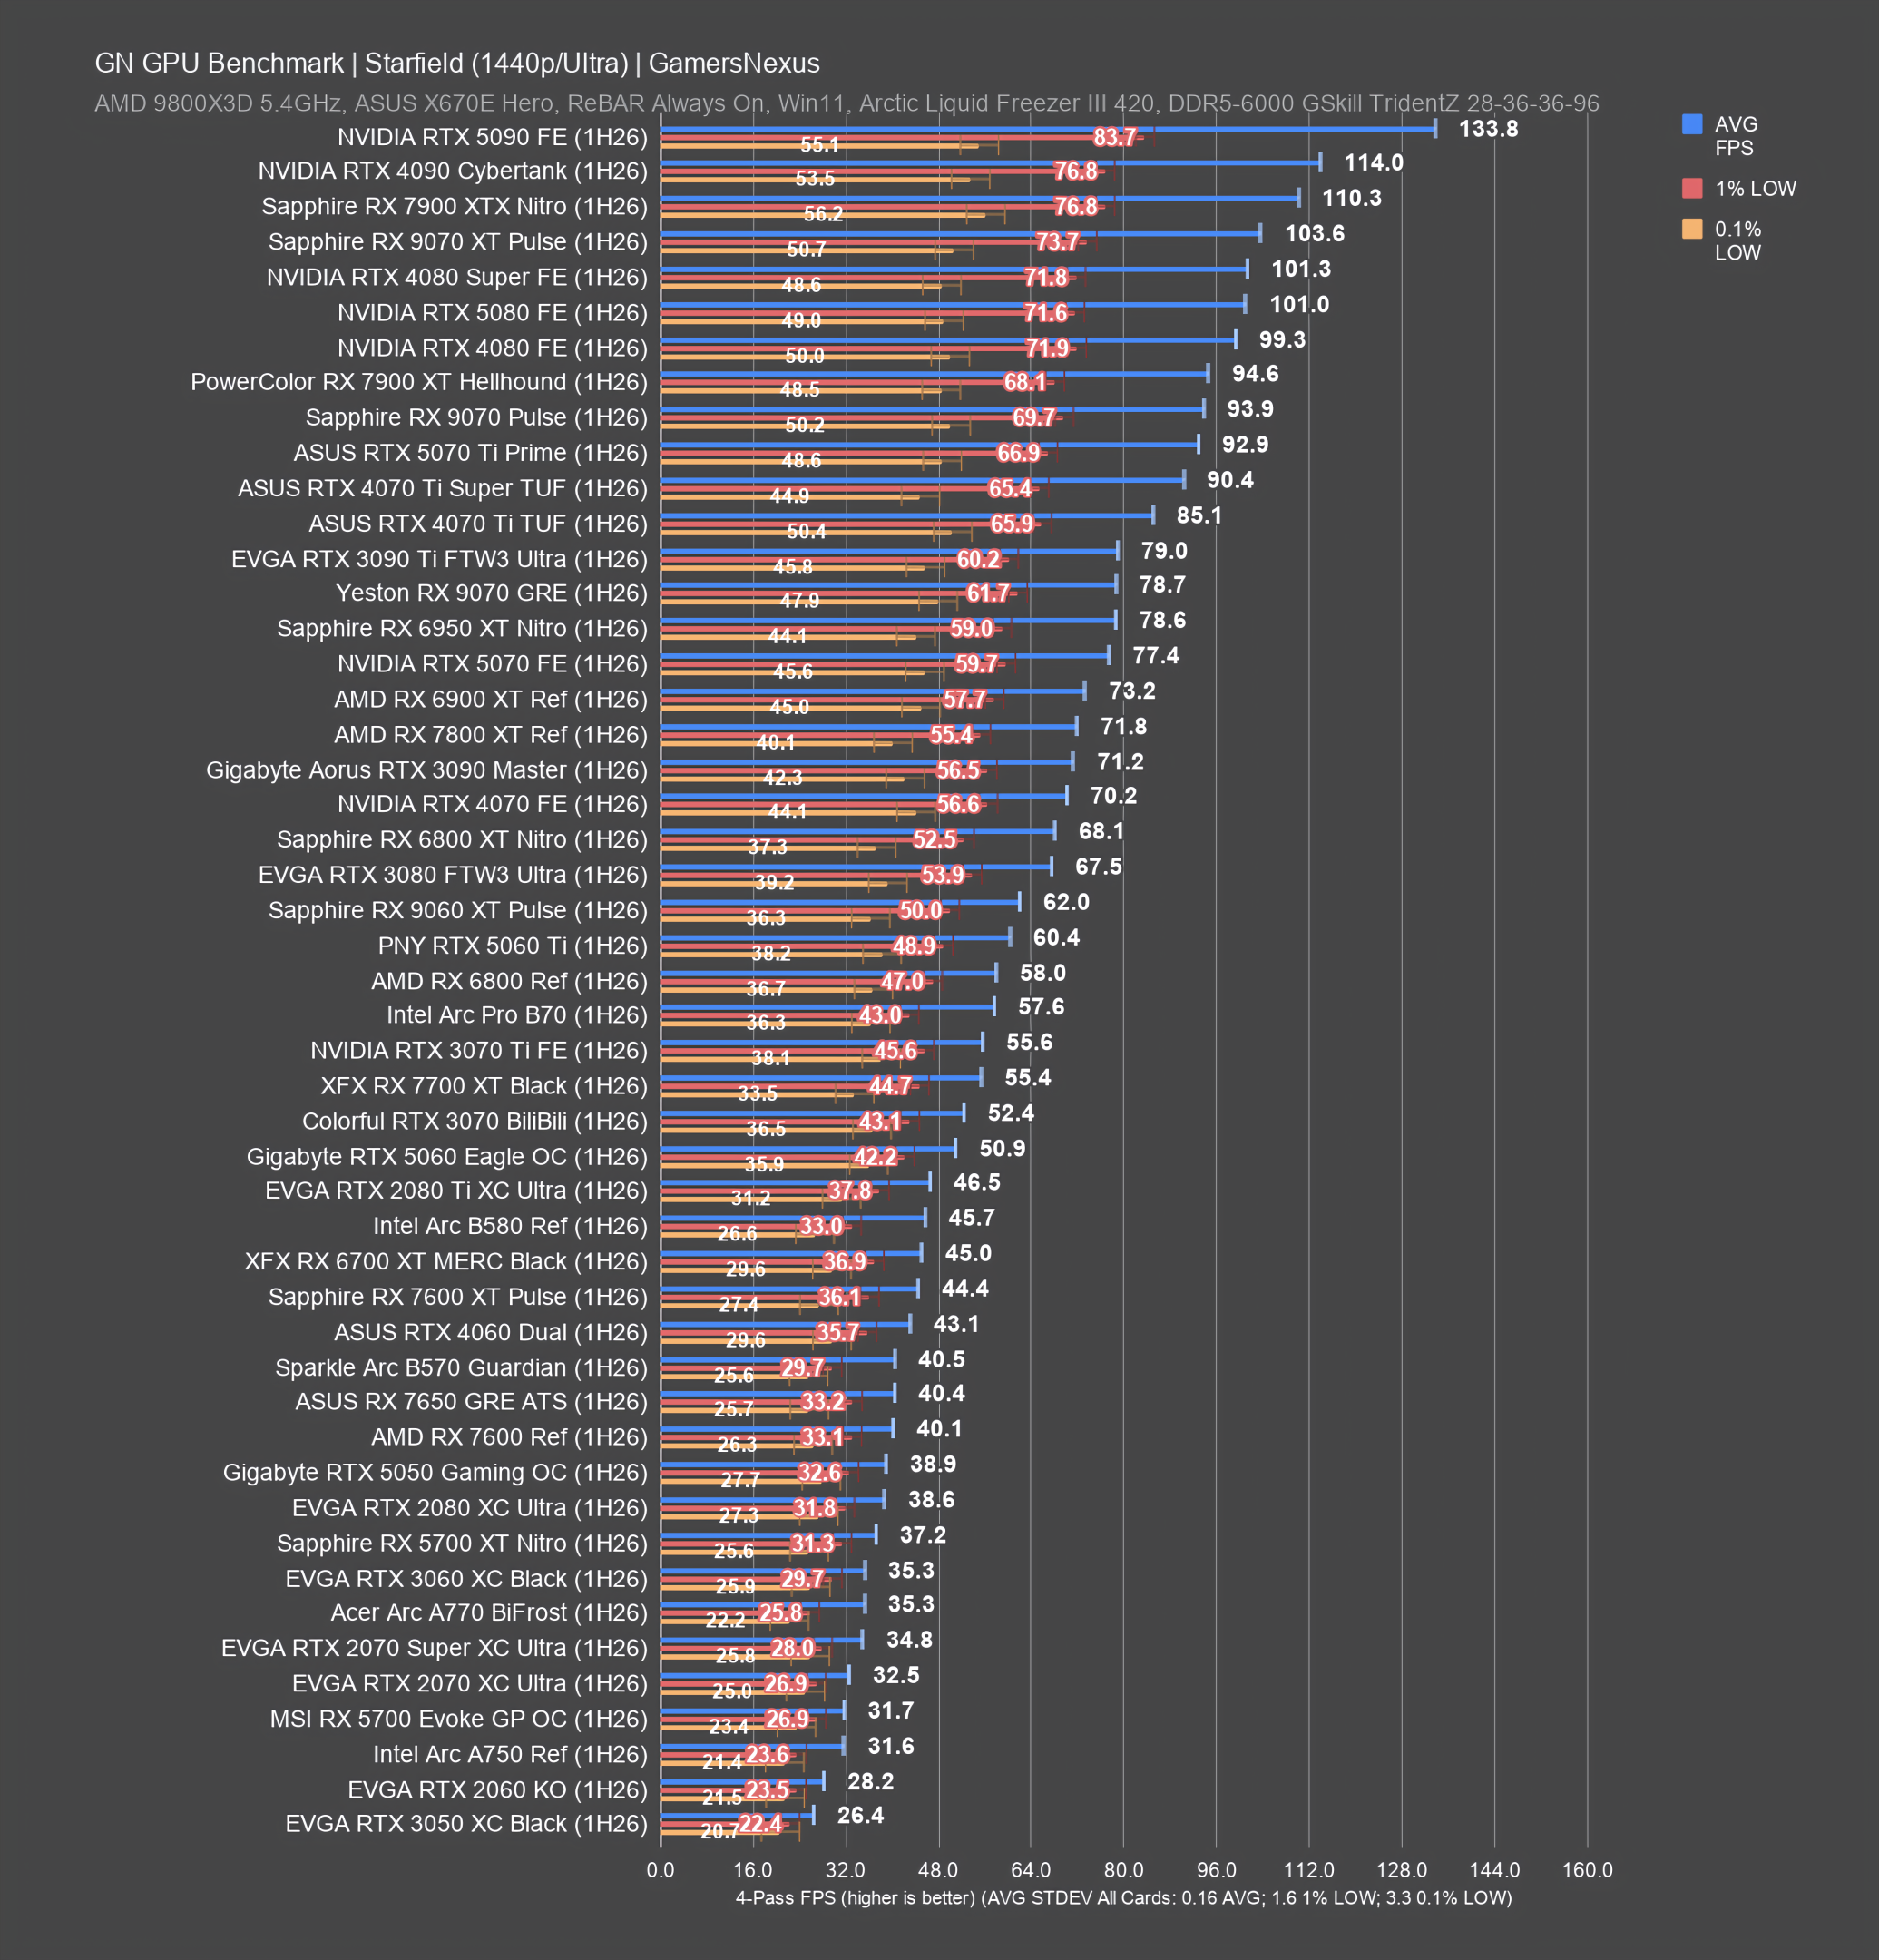
1080p GPU Benchmarks
TES IV: Oblivion Remastered GPU Benchmarks
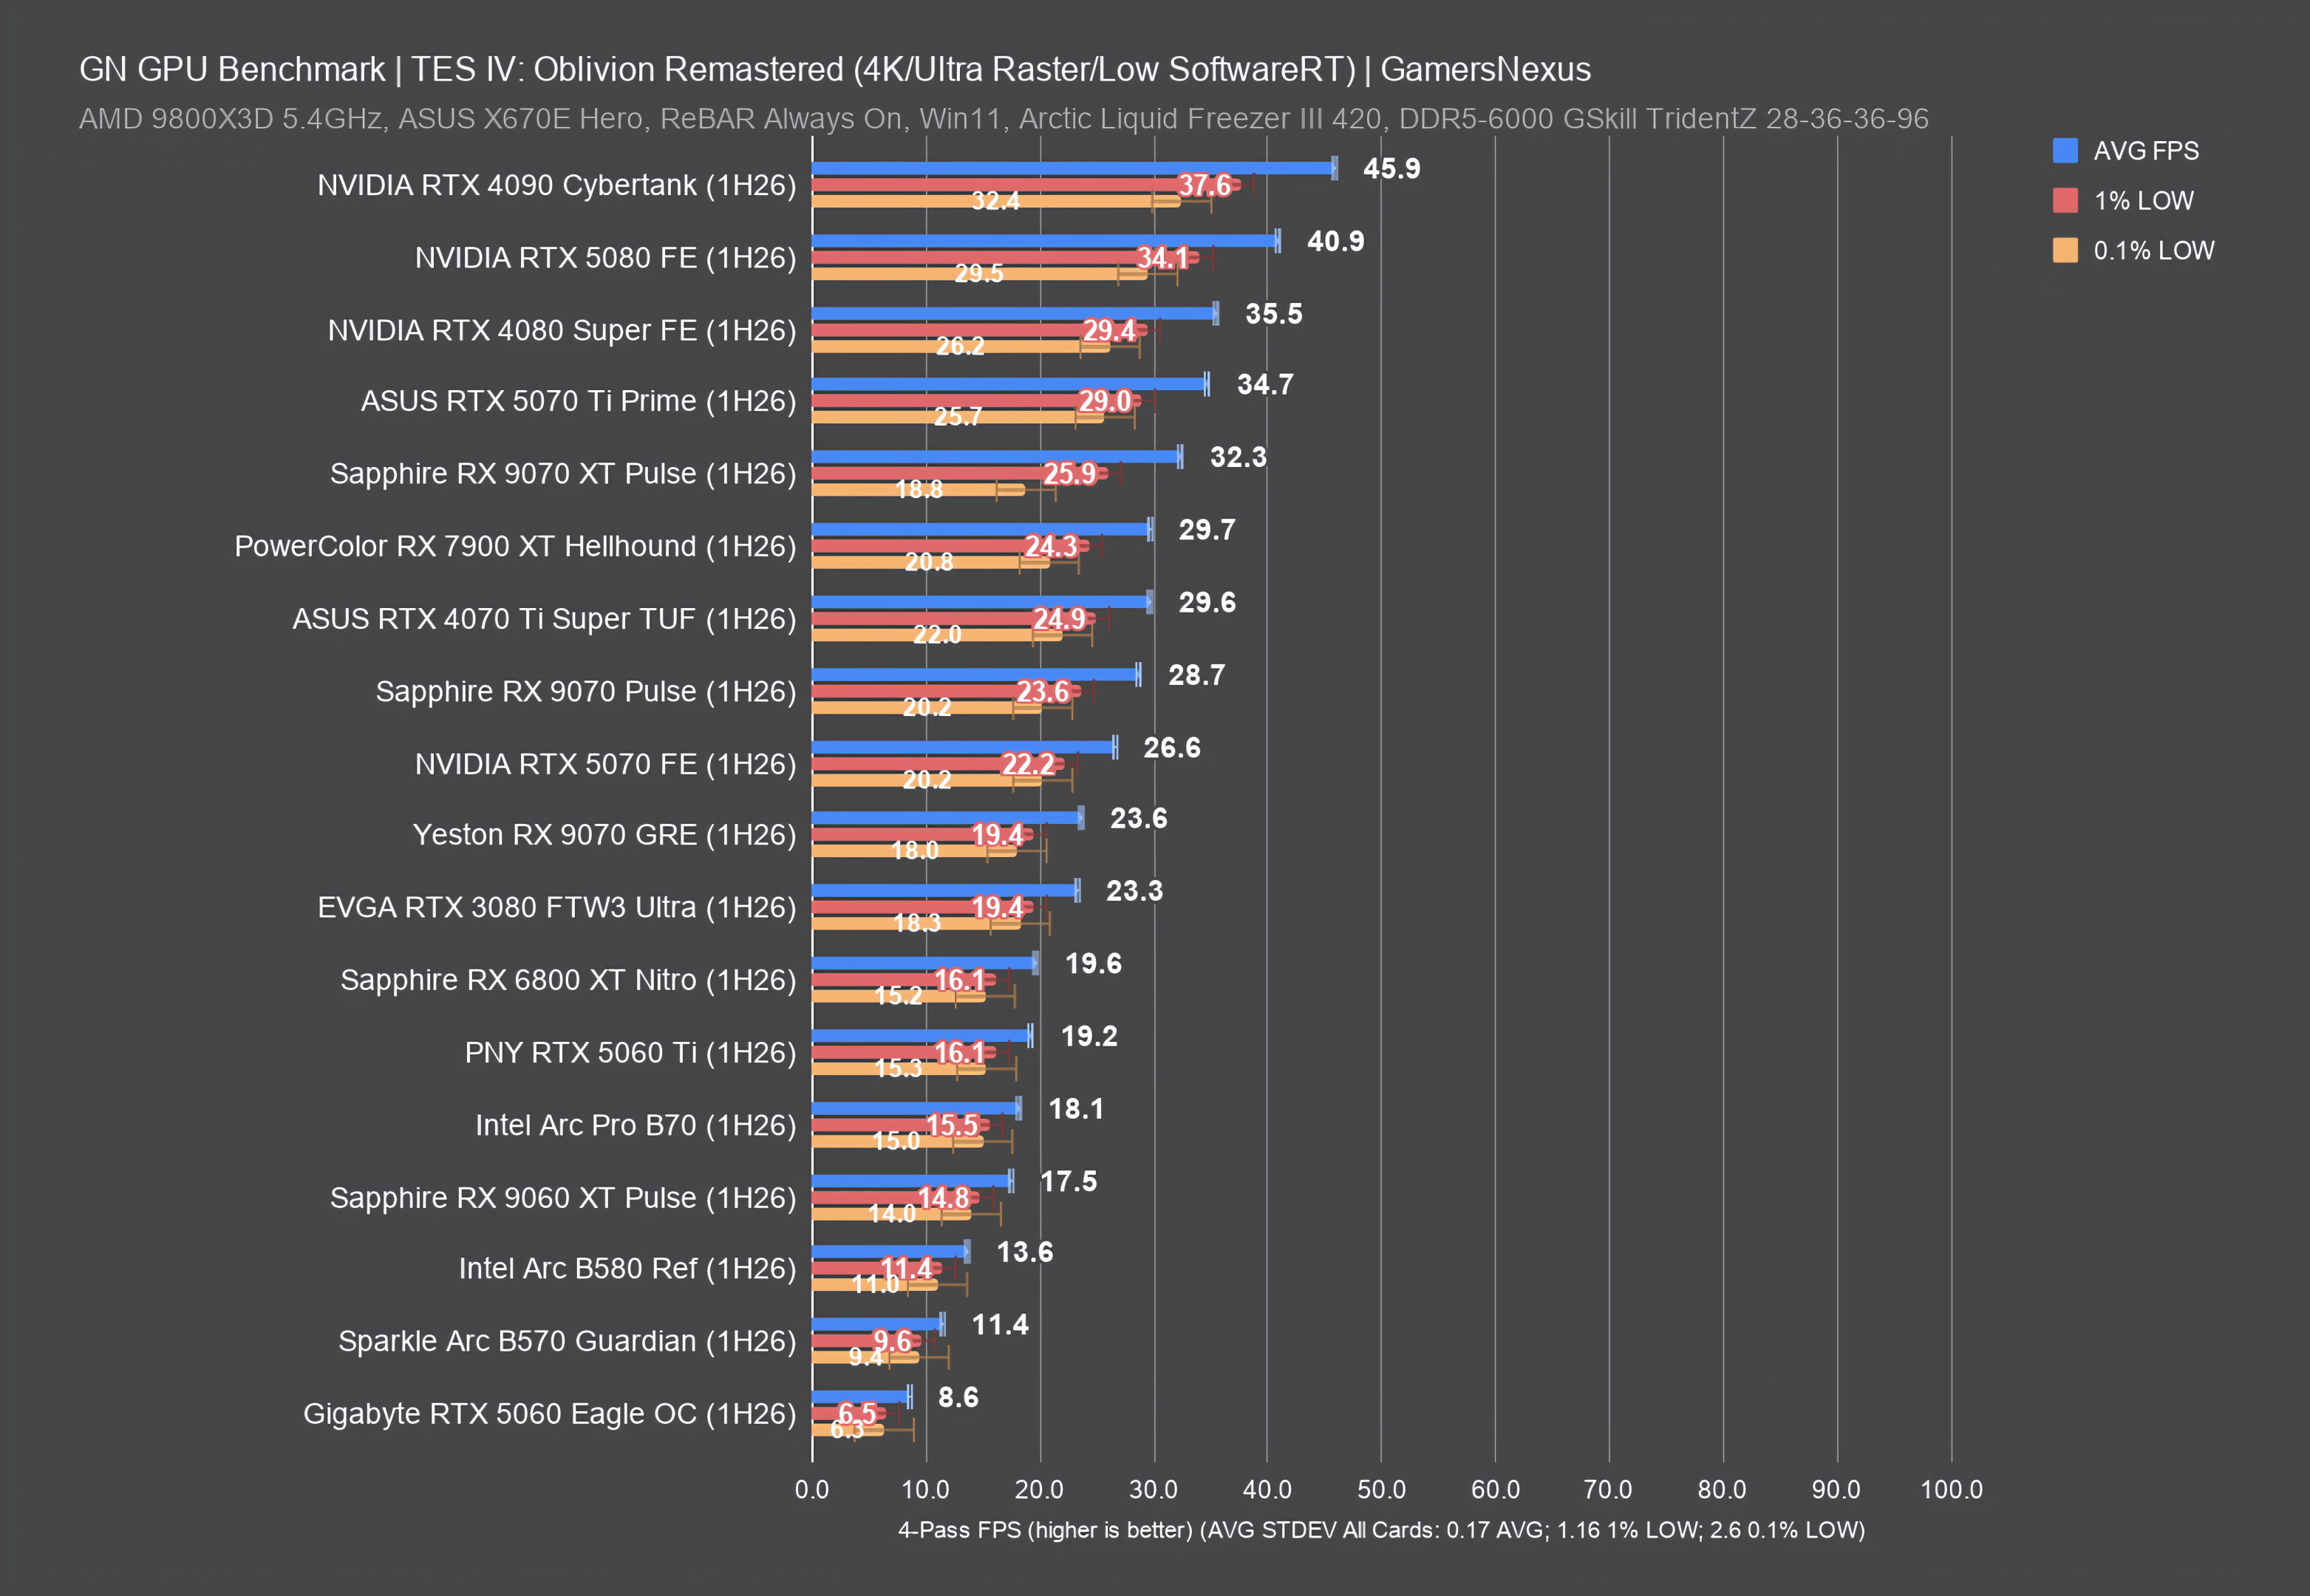
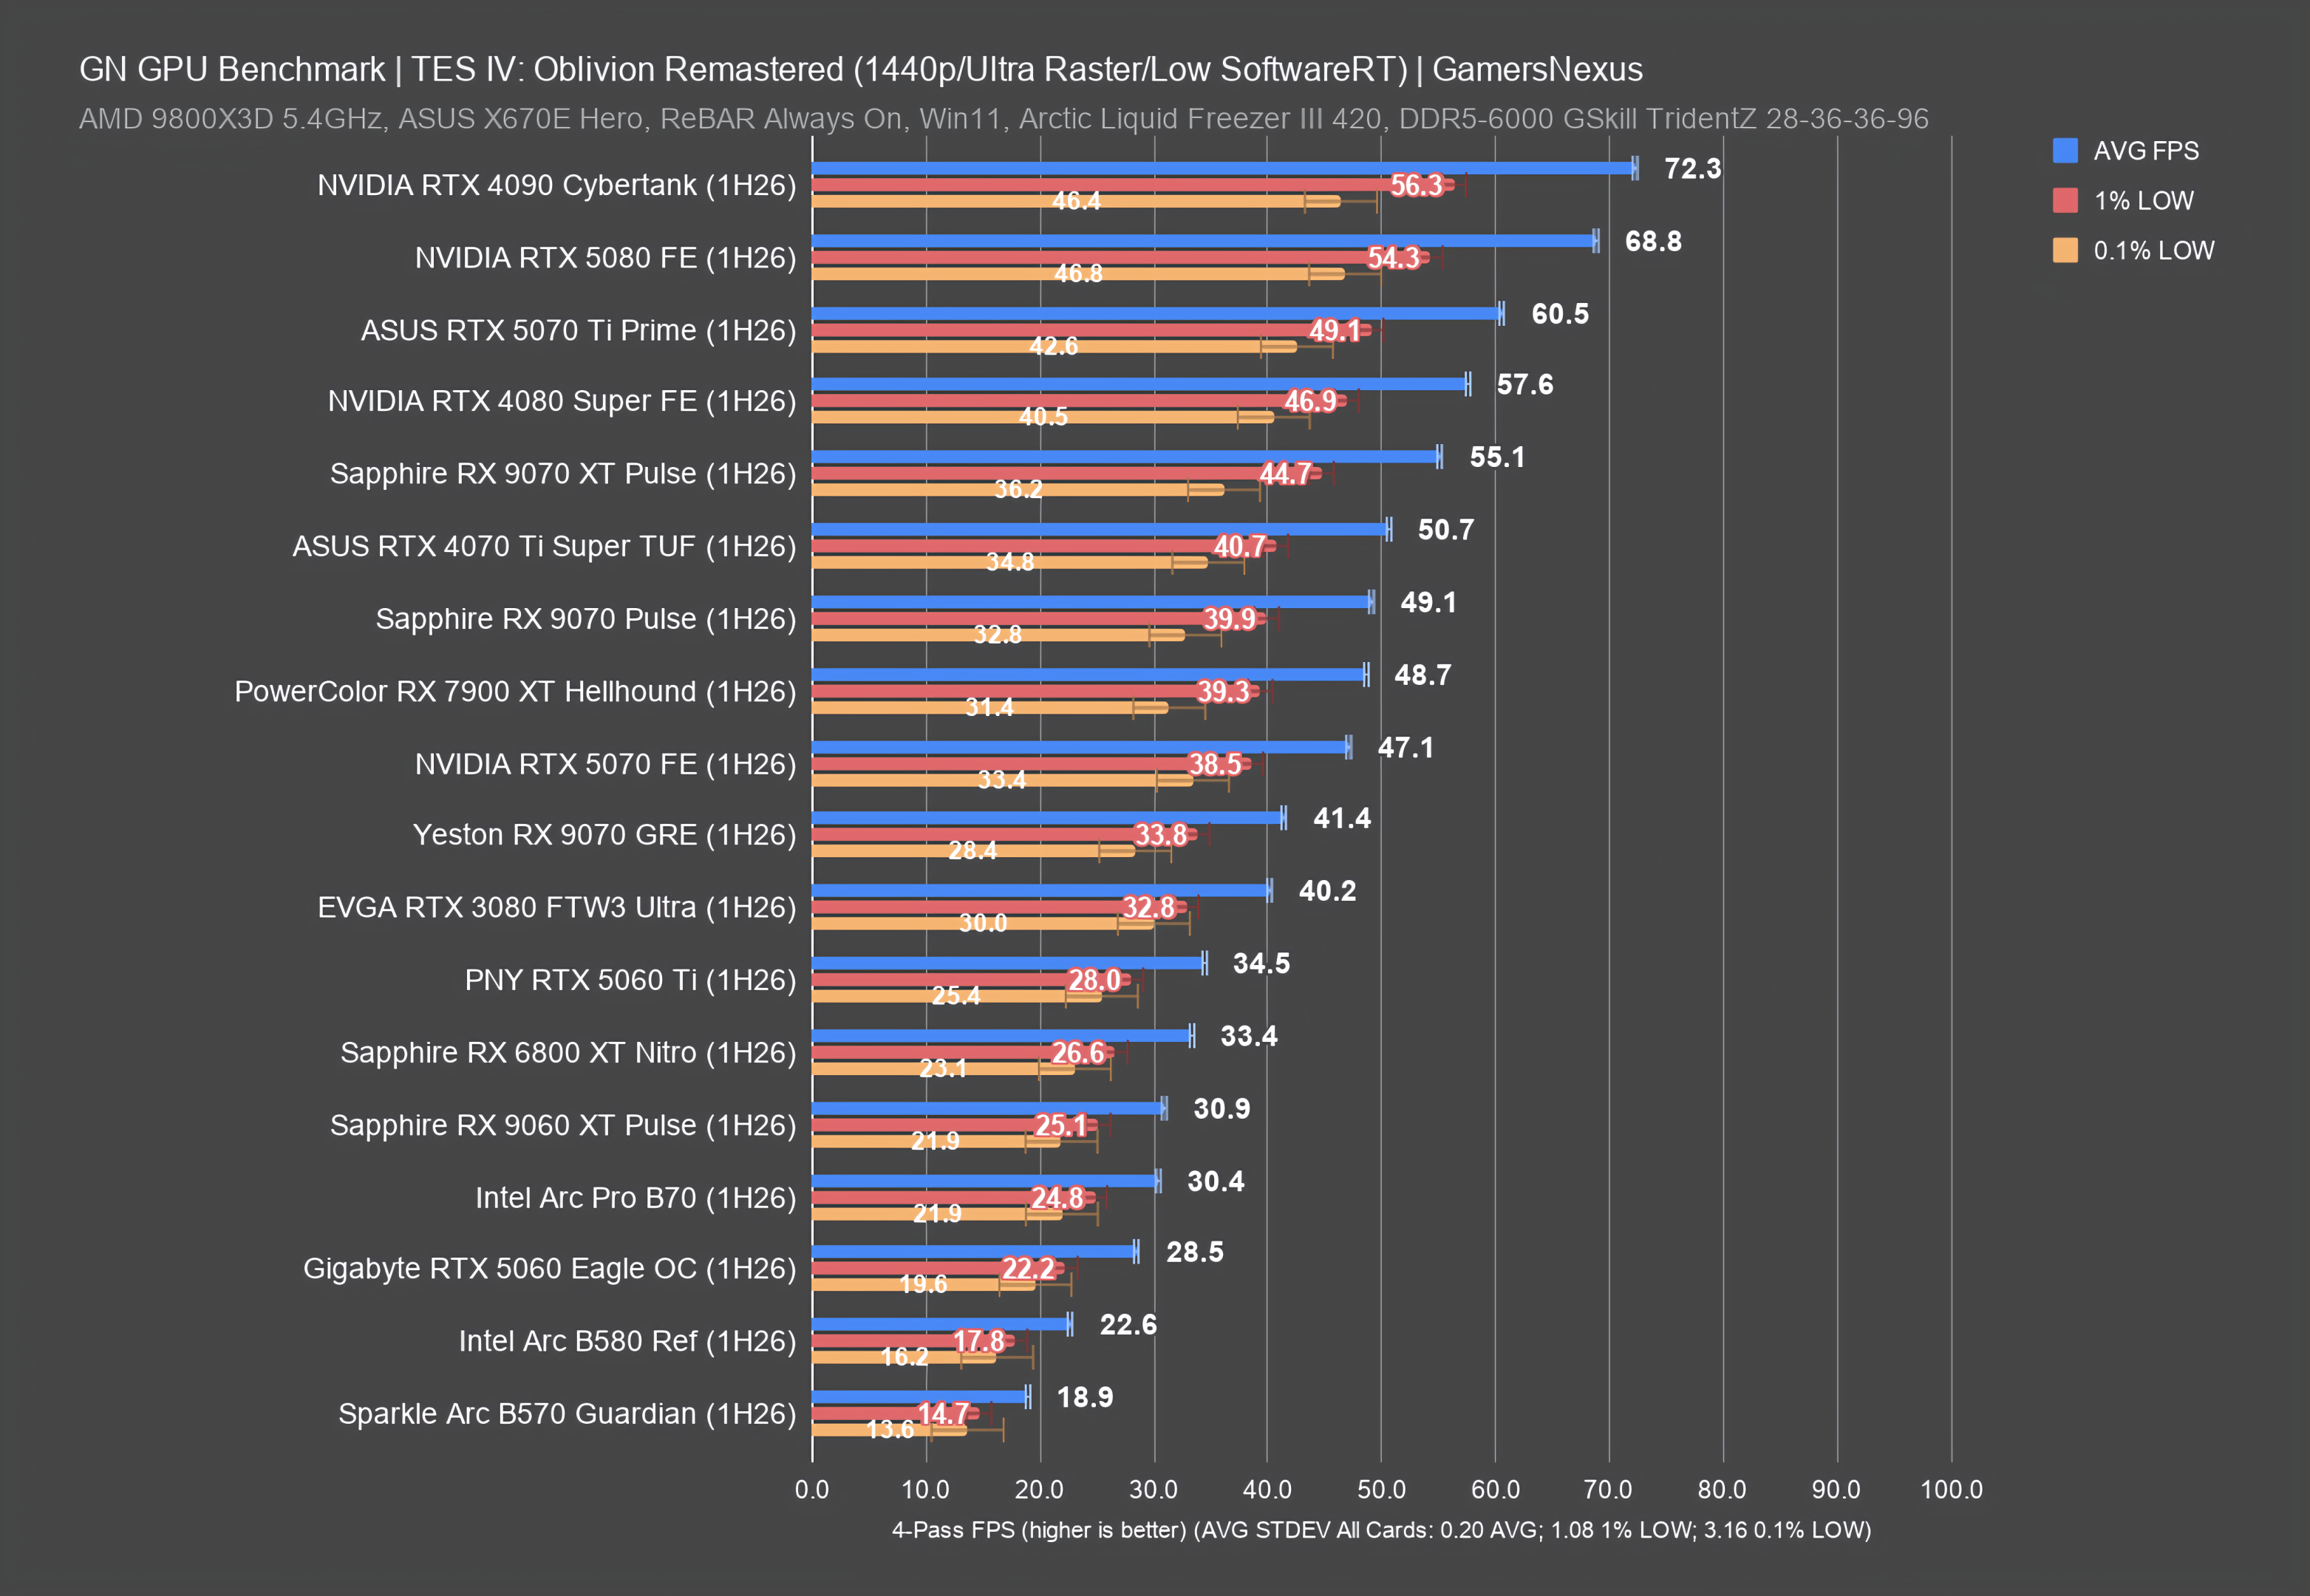
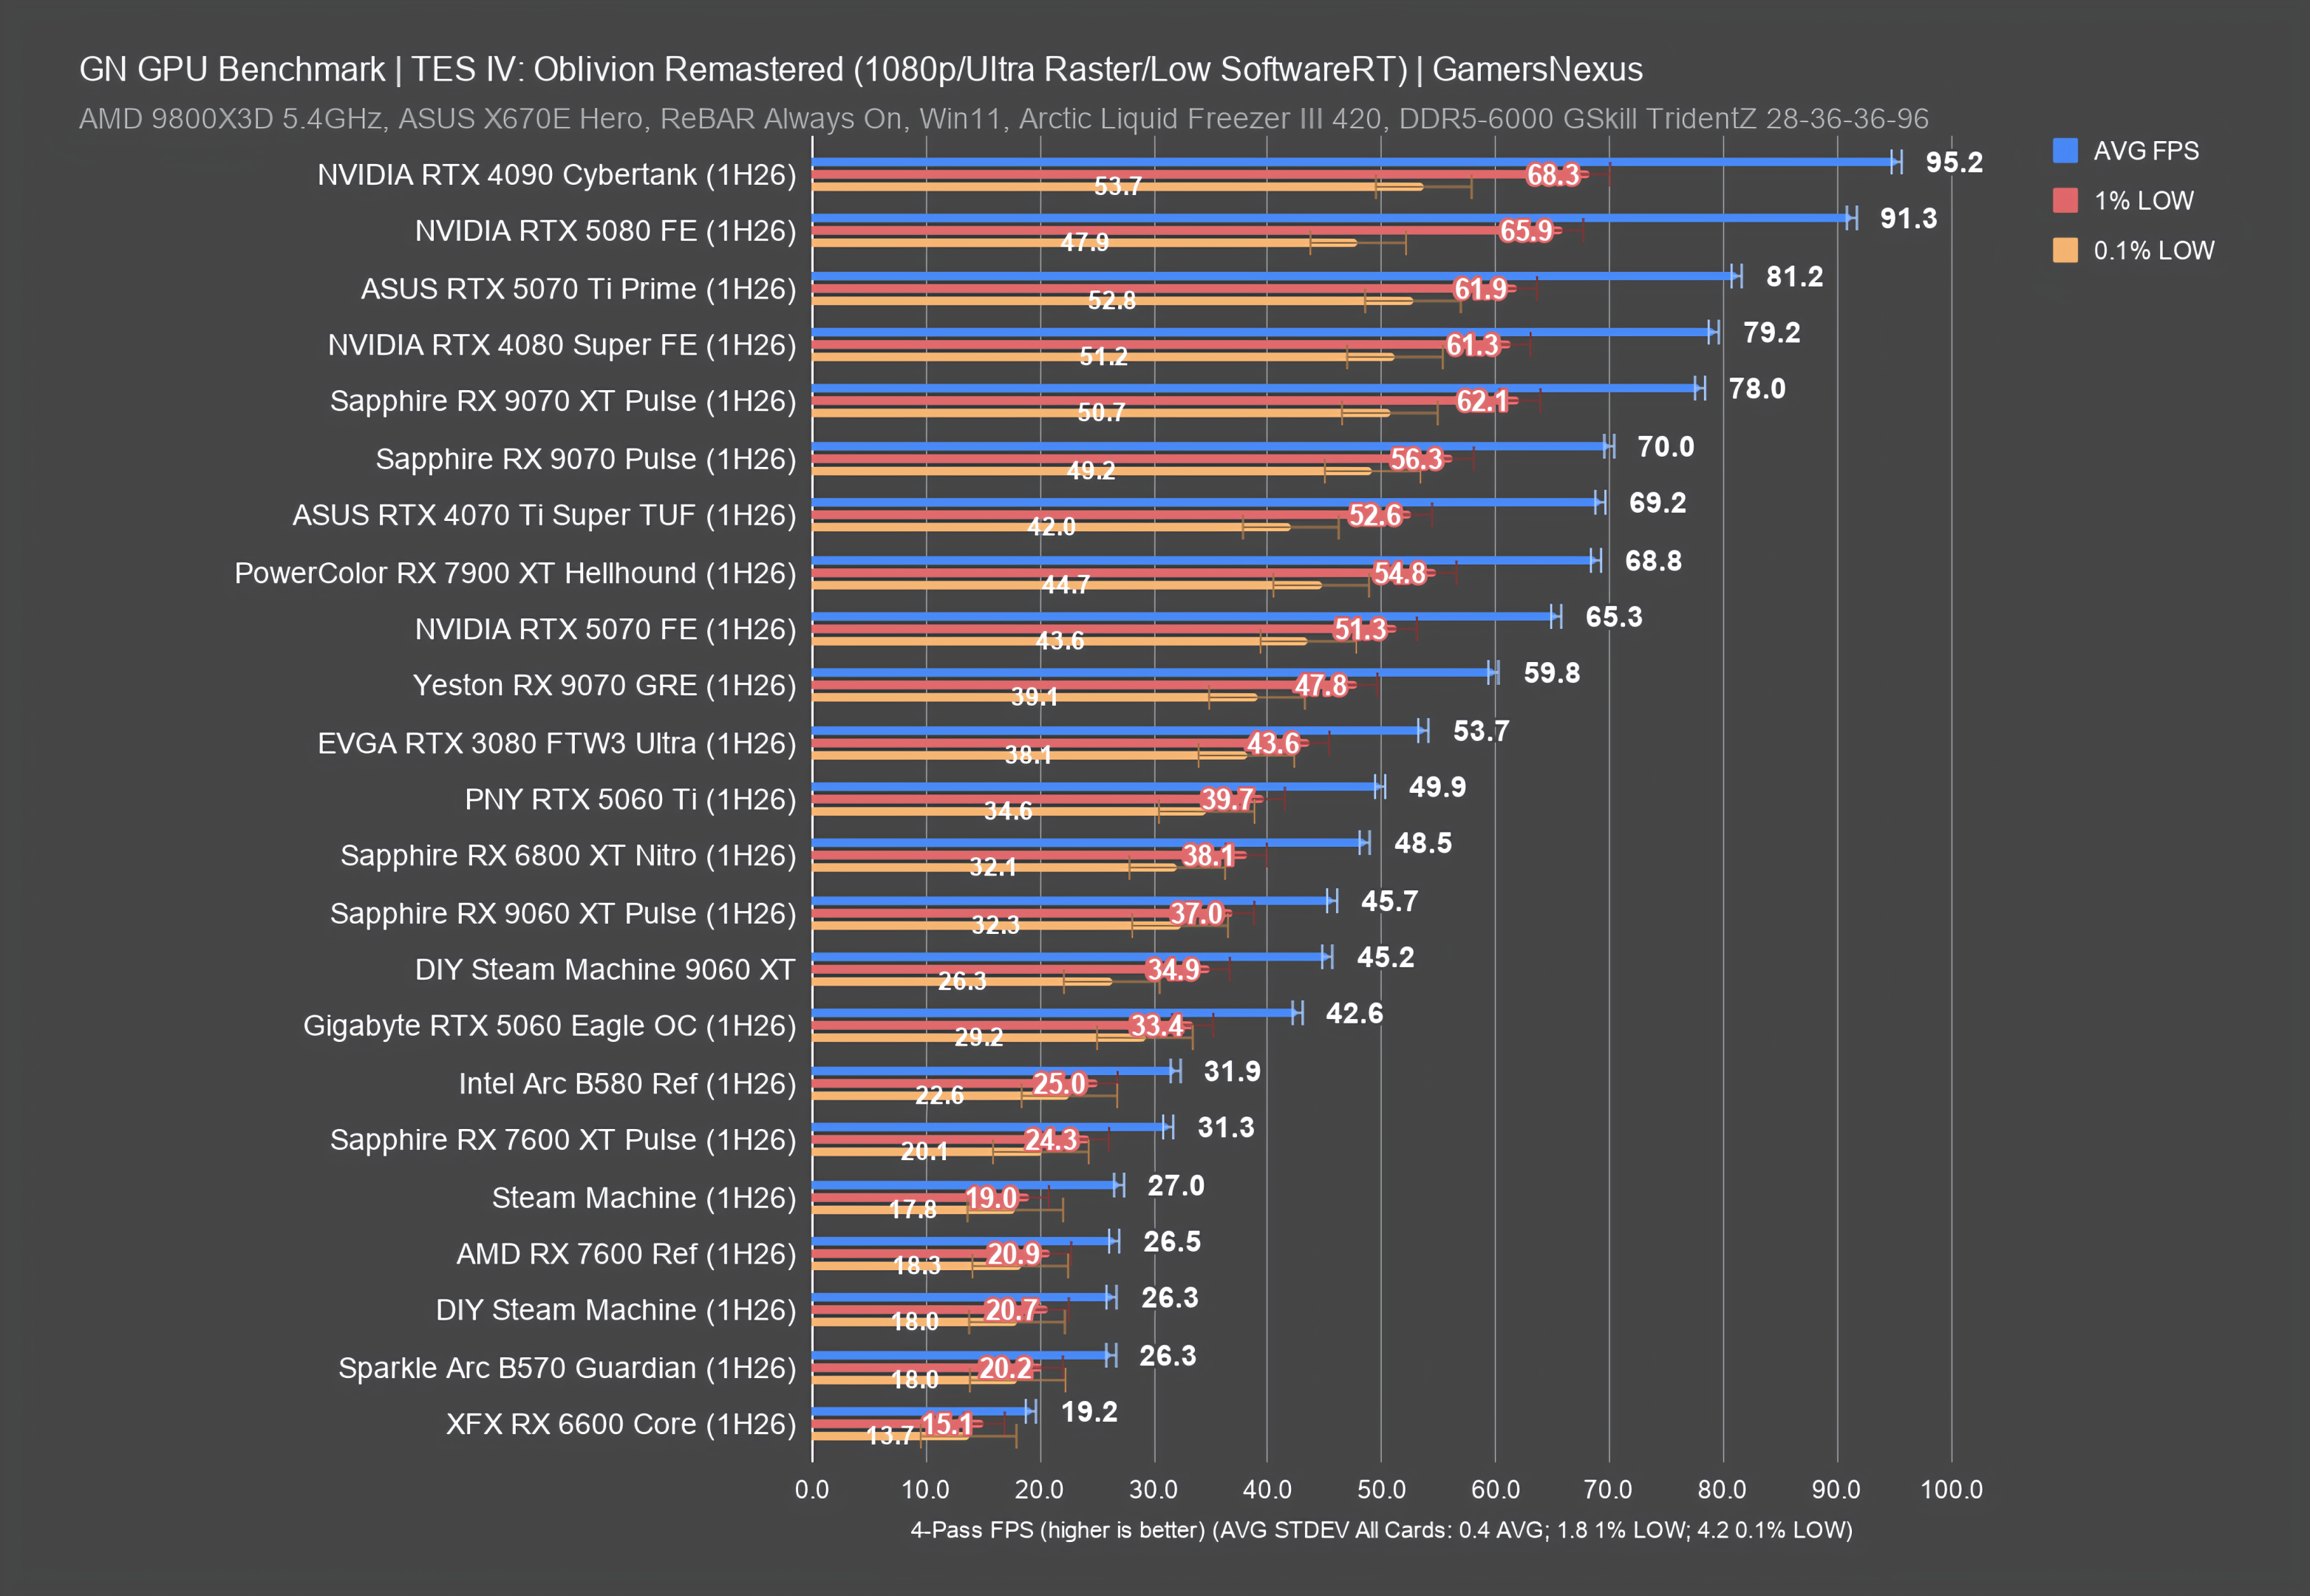
The next set of tests looks at the best video cards for The Elder Scrolls IV: Oblivion Remastered. The game is newer to our benchmark suite and also relatively heavy, so has fewer results. To properly test this game, you also need to wait a significantly longer time for shaders to compile (including sometimes in the background), otherwise the experience will have higher frametime inconsistency than overall acceptable. The game feels like somewhat of a homecoming, seeing as GamersNexus started in 2008 and Oblivion launched in 2006, making it an early benchmarking title for us (as hobby work, not as published work). Notably, the AMD RX 6600 is present for 2026 benchmarks in this one.
4K GPU Benchmarks
1440p GPU Benchmarks
1080p GPU Benchmarks
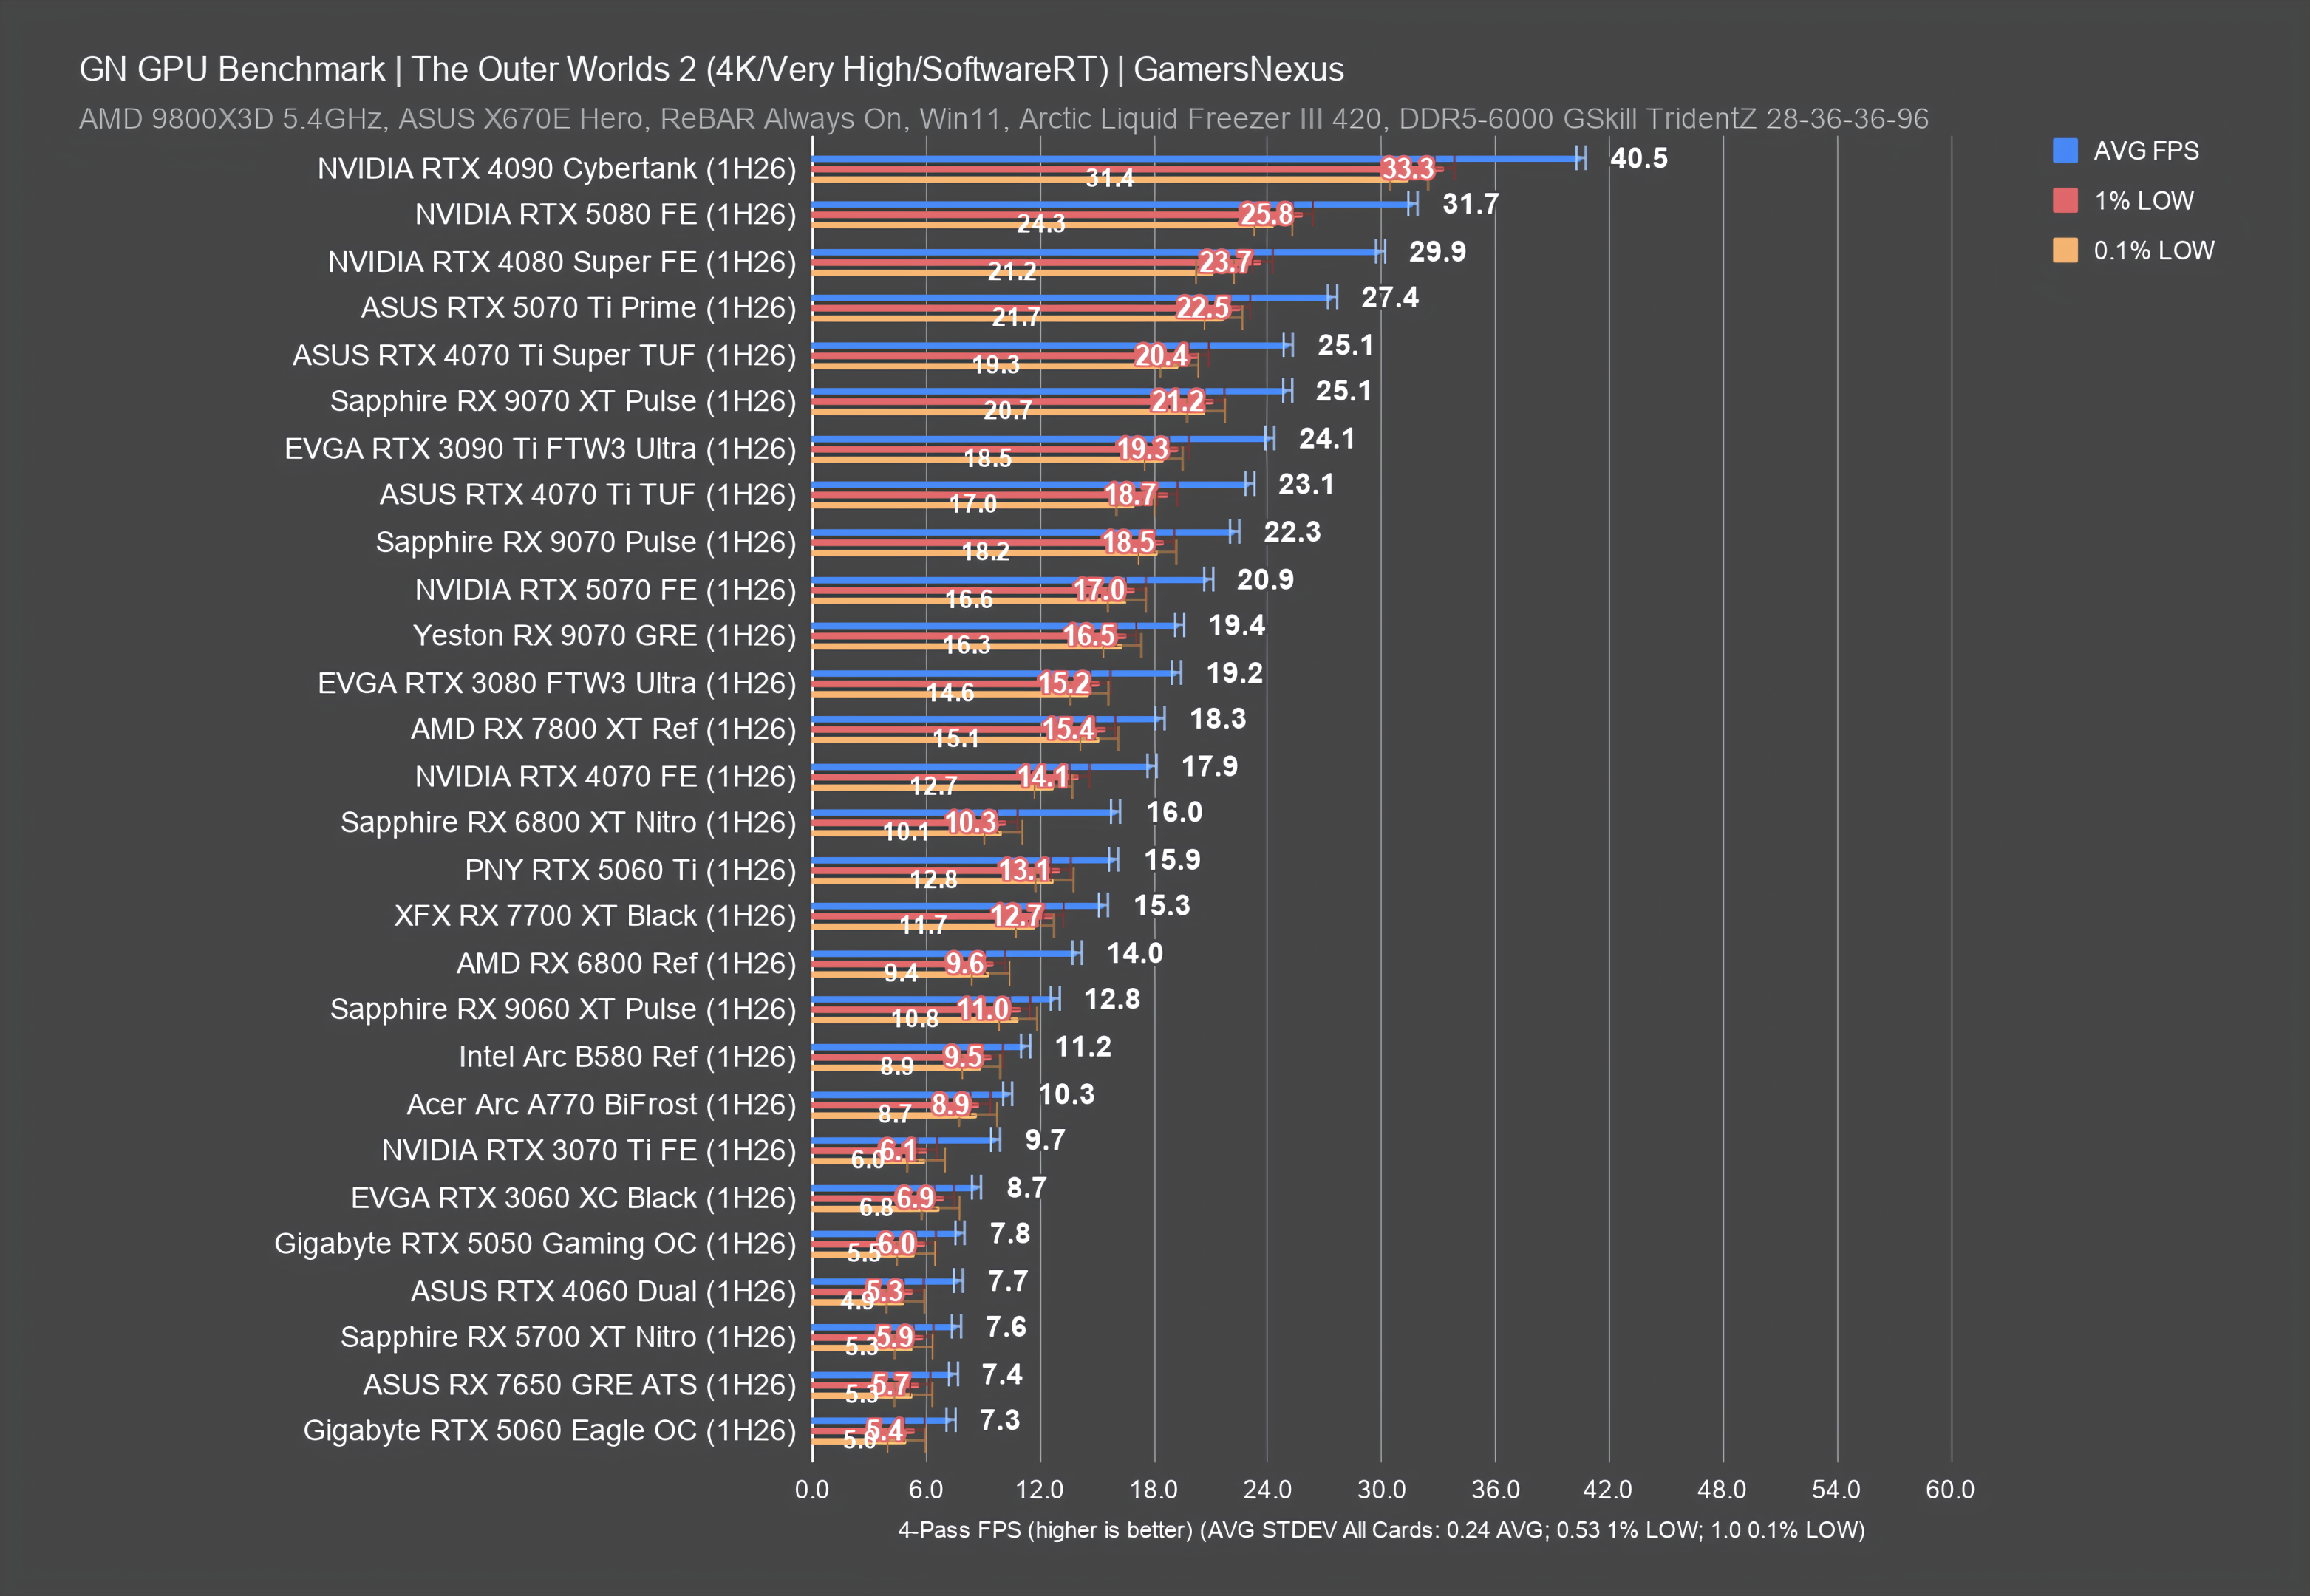
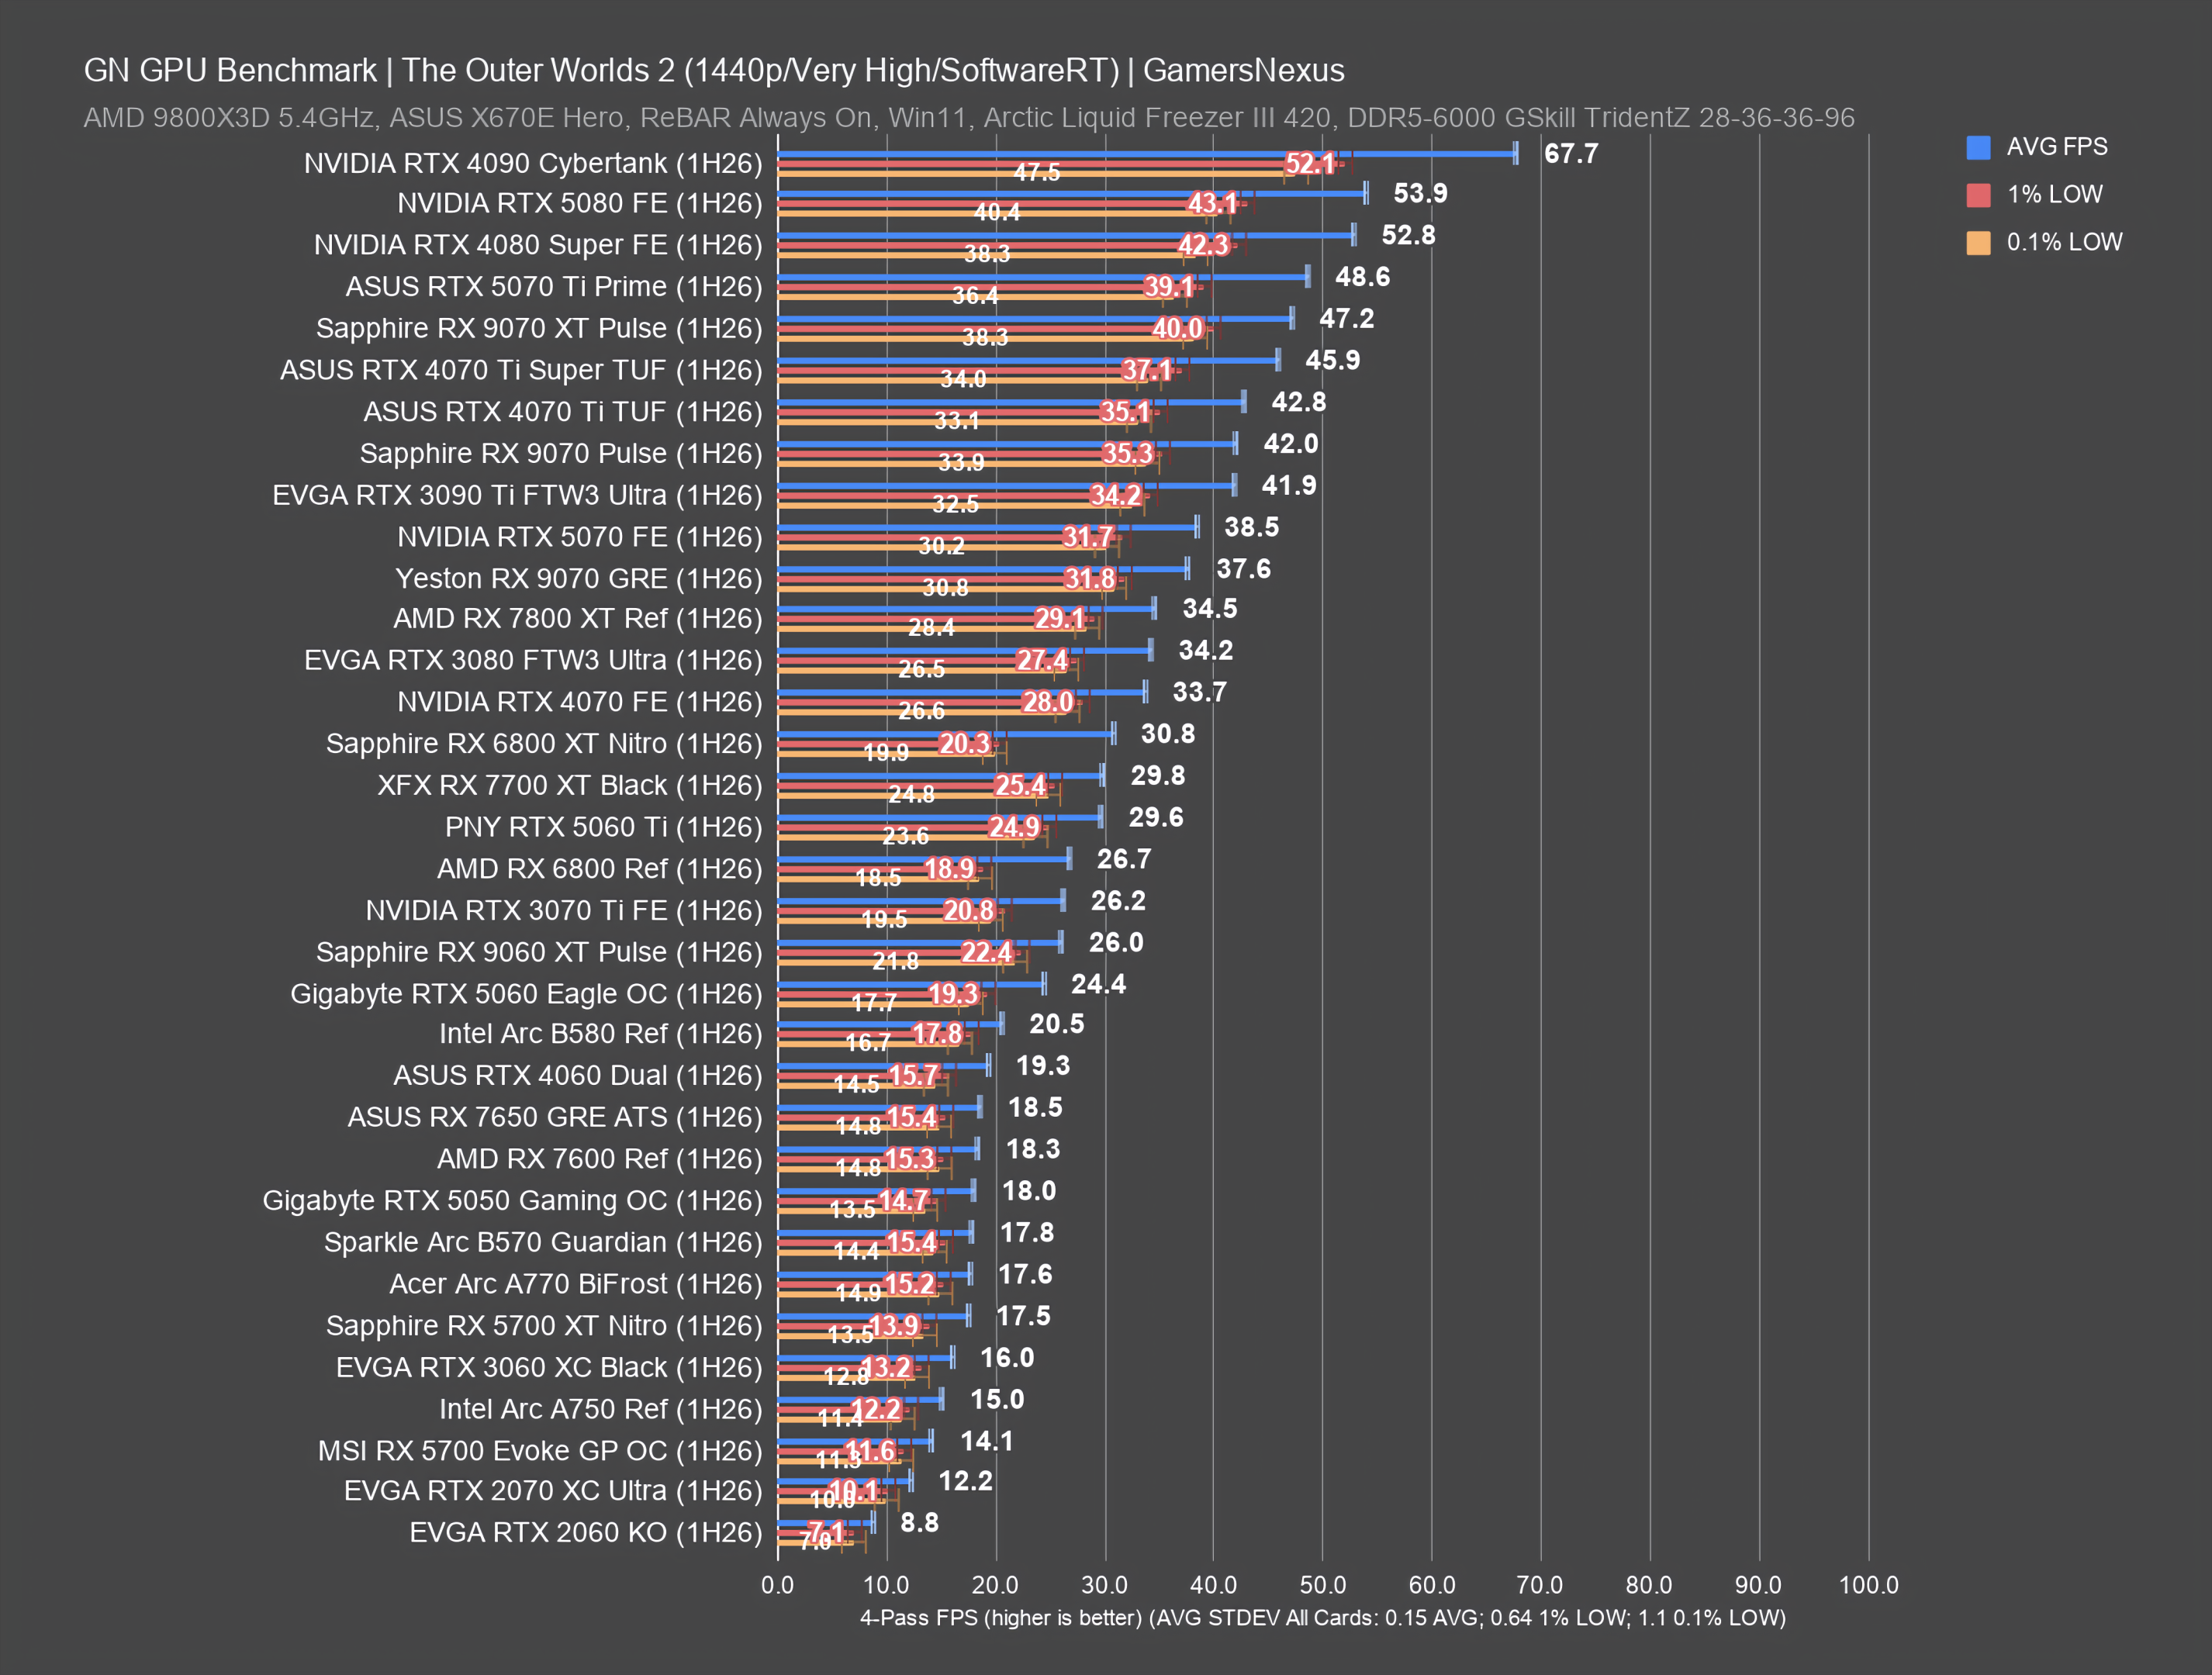
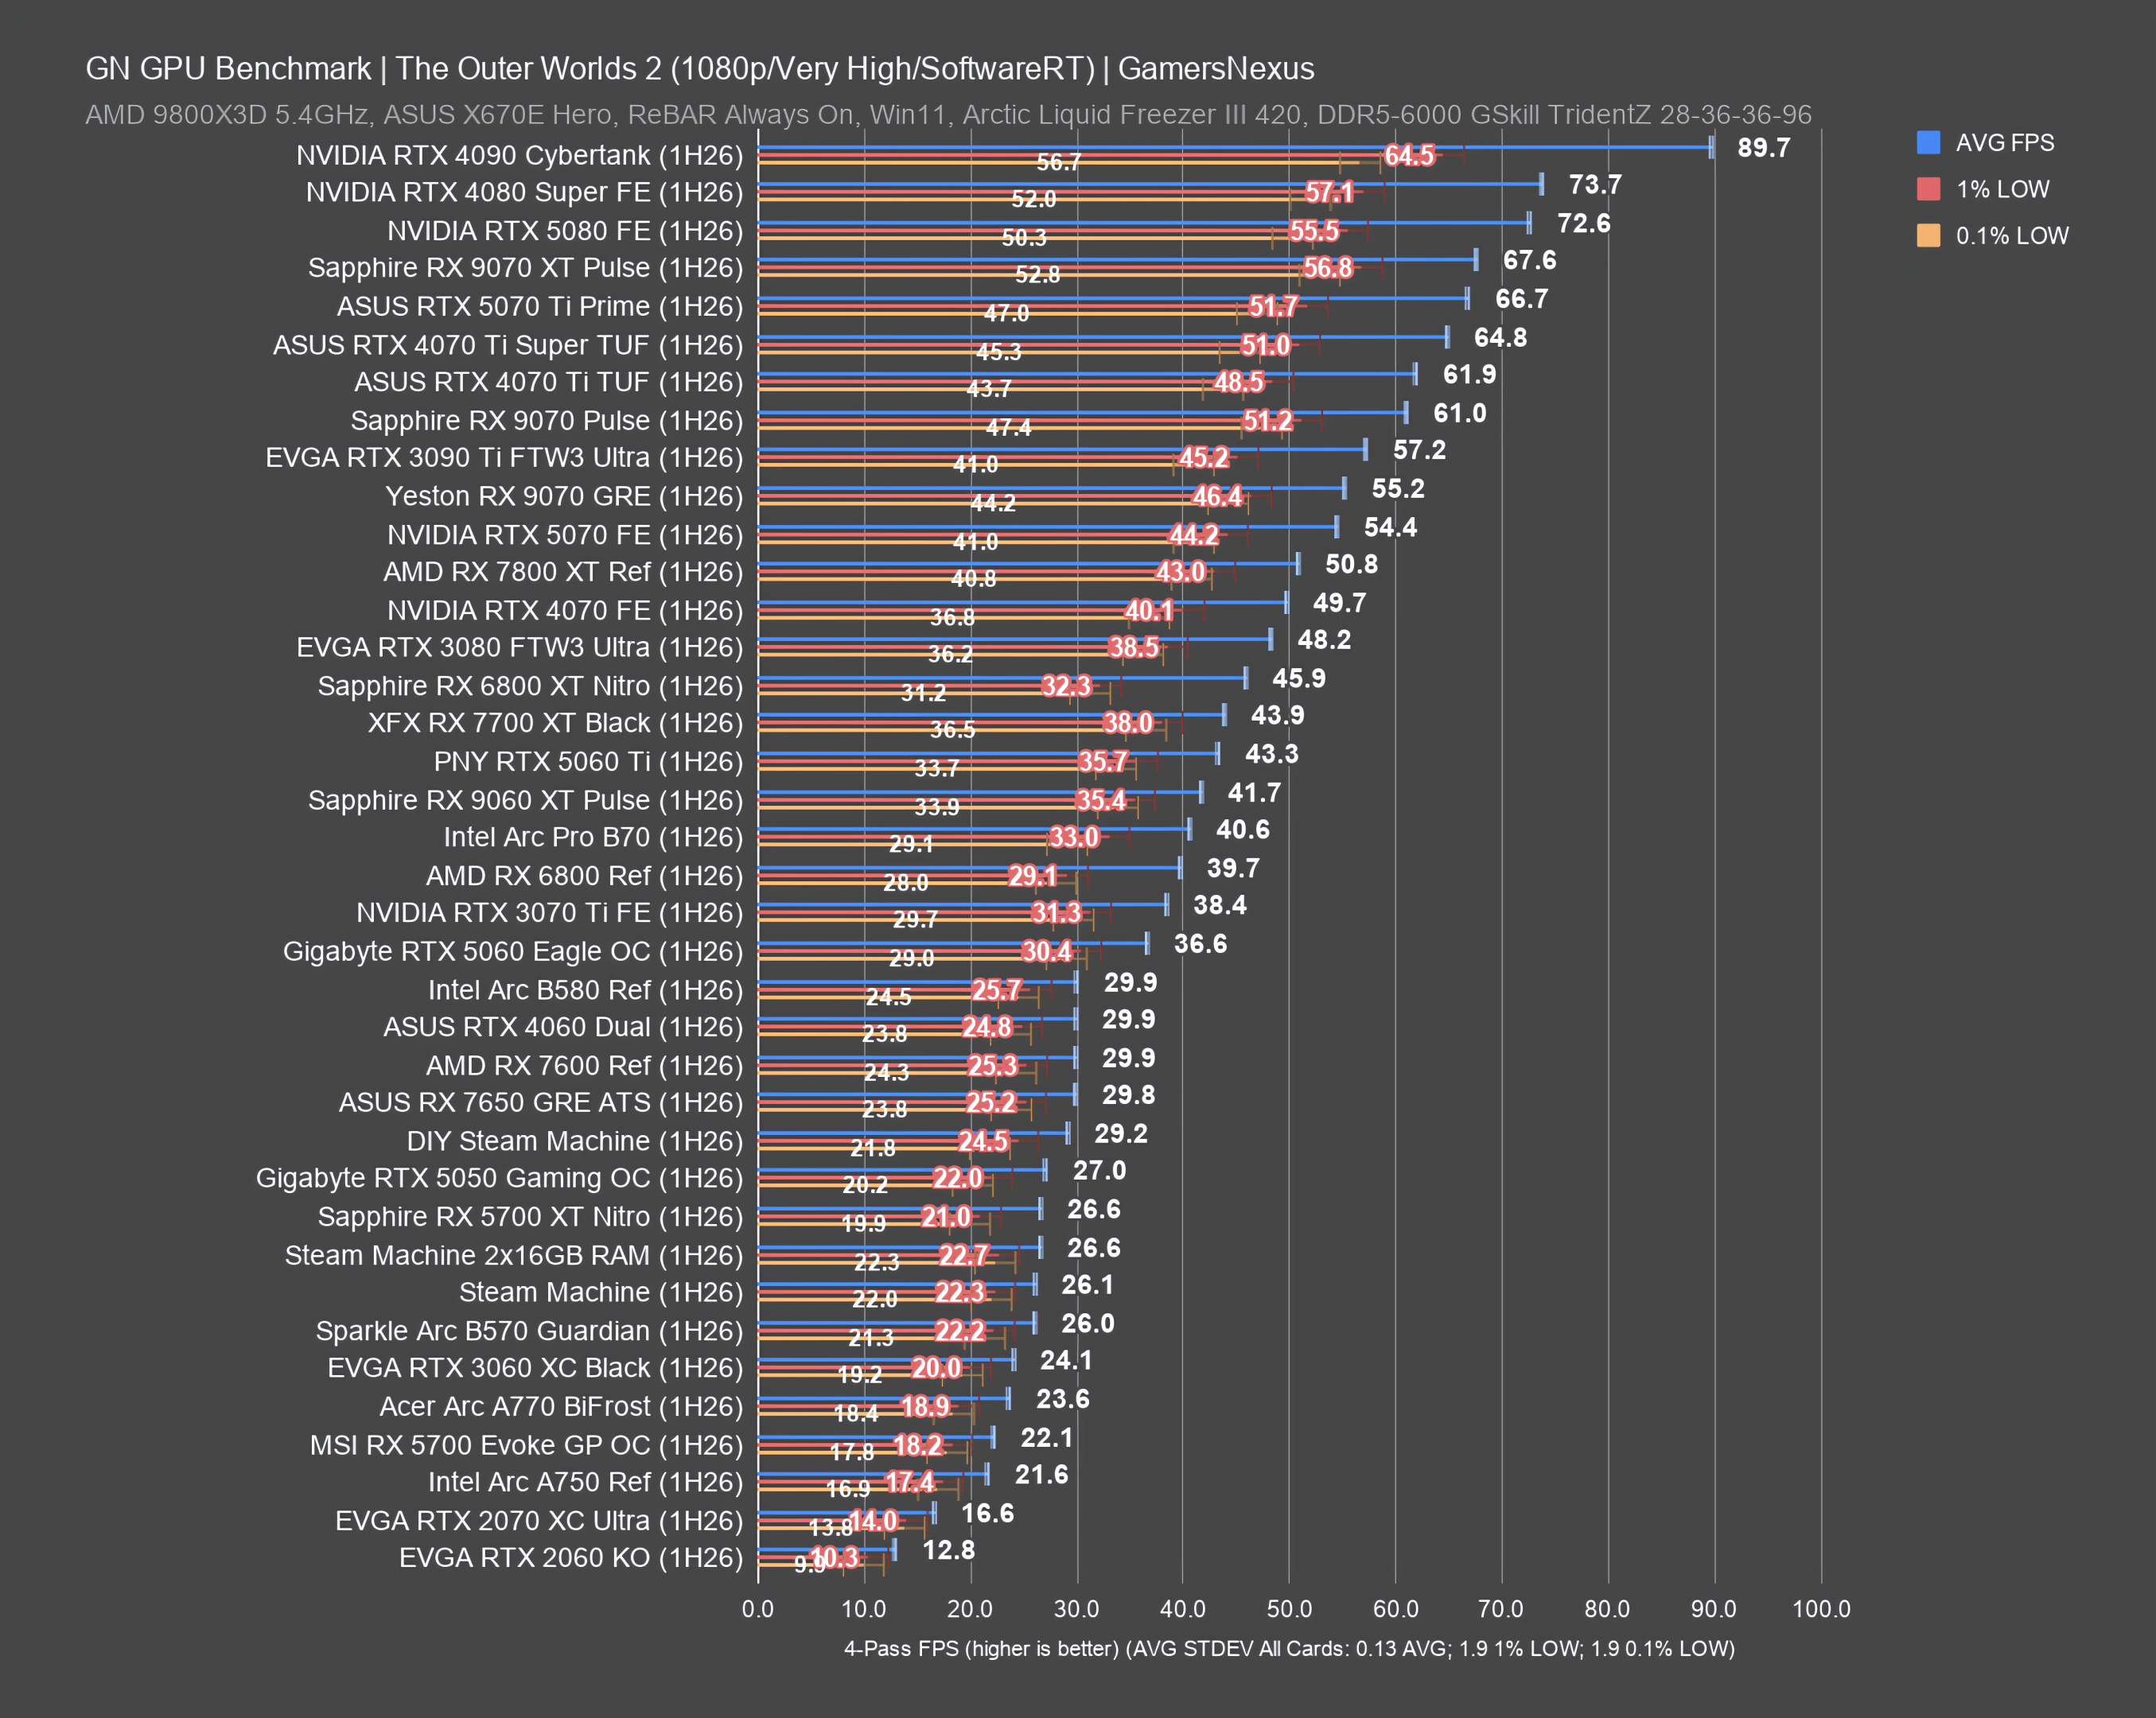
The Outer Worlds 2 Video Card Comparisons
The Outer Worlds 2 is next, another new game to our test suite with fewer comparisons on it.
4K GPU Benchmarks
1440p GPU Benchmarks
1080p GPU Benchmarks
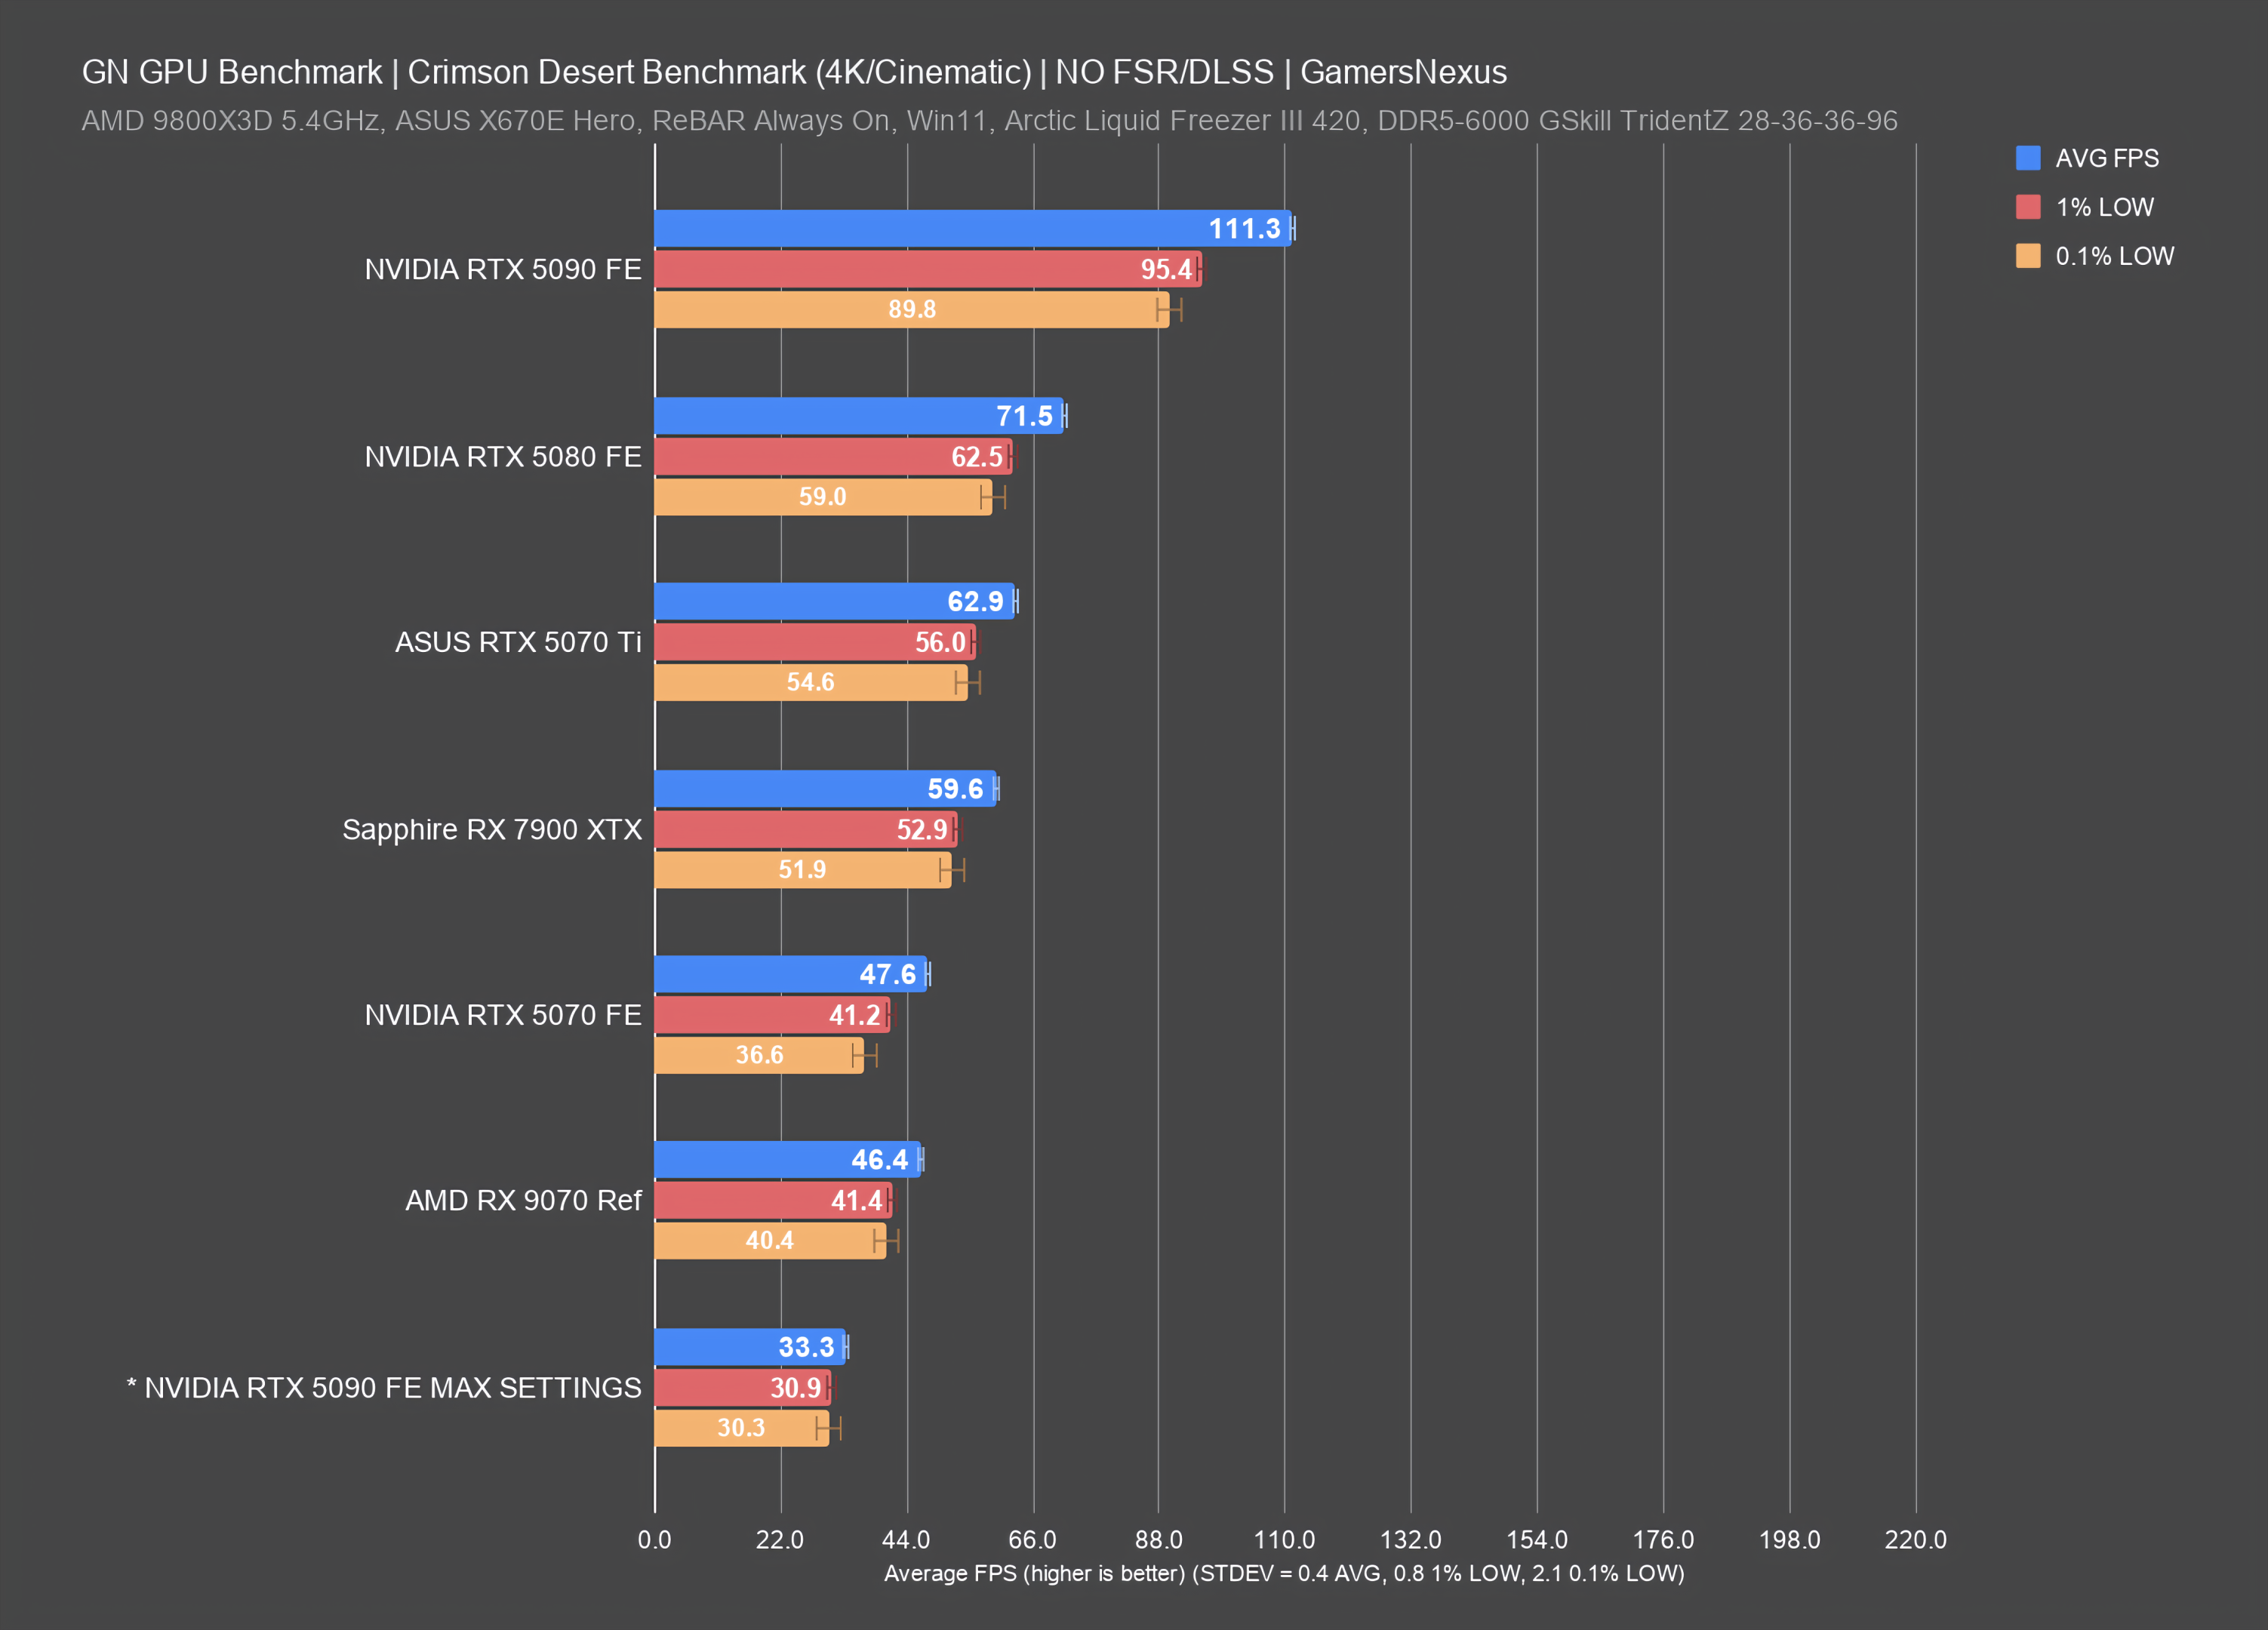
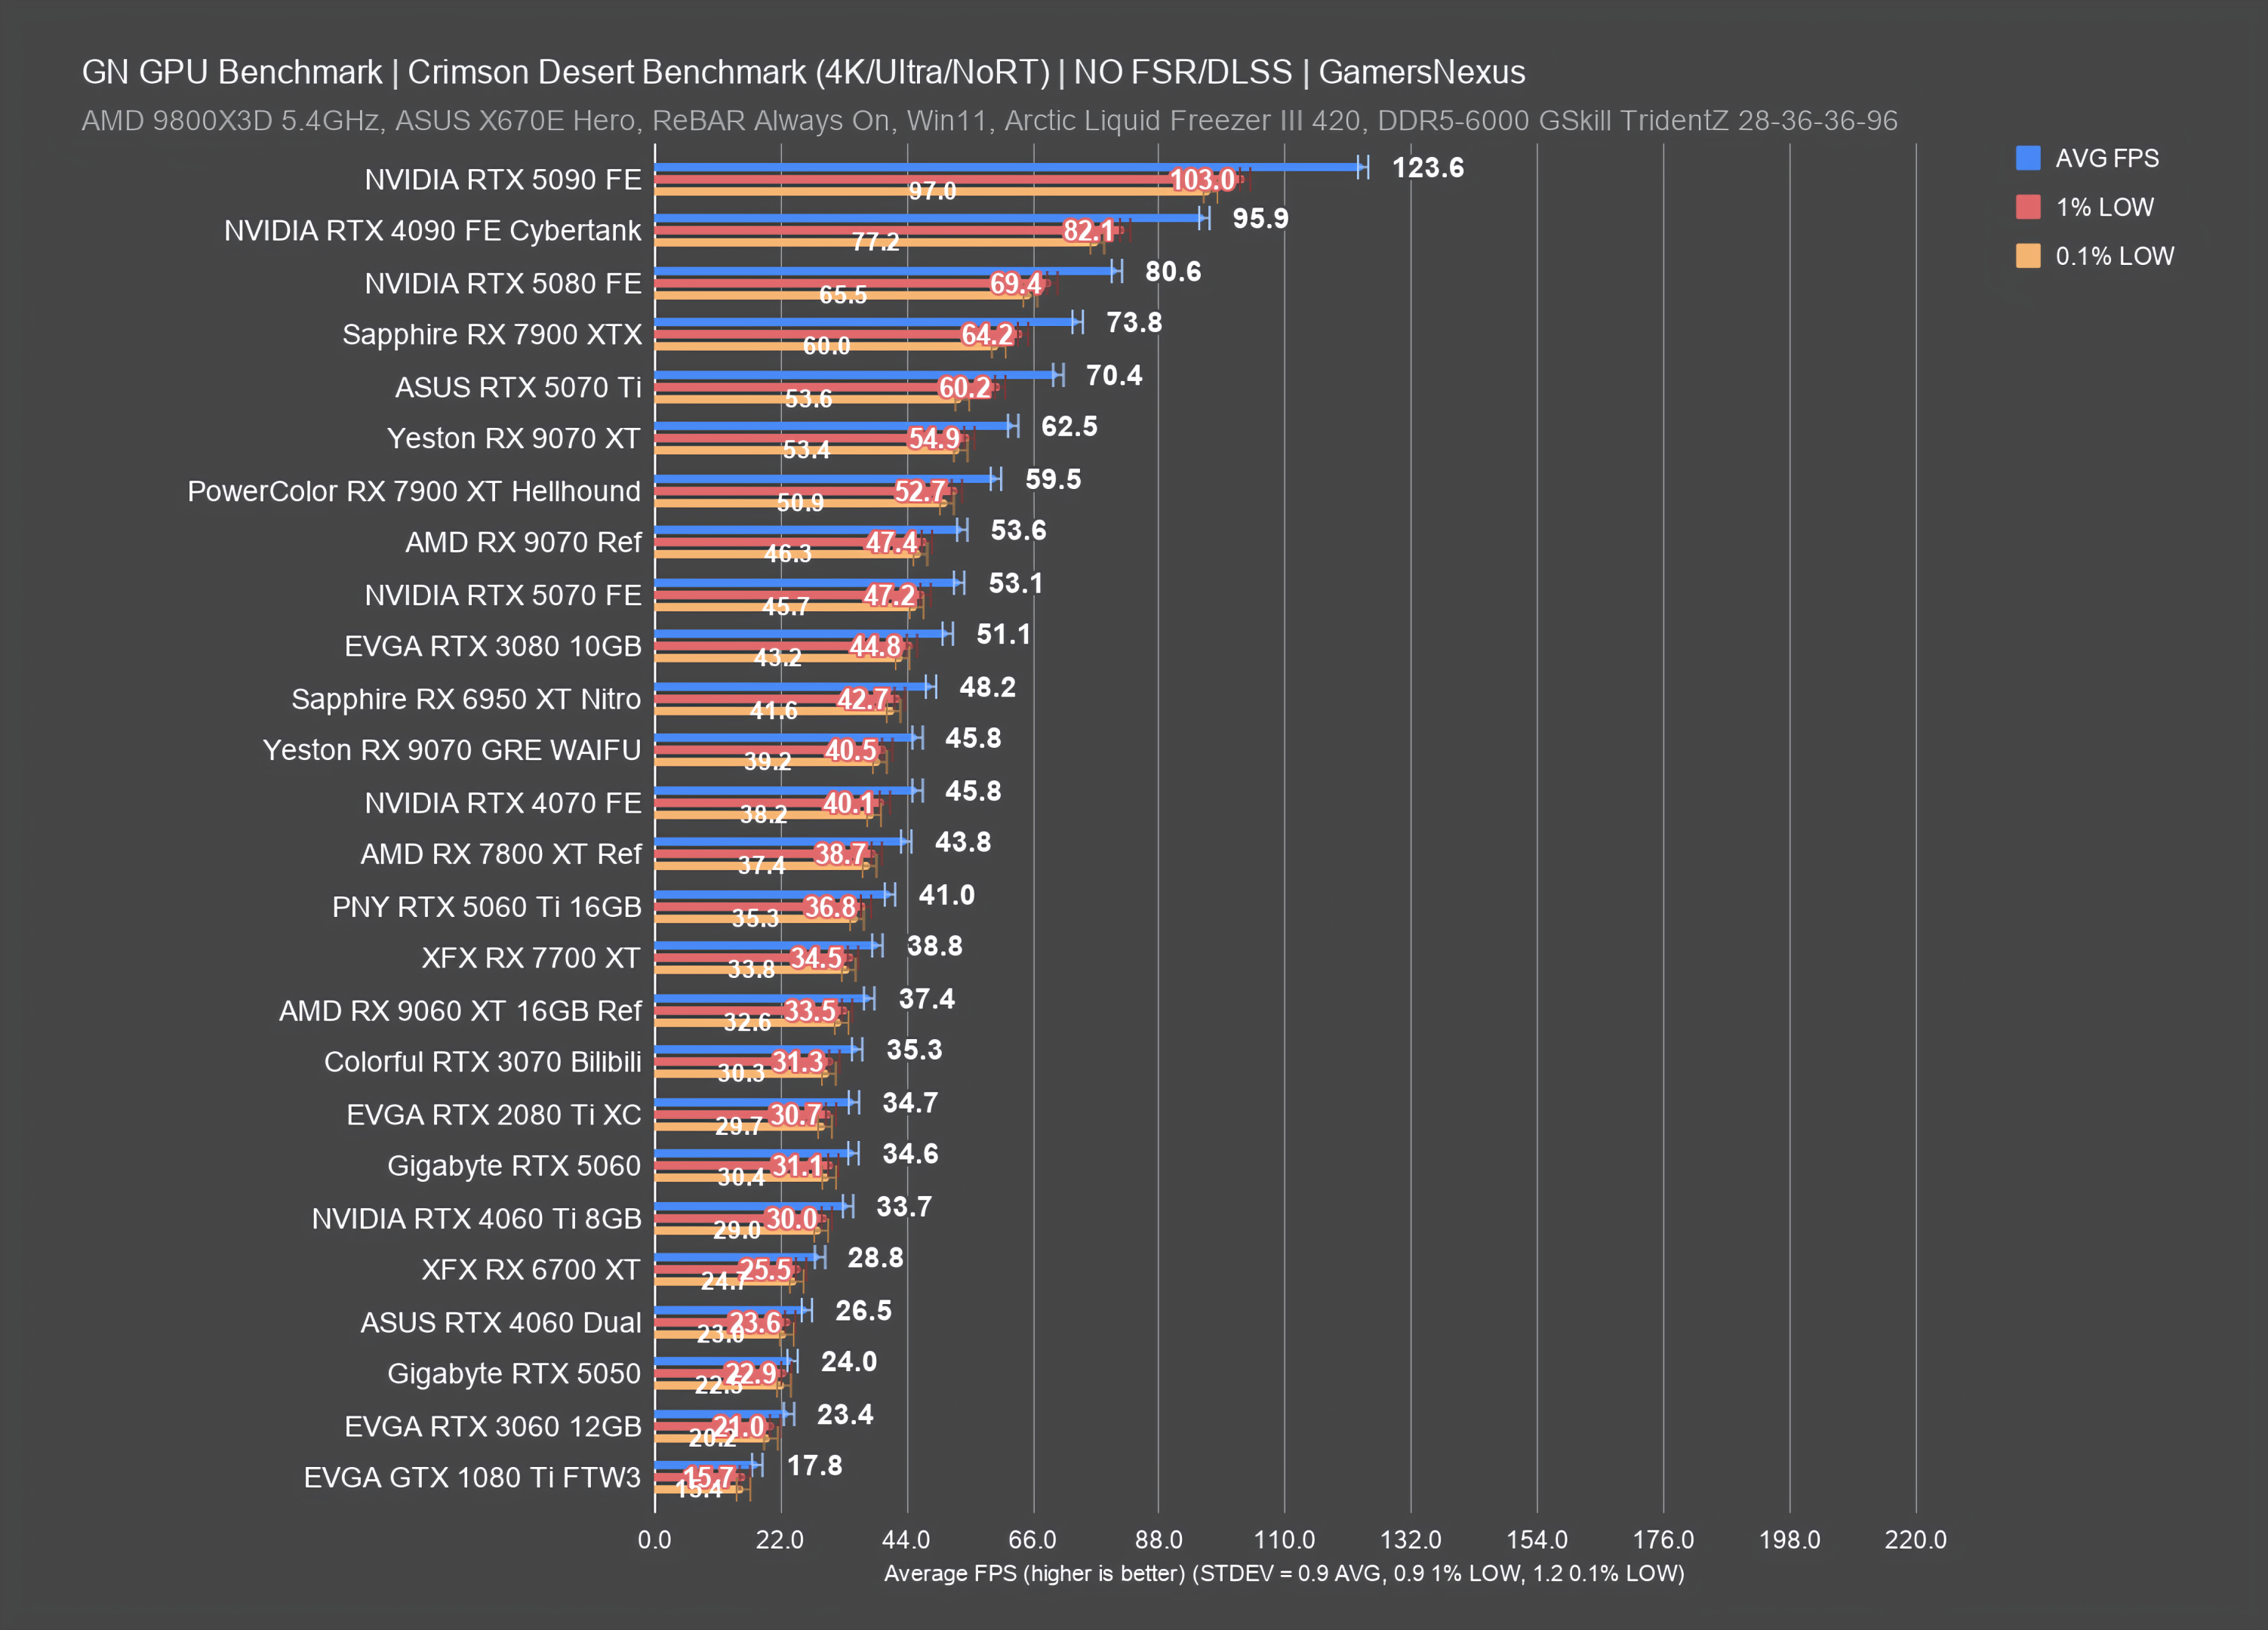
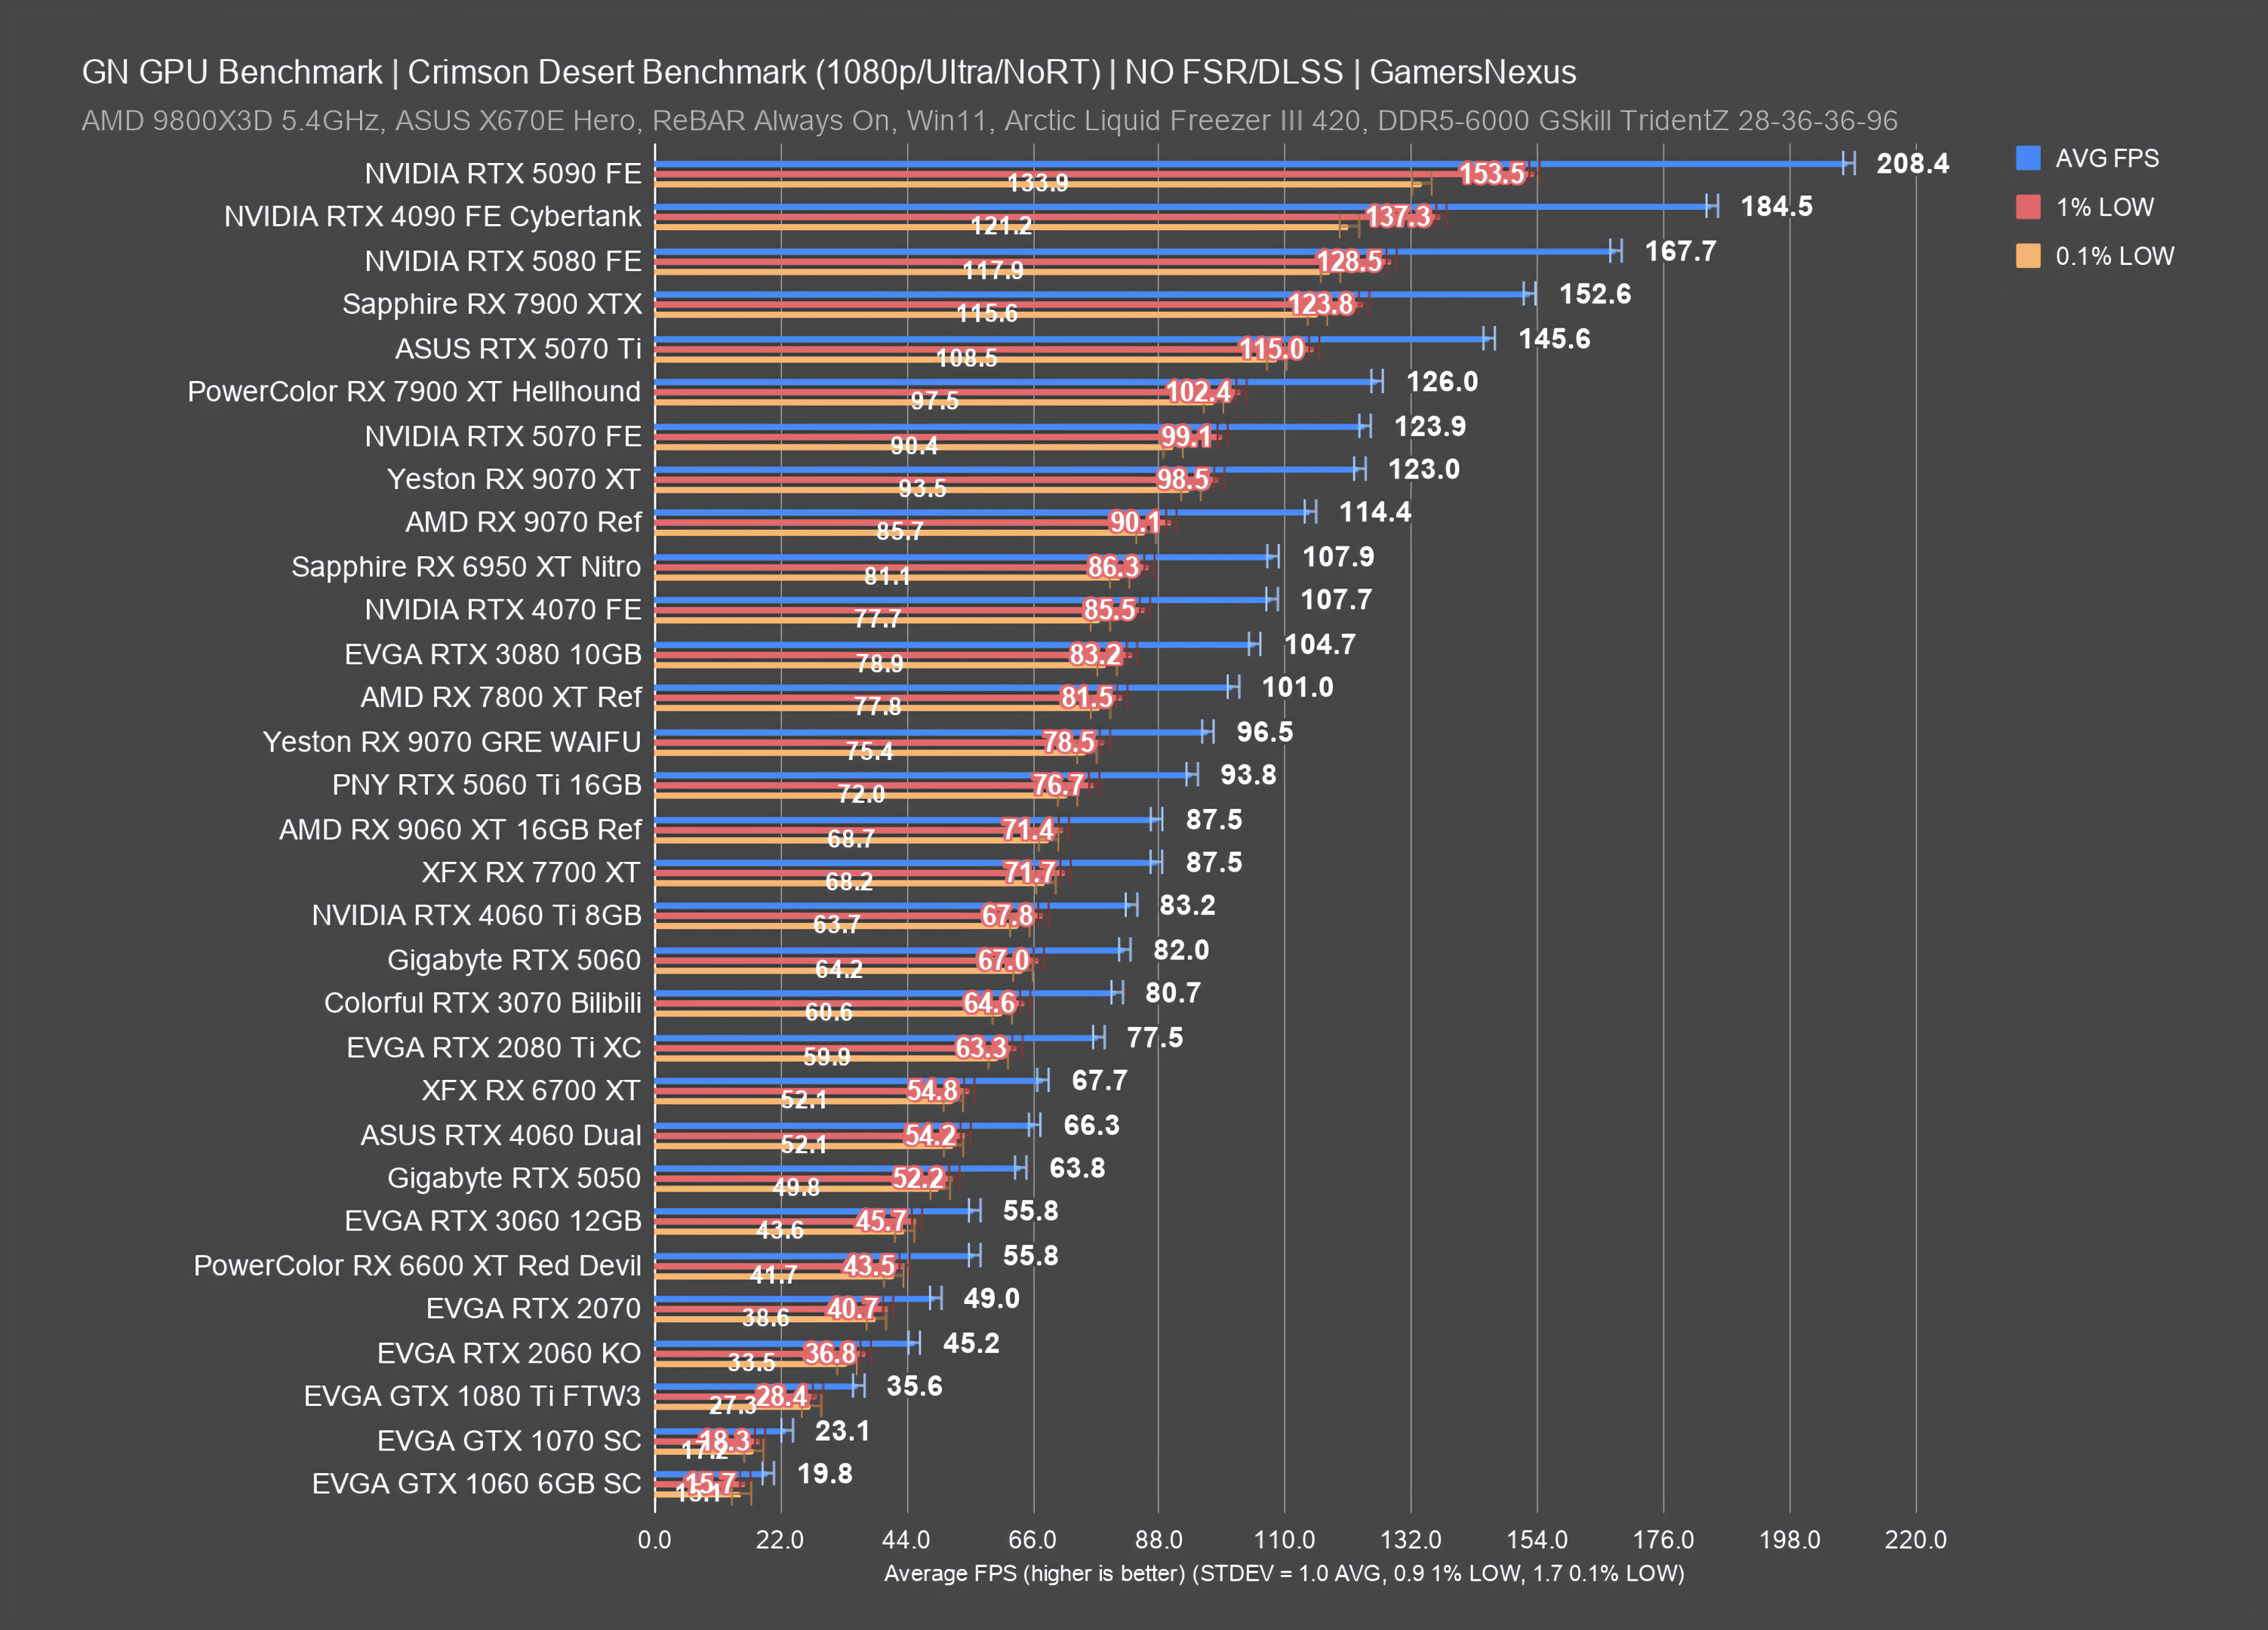
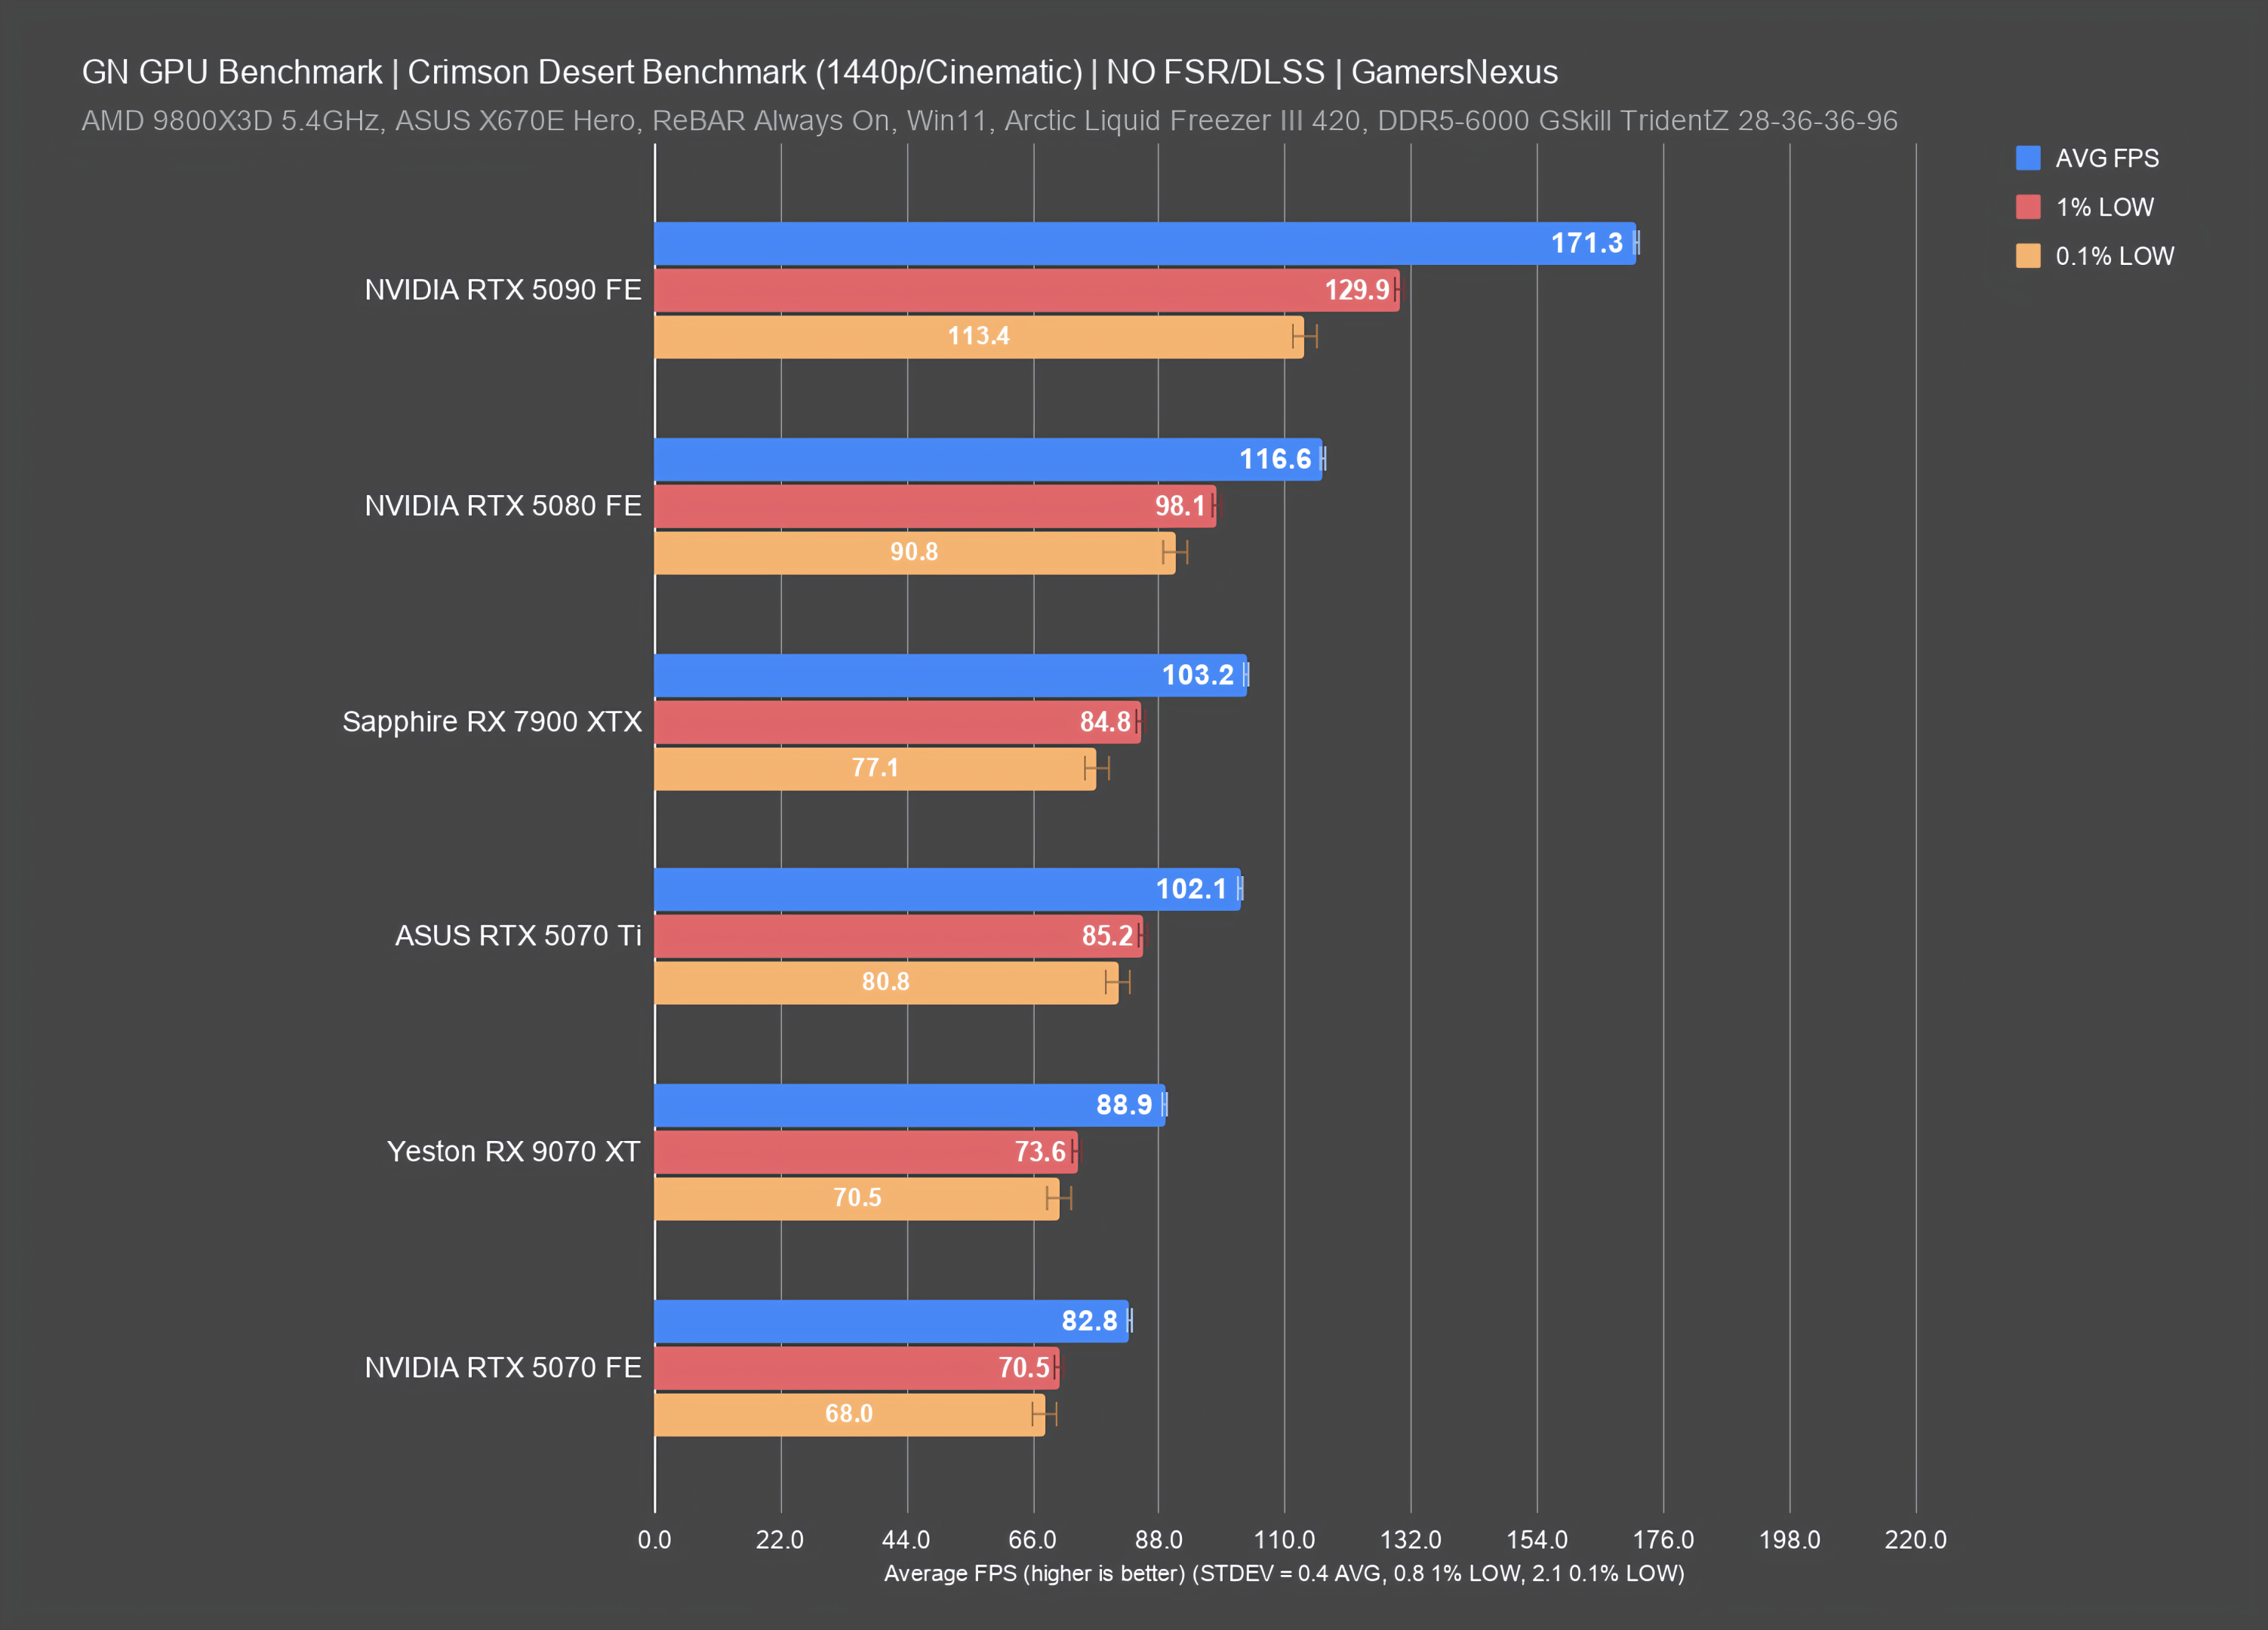
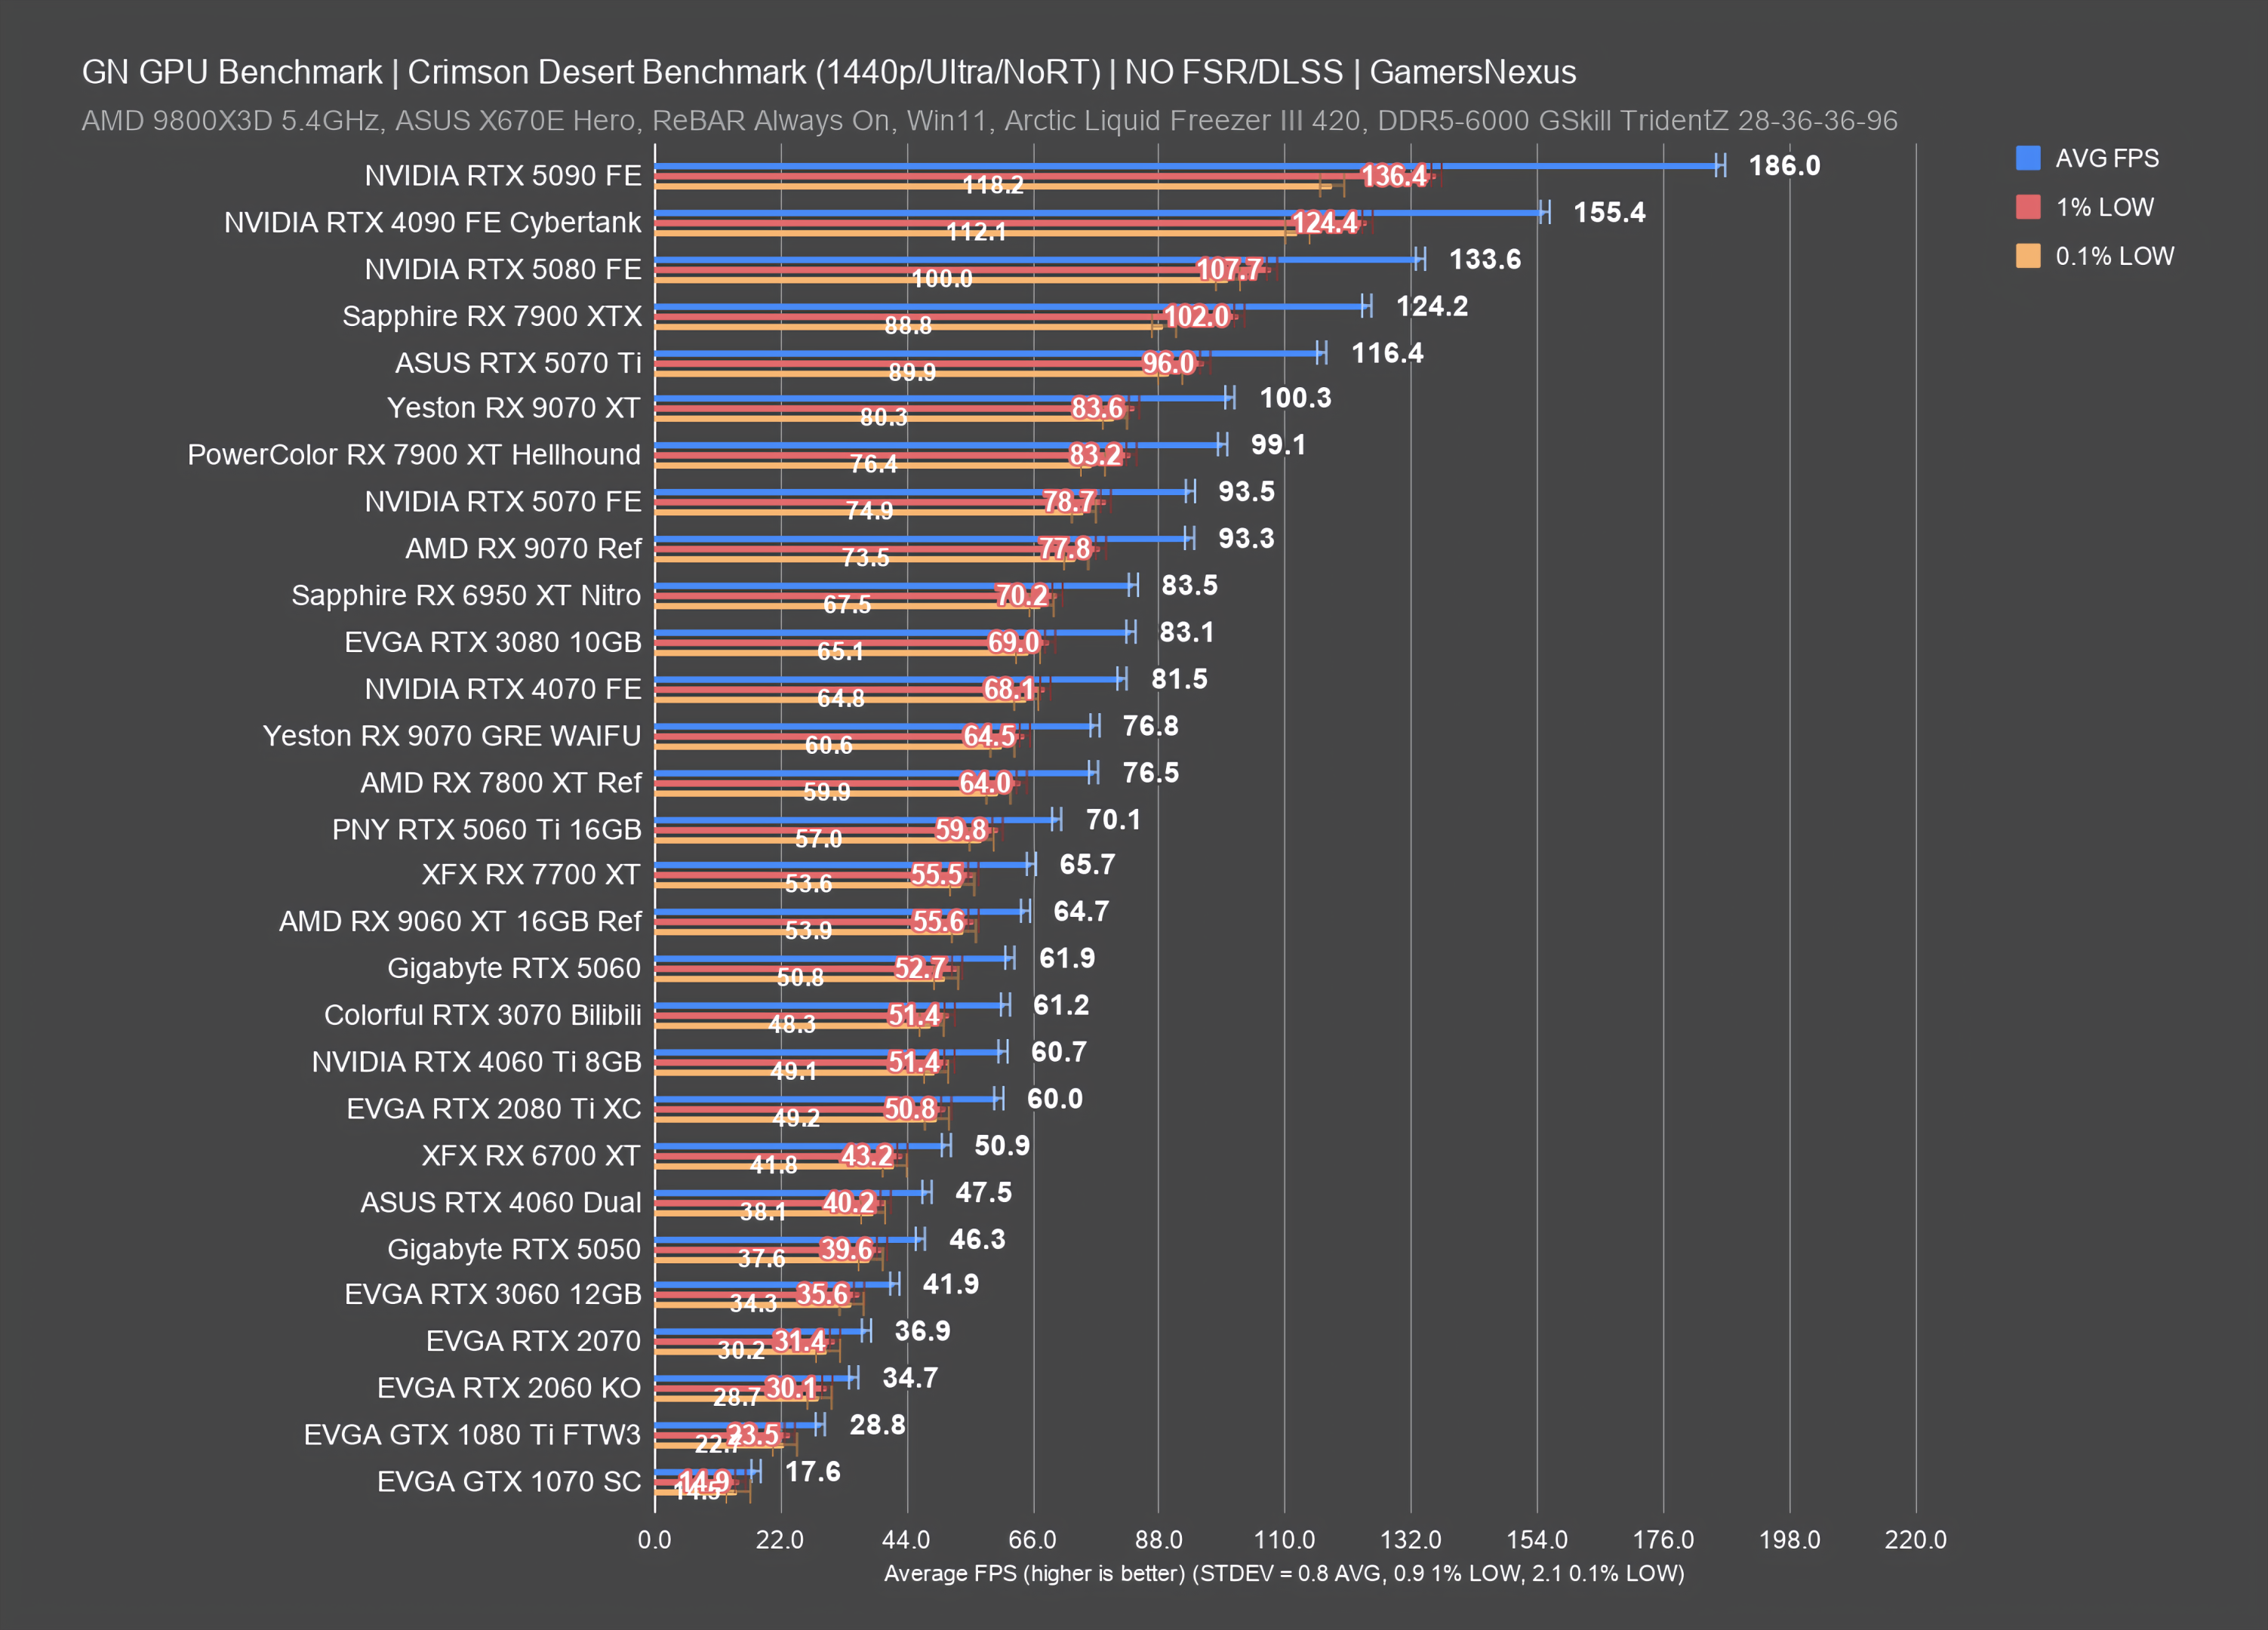
Crimson Desert GPU Benchmarks & Comparison
This data comes from our Crimson Desert launch benchmark series that explored performance and tested for simulation time error (in addition to frametime and frame rate testing).
Ray Tracing Benchmarks
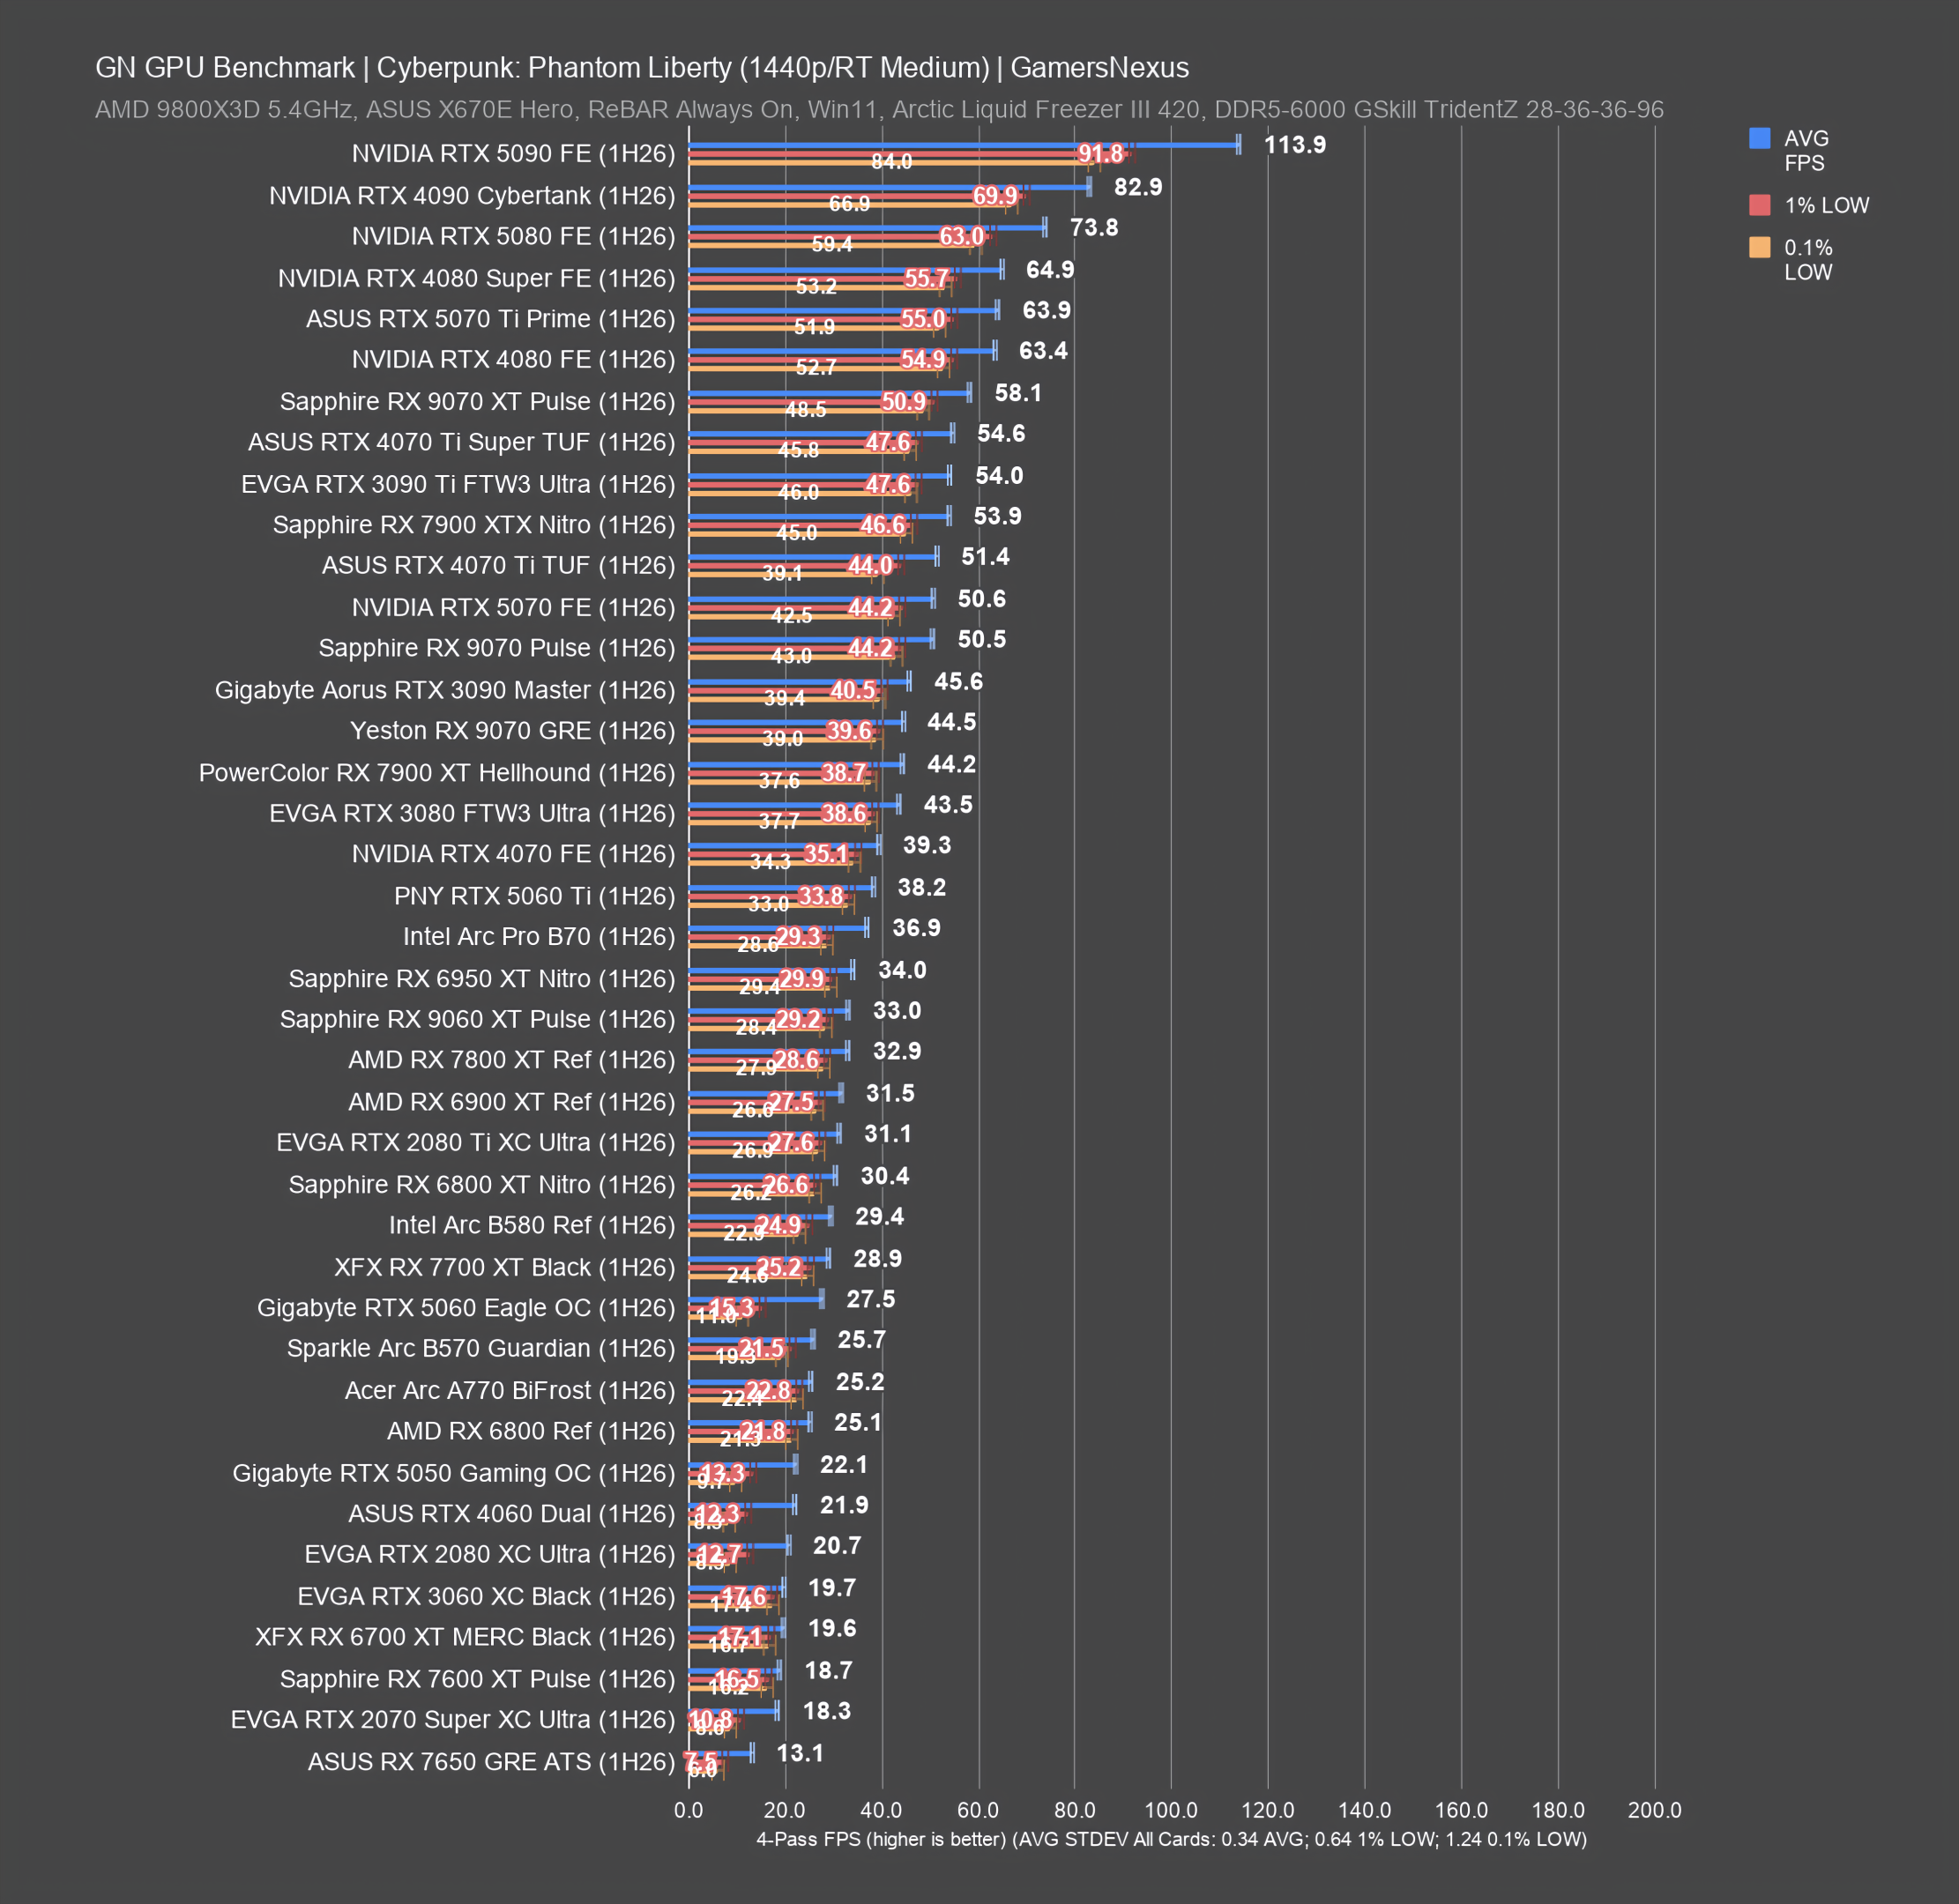
Although we have more ray tracing benchmarks published in our reviews, we're only maintaining a very short list for the current Mega Charts long-term support version of this testing.

Ray Tracing - Black Myth: WuKong Benchmarks
Ray Tracing - Cyberpunk 2077: Phantom Liberty
Ray Tracing - Dragon's Dogma 2
Update Log
The below is an update log of changes to this page. The format is MM/DD/YYYY:
- 08/03/2026: Initial creation of the GPU Mega Charts page.