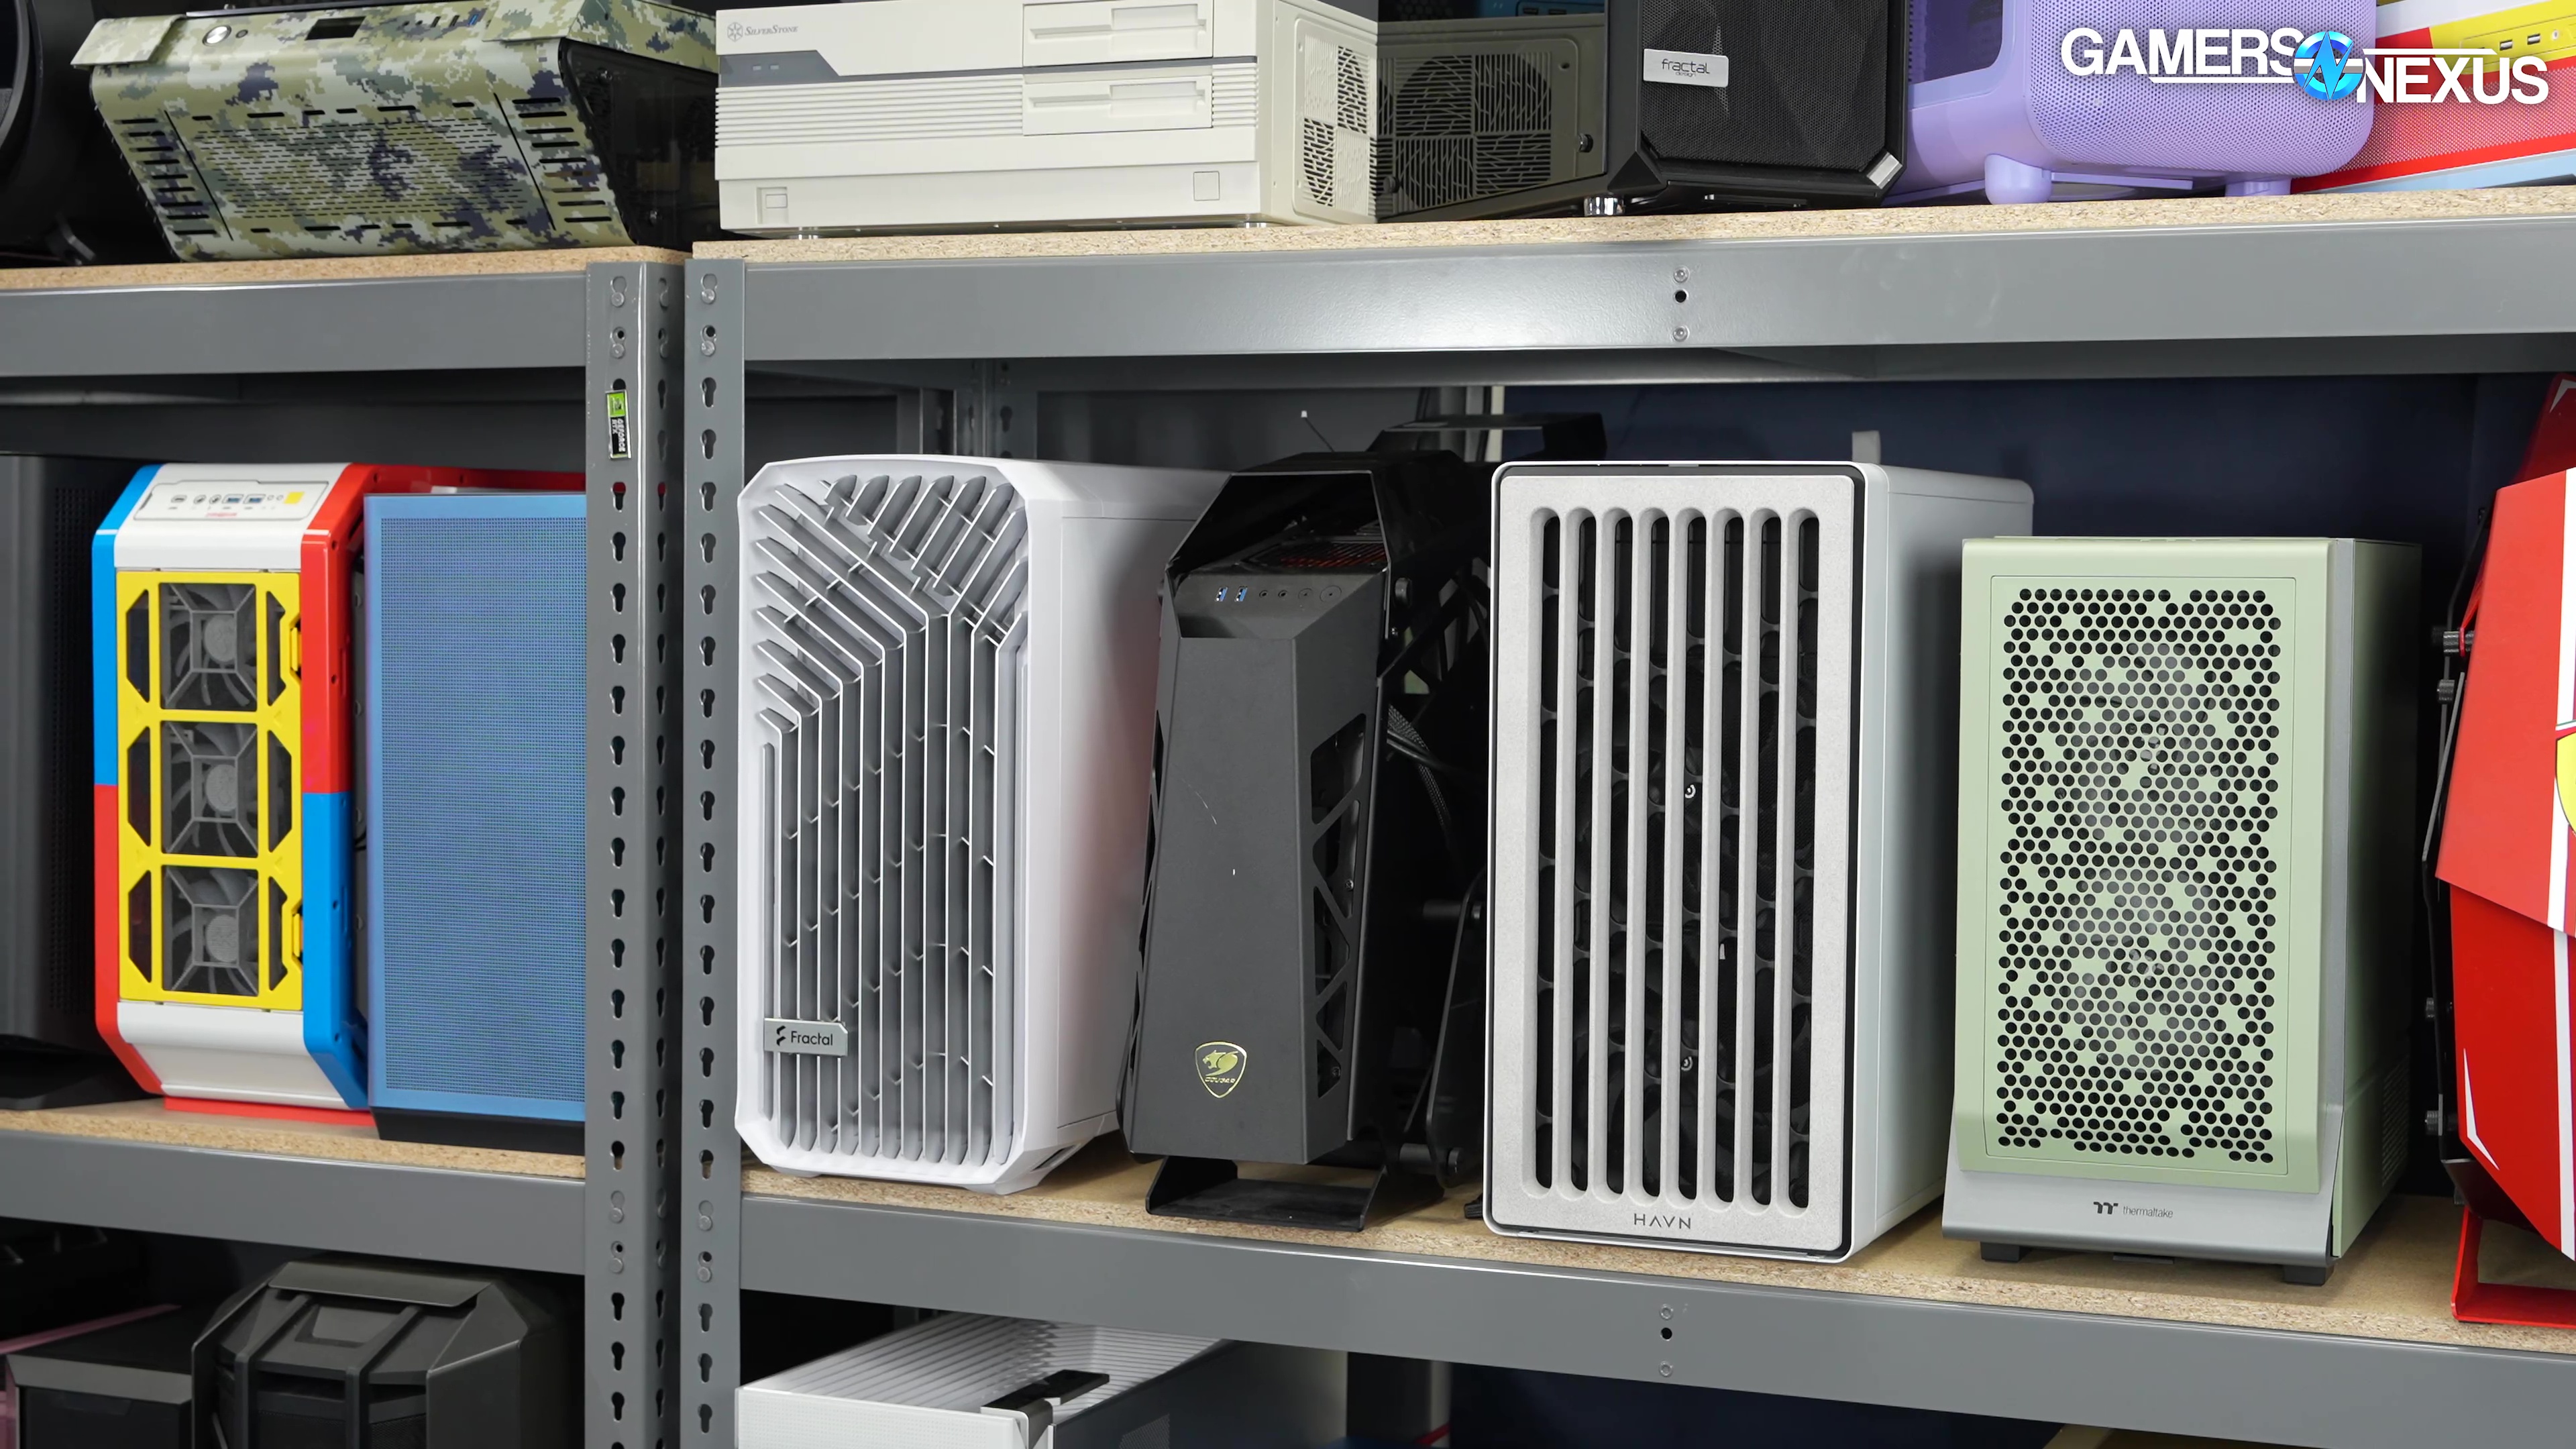
We've tested around 100 configurations of PC cases for gaming computers, workstations, and homelab DIY builds. These GN Mega Charts include our benchmarks.
The Highlights
- This data is collected as a long-term support dataset of computer case thermals and acoustics
- The data is collected, processed, and written-up by people, not "AI"
- This page will be infrequently updated and kept as a large data store.
- The newest data (and newest reviews) will be appended infrequently, but can be found in standalone case reviews.
- This is part of our Mega Charts series. You can check our Features page for more of these
- Please consider supporting this effort on Patreon or our GN Store
Table of Contents
- AutoTOC

This Mega Charts page is a database of hundreds of entries across 5 primary charts for our computer case reviews, and almost 100 entries on the full speed fan chart alone. The charts include directly comparable results for the best (and worst) PC cases for gaming builds, DIY workstations, budget PC builds, and homelab computer chassis solutions as tested in our like-for-like test process. Mega Charts are our compilations of all data on a given test platform and for a given component, where we collect everything we've tested and put it on one set of charts. We often have to trim data for video reviews, as the 16:9 video format is vertically restrictive (and just to help keep it more focused), so this has all that added back in. These charts also include data previously unpublished in reviews, as sometimes we run things with the intent to review them, but can't make time for the video production time to move forward on the project. This allows us to still put the data out there, even though third-party ads do not fund this particular data.
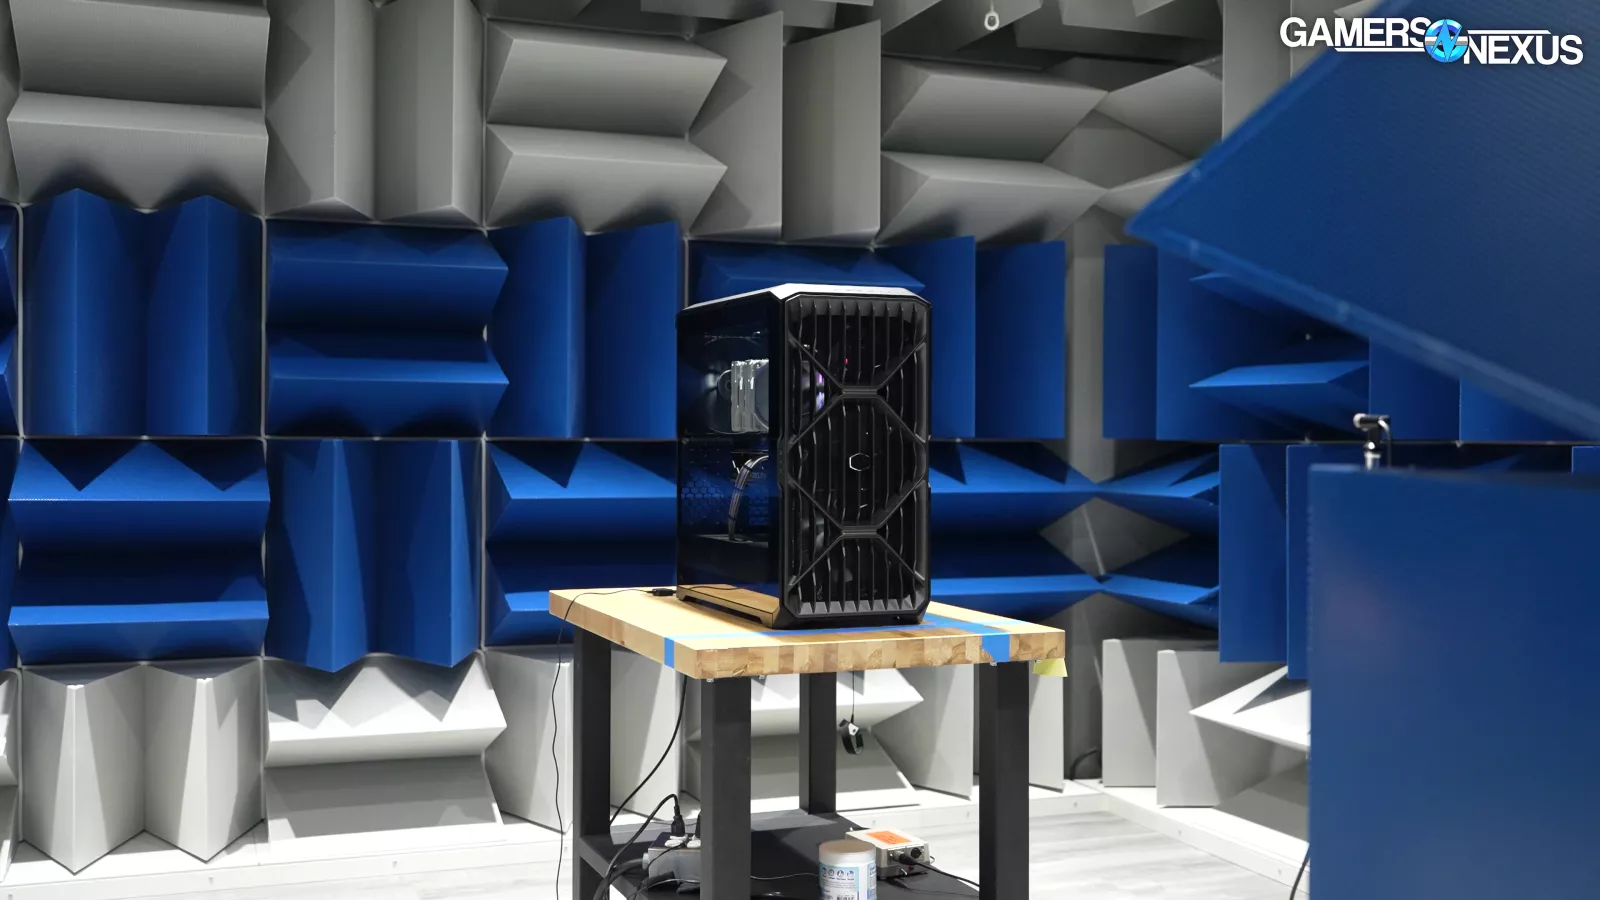
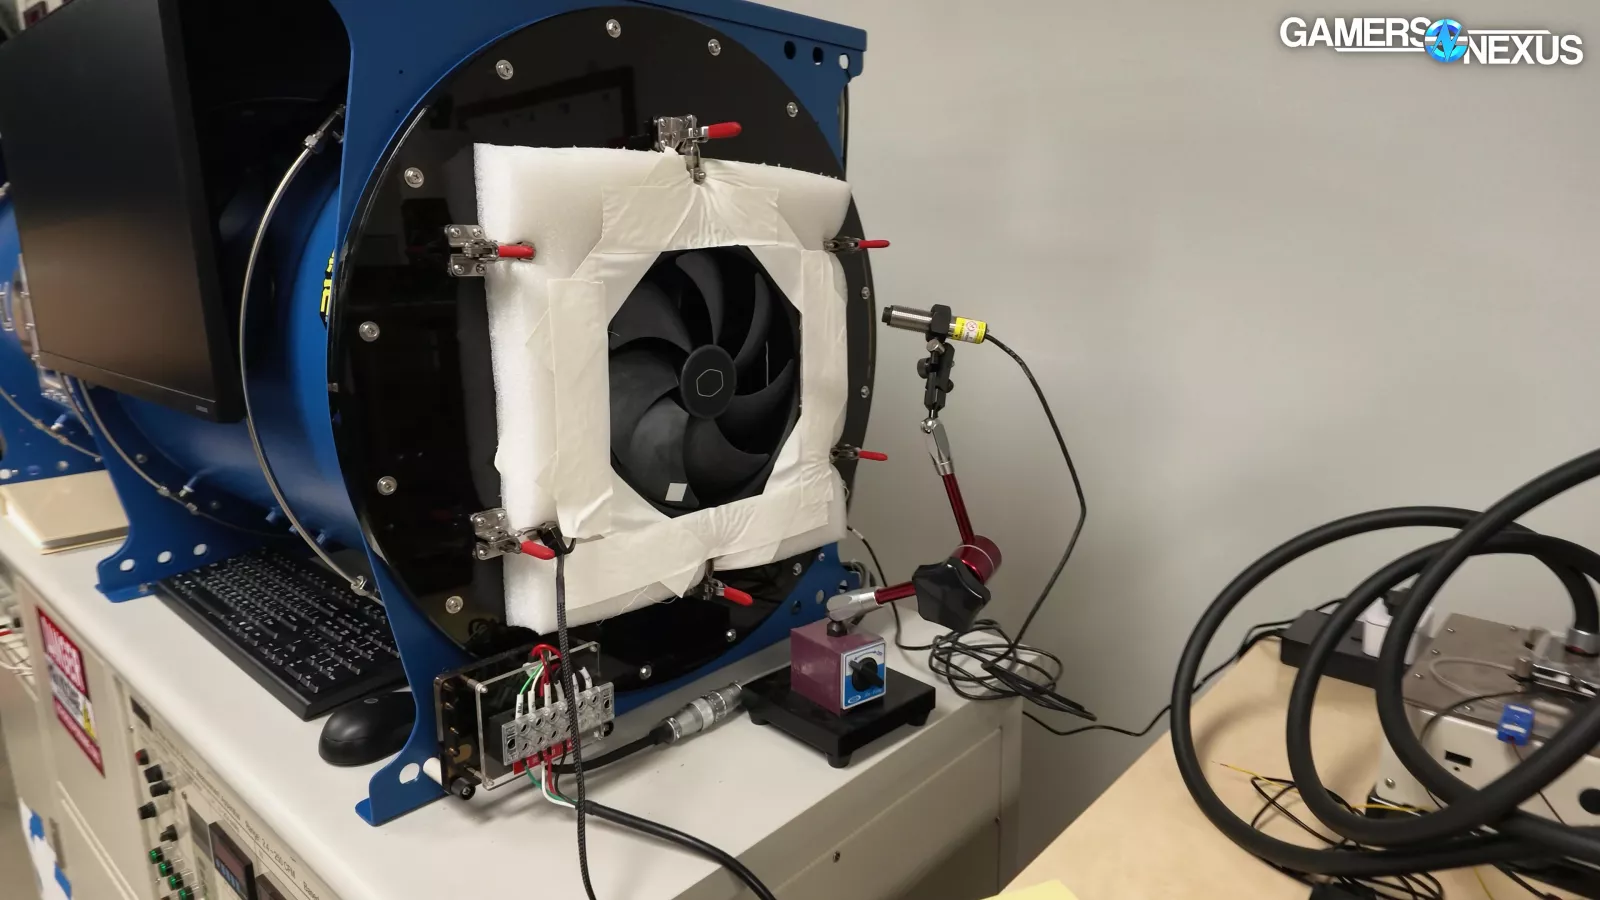
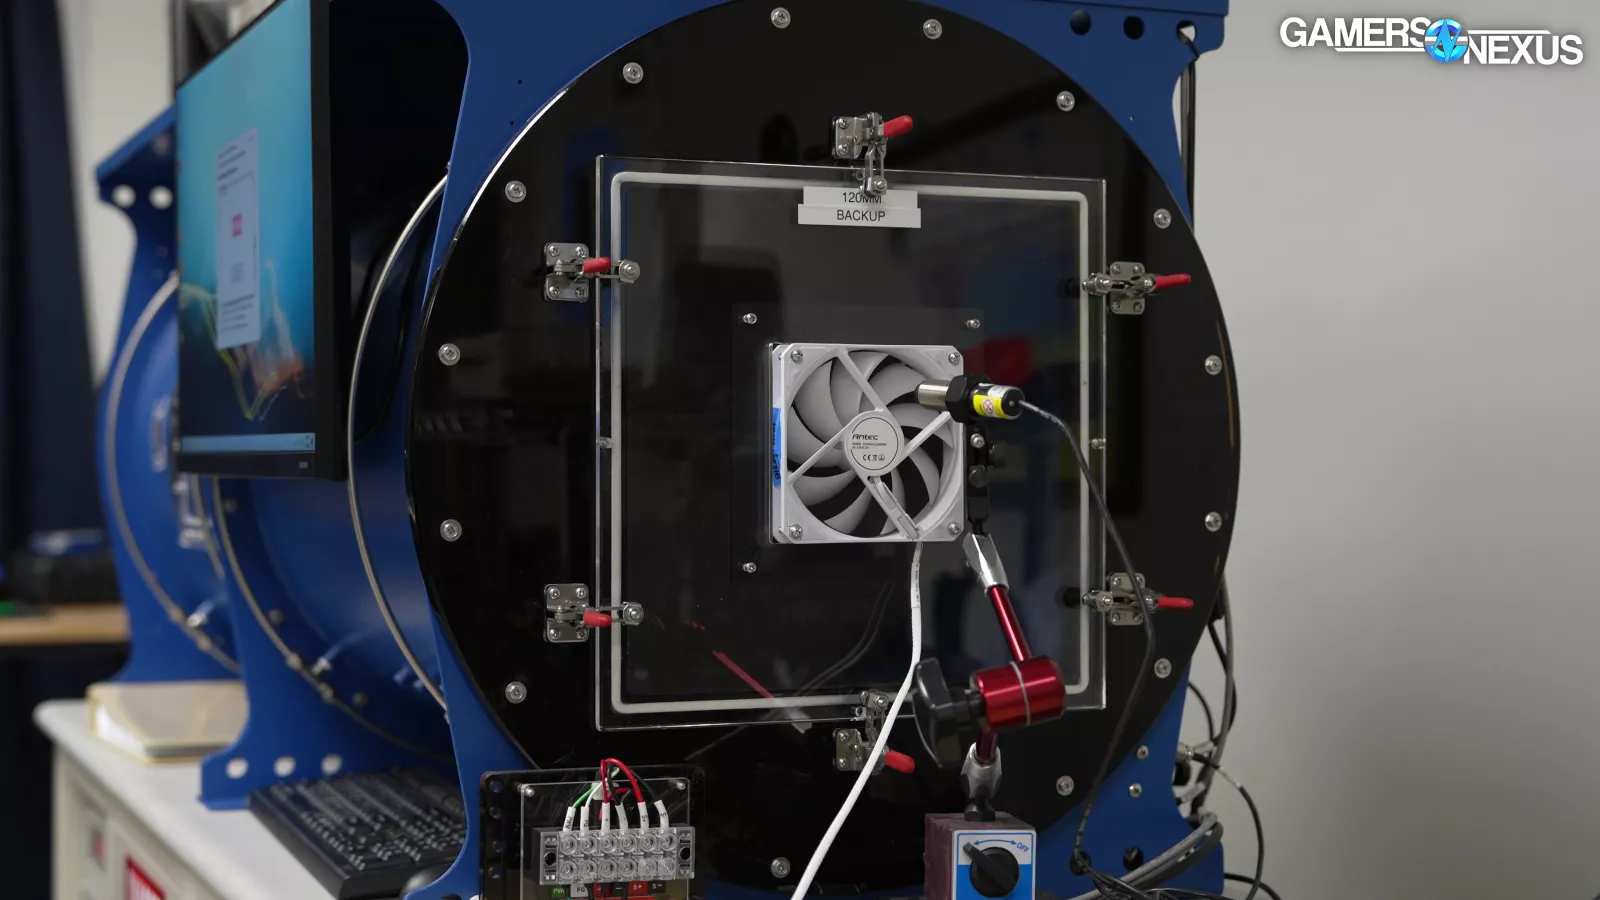
This data is provided for free, without any third-party ads on this page at all, and without paywalls or LLM slop: The way the Internet used to be. Our ability to do this survives because of your support on Patreon or on our store for things like our project & soldering mats, our Wireframe V2 Mouse Mats, and our 3D coaster packs, among other items. The testing process involves a $250,000 hemi-anechoic chamber, a $60,000 fan tester that we have finally put to use over the last year of case reviews (after years of stalled progress), and our testing lab with expert staff who've been with us long-term. All of this costs a lot to maintain and use, especially as we have consistently given raises 1-2 times per year for over 10 years now, and so we appreciate your continued support.
Not to sound like Wikipedia here, but as of 2026, we typically lose at least a few hundred dollars on each case review due to the anti-consumer climate for PC building. We will keep running them though, both because we find them fun (it's not all about profit for us) and because someone should provide that data, and GN is in an extremely fortunate position, thanks to you all, to be able to do that at an occasional loss. Fortunately, we do very well in our deep-dive investigations (like the GPU Black Market documentary and its fundraiser), which now subsidize our case reviews. Also, breaking form and speaking in first-person, I personally just love doing case reviews and so does Patrick.
This data includes our 2024-TBD test bench for computer case reviews, following our prior case test bench that had almost a decade of data on it.
Other Mega Charts pages include:
- Mega Charts: CPU Coolers
- Mega Charts: GPUs [link TBD]
- Mega Charts: CPUs
- Mega Charts: CPU Power Consumption
Mega Charts don't get updated constantly, but allow us to maintain a long-term support version of our data as quick-reference material on a permanent page. You can always visit this URL for the most up-to-date version of the Cases Mega Charts, but short-term updates for reviews will have the most recent (but a smaller set) of data.
Credits
Test Lead, Host, Writing
Steve Burke
Testing
Patrick Lathan
Mike Gaglione
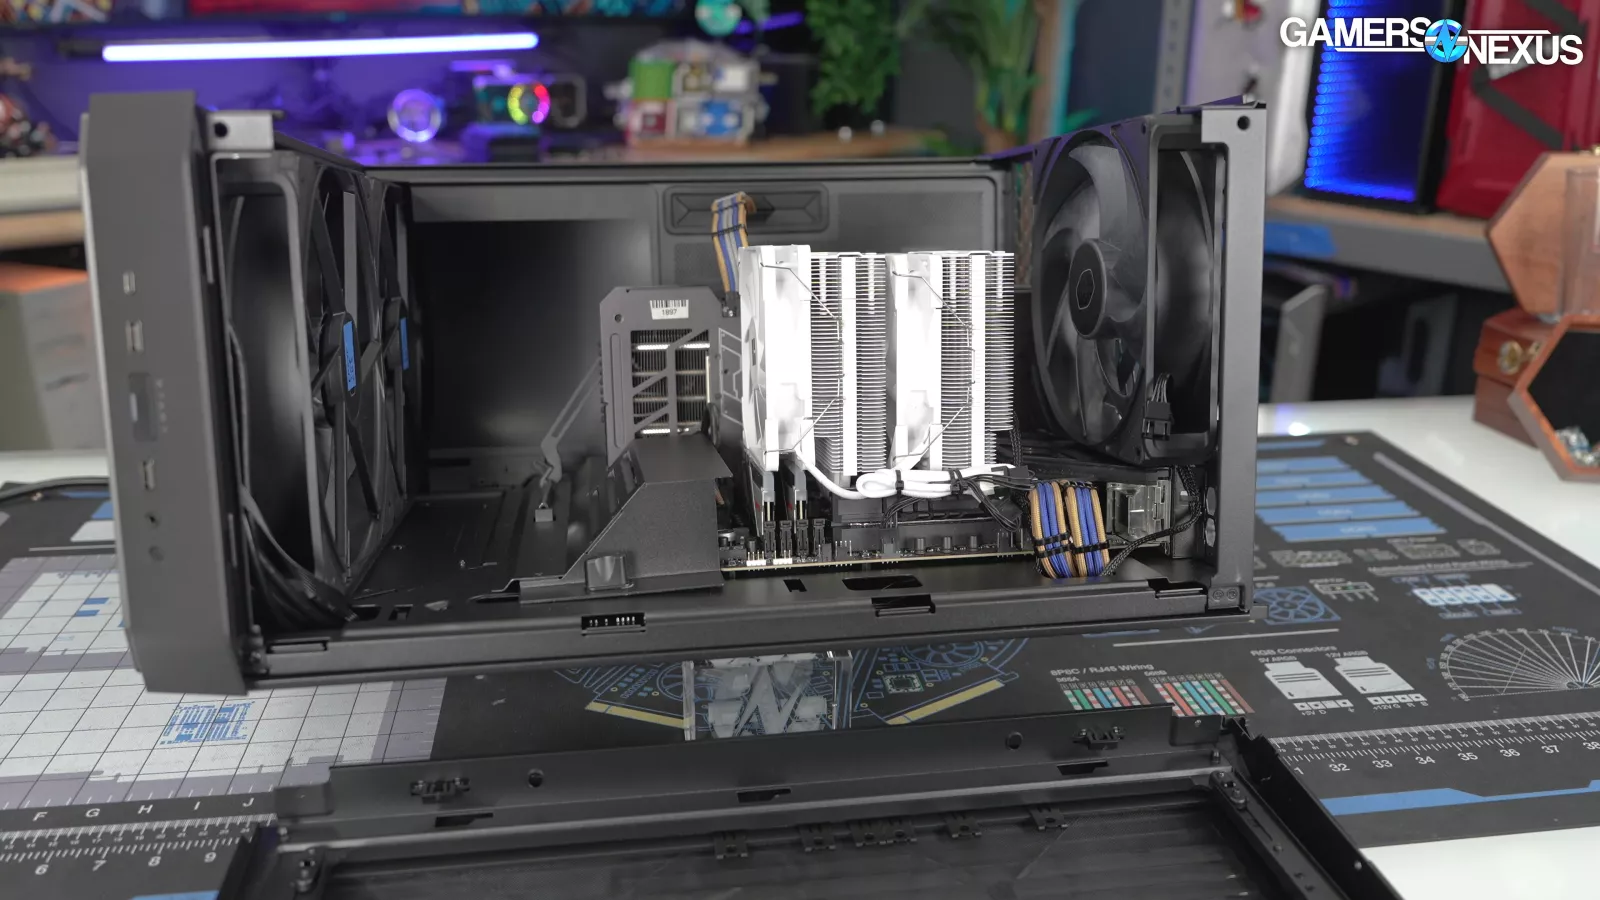
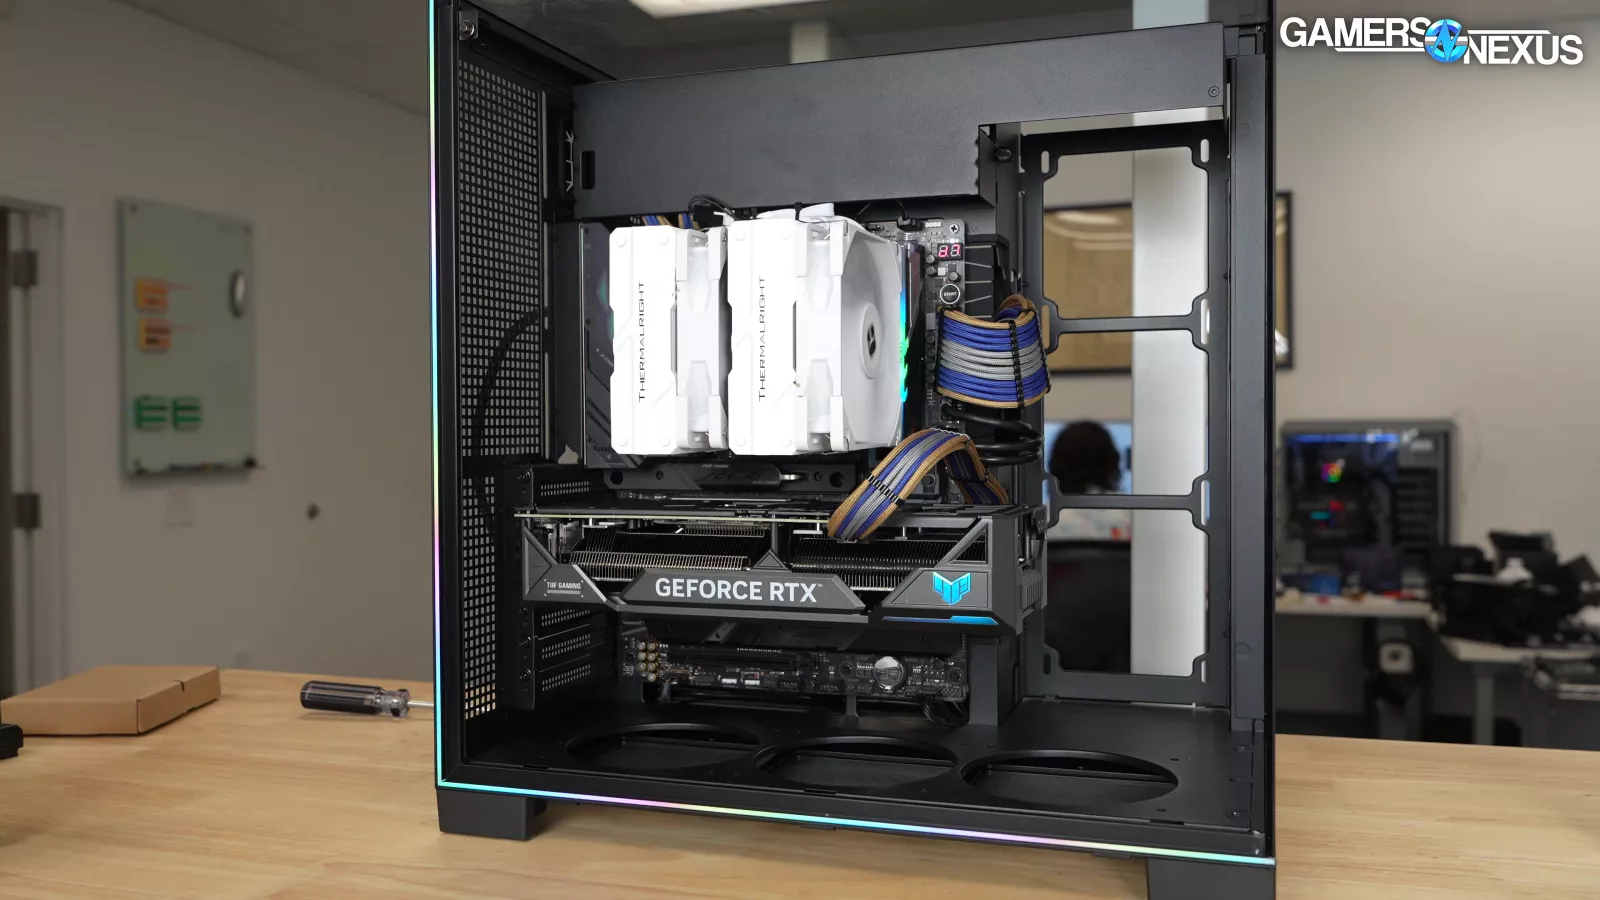
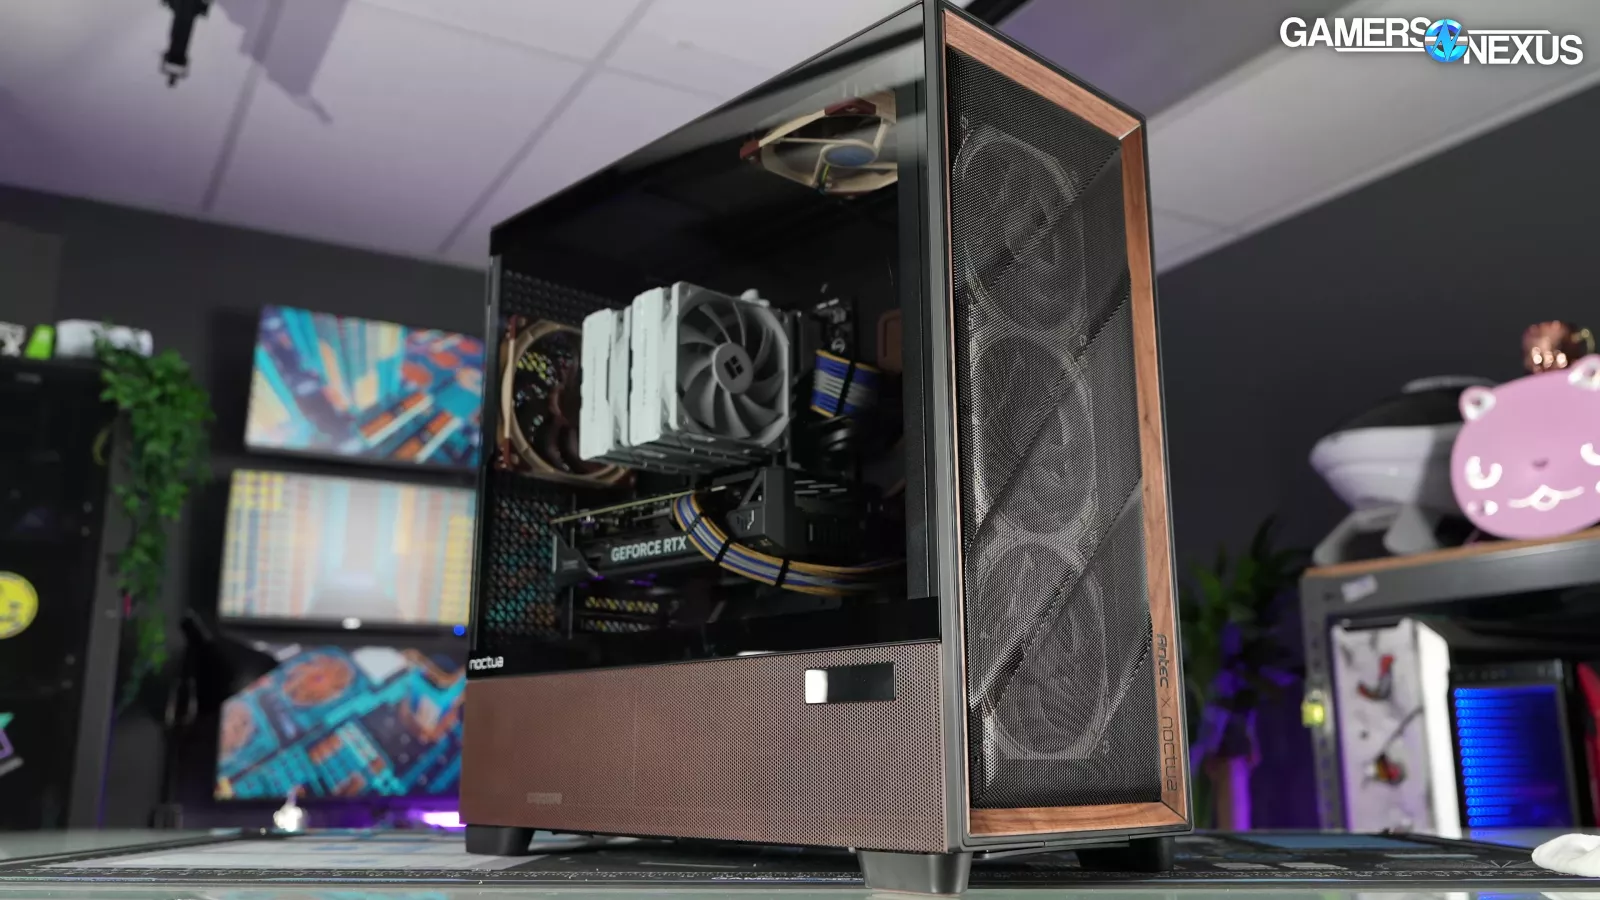
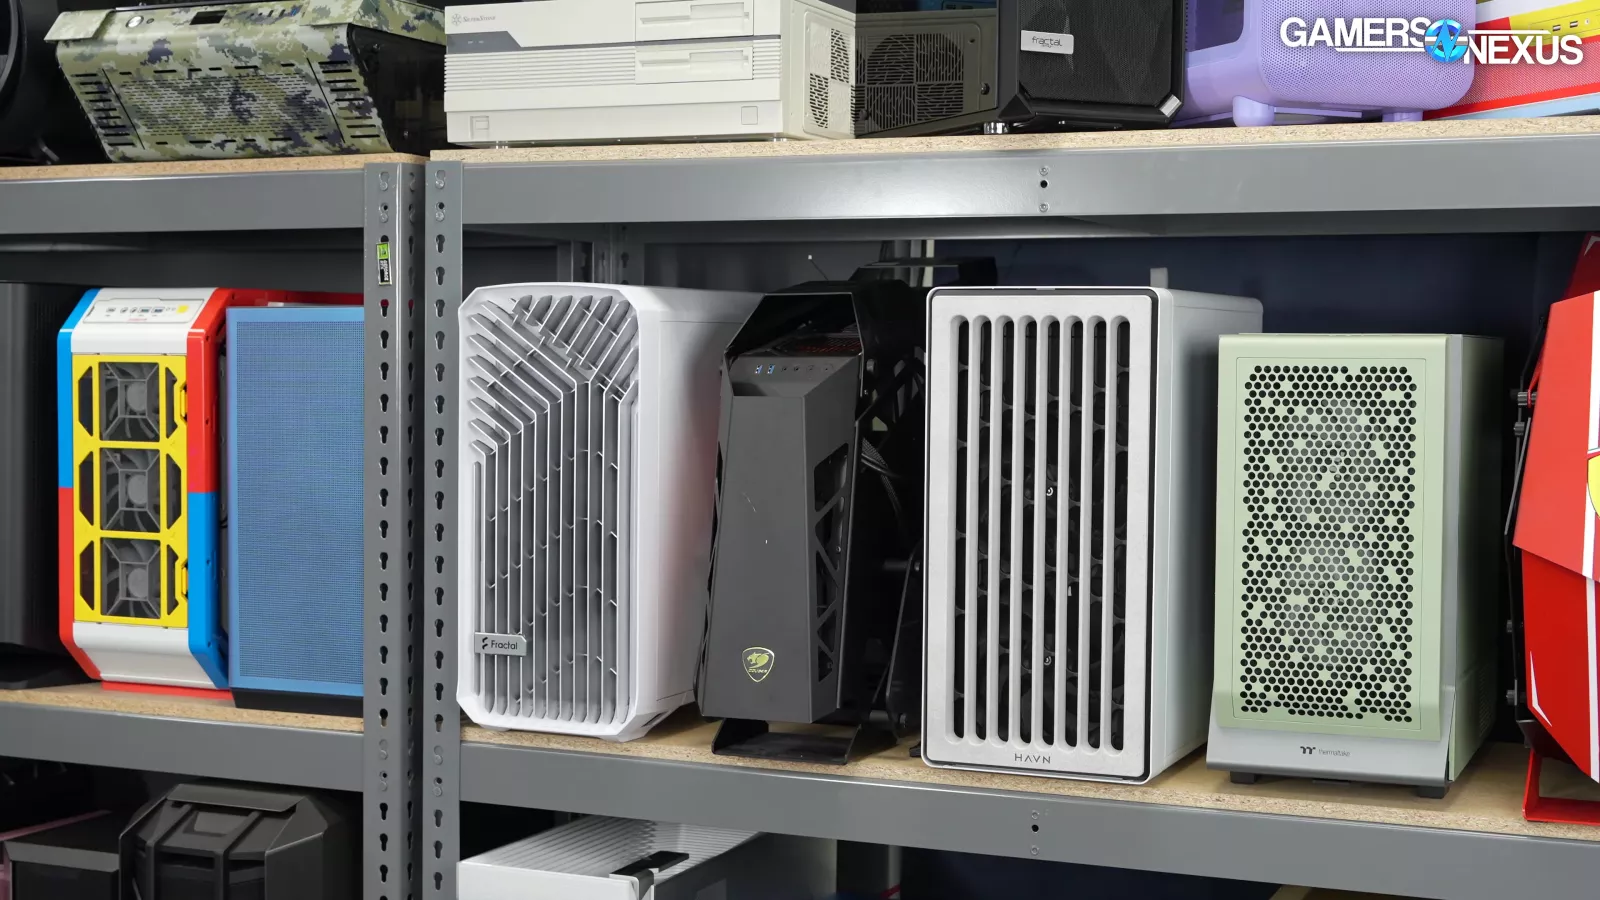
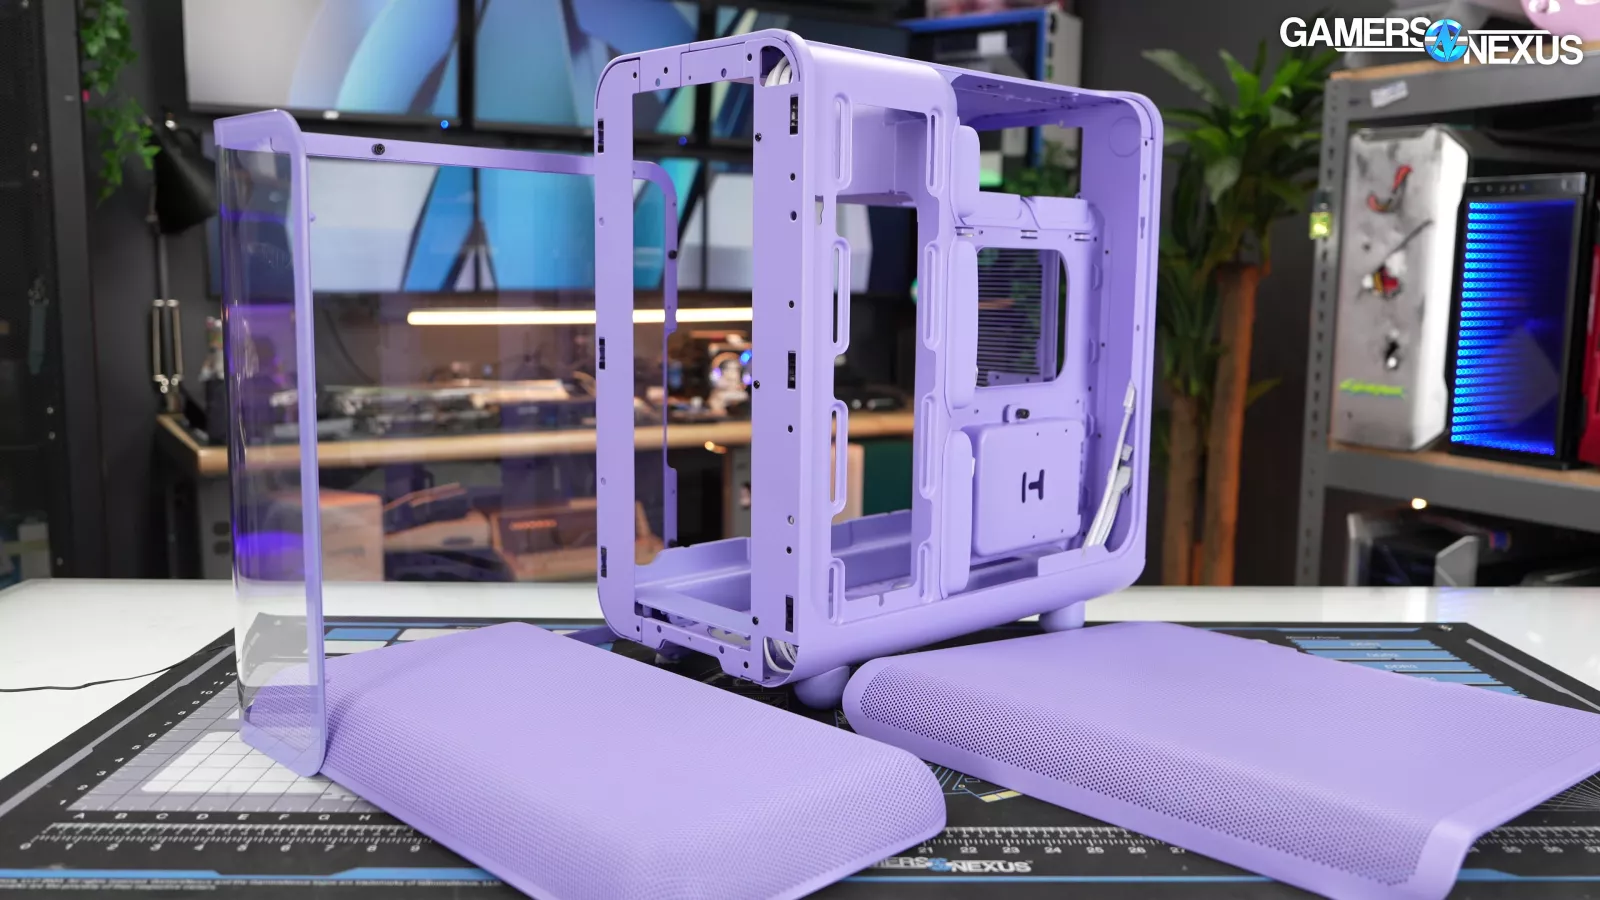
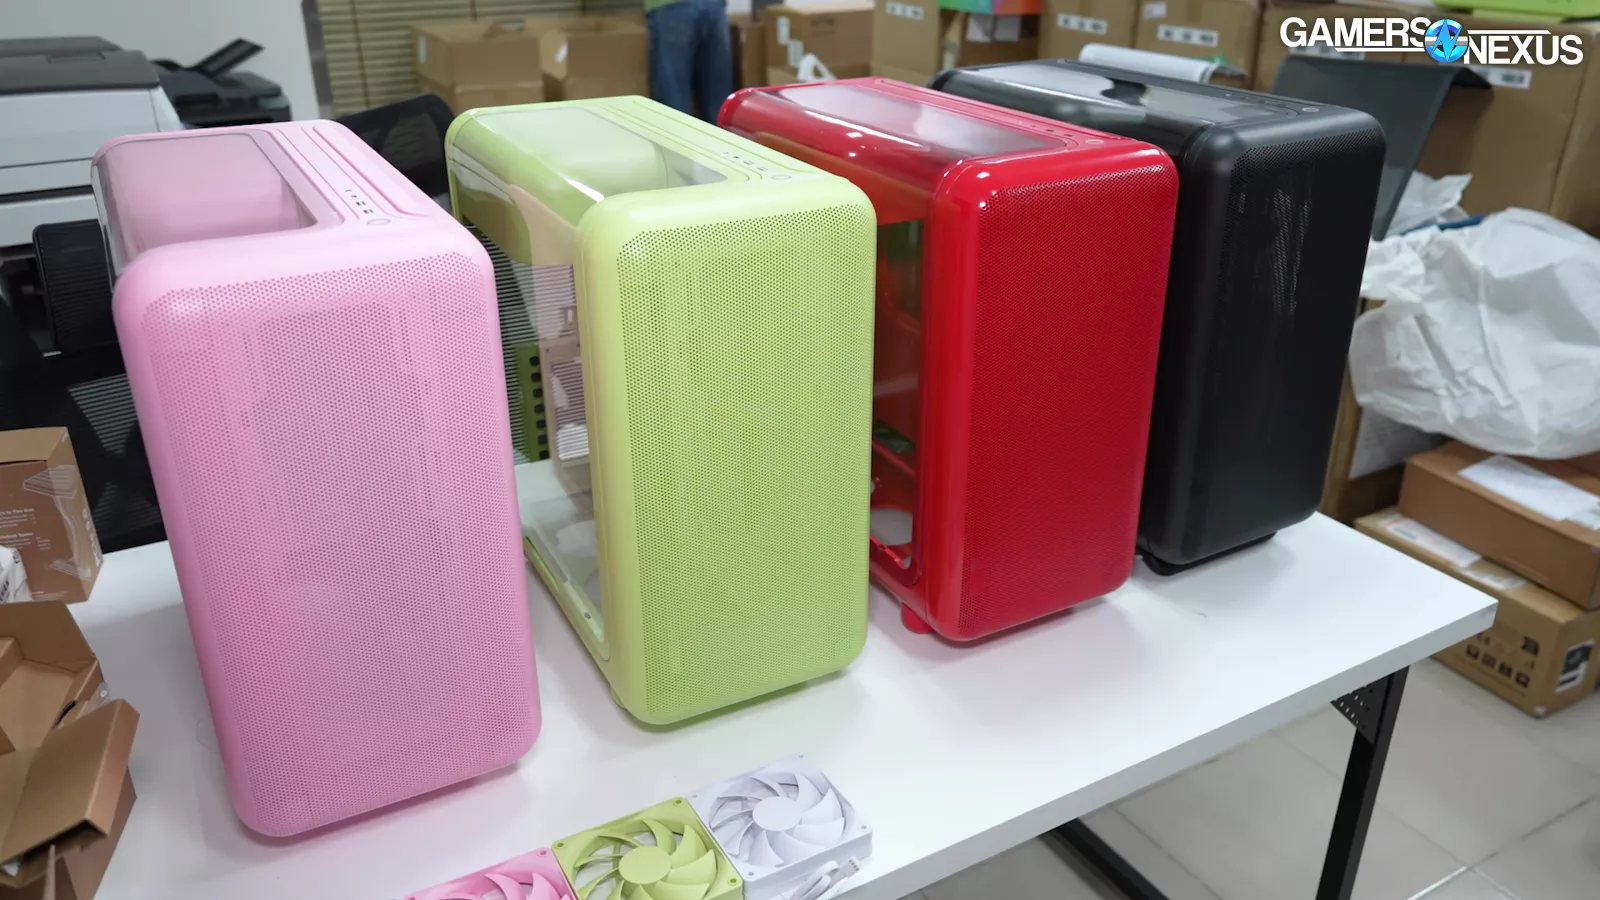
Best Computer Cases | Benchmarks Chart Gallery
We have important notes on all of our findings, all of which have been discussed in the individual reviews that we've published. For this page, we're just going to provide all of the charts right up front so that the page is convenient for everyone. Specific observations with thermal, acoustic, flow, or pressure performance will be left in the respective reviews. If you see a case that interests you on the chart and you'd like to learn more about the specifics and value, please search our YouTube channel for that case name to find its corresponding review.
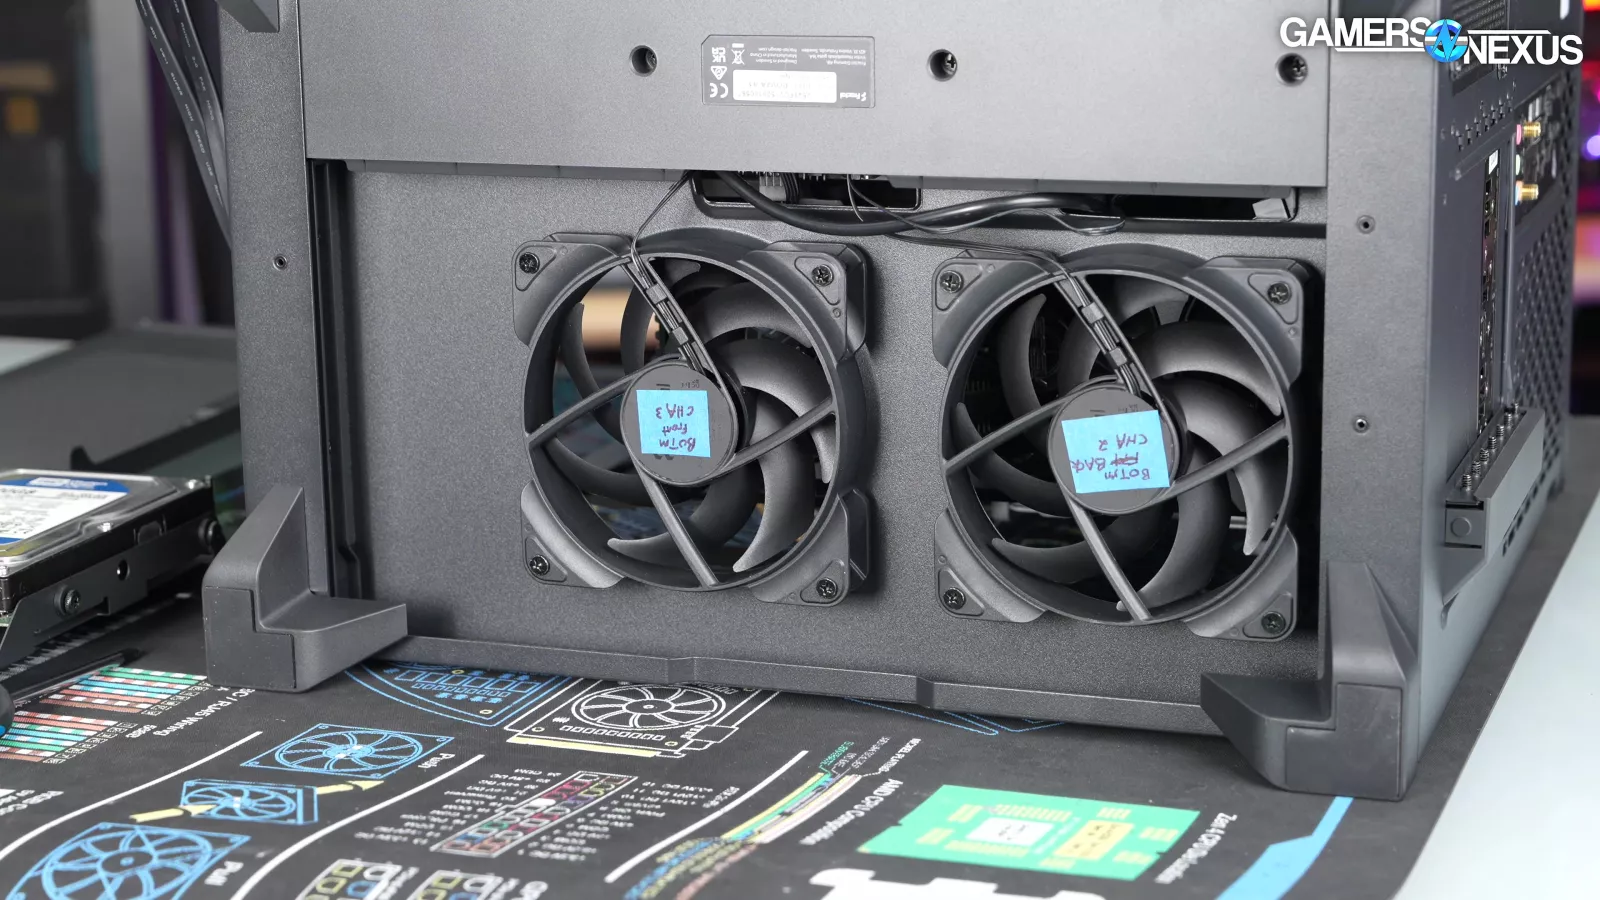
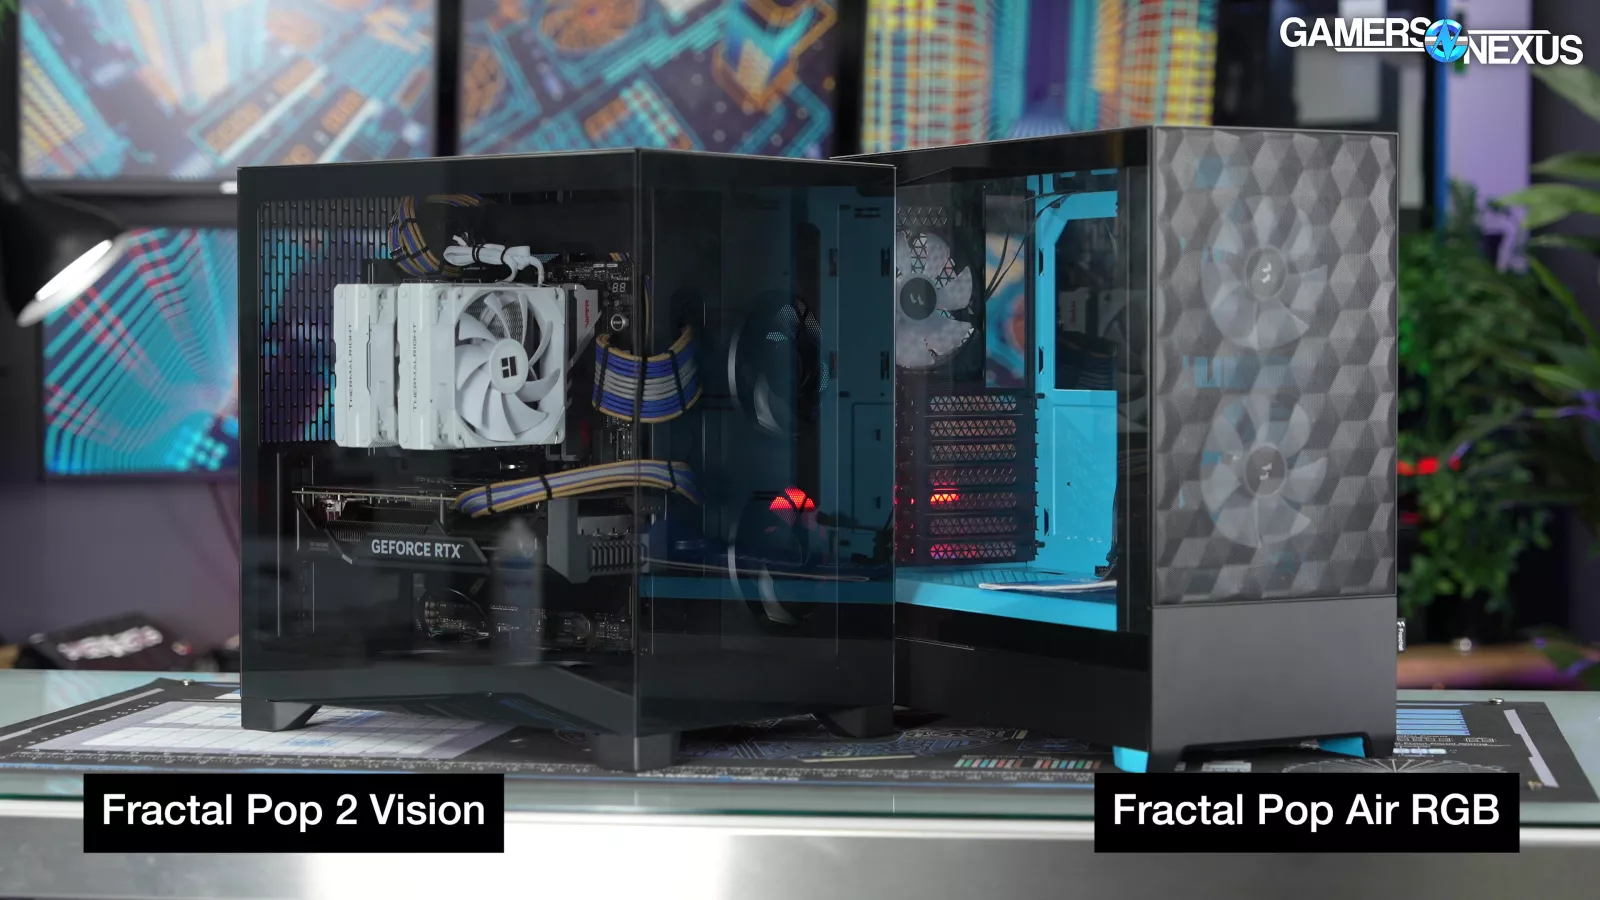
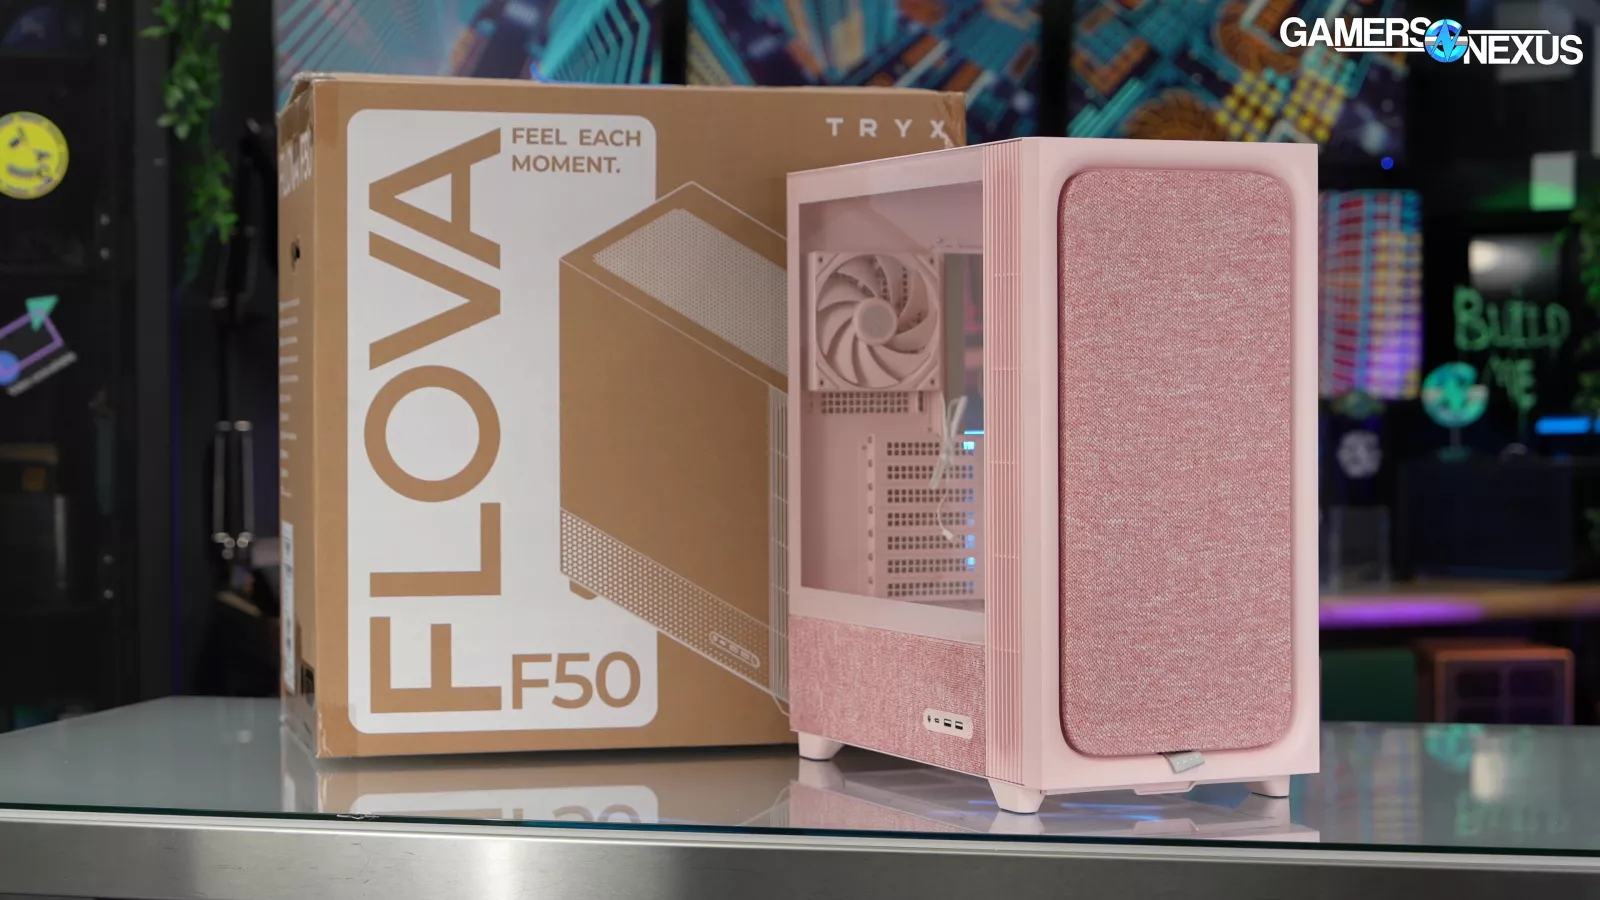
For testing, we often test various configurations during the course of a review to better understand a case's performance. In the "Mega Charts" below, you'll find several alternative configurations per case. These sometimes include non-stock test configurations, which are noted by a suffix to the case name that describes the specific test setup for that modification.

Noise Normalized: Computer Case Thermal Benchmarks
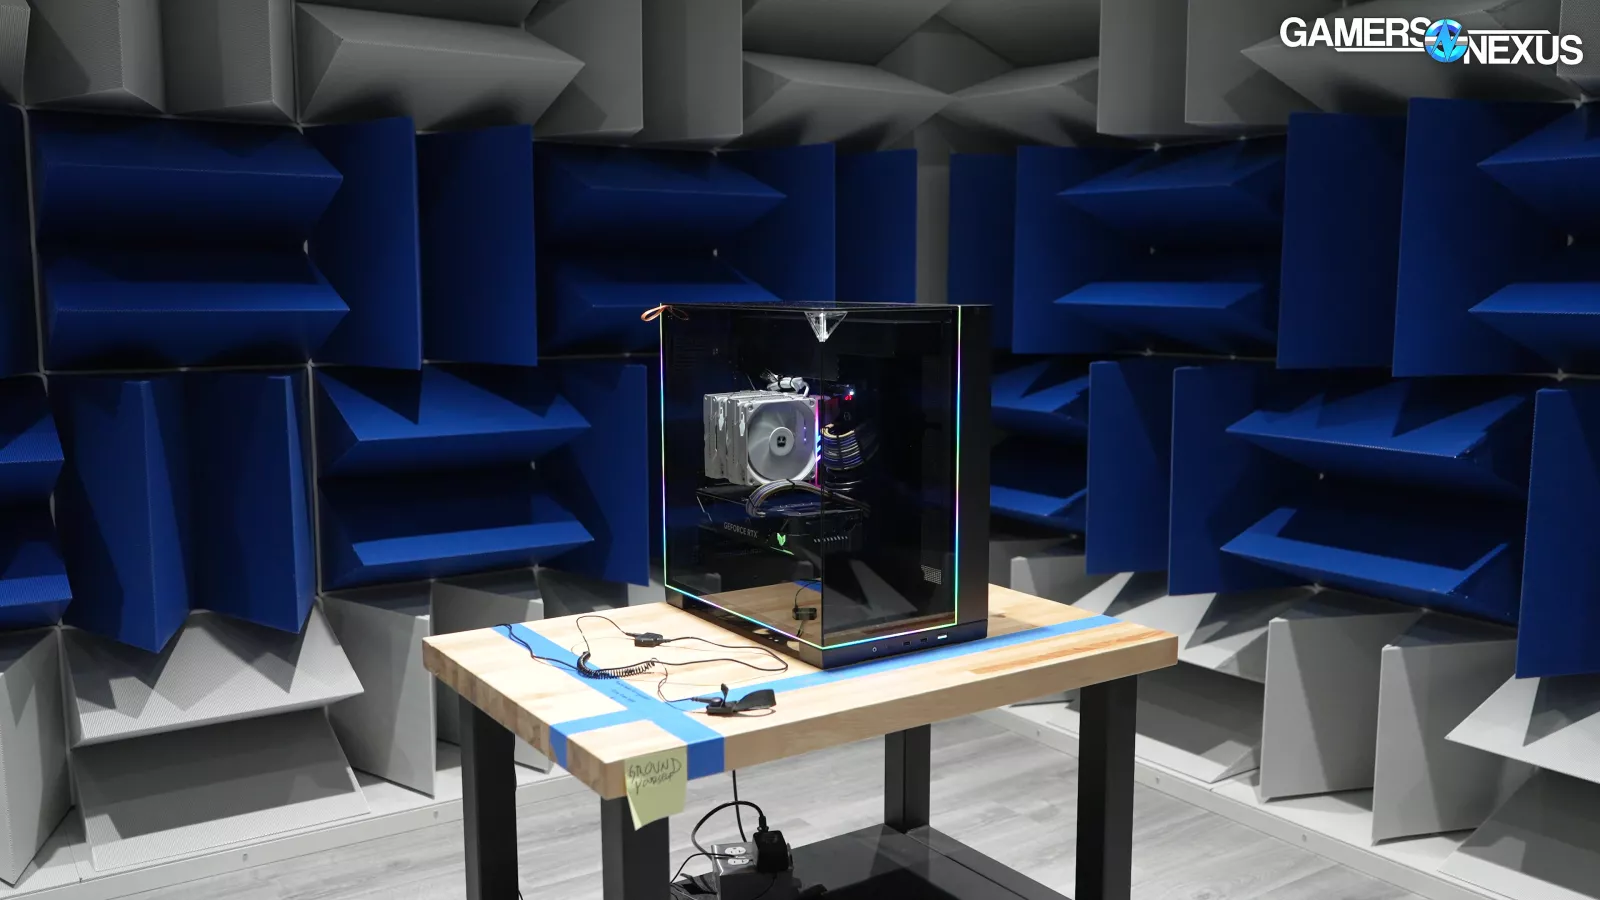
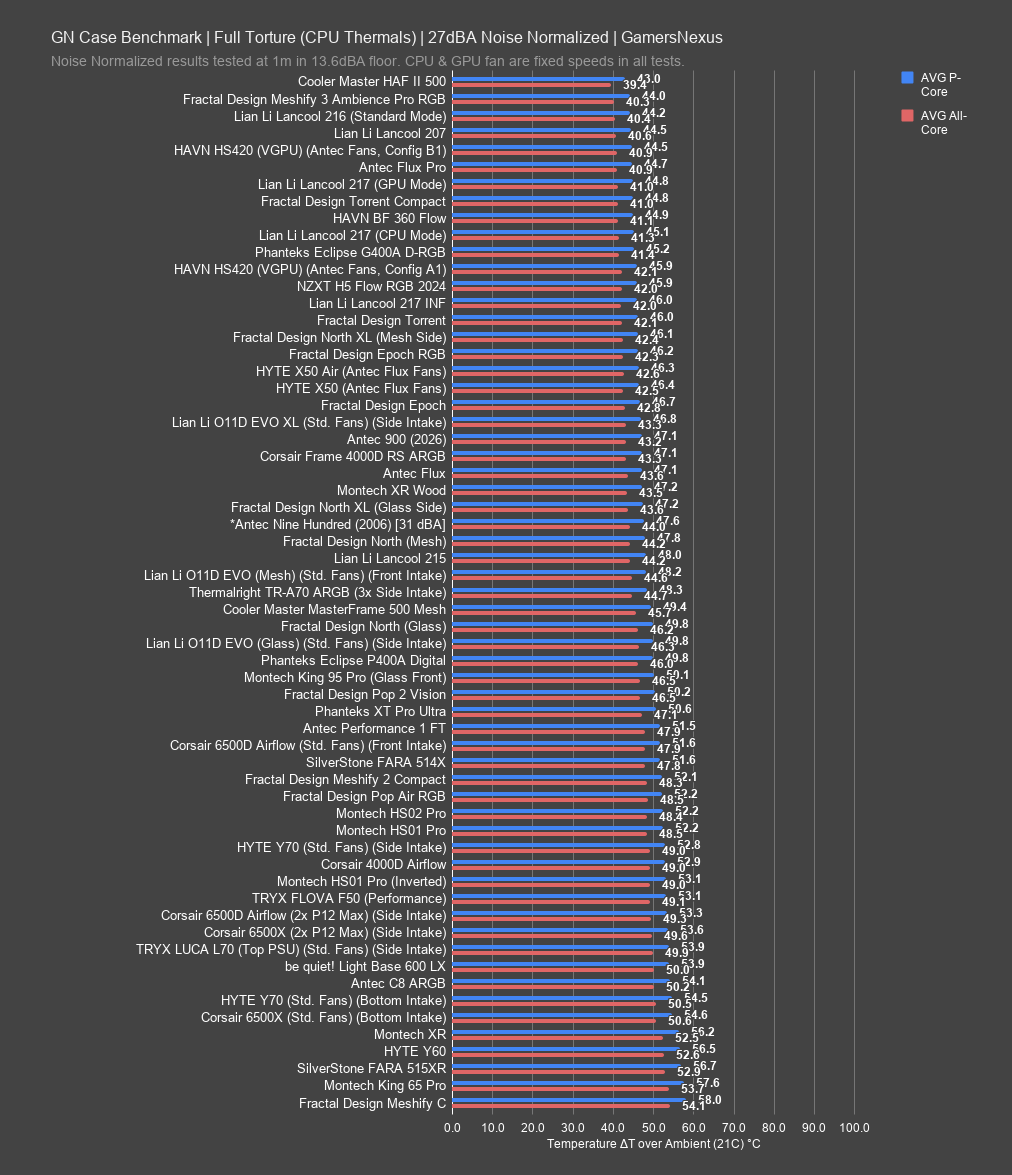
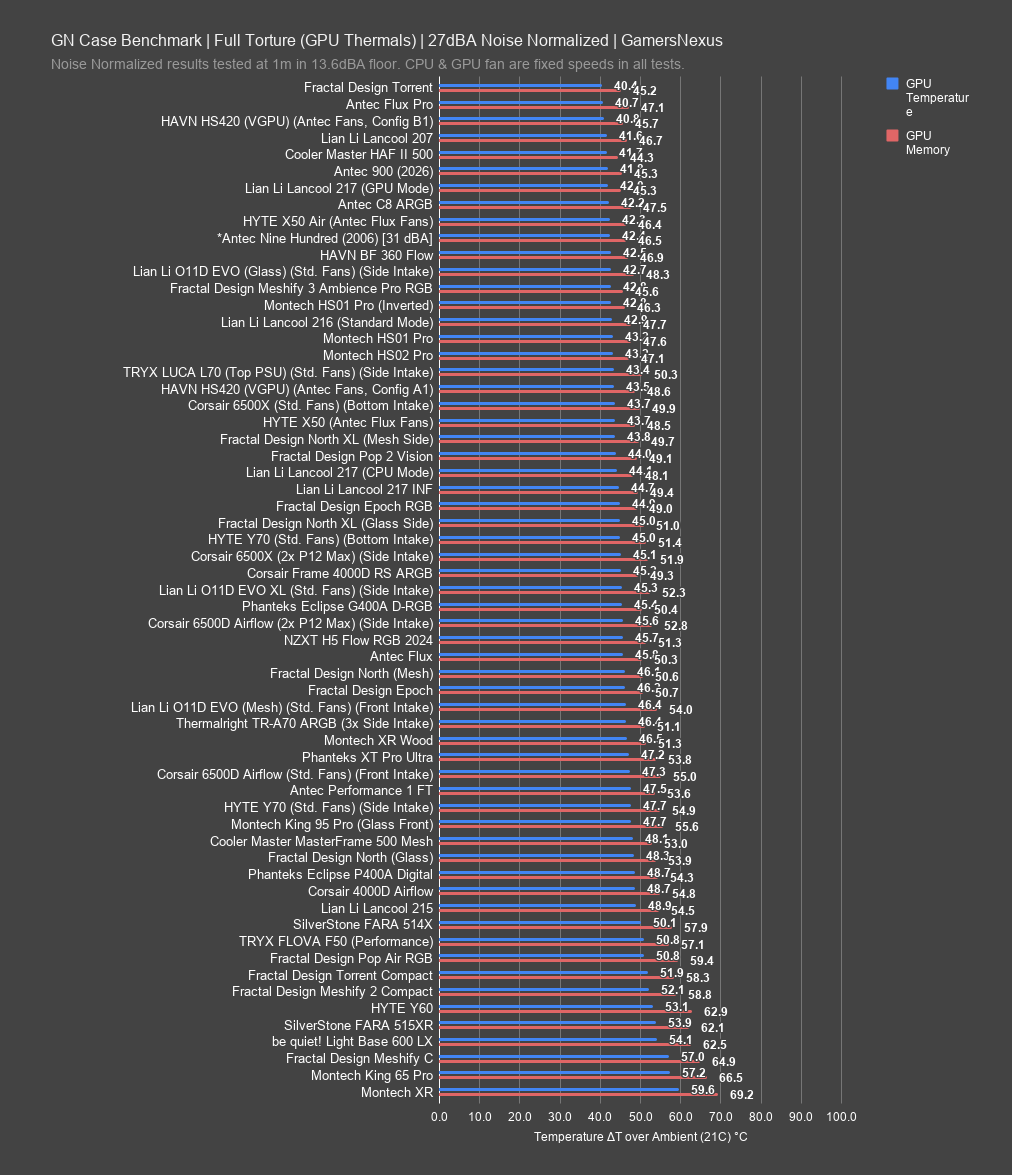
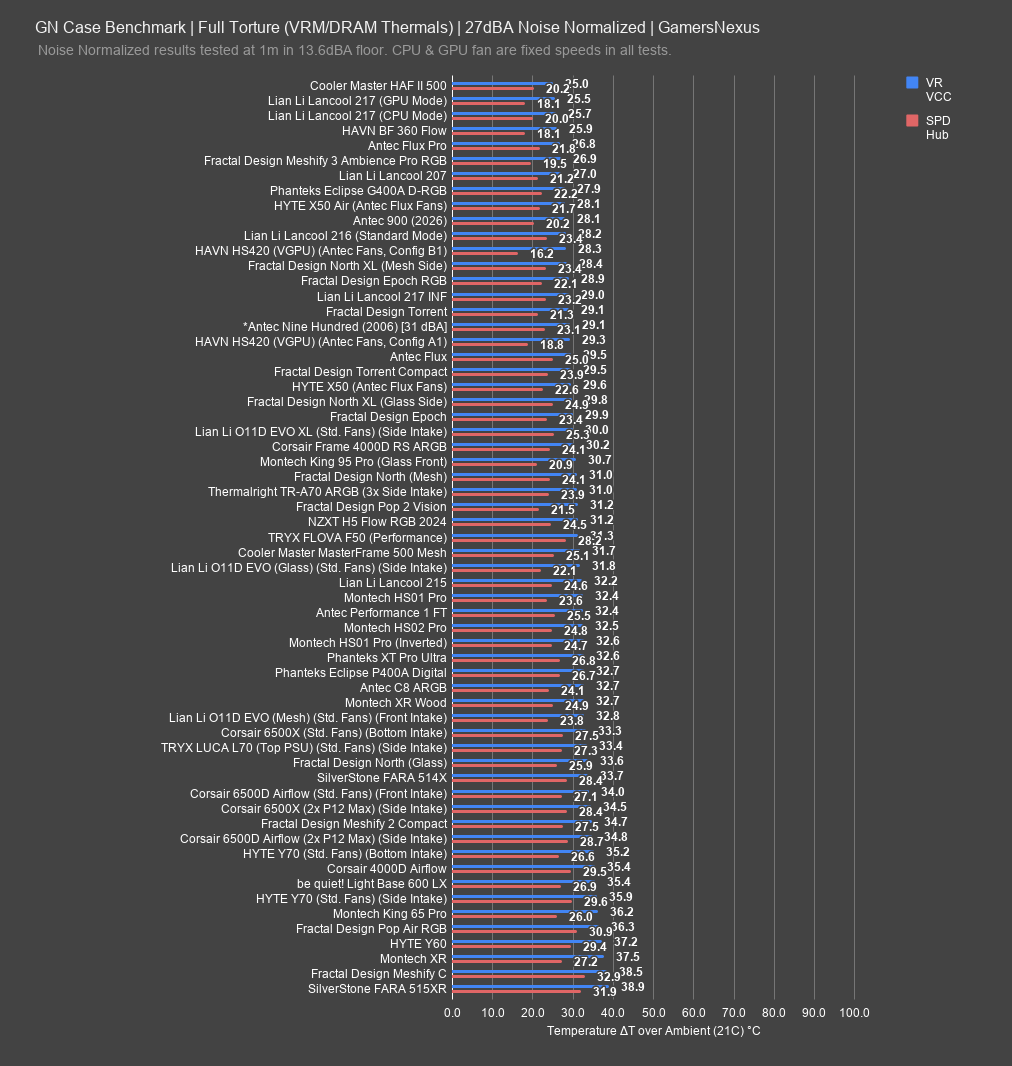
We'll start with the noise-normalized results. We view these as the most important test data, as it controls for noise levels by adjusting all case fans until the total system noise level is 27 dBA. This is done by leaving the CPU and GPU fan controlled (they never change in any test configuration), then adjusting the case fan speeds until we hit 27 dBA as measured at a 1-meter distance in our hemi-anechoic chamber, which is used for every case review. The noise floor in the chamber is 14 dBA, +/- 1.0 dBA. While we do take frequency spectrum readings and sometime present them, noise normalization is done at the dBA SPL level to keep things simple and minimize subjective inputs. We then engage a thermal torture workload that loads both the CPU and the GPU to about 100% each. The test is cycled several times, then averaged, with deviations outside of our margin for error investigated and either re-run and discarded or explored and explained.
CPU Thermals
GPU Thermals
VRM Thermals

Full Speed: PC Case Thermal Benchmarks
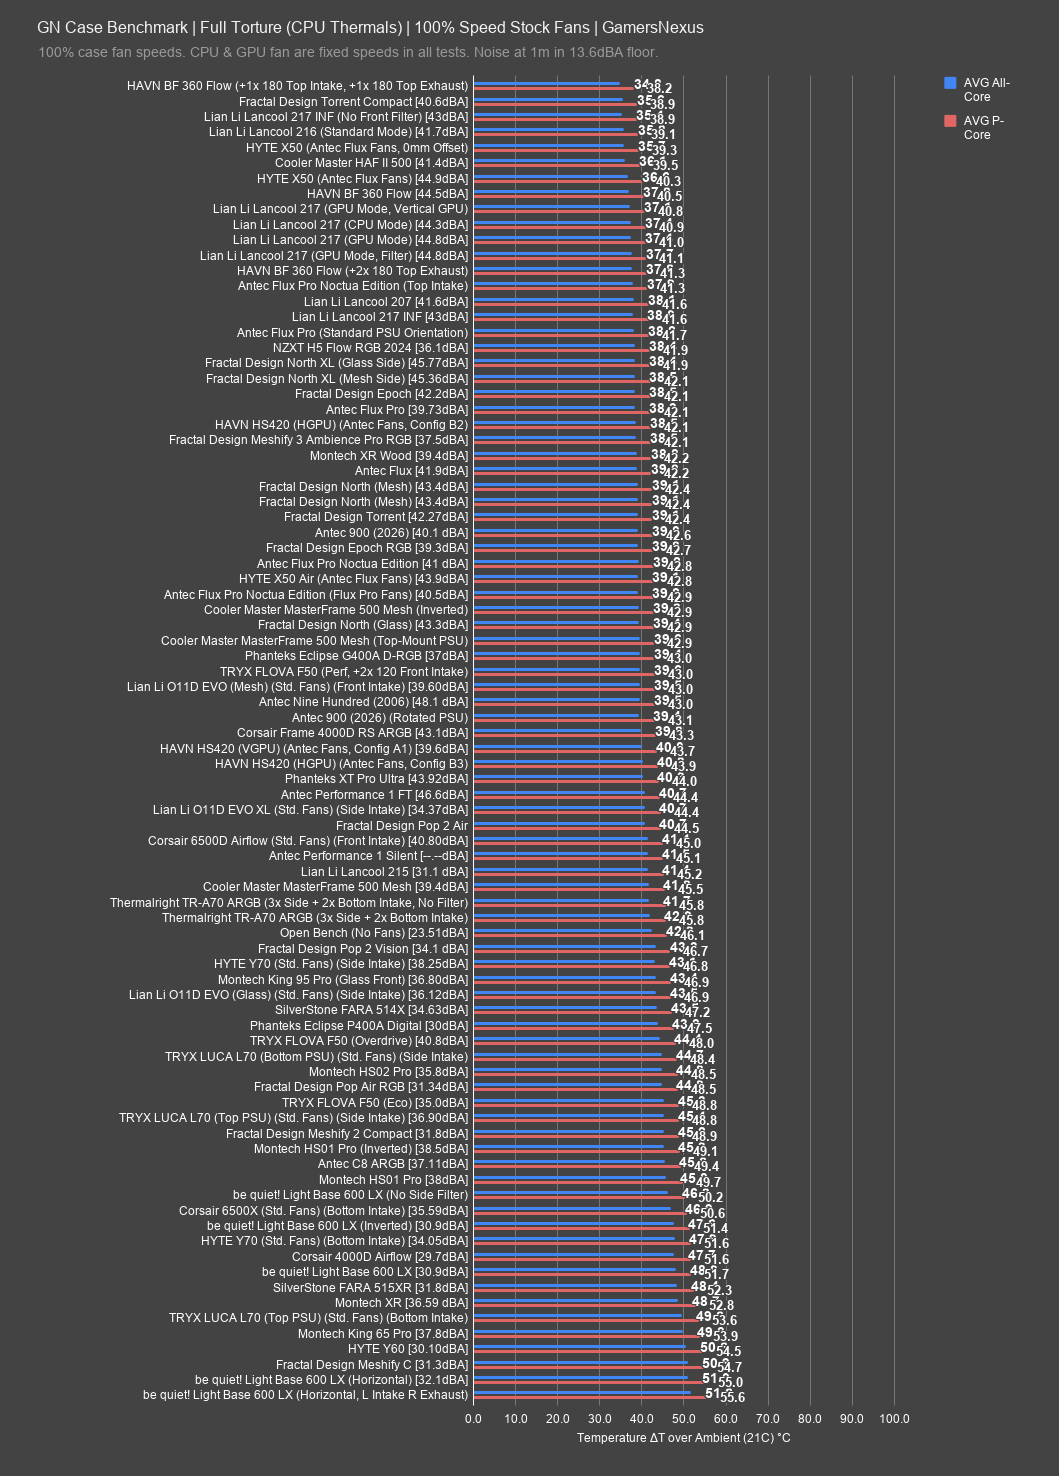
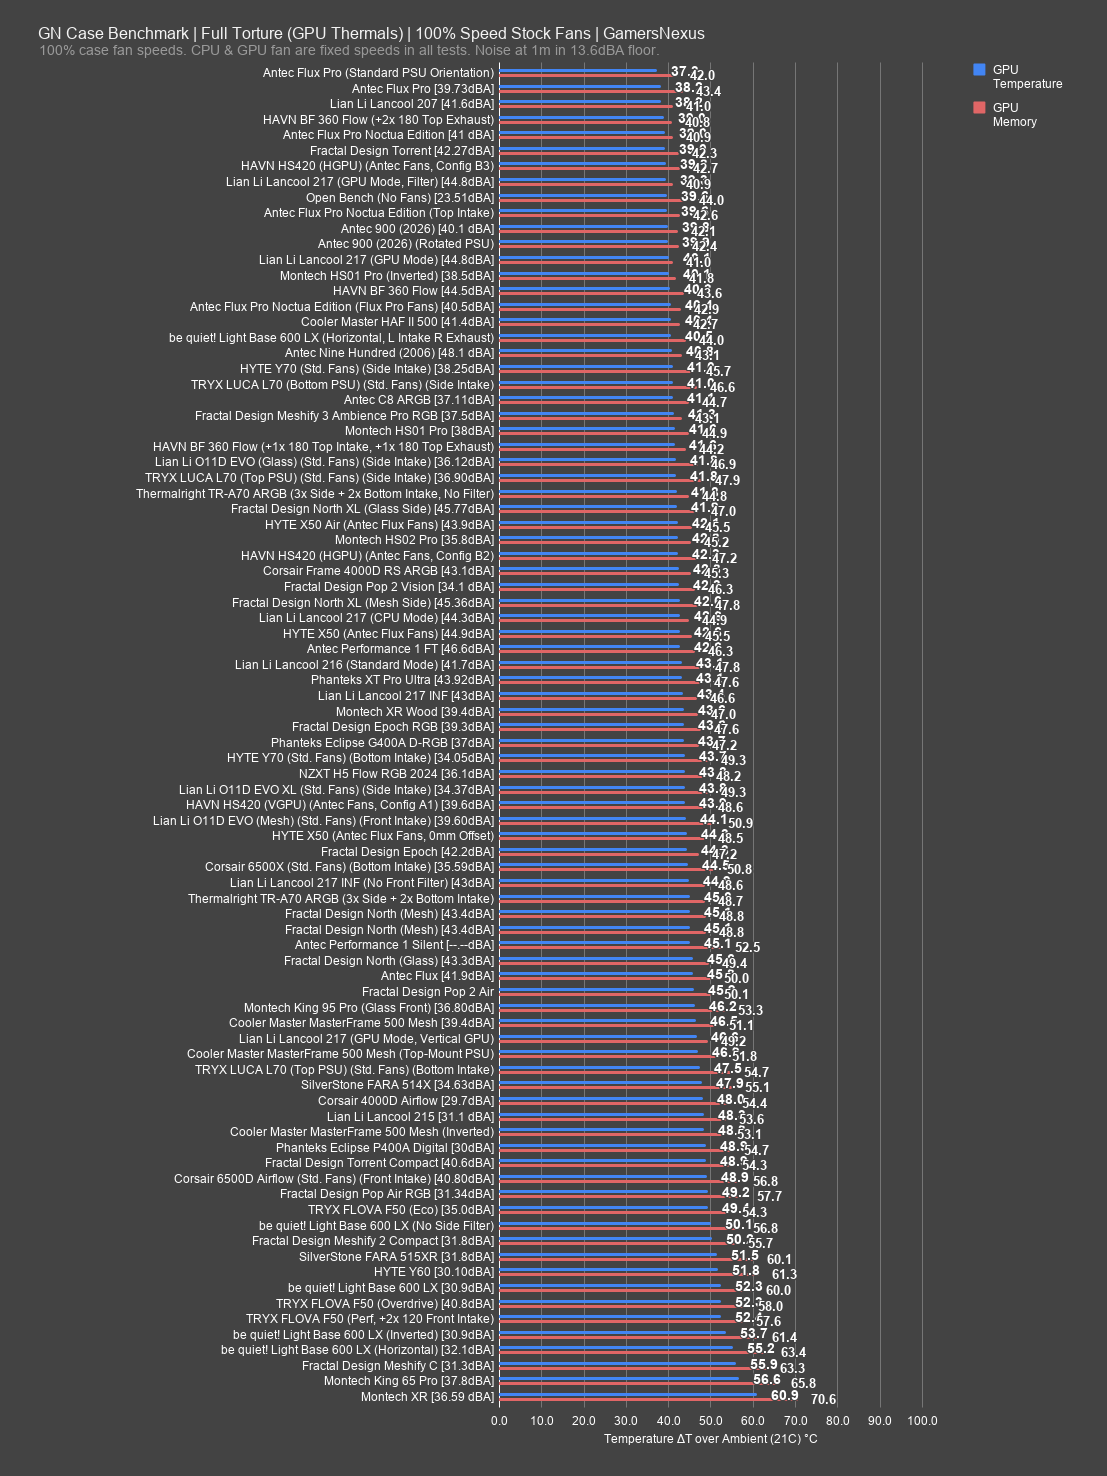
The next charts are with the computer case fans at full speed (rather than noise-normalized), but with the CPU and GPU fans remaining at their fixed, constant speeds we use for all tests. That means these charts have two variables, reducing the controls but looking at a common user scenario. Those variables are the noise level (shown on the charts as a [dBA] suffix) and the temperature (shown as the bar). The noise level is shown next to all cases where we collected it. Some alternative configurations that deviated from 'default' (out-of-the-box) setup do not have noise data. The noise is collected at the same 1-meter distance in the same hemi-anechoic chamber and test conditions as the noise normalized figure. Broadly speaking, blasting noise gets a case to the top of the chart, and so cases which perform high-up in the charts while running lower noise than their neighbors are more impressive for their "noise efficiency," so to speak. That's not a real scientific metric, but it helps get the point across. Here's the data:
CPU Thermals
GPU Thermals
Fan Benchmarks: Computer Case Flow & Pressure
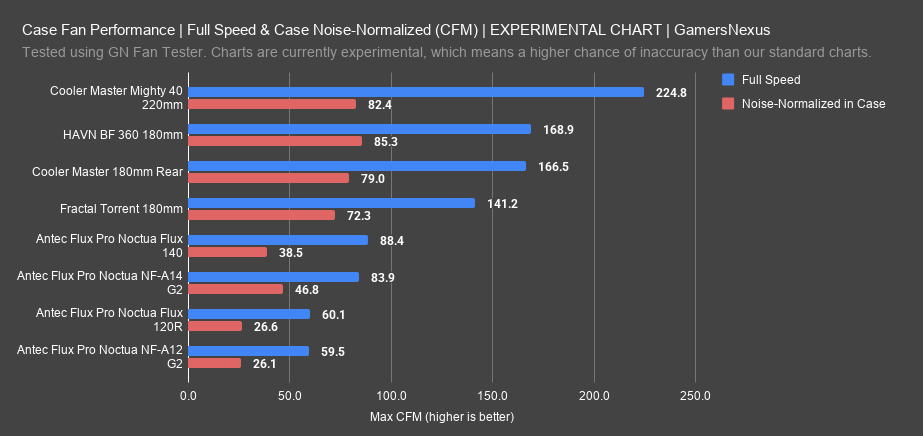
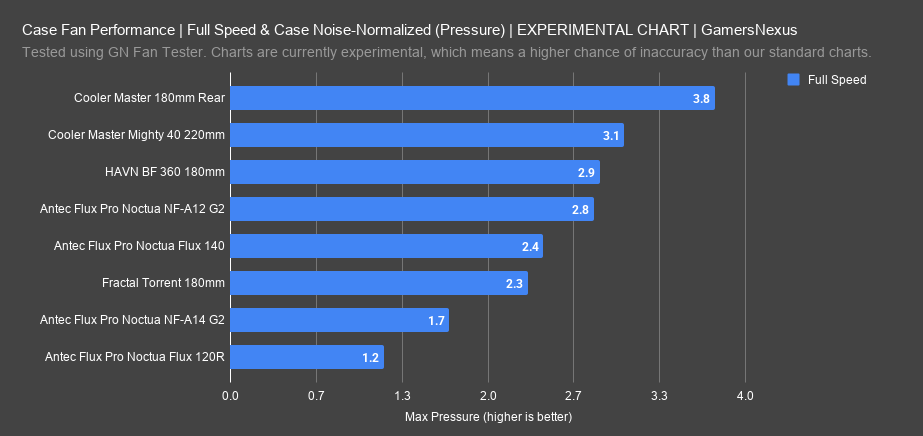
The below benchmarks use our fan testing machine, which we got years ago, but had stalled-out on for several years due to both a lack of knowledge and the time to acquire it. Fortunately, over the past year, we've gotten it into gear and running for each new case review that has interesting fans. We'd say these are "Mega-Mini Charts," because there's not a ton of data yet - but we have our starter data on here, and we feel overall good about its accuracy. We've slowly been adding to this, as we don't want to overdo it when we have limited knowledge in a field. The "EXPERIMENTAL CHART" label indicates that the data has higher risk of error or methodological oversights than our usual charts, as a fully transparent disclosure, while still allowing us to learn and publish what we think is accurate.
So far, we've focused on specific fans for specific cases. We'll keep adding with each review and build a database.
Flow
Pressure
Update Log
The below is an update log of changes to this page. The format is MM/DD/YYYY:
- 08/03/2026: Created page with initial dataset, following Cooler Master HAF II 500 review