CPU benchmarks & comparisons across multiple generations for gaming and productivity tasks
The Highlights
- This data has been collected from our CPU reviews and benchmarks
- The data includes important caveats and disclosures relating to vetting processes for long-term support charts
- You can more easily determine if your CPU is in the list with Ctrl+F. The table at the bottom lists all CPUs detailed in at least one chart.
- This is a large, ongoing effort and will get updates at this URL permanently
- Please consider supporting this effort on our store
Table of Contents
- AutoTOC

Intro
This article is an entry in our GN Mega Charts series. All Mega Charts are listed on the Features page, including these:
This section contains disclaimers, limitations of the process, and disclosures relating to data quality control. We think that this is all important for your understanding of how this page works and so that you can adjust your own expectations and potential reliance on the data to calibrate with the two groups (“Active” and “LTS”); however, if you’d like to just jump straight to the charts and ignore all of that, you may bypass the wall of text and auto-scroll down with this link.
This article contains our ‘Mega Charts’ for CPU performance benchmarks, including our production tests (commonly referred to as “creation” benchmarks) and gaming tests. Our power testing can be found on the above-linked page and is isolated, as it tends to be more static.
This page will be regularly updated with the latest of our CPU benchmark performance numbers. It will consist of two types of charts: Long-Term Support (“LTS”) and Active. The long-term support charts have several special caveats, but are intended to be available to help people better determine upgrade paths. The LTS charts are more likely to contain older CPU results.
The page also includes links to CPU reviews and comparisons, such as historical AMD vs. Intel benchmarks. It will be updated on a slower cadence from our latest reviews (so you should always defer to those for the most recent numbers), but will be updated a few times a year with larger charts than are found in our reviews. This is for a few reasons, but one is that we shorten review charts due to video height limitations (16:9 aspect ratio). The other is that it’s just too crowded for the regular updates.
This page is intended to be used long-term for our Mega Charts. You can bookmark this page, as our future updates for CPU Mega Charts will land at this same URL. The update log will be posted at the bottom of the page so that you always know the latest data set. It will be updated a couple times a year, with more frequency updates in the CPU reviews themselves.
Credits
Test Lead, Host, Writing
Steve Burke
Testing
Patrick Lathan
Mike Gaglione
How to Use This
Even as data ages, it is often still relevant for comparison -- particularly for older CPUs which mostly stop receiving performance-affecting changes, such as microcode updates or Windows patches. We are constantly re-running our CPU tests to keep data fresh, but unfortunately, this refresh cycle means that it is difficult to stack more CPUs on the charts before some sort of major change comes in. For example, major Windows updates necessitate full re-tests for reviews, but may not be as important for someone who just wants to see their older CPU represented for a “good enough” gauge of where things fall.
That’s why we split these into the LTS (Long-Term Support) and Active charts. It allows us to maintain one older dataset that has more CPUs represented, at the cost of reduced insights gained from our most modern test methods. Active gives you that for more of a modern head-to-head. It’s the difference between precision (Active) and quantity of CPUs (LTS). This is the best balance that a small team can produce, especially since we provide this website completely ad-free (you can support us on Patreon or by buying something useful for your PC builds on our store).
Current Best CPUs (Generalized Recommendations)
The below is a simple list of CPUs that, at the time of writing (dated in the columns below), we think make sense or would make sense with caveats noted.
Pay careful attention to the second column. We may only recommend some parts under certain pricing conditions. Generally speaking, we do not recommend buying CPUs above MSRP. They come down pretty regularly, especially with launch cycles. For instance, when we first posted this, the 7800X3D was about $250 overpriced. It's still on the list so that people are aware of it, but we advise waiting for it to approach that MSRP marker or to be replaced with the pending 9000X3D parts.
For a better and more thorough list of Best CPUs, please check our Best CPUs of 2023 article. We will update for 2024 also.
| CPU | Reason for Recommendation | Release Date | Platform | Date of Recommendation | GN Original Review* |
| AMD R7 7800X3D | The original launch price was $450. We don't recommend buying much above that. Depending on price (fluctuates), this is the best gaming part at the time of writing. It is sometimes the best value gaming part. At the time of writing, value is terrible -- it lands on this list only with the note that you should wait and see. Also, 9000X3D may be around the corner. | 2023 | AM5 | October 13, 2024 | R7 7800X3D Review |
| AMD R7 5700X3D | This is often the best-value drop-in upgrade for AM4 platforms to give a major gaming performance boost without a totally new system. The 5800X3D would be best, but runs higher price. | 2024 | AM4 | October 13, 2024 | R7 5700X3D Review |
| Intel i9-12900K | At the time of writing this, the CPU has a $100 discount code that lands it at $260, which is very good value. The usual listing price is $360 at time of writing, but you'd be buying into an abandoned platform. | 2021 | LGA 1700 | October 13, 2024 | 12900K Review |
| AMD Threadripper 7980X | For extremely core-intensive tasks that could benefit from the increased capabilities of an HEDT platform (more RAM, more cores), the 7980X remains overall unbeatable. You can check our review for more details. | 2023 | TRX50 | October 13, 2024 | TR 7980X Review |
| Intel i3-12100F | Alder Lake has been a time-tested architecture without major concerns. The 12100F is frequently one of the cheapest new CPUs (if not buying used) that can still play most games well. It has severe limits in some games. This is not particularly strong, but is affordable and often acceptable as a compromise. | 2022 | LGA 1700 | October 13, 2024 | 12100F Review |
| Notes | We are posting this just ahead of Arrow Lake, so we may add some Intel recommendations to this list. Check back in a few weeks to a month to see if this has changed. The older Intel stuff is on here for its price benefit, but with the proximity of Arrow Lake, we'd generally advise waiting a few weeks rather than committing to a dead platform with the more expensive CPUs (such as 14th Series) |
Is Your CPU Missing From This Data? Here’s What to Do
We frequently receive questions from people asking where their particular CPU would land on a chart. There are thousands of CPUs that could be tested, so we obviously don’t have all of those listed. The best bet is to approximate the positioning by just thinking through the data that is present and using deductive reasoning. Newer builders may not realize that it is often this simple, so we’ll outline some concepts so that you can at least get a rough idea of where your part might fall. You can apply this to any reviewer’s charts. And of course, if we’re missing a part, there are plenty of qualified reviewers out there who may have something we’re missing (and we likewise try to cover what they miss) -- that’s the value of multiple qualified reviewers.
CPU Performance Interpolation/Deductive Reasoning Examples
Example 1: The Ryzen 5 1600AF is not present on the charts.
Solution: The Ryzen 5 1600AF is functionally an R5 2600, just at slightly different clocks. Looking up original reviews would get you this information, which you can then apply to modern charts. Looking at the R5 2600 in a chart is close enough to the R5 1600AF that you could base your decisions off of that part.
Example 2: The Ryzen 5 2600 is also missing from the charts.
Solution: Pull up a few old/original reviews of the R5 2600 and identify parts that are nearby or adjacent in performance. Look at a few charts, as some games can differ. Once you have found the most commonly comparable part, you can use that as a rough gauge on charts.
Example 3: The i7-10700K is missing from the charts.
Solution: If the i5-10600K and i9-10900K are present, it’s reasonable to assume that the 10700K is between them. Although this can have a relatively wide range, the reality is that, especially upgrading from something older, it won’t matter enough to hurt decision making on new processor purchases (since anything will be a huge upgrade).
Example 4: The Sandy Bridge i7-2600K is present, but not the i7-2700K
Solution: In situations such as these, where the part is basically just a slight change (example: 2700X vs. 2700, 2600X vs. 2600, 7700X vs 7700), you can just look at the one that is present and assume close enough performance to compare. This is again where it’s important to keep perspective: If the goal is to upgrade, being 2-5% off on the estimate isn’t going to meaningfully impact decisions if the alternative is no good modern data as reviewers move on.
As a last-ditch solution: You can look at games or benchmarks which are least likely suspected to have had major patches, such as GTA V, and calculate the percent difference between the target part and mutually present part on both an older chart and the new one. Then apply this to the modern chart to approximate or interpolate the rank. For example, if you pull up a chart from two years ago with the 8700K and 12700K on it and calculate the difference (typically, (new - old) / old), you can then apply that on the same game chart from modern times. This is the least perfect method because newer games may have architecturally evolved and may not be linear and older games get patches. You’d frankly be better off finding it somewhere else on the internet, but if you really can’t, this is a method that helps get at least something to work with.
DISCLAIMER: Data Accuracy Standards & Reduced Vetting Practices
For standalone reviews that receive full video treatment, we run through a quality control process that is intensive and often takes several days to complete. These are time-intensive, cost-intensive, and critical to the accuracy of our mainline reviews. We would never skip steps for the fully produced reviews.
But we want to publish more of the data we collect outside of the reviews process because it’d help people with purchasing decisions. We have been resistant to publishing the extra data because the ‘extra’ data doesn’t go through the same validation processes. It’s still useful and rarely has issues; however, our QC standards are high and we are careful with what we release. Anything we’re uncertain of or haven’t vetted fully is withheld until it clears those bars.
But a lot of people would benefit from knowing where an AMD R7 1700 lands today, and outside of full revisits, we don’t have a good avenue to release data that is useful, likely up to our usual standards, but just not quadruple-checked. That’s what the Long-Term Support (LTS) charts are for.
We’ve decided to release the extra data to try and cast a wide net to help people upgrading from older or more obscure parts, but are doing so with the upfront disclosure that the difference between the Active charts and the LTS charts is the validation process. In other words, data which exists on LTS charts but not Active charts should be understood by the audience as more likely to have some sort of data confidence issue or possible deviation from expected results. It is still unlikely, but more likely than Active charts. With that transparency and understanding, here’s the difference in our processes:
Active Chart Vetting Process
One of our biggest hangups for publishing a full list of our “Mega Charts” for CPUs has been that we simply cannot sustain the intensive QC process for a secondary dataset that contains CPUs that haven’t been published on the channel recently. We often still collect data for older CPUs, but may not publish it for time reasons (meaning that it was collected for internal review, but not fully vetted for publication).
Here’s the full process, with some specialty confidential steps removed:
- The Test Lead for the tests (typically Steve) establishes a strict SOP for the test suite to ensure data consistency. The Test Lead also determines which software is tested, performs benchmark analysis for standard deviation and consistency, and determines the testing methodology
- The Test Lead (typically Steve) establishes a Test Matrix containing all CPUs to be tested, which tests they get, and data exporting practices
- The Subject Matter Expert (Patrick) builds software in collaboration with Steve for the test suite and builds the operating system configurations, establishing a “pre-flight checklist” for testing
- The Technician who runs the tests (primarily Mike, with assistance from Patrick and Steve and occasionally Jeremy) will check the results for correct resolution, correct settings, captures that prove the test completed correctly, image quality, and general errors. The technician performs re-runs as needed
- The Subject Matter Expert performs a secondary quality control pass on data. Any data which looks suspect of a bad pass, which requires manual filtering & removal prior to retests, will be deleted and flagged for the technician to rerun
- The Technician performs re-tests and then re-evaluates the results
- The Subject Matter Expert reviews them again. They are typically resolved at this stage and occasionally rejected entirely to move forward
- A Writer & Technician (typically Jeremy) performs a full pass on CPU export names, the hierarchical stack of the data and whether the hierarchy makes sense, and identifies potential areas where additional data may be necessary to confidently come to conclusions, then passes it to Steve. If Steve authorizes any of the re-evaluations from the Writer & Technician, they go back to the lab again for testing.
- Steve performs final intensive review, including running a variety of formulae for data consistency and evaluating results against archival results for consistency of scaling
- The Writer & Technician double-checks the finals. Any disagreement with what Steve passed is voiced and revisited. Once both are in agreement that it makes sense (or the suspect data is removed until validated), the data is sent to publication
- The video editor, who is often technical enough to identify obvious oversights, performs a ‘passive’ QC while editing and flags any issues. If any are found, they go through Steve for review, analysis, and either sign-off as accurate or correction
You’ll notice that a big part of the process is passing the results through multiple team members -- typically 4-5 people look at it before publishing. This is slow, but important.
Long-Term Support Chart Vetting Process
The Long-Term Support charts will contain data which is not in reviews, but was used as internal gauges for where parts should sensically land. As a result, this is the process it has followed since it has not previously been published:
- (Same) The Team Lead for the tests (typically Steve) establishes a strict SOP for the test suite to ensure data consistency. The Team Lead also determines which software is tested, performs benchmark analysis for standard deviation and consistency, and determines the testing methodology
- (Same) The Team Lead (typically Steve) establishes a Test Matrix containing all CPUs to be tested, which tests they get, and data exporting practices
- (Same) The Subject Matter Expert (Patrick) builds software in collaboration with Steve for the test suite and builds the operating system configurations, establishing a “pre-flight checklist” for testing
- (Same) The Technician who runs the tests (primarily Mike, with assistance from Patrick and Steve and occasionally Jeremy) will check the results for correct resolution, correct settings, captures that prove the test completed correctly, image quality, and general errors. The technician performs re-runs as needed
(Removed) The Subject Matter Expert performs a secondary quality control pass on data. Any data which looks suspect of a bad pass, which requires manual filtering & removal prior to retests, will be deleted and flagged for the technician to rerun(Removed) The Technician performs re-tests and then re-evaluates the results(Removed) The Subject Matter Expert reviews them again. They are typically resolved at this stage and occasionally rejected entirely to move forward(Removed) A Writer & Technician (typically Jeremy) performs a full pass on CPU export names, the hierarchical stack of the data and whether the hierarchy makes sense, and identifies potential areas where additional data may be necessary to confidently come to conclusions, then passes it to Steve(Removed) Steve performs final intensive review, including running a variety of formulae for data consistency and evaluating results against archival results for consistency of scaling(Removed) The Writer & Technician double-checks the finals. Any disagreement with what Steve passed is voiced and revisited. Once both are in agreement that it makes sense (or the suspect data is removed until validated), the data is sent to publication(Removed) The video editor, who is often technical enough to identify obvious oversights, performs a ‘passive’ QC while editing and flags any issues. If any are found, they go through Steve for review, analysis, and either sign-off as accurate or correction- (New) Steve performs final quick review, including ad-hoc comparisons between CPUs from which we have a known relative % scaling, to rapidly vet additional information. Data with low confidence is removed rather than investigated. Not every single data point is inspected, unlike reviews
This allows the team to continue work on important next reviews without forcing us to skip more important upcoming projects, but still allows us to get helpful data out. You’ll notice that this approach cuts at least 2 potential internal reviewers from the process, including reducing the amount of times the SME looks over the data, and reduces the review of every single data point down to ad-hoc glances to see if anything “jumps out” as obviously bad.
If you see anything that looks out of order, you are welcome to email us at team at gamersnexus dot net.
We are hopeful that this will allow us to publish more data to help people make upgrade decisions, with a middle-ground understanding going into it as to the limitations of the process.
With all the helpful information on how to use these charts and the disclosures out of the way, let’s continue to the data set.
Long-Term Support CPU Charts (1H24)
LTS DATA SET: Zen 5 Review Cycle (pre-Arrow Lake)
The below CPU charts are those found from our long-term support list. These will be updated only a few times a year, but contain the most data for some of the older CPUs.
Production Benchmarks
This section contains the “production” benchmarks for workstation, creation, and development applications.
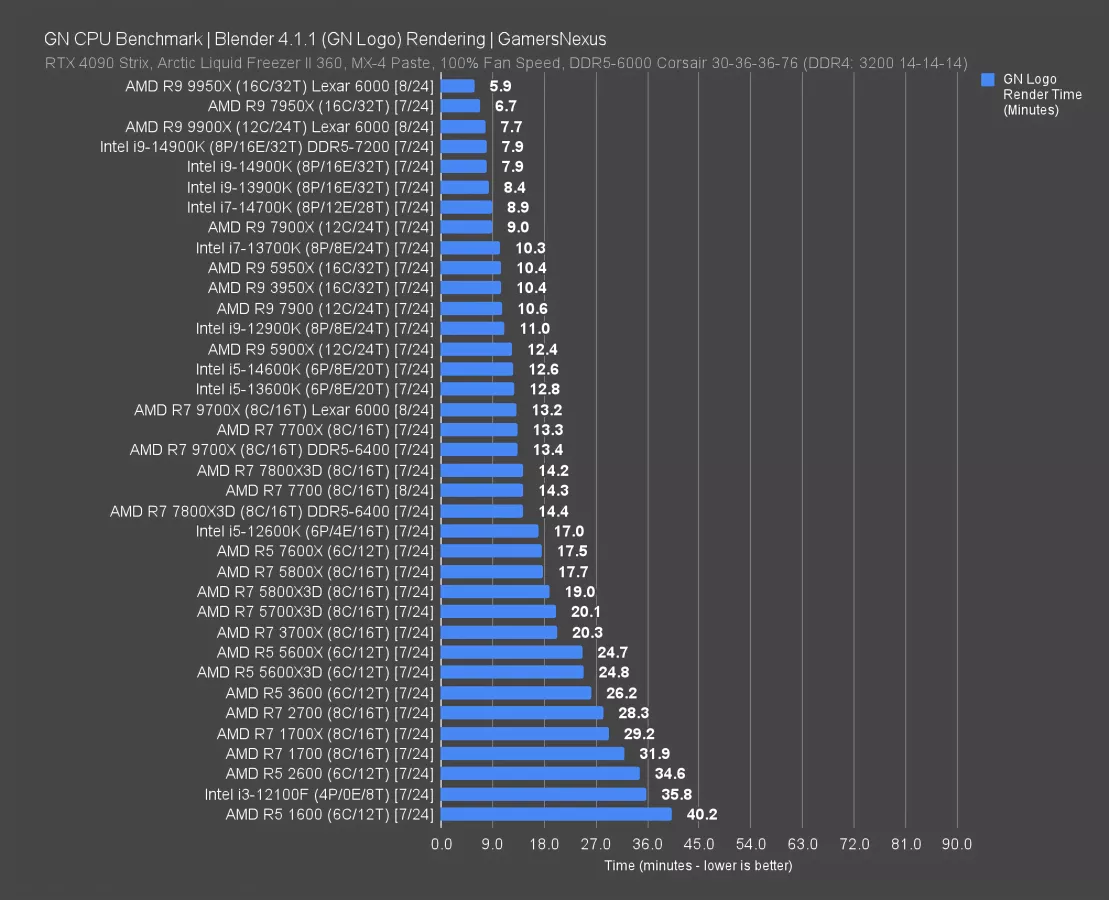
Blender 3D Rendering on the CPU

The above chart ranks CPU 3D rendering performance in Blender by best to worst (faster, or lower time, is better). This should help you identify the best CPUs for rendering in 2024; however, GPUs are heavily relied upon and would be a separate benchmark.
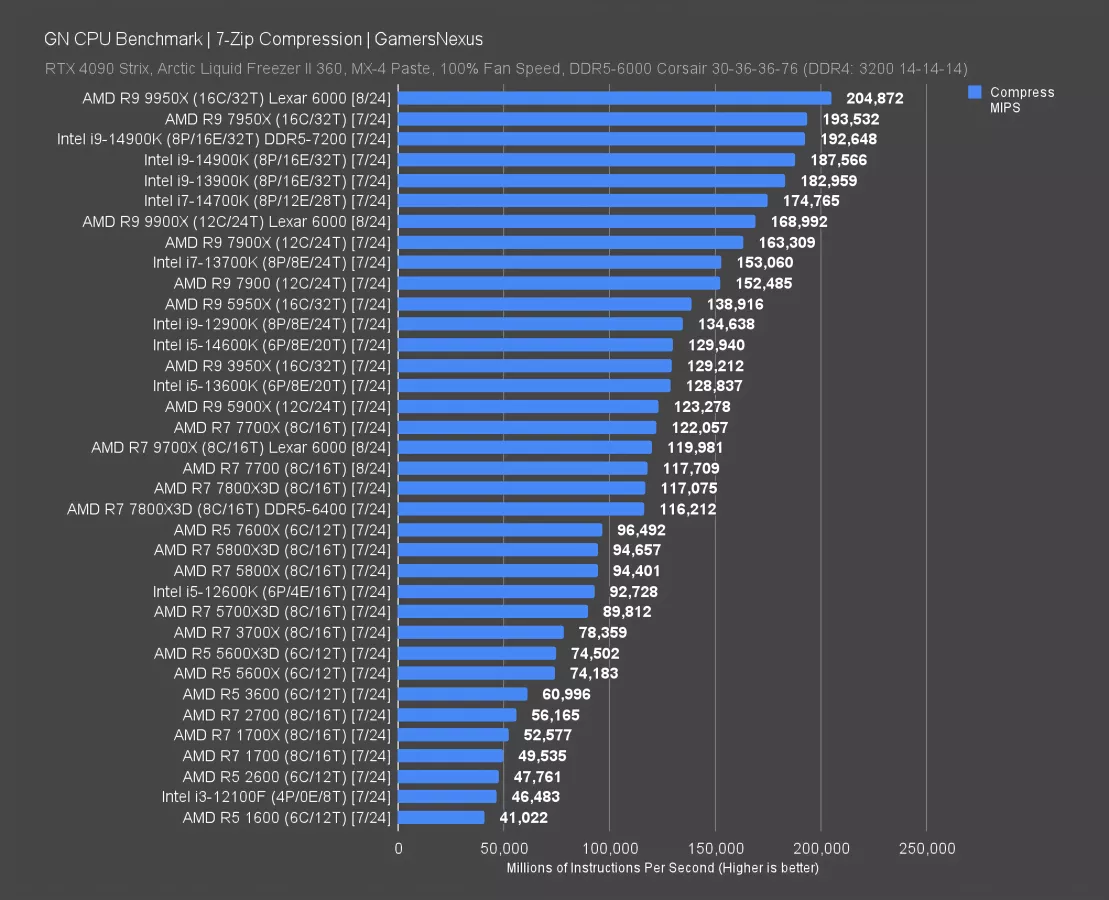
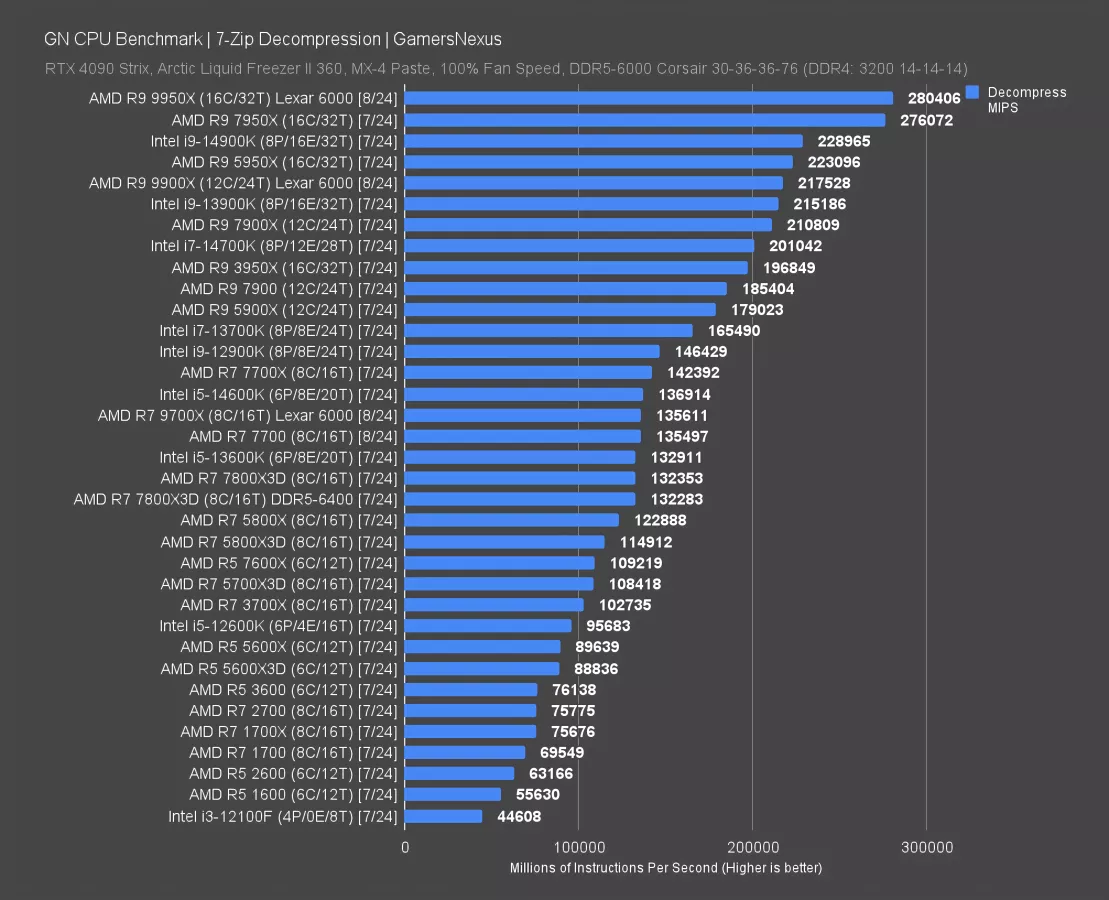
7-Zip File Compression & Decompression Benchmarks
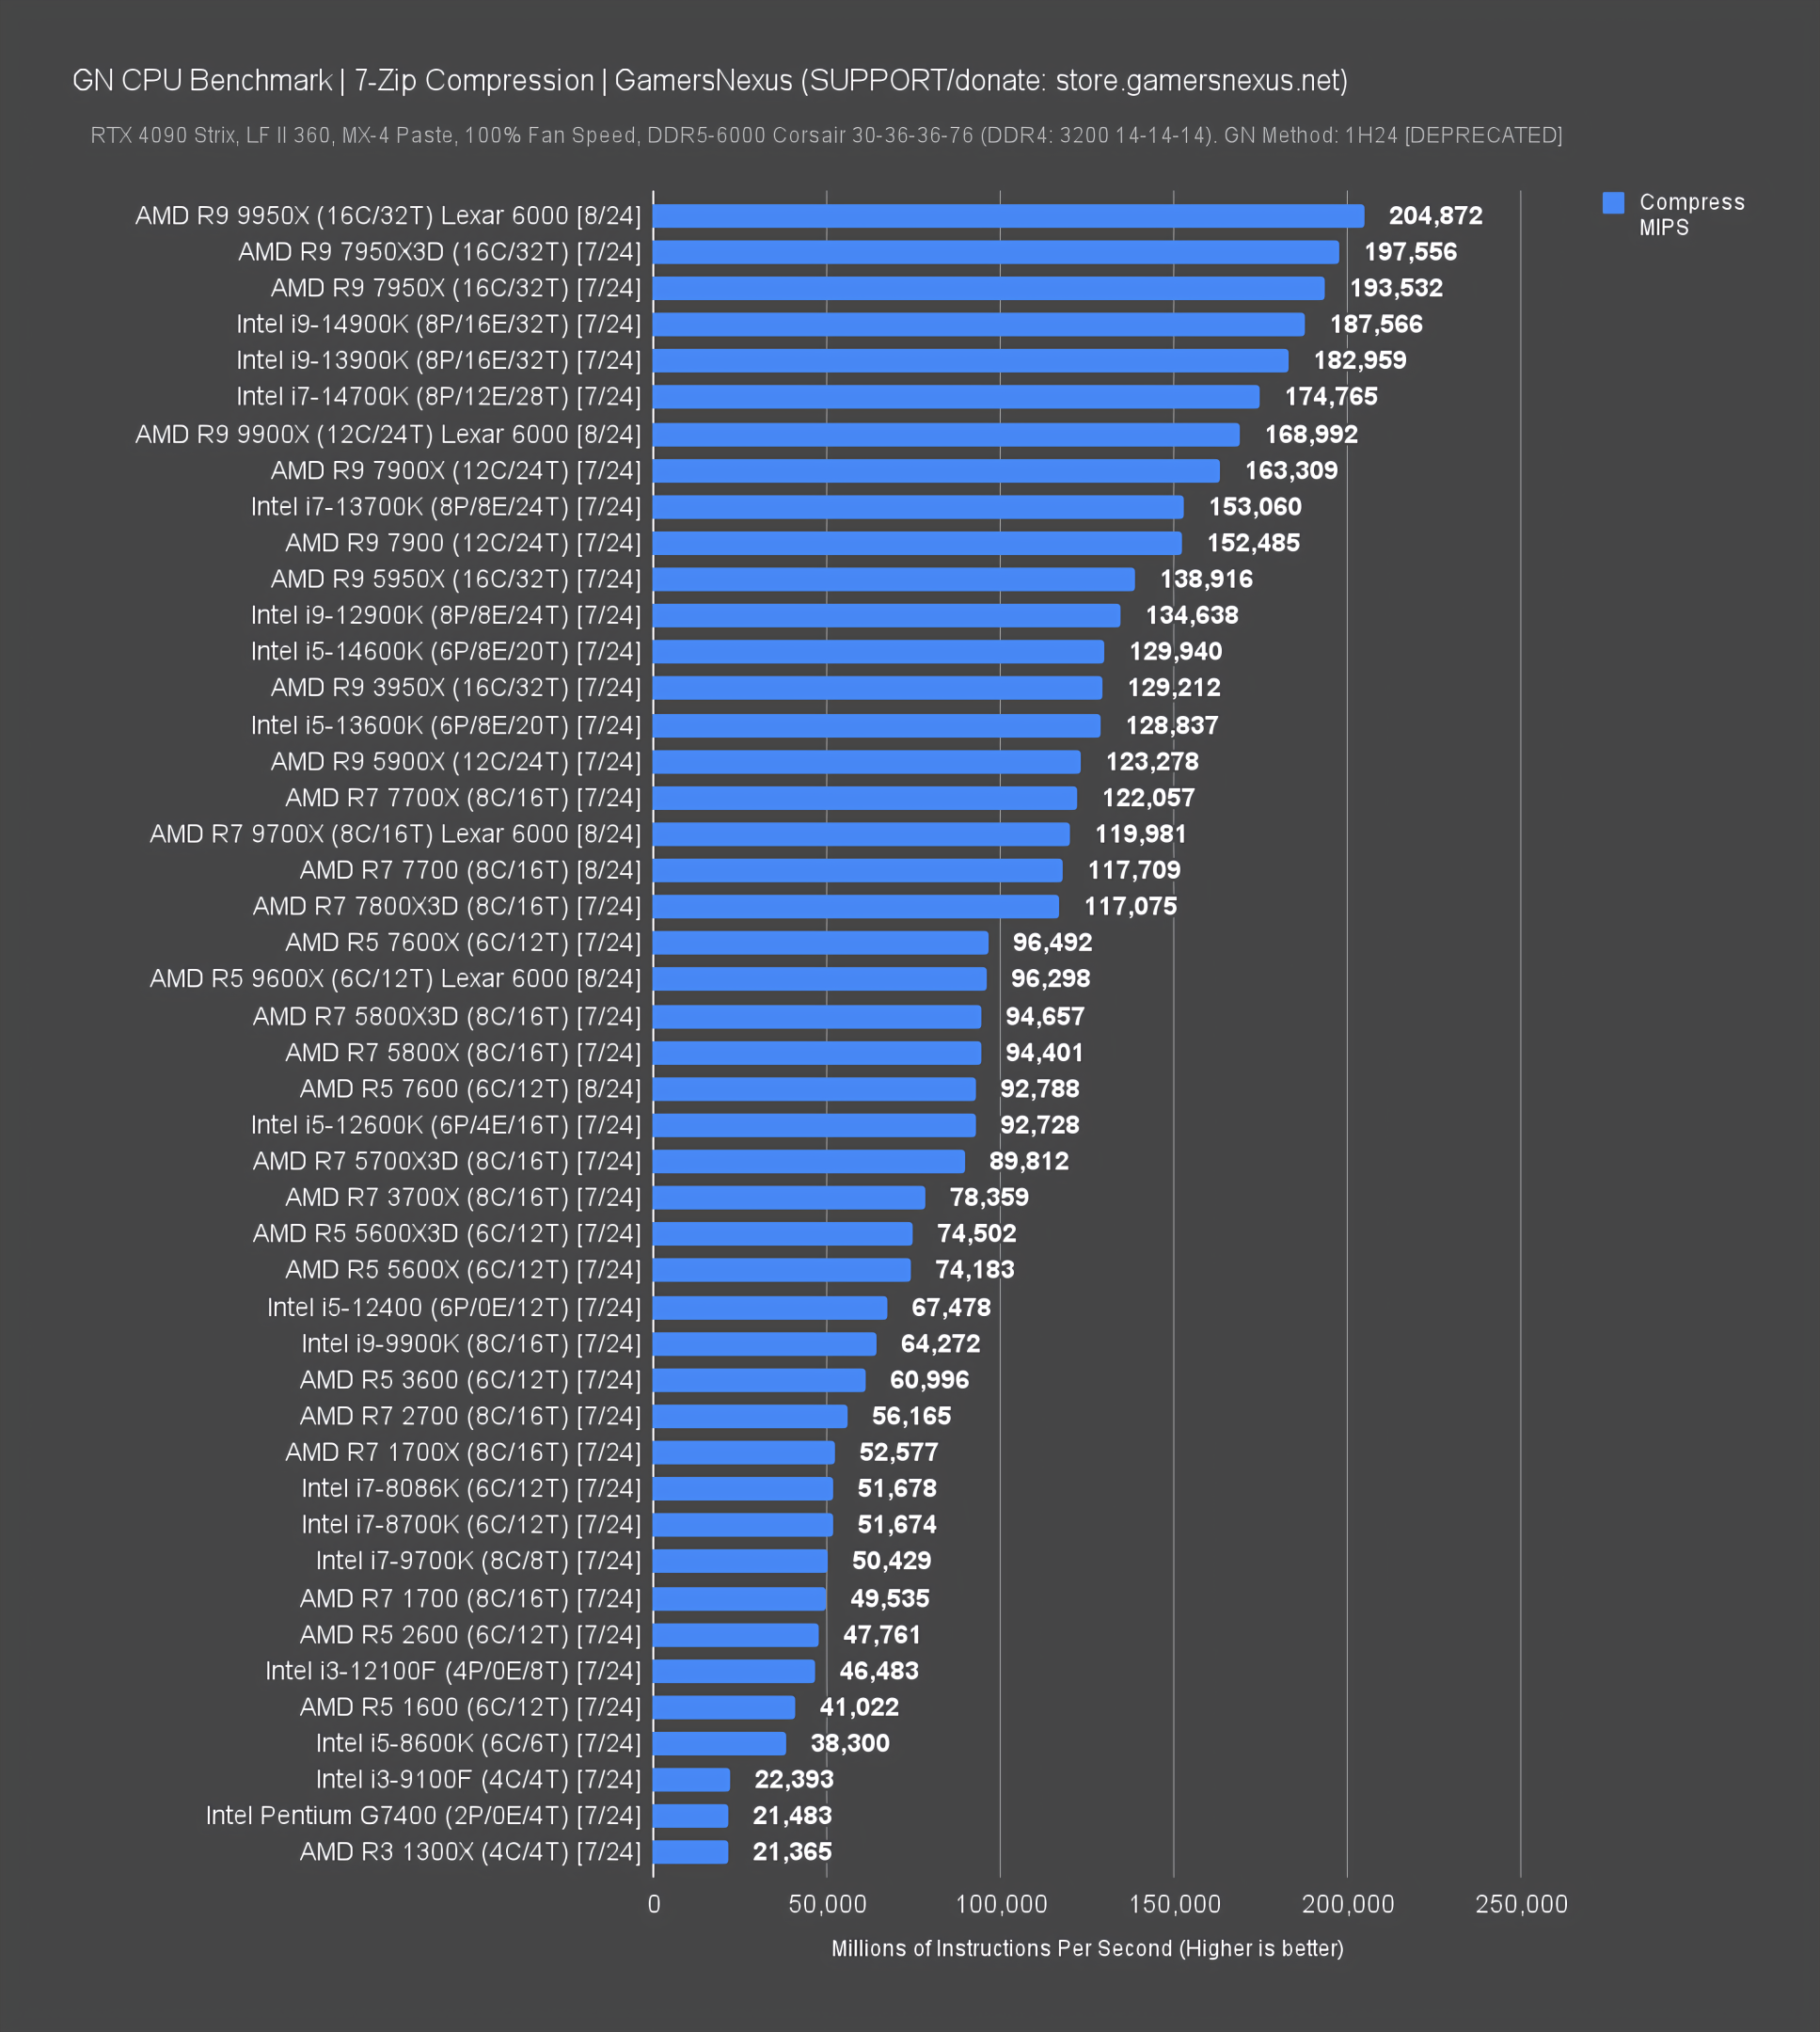
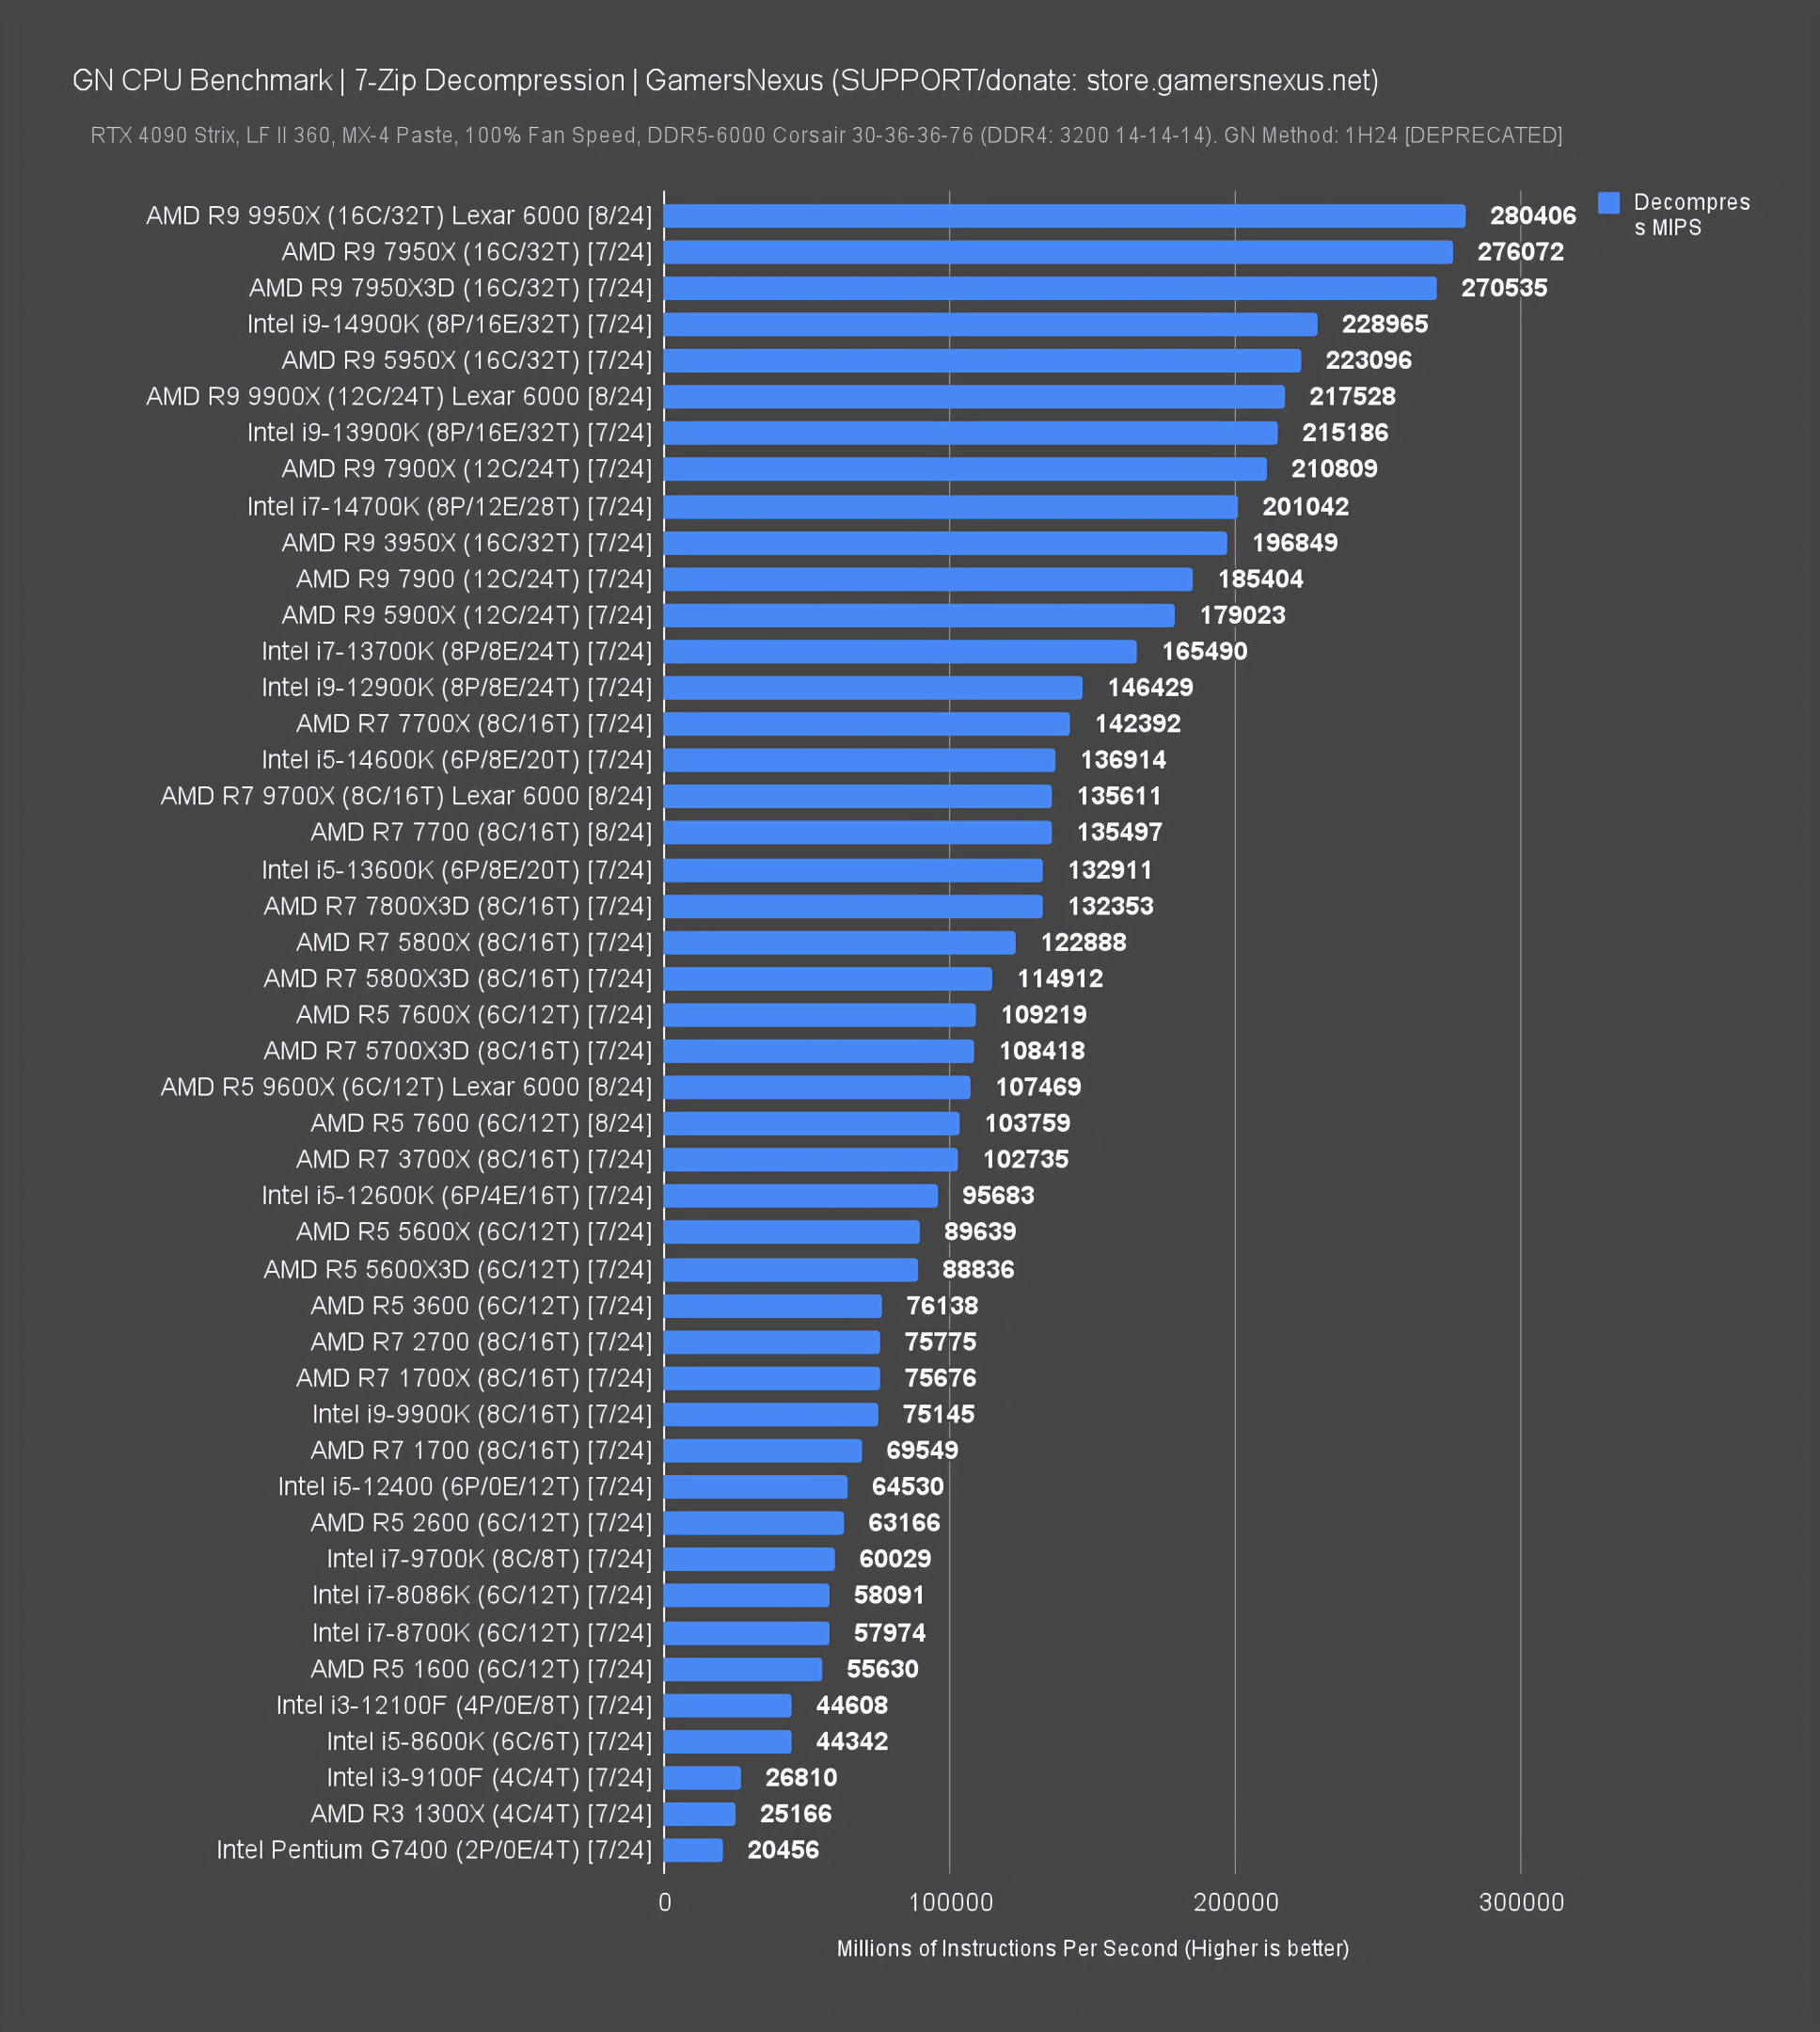
The above charts contain our tests for 7-Zip file compression and decompression. If you frequently work with compressing and decompressing data, such as for large file transfers in compressed formats or for certain game loading tasks, these will give an idea for performance.
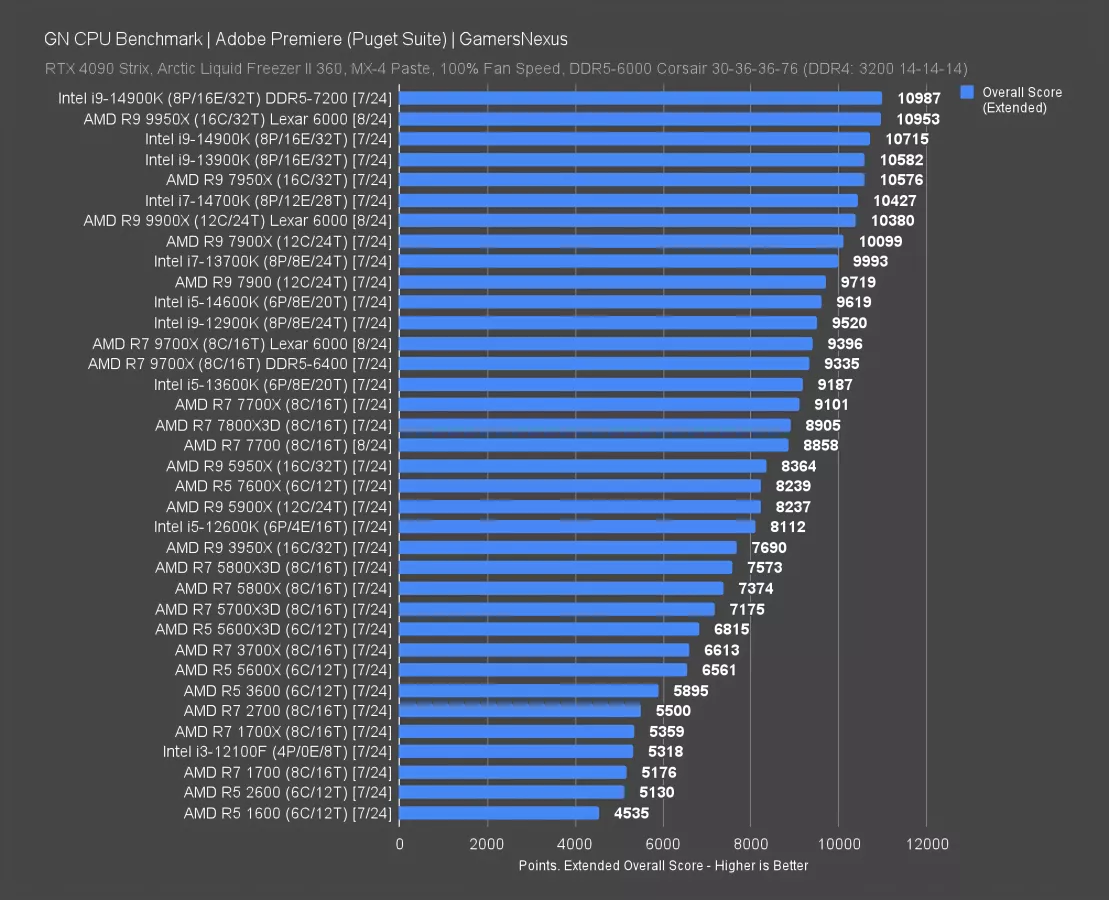
Adobe Premiere Video Editing & Rendering CPU Benchmarks

This chart uses the Puget Suite to benchmark Adobe Premiere for video editing and rendering tasks, focusing on CPU performance. Adobe Premiere cares both about the CPU and the GPU, and relies upon a strong combination (rather than biasing toward one component, like 3D rendering might do) for reduced scrubbing or playback ‘lag’ and improved rendering and encode performance.
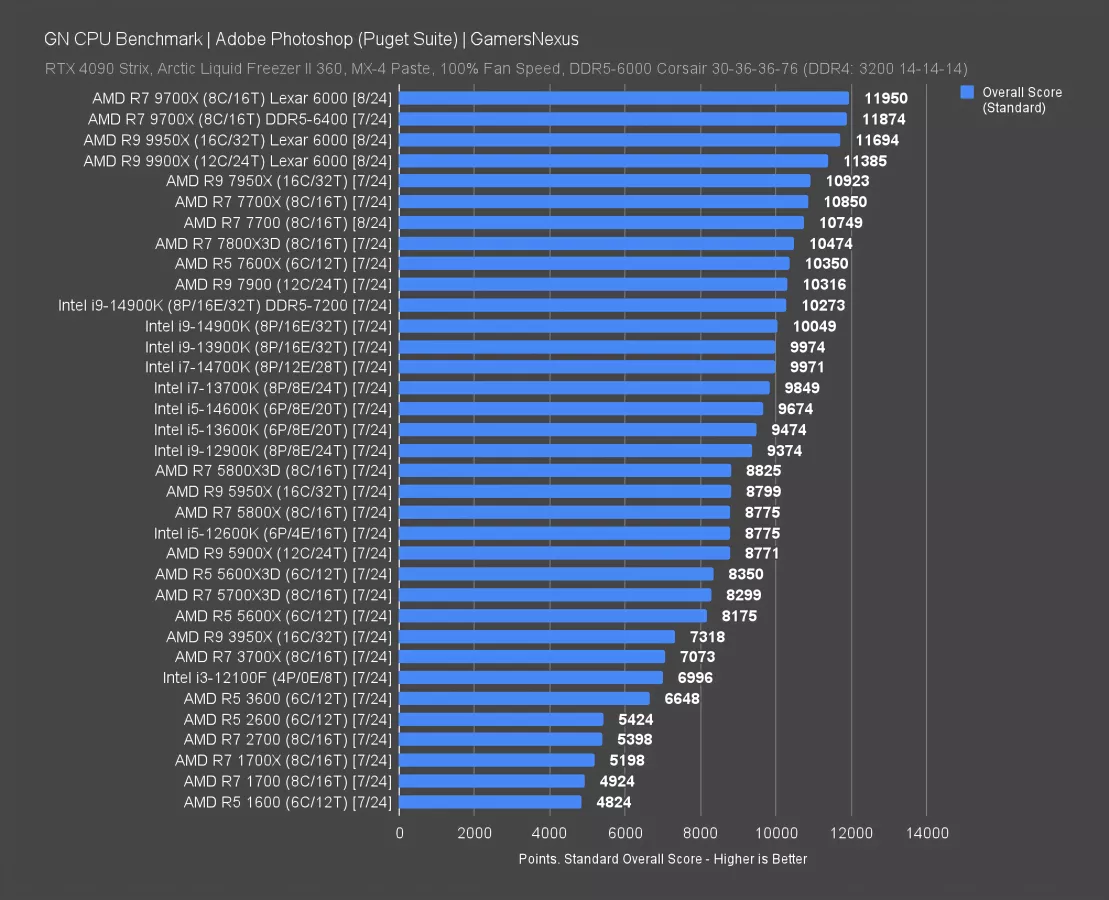
Adobe Photoshop CPU Benchmarks & Comparison

This chart is for Adobe Photoshop and compares some of the best CPUs currently out for Photoshop. Testing is done with the Puget Suite and includes warps, transforms, scales, filters, and file manipulation.
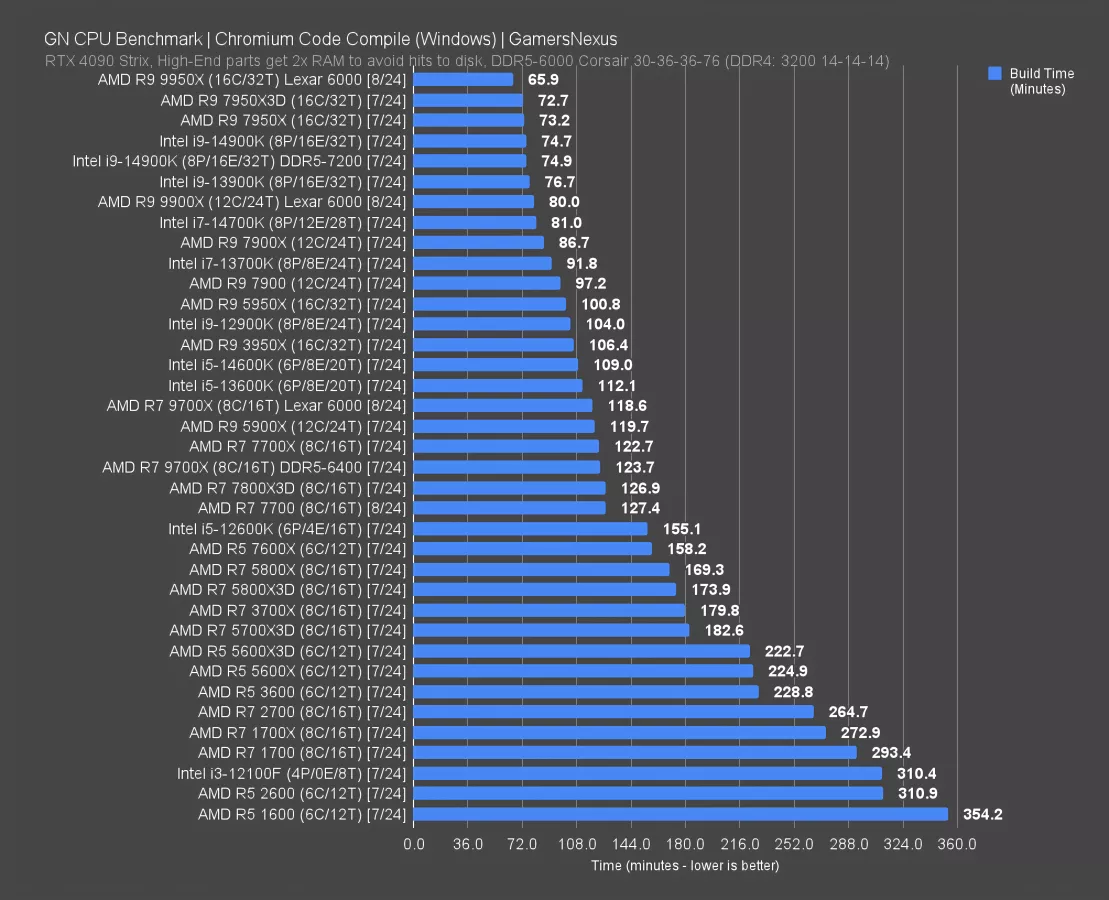
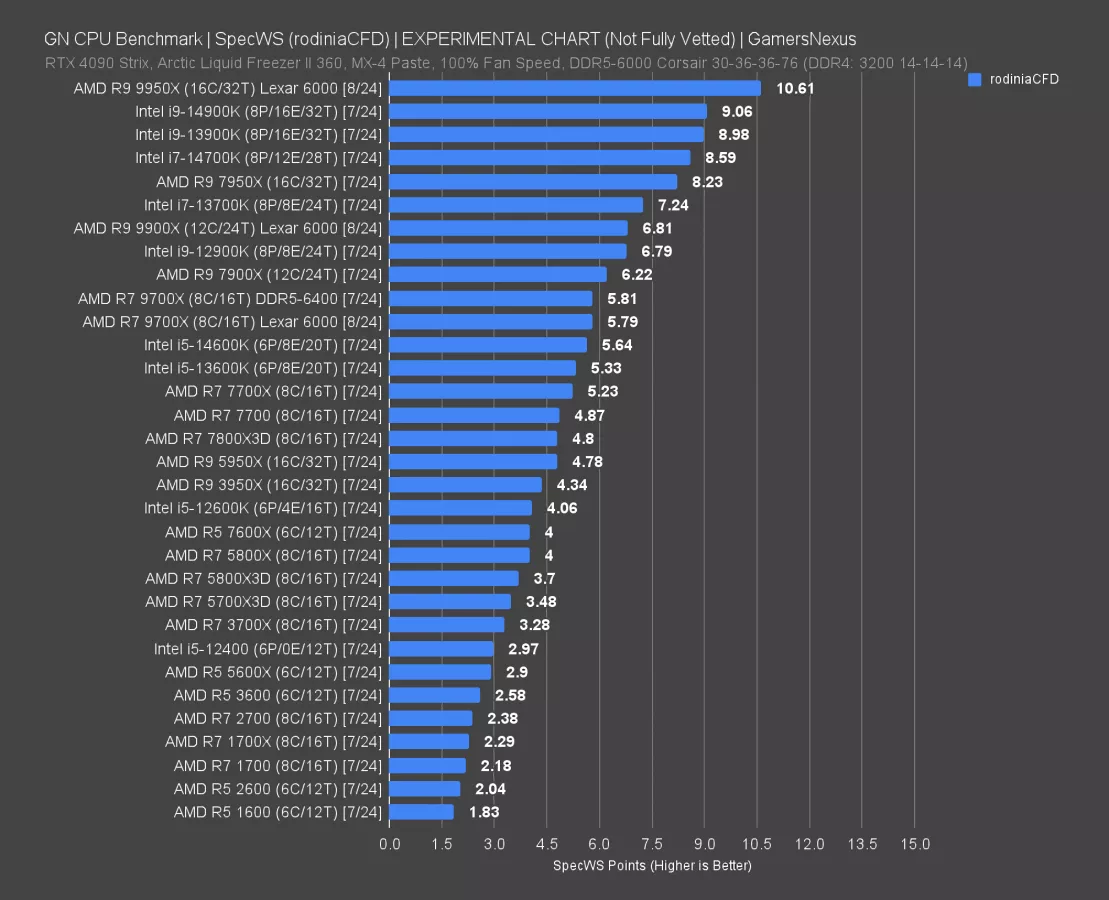
Chromium Code Compile CPU Benchmarks

This chart looks at a Chromium code compile. It’s a CPU benchmark for programmers and developers, with the caveat that (like any of these tests), we can’t realistically represent all compile scenarios. Because we try to represent a wide range of possible use cases, we don’t cater too much to any one specialty. This should give you an idea for at least how this specific compile behaves. If your workloads resemble this, you may be able to assume some level of linearity.

Gaming CPU Benchmarks & Best CPUs
Even if your specific game isn’t represented here, the best way to use our charts for determining CPU differences is to look at the relative ranking across a number of games. Our intent with this approach is that you can determine the best-value upgrade (our reviews are very value-oriented) by comparing the typical or average gap between two parts.
In most scenarios, the CPUs will scale similarly from game-to-game, barring any unique behaviors of a particular game. If CPU A is better value in Game A, B, and C, it is very likely also better value in Game D (though not always).
For individual per-game benchmarks, we’d recommend our Game Benchmarks section that deep-dives on new releases whenever we get a chance.
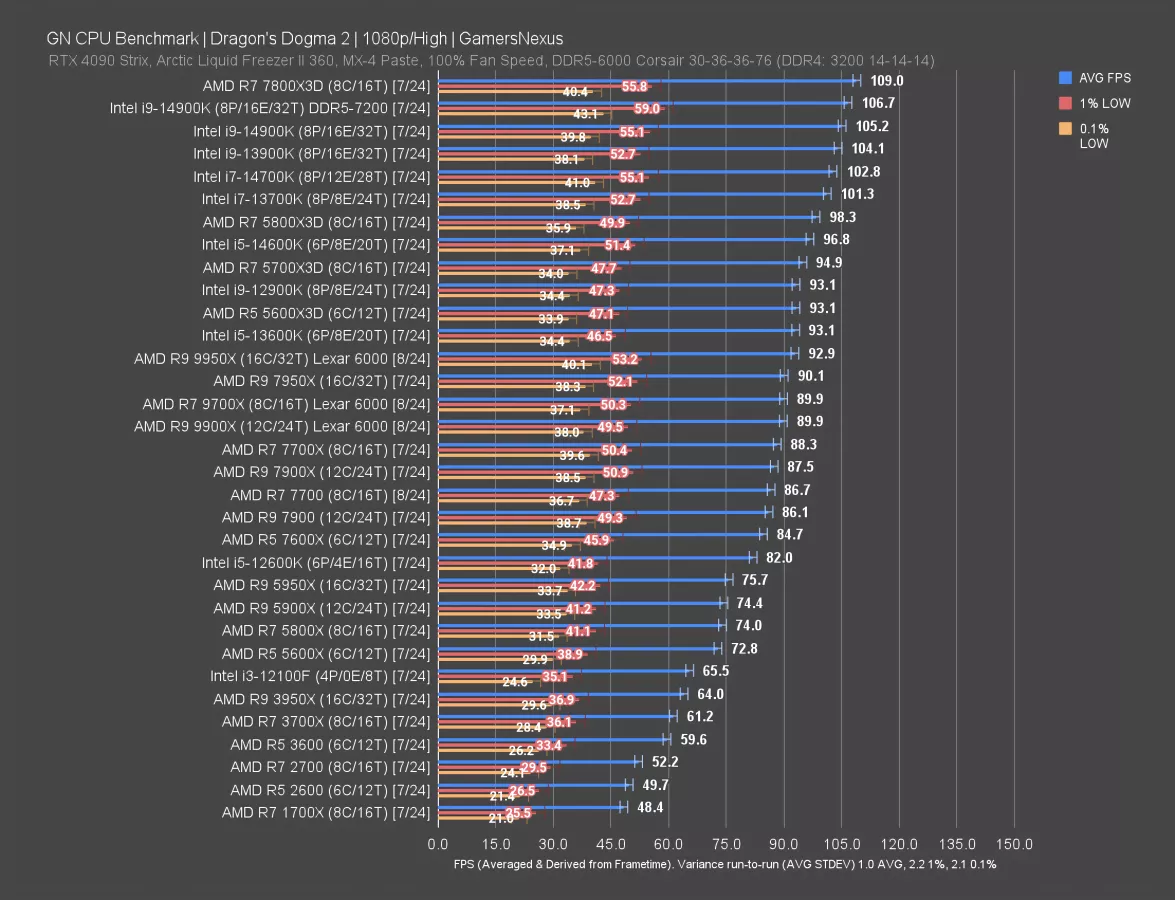
Dragon’s Dogma 2 CPU Benchmarks

This is for Dragon’s Dogma 2, which is one of the newest games in our CPU test suite. Dragon’s Dogma 2 is still getting regular updates, so the CPUs shown on this chart were all run on the same game version. The game remains CPU-heavy in the cities with dense NPC populations, which is where we test. We published a separate deep-dive benchmark of Dragon's Dogma 2 here.
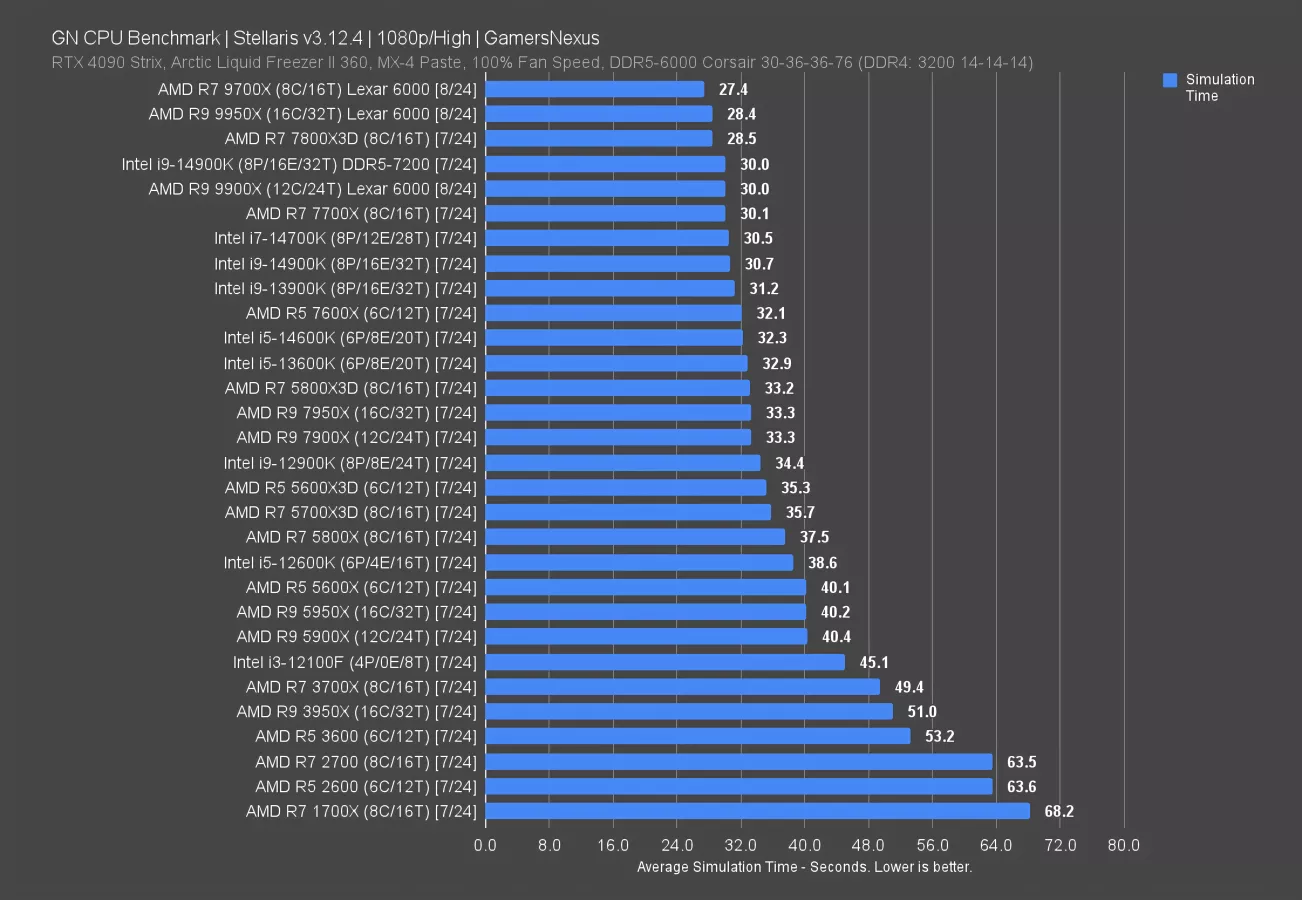
Stellaris Simulation Time CPU Comparison

This chart evaluates simulation time in Stellaris using a late game save file. The number is represented in time, with lower being better. Faster simulation (shorter time required) is noticeable in 4X or Grand Campaign / Grand Strategy games where AI turn processing requires significant CPU effort.
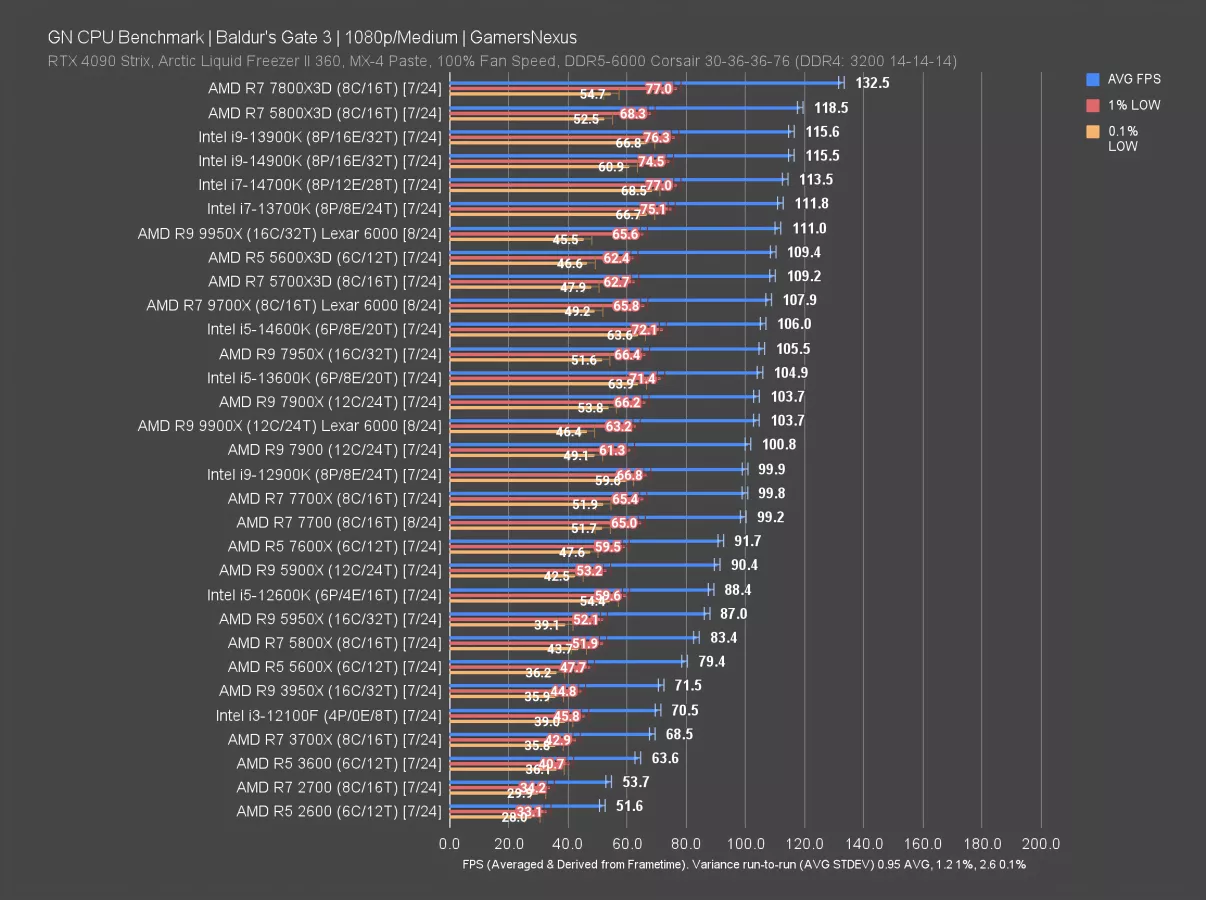
Baldur’s Gate 3 CPU Benchmarks

Baldur’s Gate 3 is tested at 1080p/Medium in the above chart, which allows us to see CPU scaling all the way up to the top of the stack for the best gaming CPUs.
We test in Act III in the city itself, near a market with a lot of NPCs.
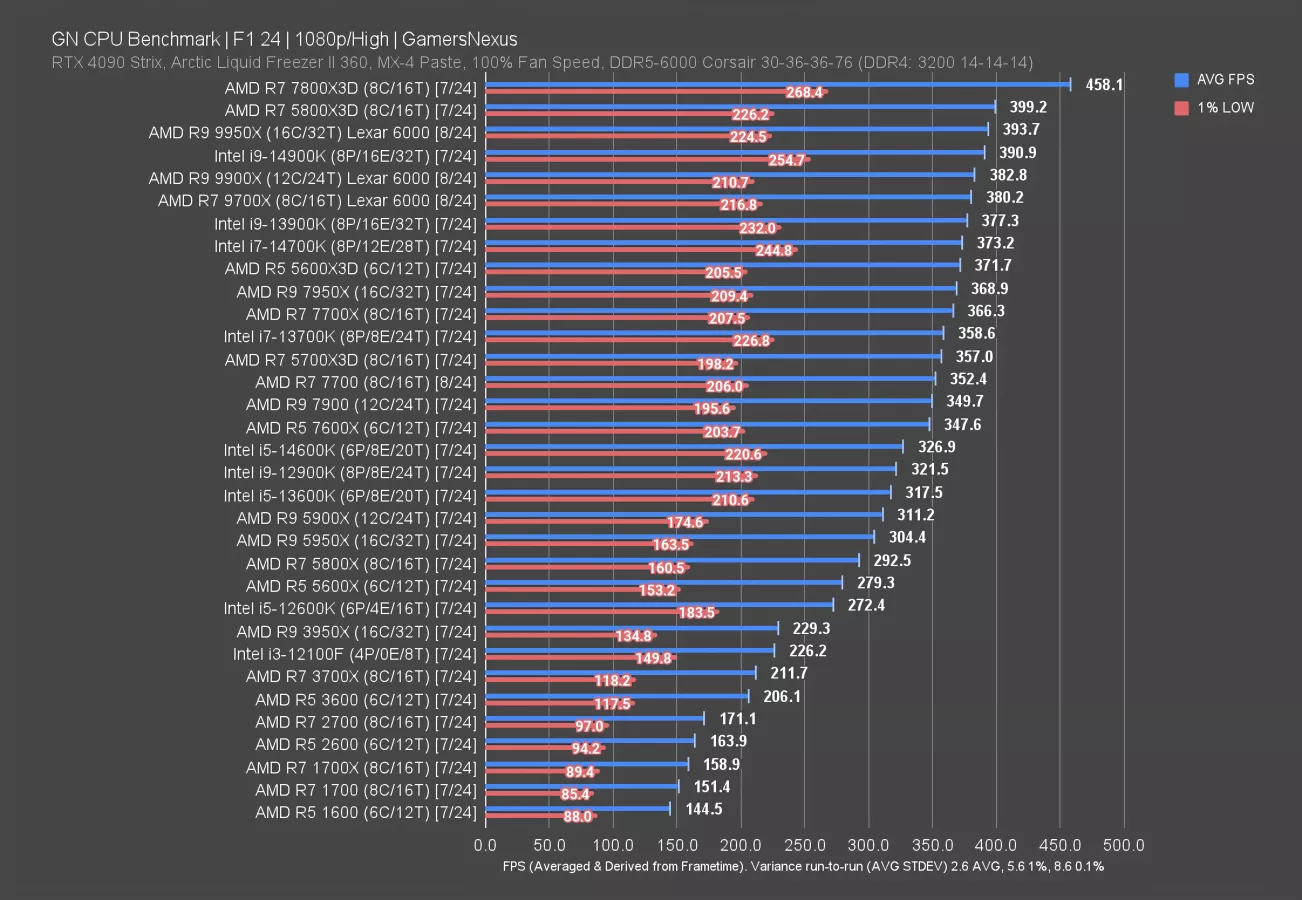
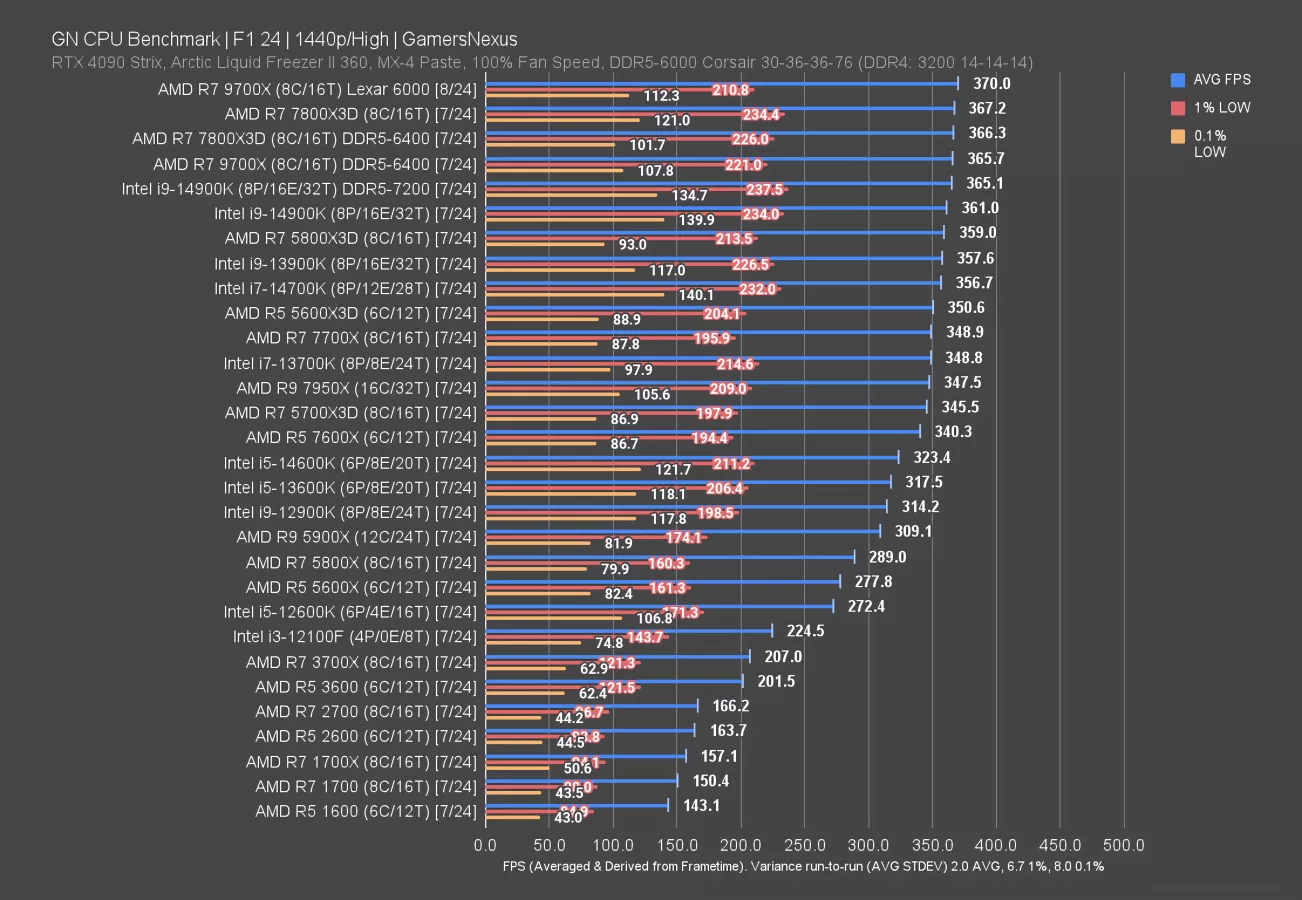
F1 2024 1080p & 1440p CPU Benchmarks
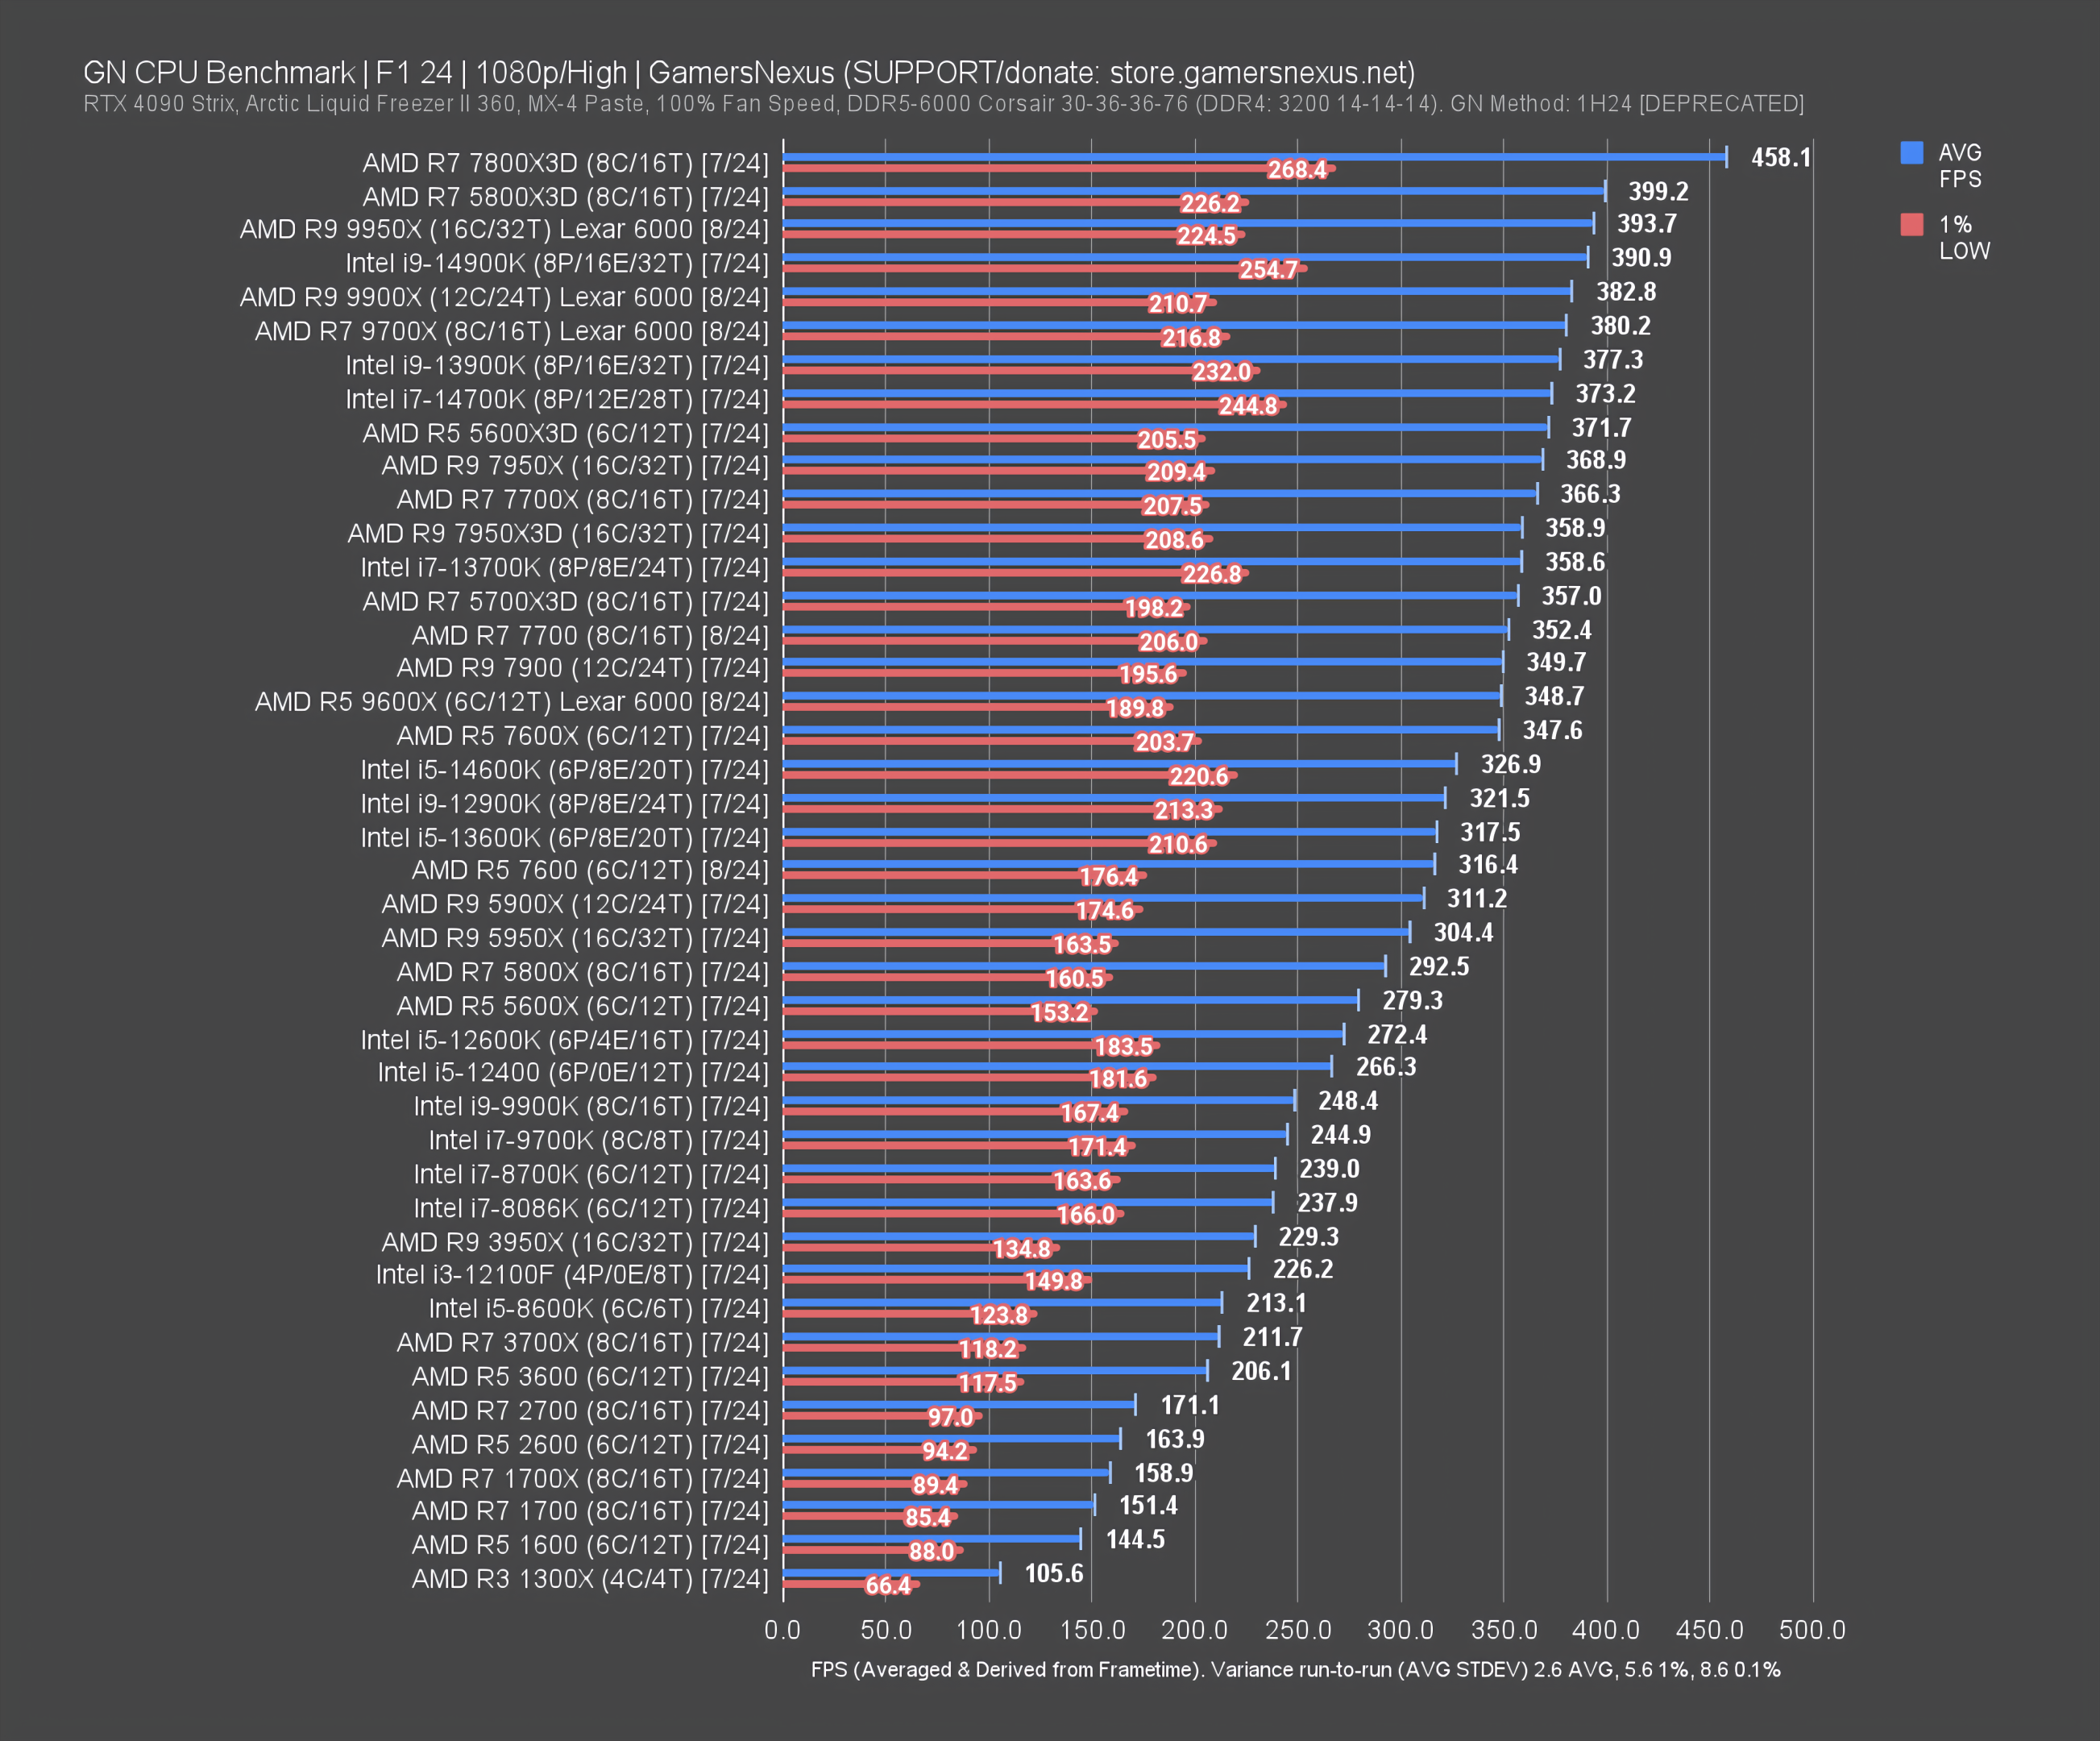
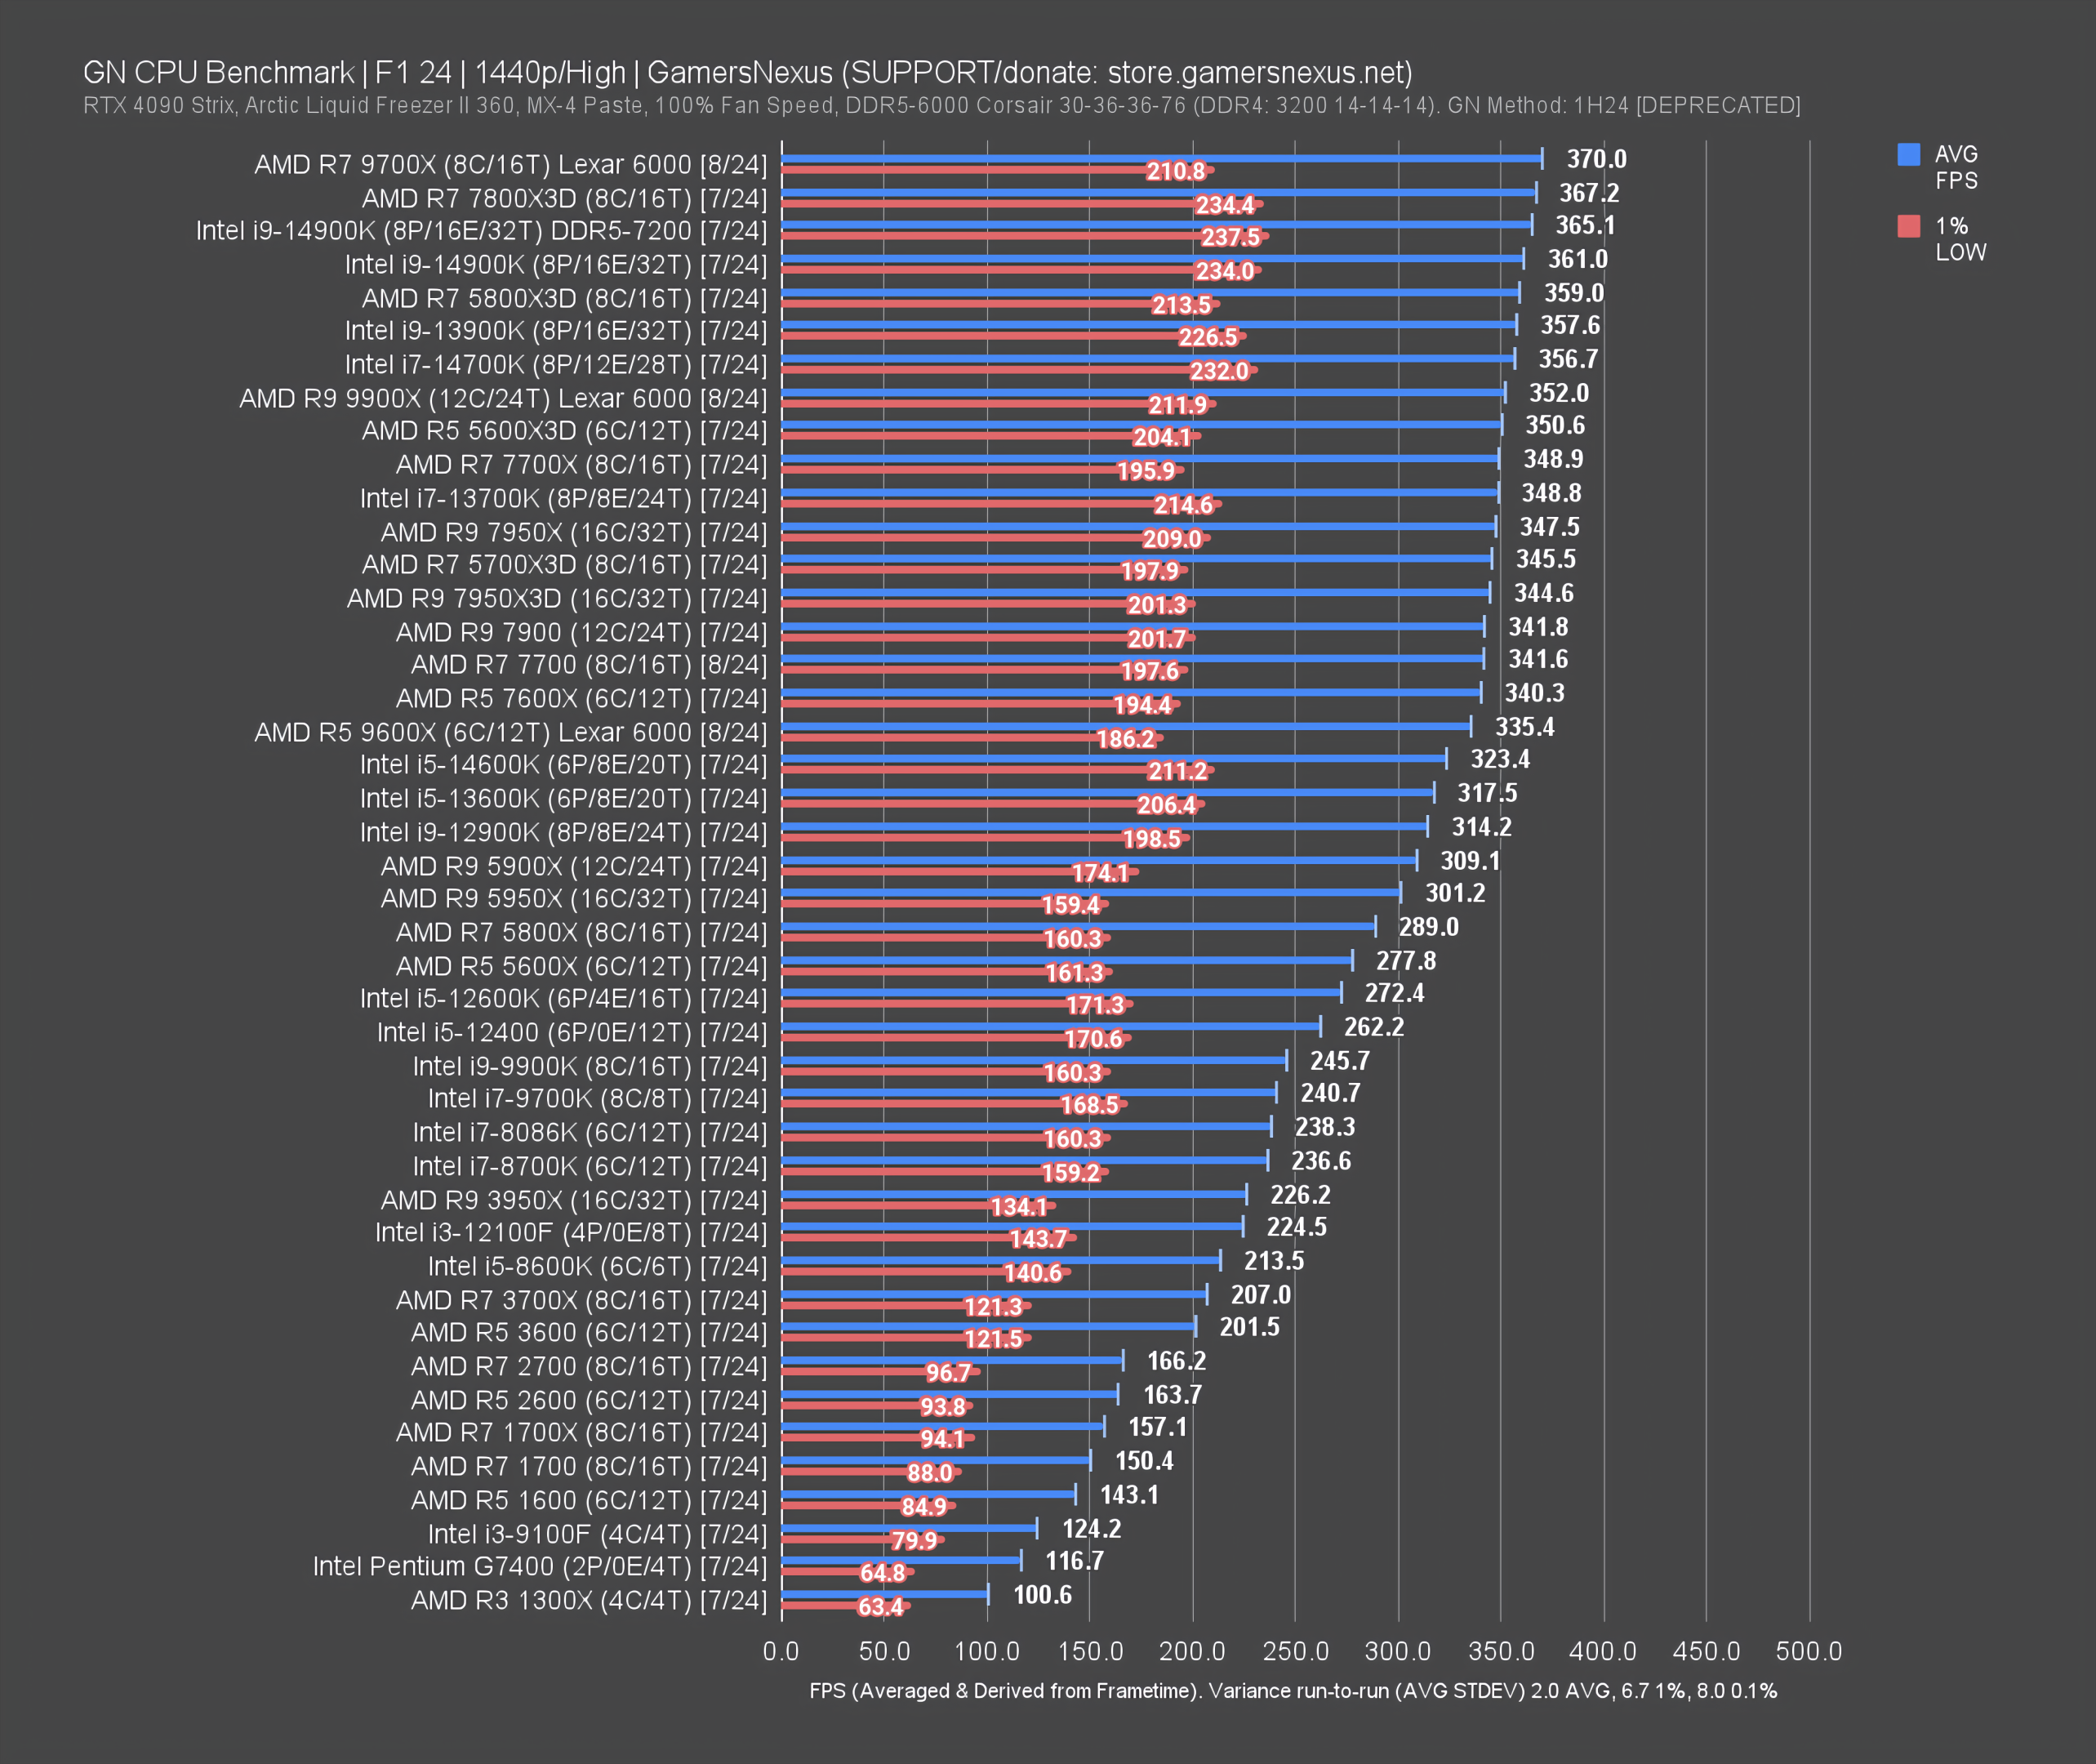
This chart gallery is for F1 24 and includes both 1080p and 1440p results. Typically, in scenarios which remain primarily CPU-bound, we see roughly the same hierarchical lineup across both resolutions. The top of the chart truncates maximum FPS, which means that CPUs which occasionally bounce off of the GPU bottleneck will be less reliable to differentiate from one another (as they are externally bound).
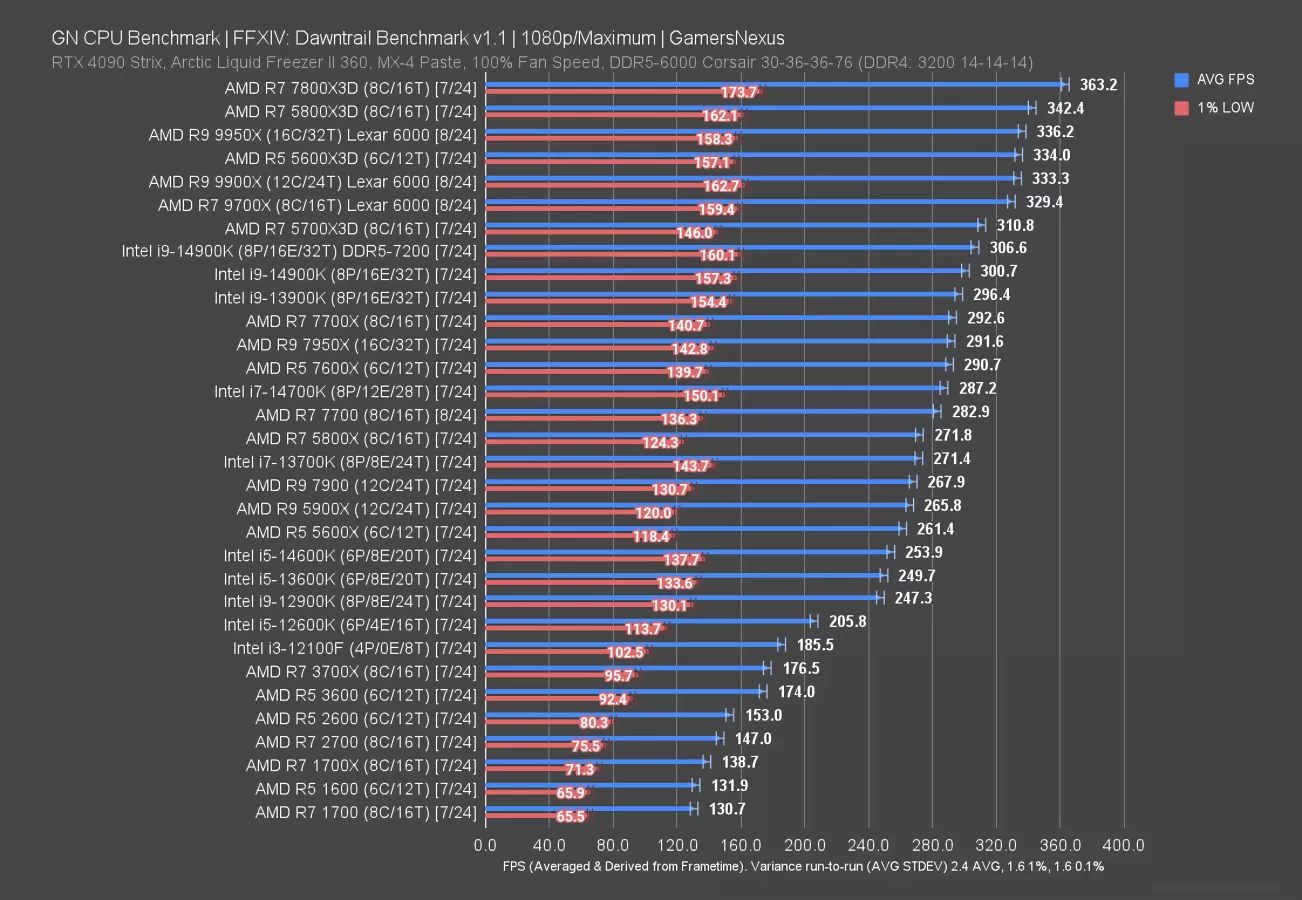
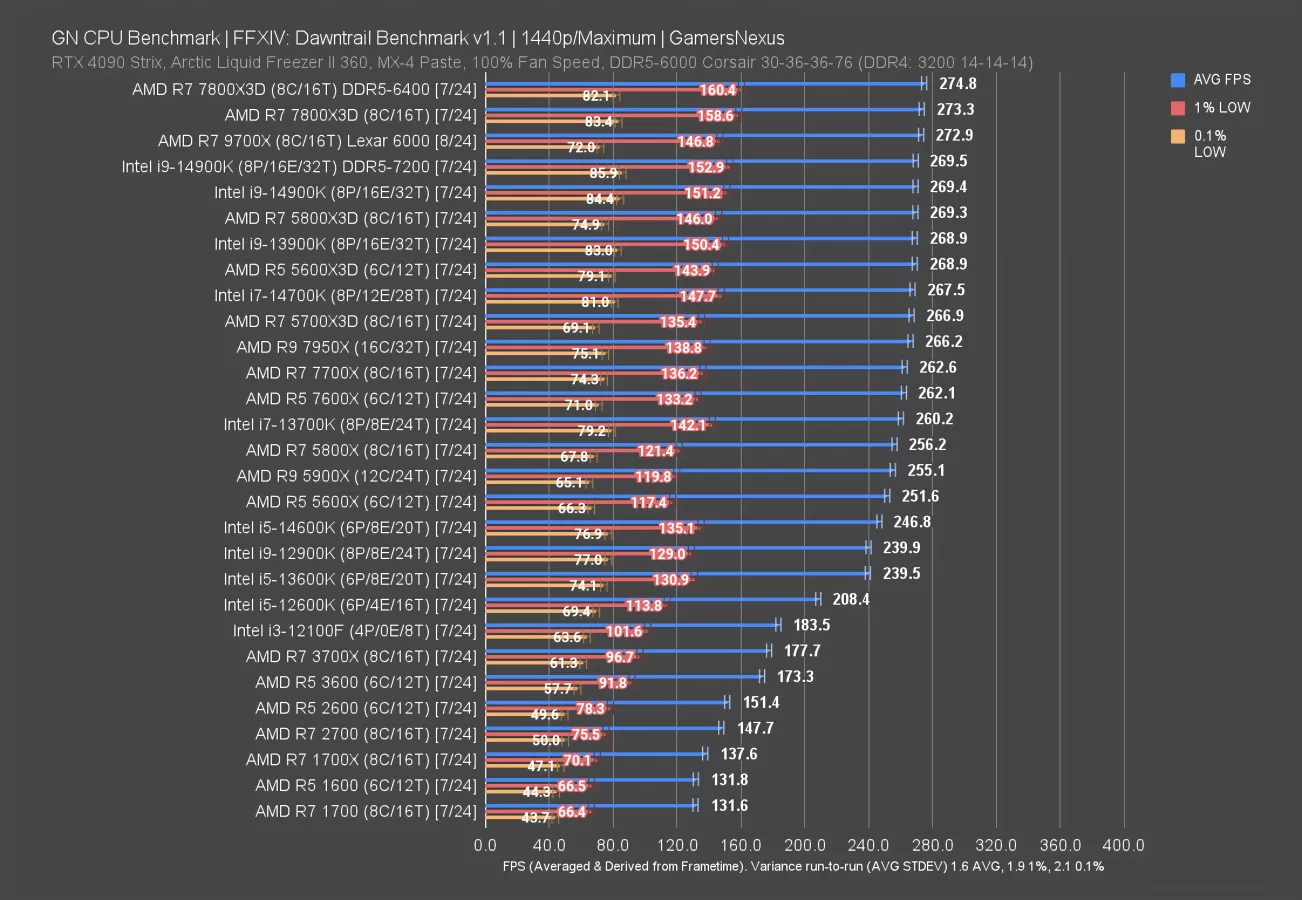
FFXIV: Dawntrail CPU Benchmarks (1080p & 1440p)

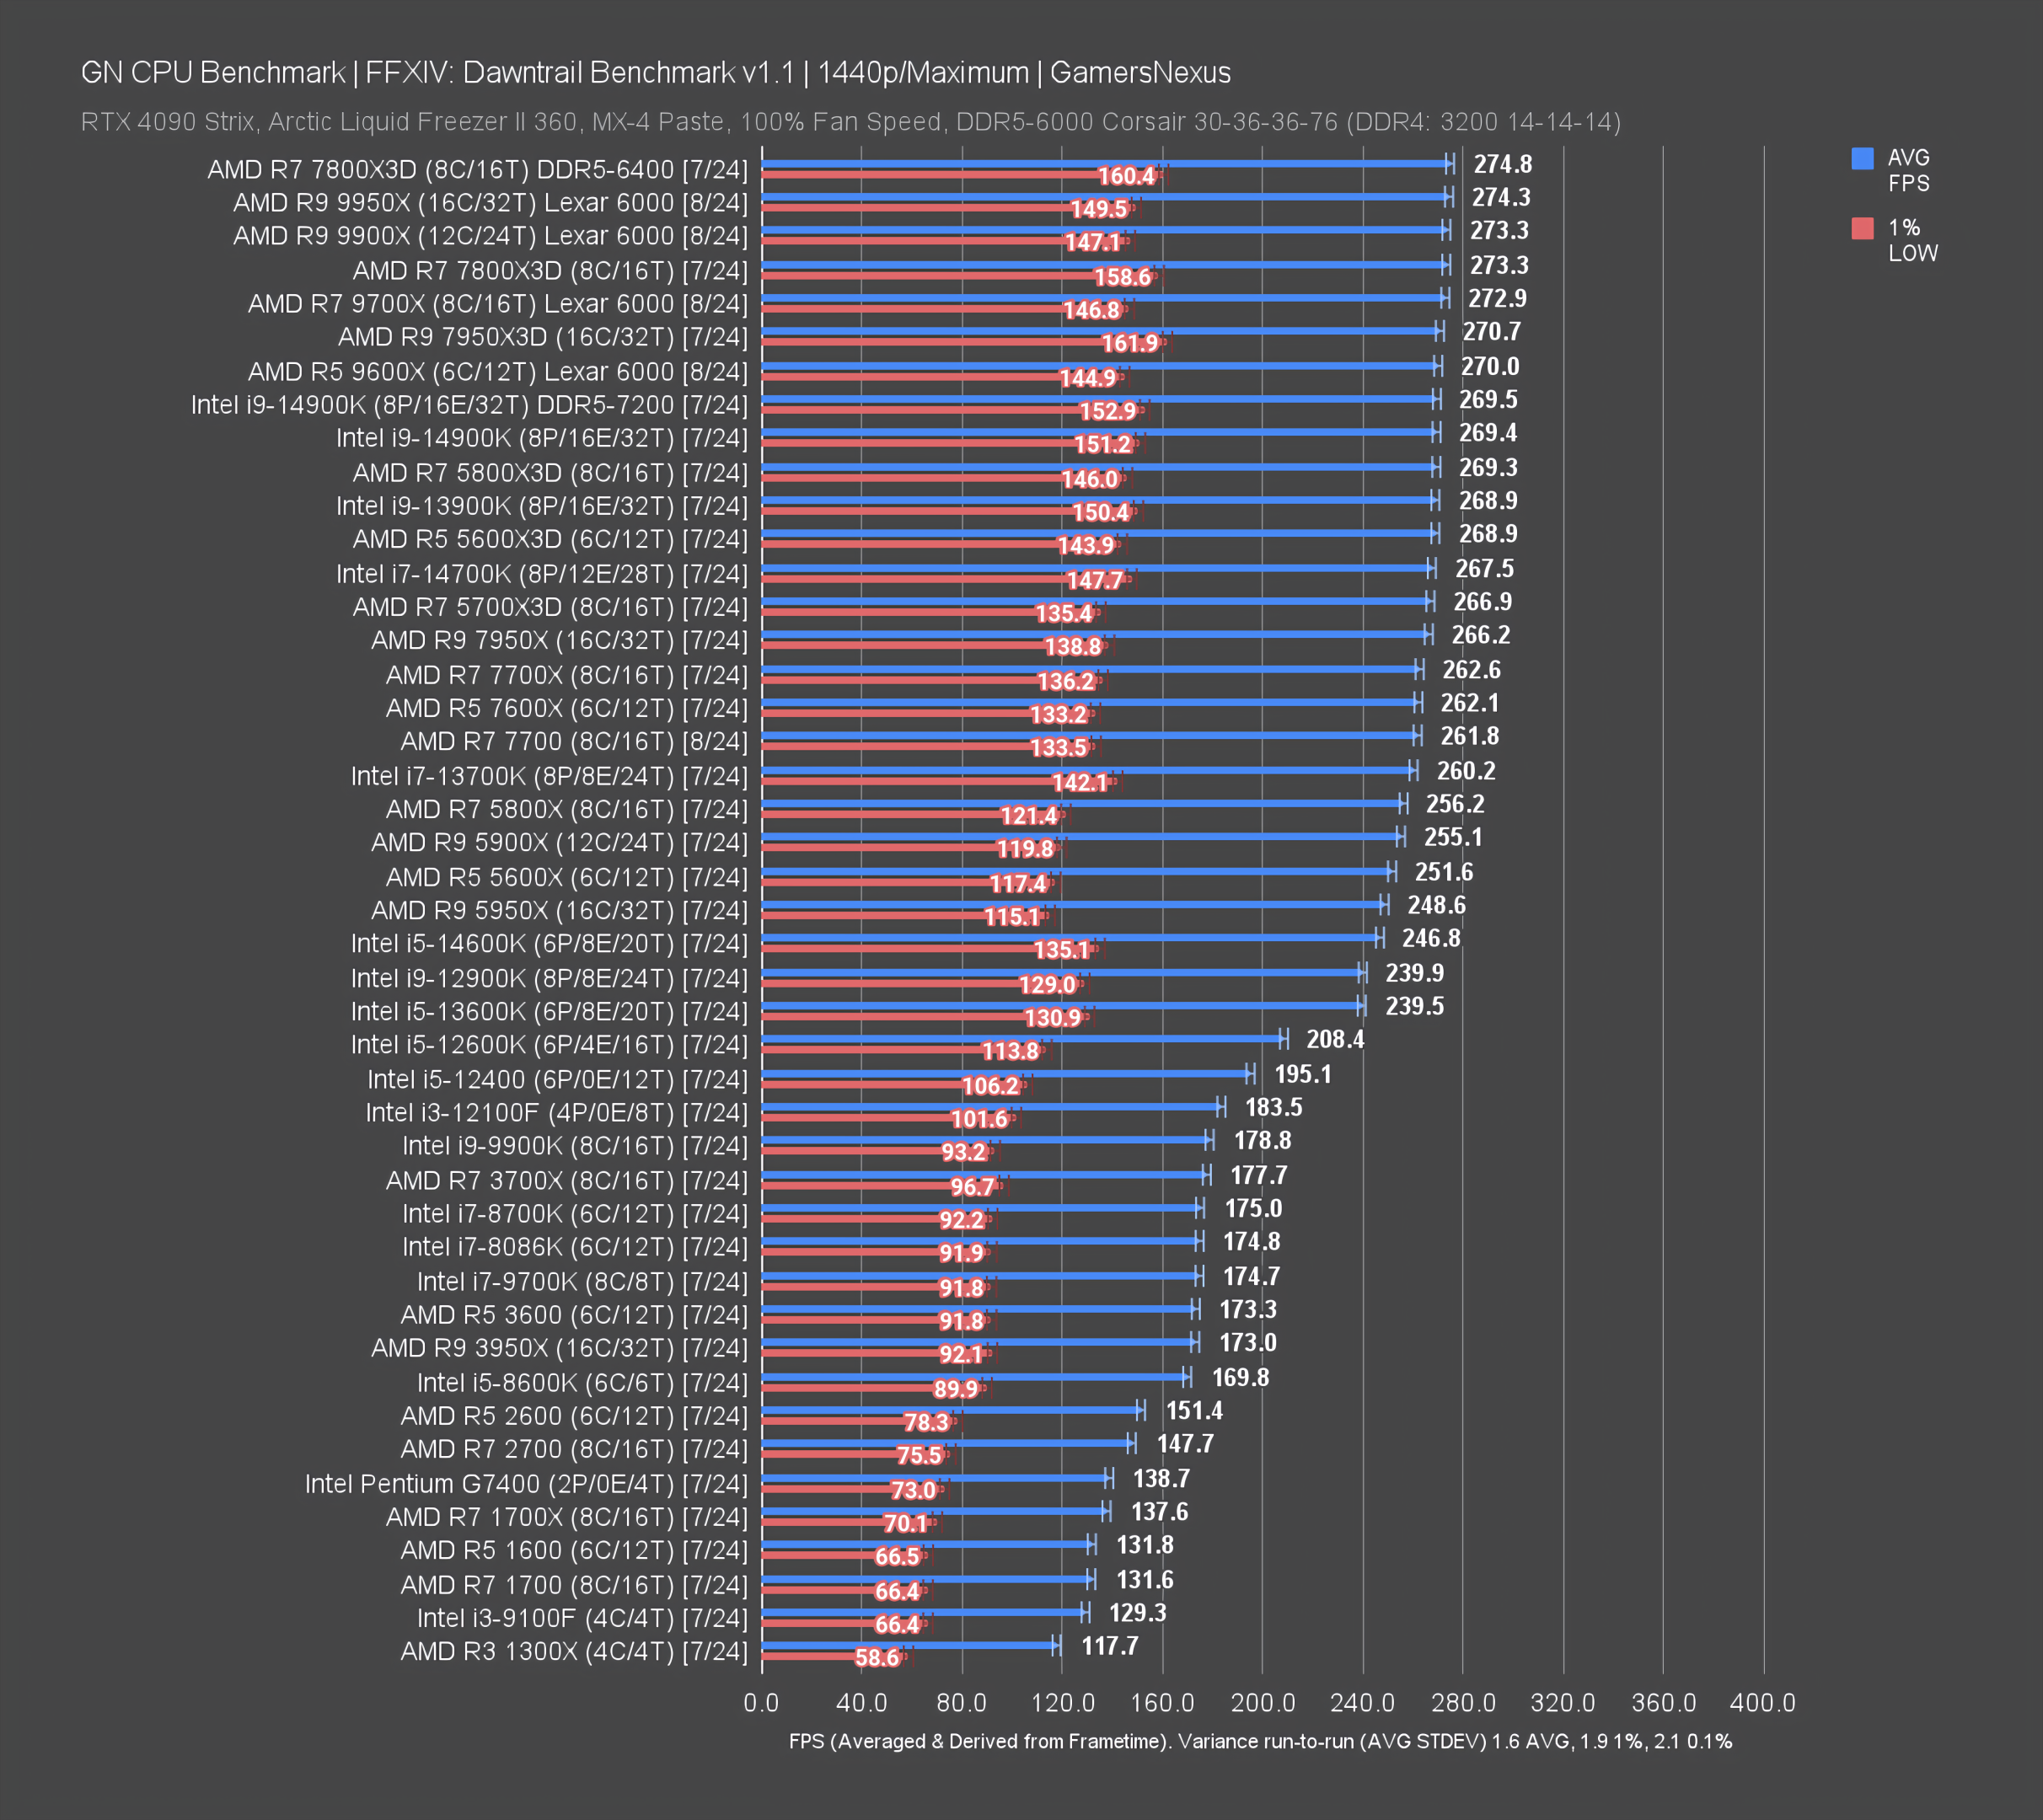
This set of 1080p & 1440p charts is for Final Fantasy XIV: Dawntrail, tested at Maximum quality settings.
Rainbow Six Siege CPU Benchmarks

Rainbow Six Siege is a problematic benchmark as it updates frequently, causing entire wipes of our dataset. This is a list of results that were all run on the same game version. Unfortunately, we don’t have as much data for it as a result of the regular wipeout.
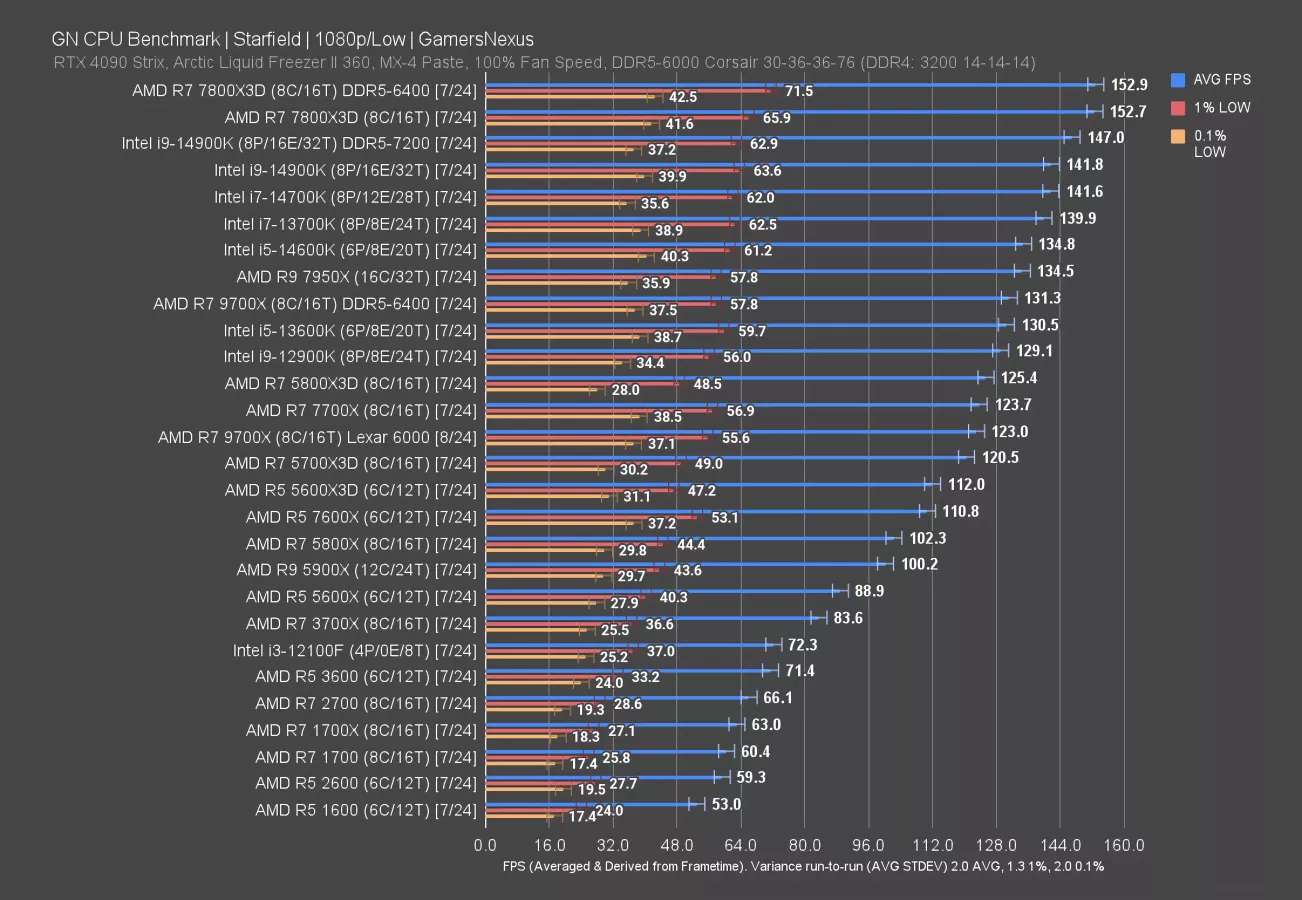
Starfield CPU Comparison

This chart is for Bethesda’s Starfield at 1080p/Low. Despite the game’s memeable launch, it remains a useful benchmark for CPU performance comparisons.
Total War: Warhammer III CPU Benchmarks

This gives us a look at a Grand Strategy / Grand Campaign Total War game, which tend to be CPU heavy. We’re using a battle for the benchmark.
Active CPU Benchmark Charts
ACTIVE DATA SET: AMD R9 9900X CPU Review

The below list of charts is our most heavily-vetted, most recently-published data set. Due to maintenance overhead and our focus on new content, we won’t updated it after every single review, but we will update this upload after major review cycles are fully complete. For example, if both AMD and Intel are launching CPUs across a 2-3 month spread, we’ll update this list at the end when we can breathe again.
These will lack some of the data found on the LTS charts; however, they may contain more recent data (such as newer CPUs).
There may be discrepancies between the LTS and Active charts. They are not necessarily comparable, and often are not. This is for reasons such as Windows version differences, game updates, and test platform changes.
Active Charts: Production
Rather than individually break them out into headings like above, we’ll just dump all the production charts below:
Active Charts: Gaming Benchmarks
And the same for gaming. You can find each game at the top of the chart:
CPUs Present on These Charts & Their Reviews
This table includes a simplified list of all CPUs on these charts, including links to the original GN reviews where present. Be advised that CPUs often have several follow-up pieces of content in rapid succession as the landscape changes. To keep things simple, we’ll just link the original reviews. You can still find the follow-ups on the channel.
Update Log
The below is an update log of changes to this page. The format is MM/DD/YYYY:
- 10/13/2024: Created page with initial dataset following Zen 5 reviews and preceding Arrow Lake reviews
Update process / house cleaning (externally visible, but used internally):
- Apply changes
- Append to update log
- Modify "Data Set" for both LTS and Active charts to identify the replacement dataset
- Modify current recommendations at the top of the page
- Append table of tested CPUs
- Update to link the latest Best CPUs article