Intel’s 8600K CPU changes the story significantly for the company’s i5 lineup. When AMD’s R5 CPUs launched, we noted that the i5-7600K 4C/4T CPU had a “fading grasp,” highlighting that the R5 1600(X) achieved close enough gaming performance while offering greater versatility. The gap between an R7 and i7 remained much more significant – enough that we could, and do, still recommend an i7 for some workloads – but the R5 and i5 distance grew closer, and so the R5s became easy to recommend. Now, with the i5-8600K, Intel moves its mid-range lineup to 6C/6T designs, maintains high clocks (higher, even), and potentially makes up for losses on the 4C units.
We just bought Intel’s i5-8600K CPU for $300, following high demand for a review, and ran it through the benchmark ringer. We’ve previously reviewed other Intel 8th Gen units, including the i7-8700K (review here), the i5-8400 (review here), and the i3-8350K (review here). This review looks at the Intel i5-8600K benchmark performance, including overclocking (to 5GHz), Blender, gaming, thermals, and power consumption.
For product pages, you can find everything here:
Overclocking
Our i5-8600K CPU was able to hit 5GHz core in our testing and, being a 6C i5, posted some interesting benchmark numbers when compared to the i7-8700K; unfortunately, both are either expensive or difficult to get right now, depending on your region and which CPU is of interest. The two are the best pairings for the motherboard market, being limited to just the unlocked Z370 chipset, but future B360 and H-series boards will give the i5-8400 a new value argument.
These K-SKUs, as always, should only really be used with Z-series motherboards – that’ll permit overclocking, and will enable the primary reason for the suffixed K parts to exist. We’re still running our Z370 CPU tests on the Gigabyte Ultra Gaming motherboard and, due to some Vdroop, we’re using load-line calibration set to the second-highest setting (High) to stabilize voltage supply. Our 8600K was able to achieve 5.0GHz at 1.4Vcore, including stability in AVX workloads, and we think it’d be able to push 5.1GHz with some more effort (or a higher-end board). Ultimately, though, 5.0GHz is a good representation of what at least some consumers should be hitting. Remember that 5GHz is largely a nice number for psychological reasons, but that 4.9GHz is often more readily achieved and isn’t that behind in performance. In our case, we could achieve 4.9GHz with a lower Vcore, and thus would be able to drive down power consumption and heat generation by reducing the clock.
We’re going to get right into this review, as it’s now the fourth 8th Gen part that we’ve looked at.
Test Platform
All of the new (non-legacy) CPU tests were conducted with 3200MHz CL16 memory. A GeIL EVO X kit was used across the board, with some exceptions made for a GSkill RGB Trident Z kit that had been reconfigured to match the GeIL timings. We’ve also moved to a 1080 Ti FTW3 from the 1080 FTW1, making for a stark difference in GPU bottlenecking headroom between the legacy and new tests. Part of this means updating drivers to version 385.69, with Windows now updated to Creator’s Update (game mode disabled) for new CPU benchmarks and reviews. An EVGA SuperNOVA T2 1600W PSU was used as the primary power supply, with a Kraken X62 (max pump + fan speeds) used for the cooler on all benches.
Previous platform and test methodology information can be found in more recent CPU reviews, but we are updating in big ways for CL onward.
Continue to Page 2 for gaming benchmarks and results.
Total War: Warhammer – Intel i5-8600K vs. R5 1600(X), i7-8700K
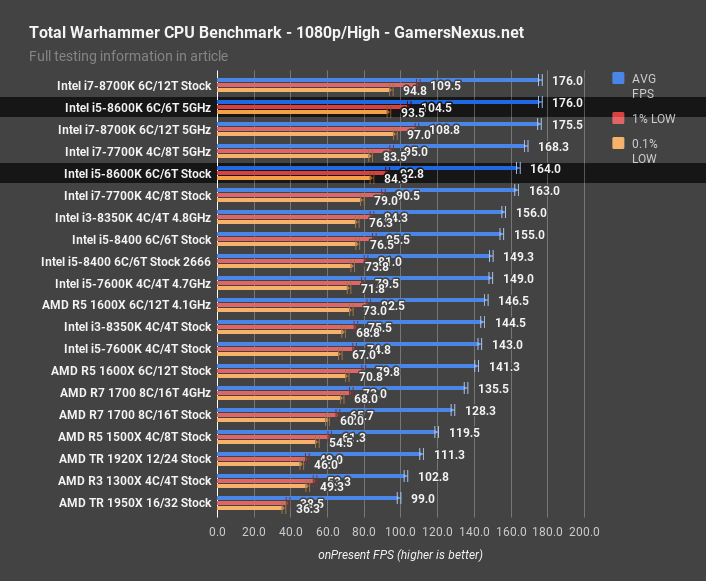
Total War: Warhammer at 1080p and high settings hits a GPU cap at around 176FPS AVG, which our overclocked i5-8600K bumps into, alongside the overclocked and stock 8700K. The stock 8600K, meanwhile, treads at 164FPS AVG, about at parity with the stock 7700K, and about 5.8% ahead of the 8400 with 3200MHz memory, or 9.8% ahead of the 2666MHz memory version. The R5 1600X plots a 147FPS AVG when overclocked to 4GHz, marking the 8600K stock CPU as 12% ahead, and the overclocked variant at least 20% ahead, before hitting the GPU wall.
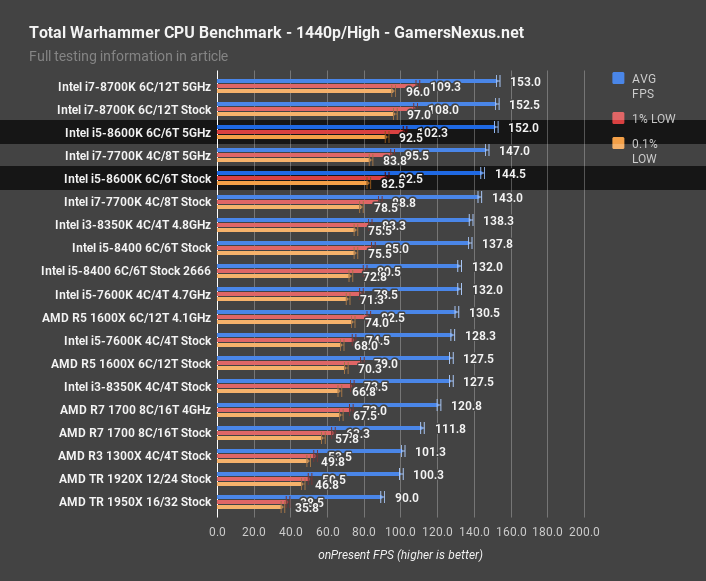
At 1440p, our top-end numbers are dragged down by further GPU limits, bringing scoring somewhat closer together – though the numbers don’t scale as perfectly as in some other titles, where we get identical framerates up until a GPU limit is hit. We’ll highlight the 8600K CPUs, the R5 1600X CPUs, and the 8700K CPUs.
Watch Dogs 2 CPU Benchmark – Intel i5-8600K vs. R5 1600X, i7-8700K
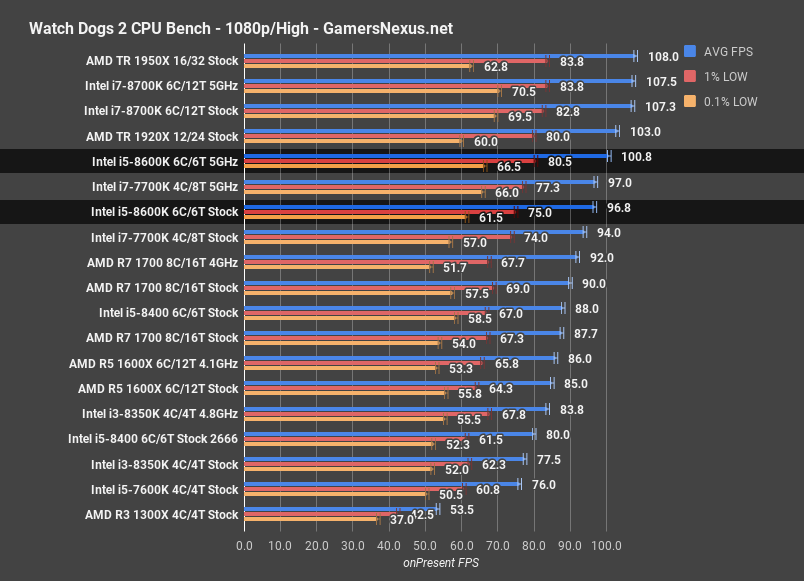
Watch Dogs 2 at 1080p and High settings has us at 97FPS AVG for the stock i5-8600K, which puts it effectively tied with the 5GHz i7-7700K, a 4C/8T CPU. The stock 7700K runs at 94FPS, placing our stock 8600K just ahead of that. As for the other 8th Gen i5, the i5-8400, that one’s at 88FPS AVG. This marks the i5-8600K as a clean 10% ahead of the 8400, or 27% of the Kaby Lake i5-7600K stock CPU. As for the R7 family, that’s represented by our R7 1700 CPU (which is also, at time of writing, presently on sale), a few FPS behind the 8600K stock CPU, and the R5 1600X 4.1GHz CPU at 86FPS AVG. The stock 8700K remains 11% ahead of the stock 8600K, with the OC vs. OC battle landing the 8700K OC at 6.7% ahead.
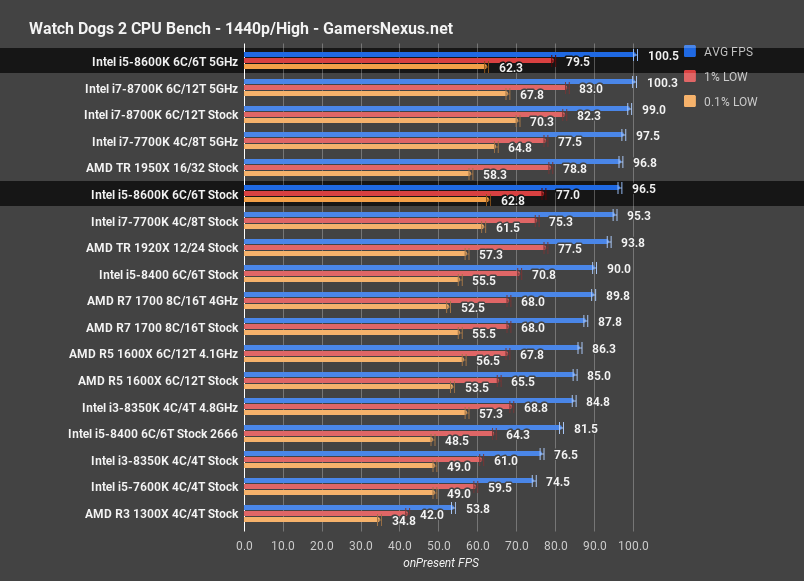
Moving to 1440p for Watch Dogs 2, the i5-8600K and i7-8700K are functionally tied at their 5GHz clocks, where we are either bumping against a GPU limitation or IPC limitation, and the 7700K at 5GHz isn’t far behind. The stock 8600K carries the same framerate as at 1080p, which is because it is still fully CPU-bound and doesn’t become GPU constrained until overclocked. Our scaling is mostly the same as previously, other than the changes at the top.
Destiny 2 CPU Benchmark – i5-8600K vs. i5-8400, 8700K, R7 1700
Destiny 2 doesn’t have all of the 8th Gen CPUs on it yet, and a few of the other CPUs are also still absent from this chart. Our initial Destiny 2 launch CPU benchmark is here.
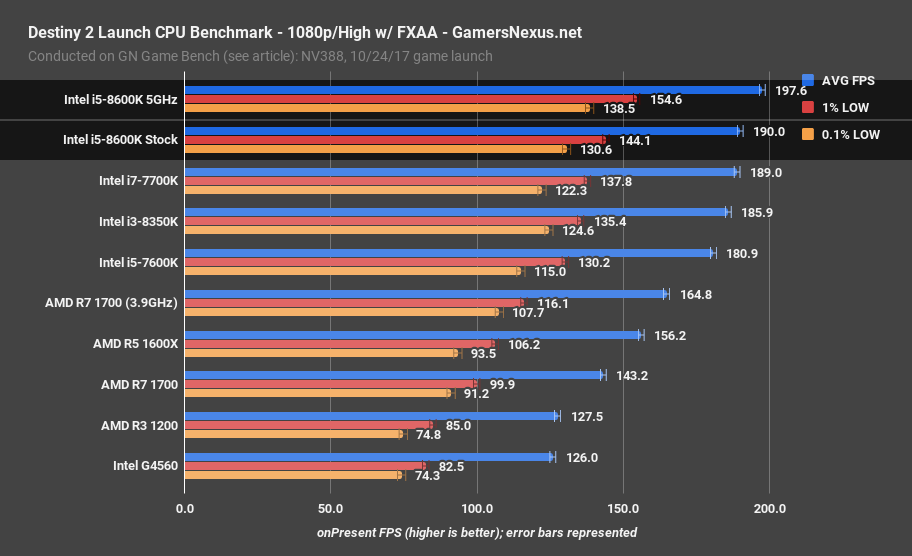
At 1080p/High, the i5-8600K overclocked CPU demonstrates the limitations of usefulness of Destiny 2 as a benchmark. The game caps at 200FPS, and so we’re right up against that – we actually don’t know the full framerate potential for the game, as it’s running against the limits as-is. The stock 8600K is at 190FPS AVG, still occasionally tipping into the 200FPS territory, and is tied with the stock 7700K. The i3-8350K CPU isn’t far behind. In our initial launch review of Destiny 2’s CPU performance, we noted that the game doesn’t much care for threads, and is almost entirely frequency-dependent. This is why AMD lags behind, and also why AMD’s CPUs all normalize at the same frequency. Take a look at the 1600X versus the overclocked 1700, which are closer in framerate than a stock 1700 and stock 1600X. The game also doesn’t seem to utilize SMT, which further contributes to the performance disparity.
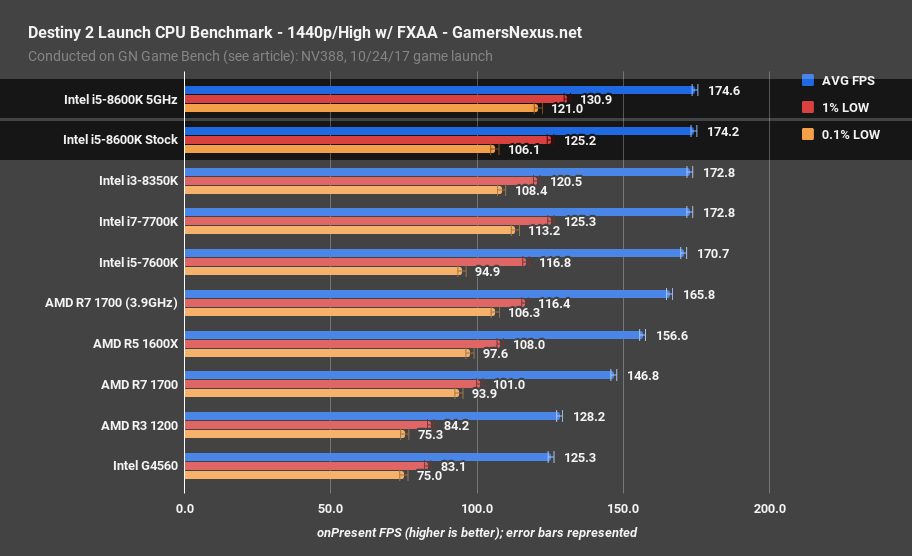
At 1440p/High, the stack remains similar, but we bump into GPU limits at the very top-end of the chart. The i5, i7, and i3 CPUs are all nearly equal in performance, with differences all within margin of test error and variance.
GTA V CPU Benchmark – i5-8600K vs. 8400, 8700K, 1700
GTA V is staying on our bench from popular demand, but it has a few quirks with it: One, when CPUs hit the 187.5FPS cap, the frametimes can encounter big stutters – we solved this by increasing CPU load with advanced settings. Two, AMD CPUs don’t particularly play well with GTA V, and have more exaggerated performance deltas than other games. In this way, both Intel and AMD have things working against them in GTA, and so it comes down to a matter of game-level optimization.
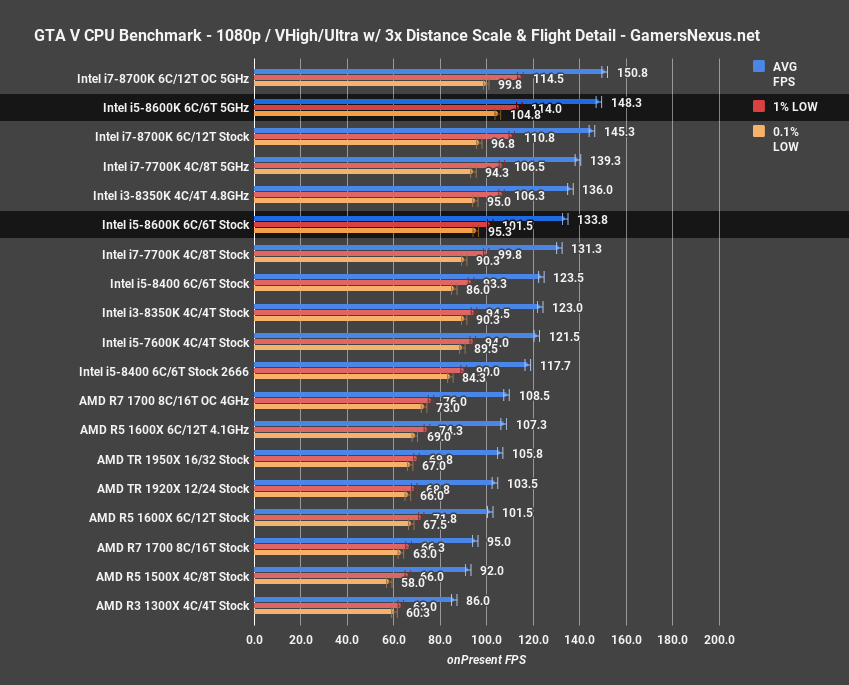
At 1080p, the i5-8600K stock CPU places just between the overclocked 8350K at 4.8GHz and the stock 7700K, running a 134FPS AVG. This marks it as 8.3% ahead of the i5-8400 CPU, and about 25% ahead of the overclocked 4.1GHz R5 1600X. The 8700K, expectedly, manages an 8.6% lead over the 8600K. Overclocking the 8600K allows it to nearly achieve parity with a similarly overclocked i7-8700K, both at around 148-150FPS AVG.
1440p has the stack largely the same, with the overclocked 8600K hitting the GPU limits, right alongside the overclocked 8700K at 5GHz. The stock 8600K is near them, roughly tied with the 4.8GHz Core i3-8350K. The stock 8600K is about 5.2% ahead of the stock 7600K.
Ashes of the Singularity Dx12 CPU Benchmark – i5-8600K
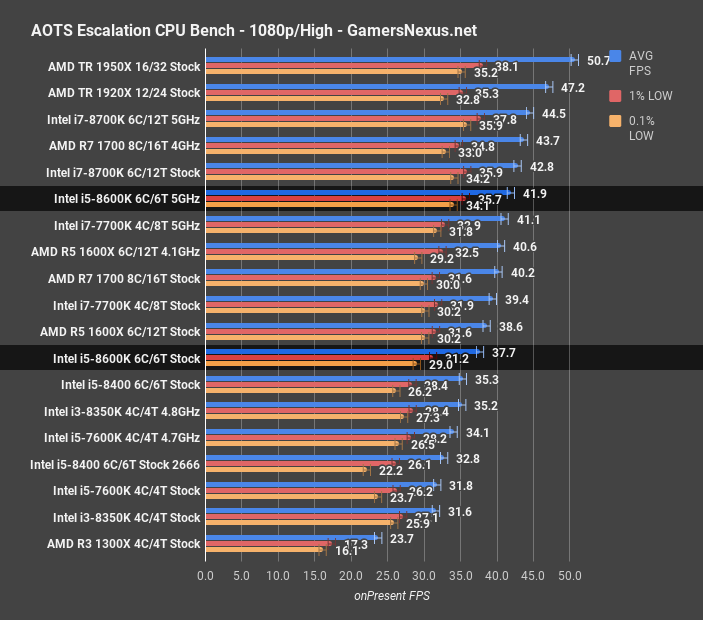
Ashes of the Singularity at 1080p/High has us at 37.7FPS AVG for the stock 8600K, about 6.8% ahead of the i5-8400, or about 18.6% ahead of the i5-7600K stock CPU. The stock 8600K also ends up just under the 1600X in Ashes, which is a heavily thread-dependent benchmark, with the 1600X about 2.4% ahead in performance. Overclocking the 8600K to 5GHz gets it up to about the same performance as the i7-7700K at 5GHz, and just behind the 8700K stock CPU. Again, because this is thread-dependent, the overclocked 8700K pulls away from the overclocked 8600K, with a difference of 6.2%, favoring the 8700K CPU. Threadripper is proof, if you needed more, that this particular benchmark actually utilizes its threads.
As for 1440p, all the results are the same, as this test is entirely CPU-bound with no GPU limitations in our benchmark, so no point in going through the numbers twice. Let’s move on.
Continue to the final page for Blender, Power, and the conclusion.
Blender CPU Benchmark – Intel i5-8600K Coffee Lake CPU
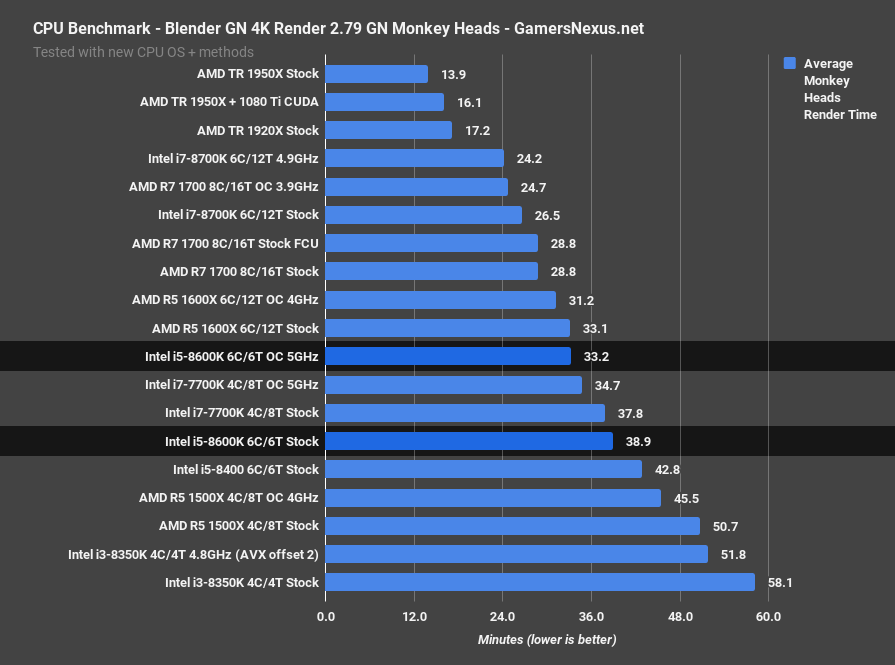
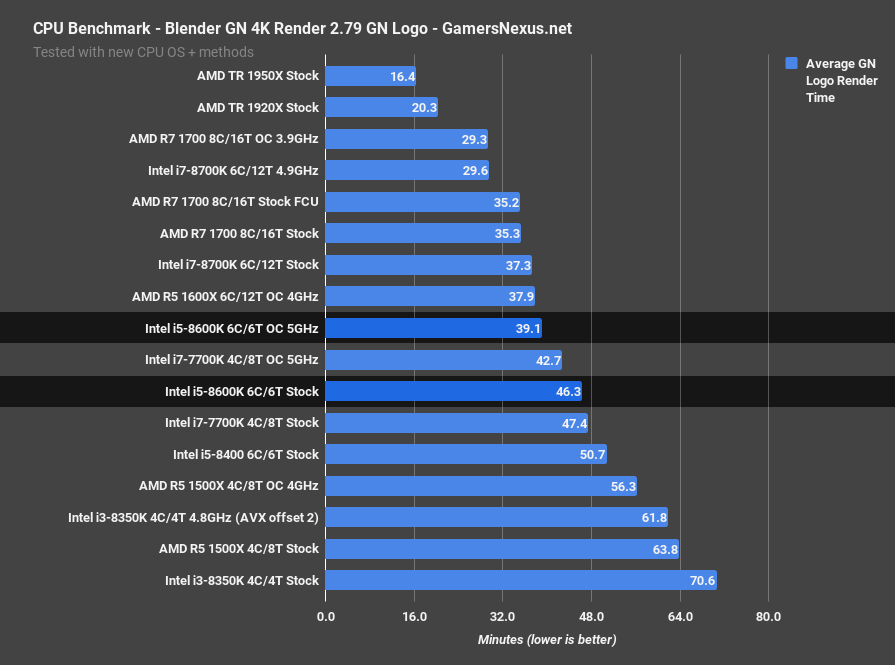
Some of our production and synthetic tests are next. This next benchmark is for Blender, a 3D animation and rendering application, for which we’re using version 2.79 and a few different scenes that we built or modified in-house. These tests are highly thread-intensive, and represent real-world rendering workloads.
Starting with our GN monkey head scene, the i5-8600K stock CPU completes the render in about 39 minutes, ranking it as offering a 9% time reduction versus the 8400, while the stock 8700K’s 26.5-minute render offers a 32% time reduction over the stock 8600K. Compared to Ryzen, particularly the R5 1600X stock CPU, the R5 completes the render in 33 minutes, offering a 15% time reduction over the 8600K stock CPU. Overclocking the i5 gets it nearly to parity with the 1600X, while overclocking the 1600X gets it another couple minutes ahead in time.
The next scene, our GN Logo render, puts the i5-8600K stock CPU at 46 minutes, which is again 8.7% reduced time from the 8400, while the overclocked 8600K sits a few minutes behind the overclocked 1600X. If you’re planning to do any kind of serious, repeat rendering or 3D work, we would push you toward either the R7 1700 and an overclock or to the 8700K, depending on other needs. If neither is in budget, the R5 is the best middle-step that exists for this kind of work, particularly the R5 1600 non-X, but with a 5-minute overclock.
Blender Power Consumption – i5-8600K vs. R5 1600X
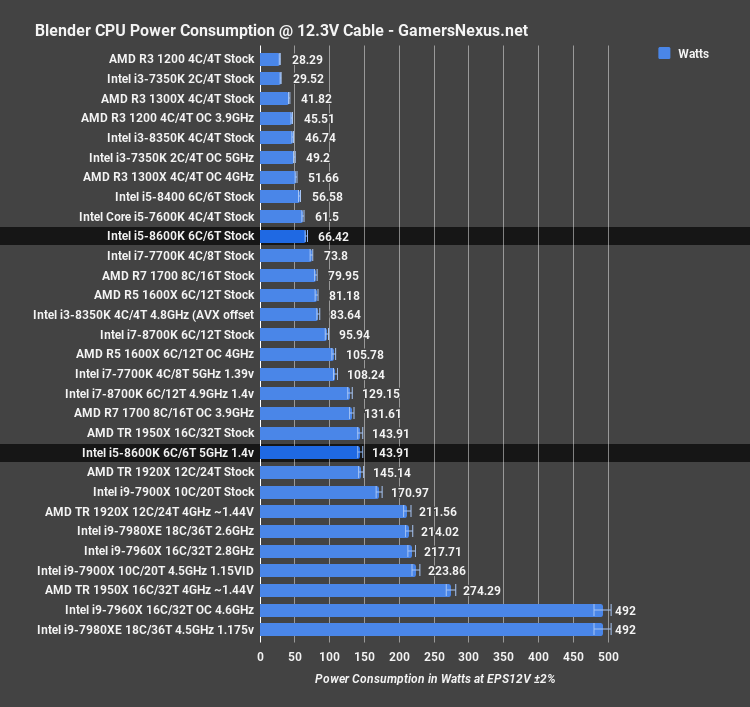
Let’s take a look at how Blender loads the CPUs. This chart is for power consumption while rendering, measured by clamping the EPS12V cables for direct CPU measurement. This is not measured at the wall – it is a proper CPU power consumption measurement, before VRM losses.
For Blender, we’re measuring the i5-8600K stock CPU at 66W down the rails, which is actually pretty competitive. The R5 1600X was running 81W, a 22% increase over the 8600K – but it also had an inversely proportional decrease in render time, so that’s not necessarily a negative. Overclocking power consumption will entirely depend on what voltage you need to keep it stable; for this AVX workload, we needed 1.4VCore with some LLC tuning, so our 8600K ended up at 144W power draw, equivalent to a stock 1950X – and the rendering performance disparity is several times improved on the 1950X. Intel’s Coffee Lake architecture doesn’t necessarily scale well in power consumption once you start pushing 5GHz. It’s sort of a psychologically nice number to hit, 5.0, but dropping to 4.9 or 4.8 would reduce power consumption significantly in cases where a Vcore below 1.4 can be sustained. The overclocked R5 1600X, for comparison, is at 106W draw, making the overclocked 8600K consume 36% more power than the R5, while performing slightly behind.
3DMark FireStrike Score – i5-8600K & 5GHz Overclock
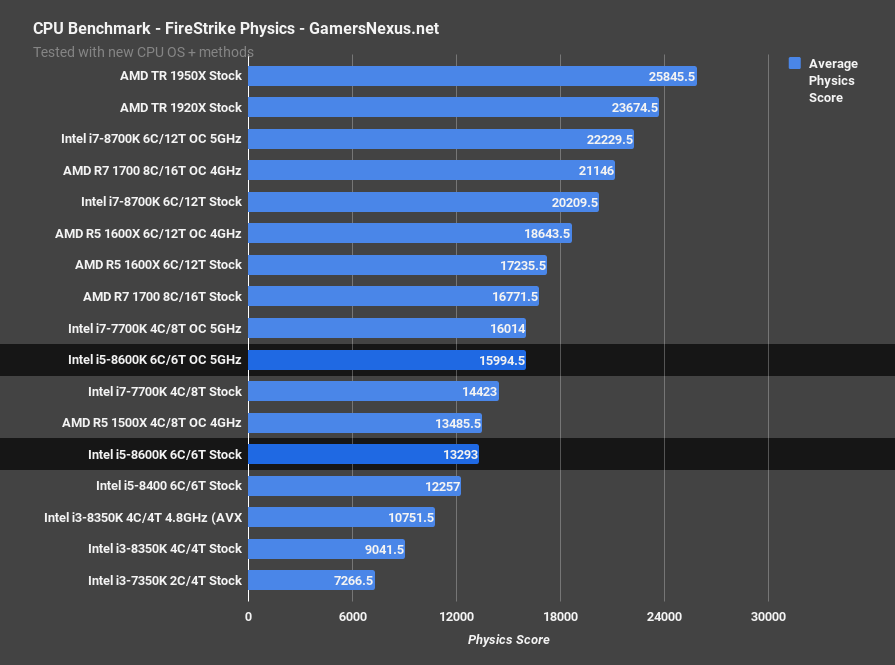
Running FireStrike, the 8600K manages a physics score of 13293 points, placing it ahead of the i5-8400 by about 8.5%, and just behind the overclocked R5 1500X and stock 7700K. The 8600K achieves parity with the 5GHz 7700K when both are overclocked. As expected, the overclocked 8700K pushes us 39% ahead of the overclocked 8600K.
3DMark FireStrike Power – i5-8600K
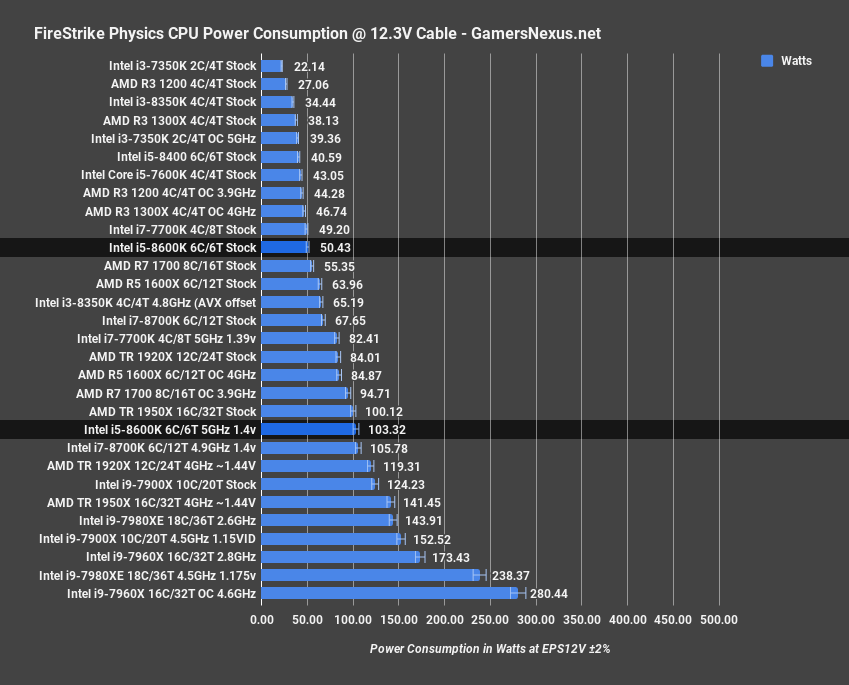
As for power consumption required to drive these scores, the 8600K draws about 50W stock, or double that – 103W – when overclocked at 1.4V. Again, a lower voltage and frequency would drop this. The overclocked 8700K draws about the same amount of power with a similar clock, but achieves 40% greater performance.
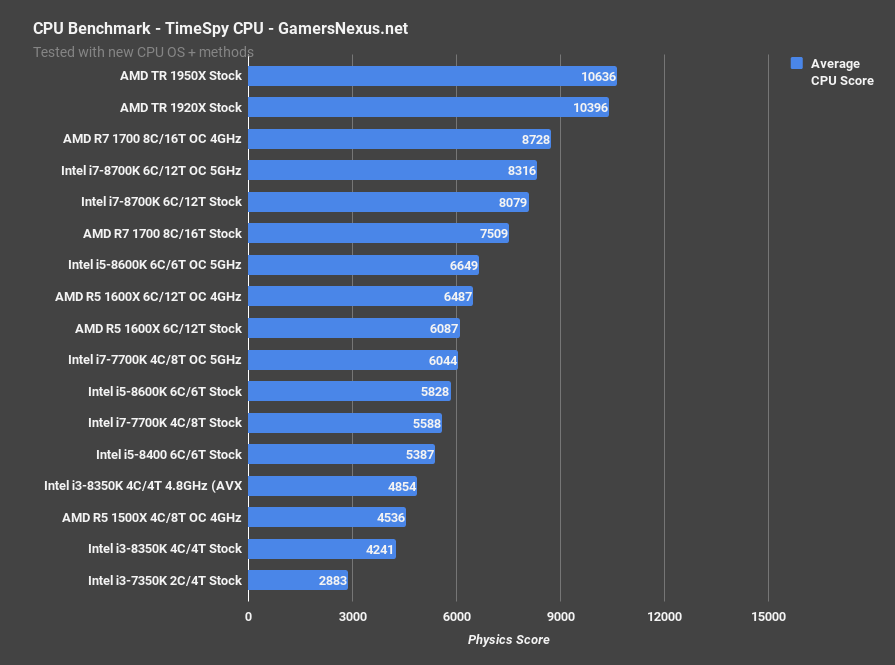
3DMark TimeSpy – i5-8600K
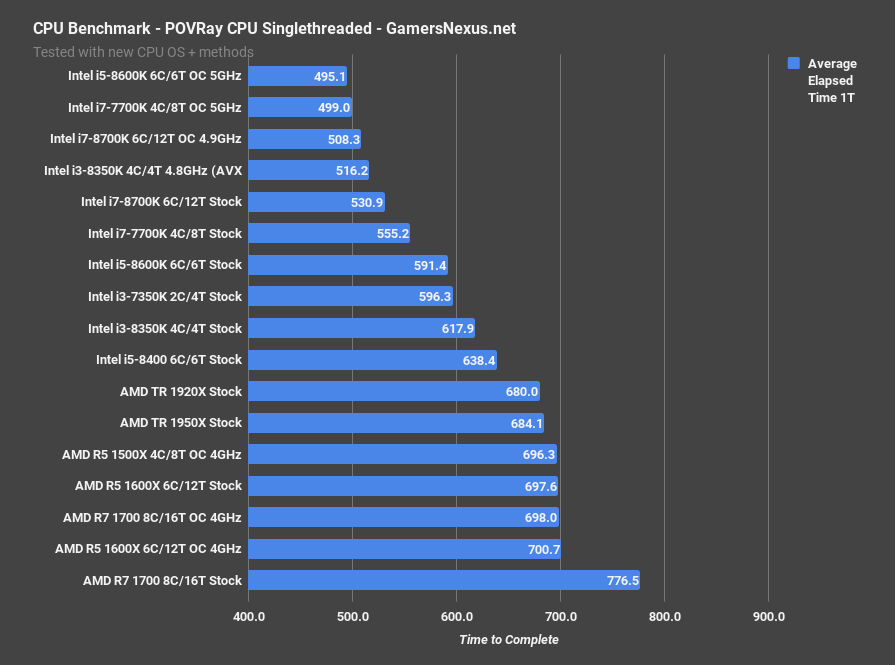
POVRay CPU Benchmark
Thermals – Intel i5-8600K Temperatures
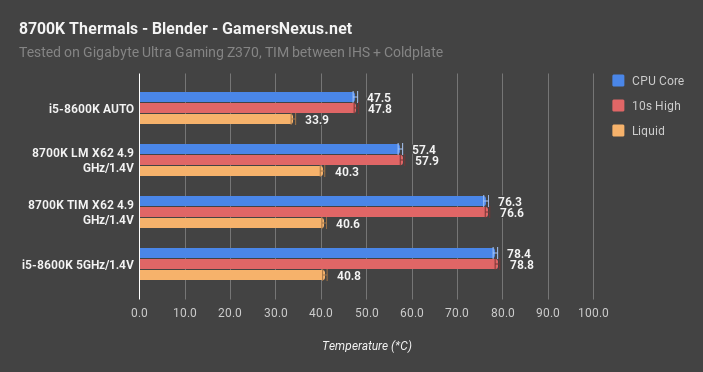
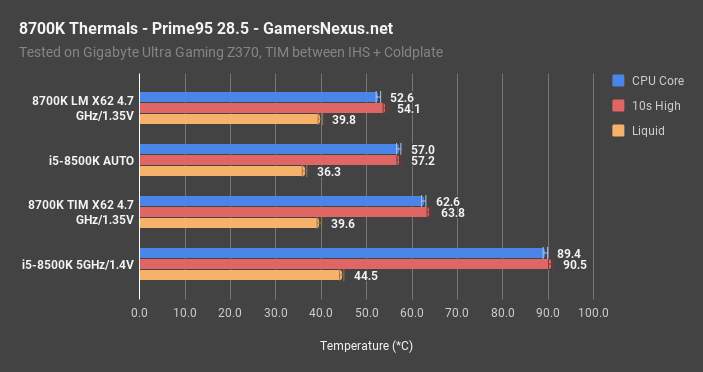
We’re keeping thermals short for the video, but you can find an extra chart or two in the article that’s linked below. Using our X62 at max speeds, as always, the 8700K and 8600K are the most directly comparable products: With a Blender workload and our max stable OC on each device – roughly 4.9-5.0GHz at 1.4VCore – the 8600K operates an average all-core temperature of about 47 degrees Celsius when left to auto. Overclocked, we end up about the same, once again. Liquid temperatures max-out at 40-41 degrees, reinforcing Intel’s use of upgraded TIM on Coffee Lake. As we understand it, the 8700K and 8600K use the same compound as the HCC CPUs from Skylake-X, which moved to a better TIM than the previous lower core-count CPUs. The 8600K isn’t too difficult to cool until running a Prime workload, which is comparable to Cinebench, while also overclocked. It is at this point that we near the 90s. Still operable, but pushing it. A delid certainly isn’t required on these CPUs, but would allow you to use a smaller cooler while achieving similar thermal results.
Conclusion: i5-8600K, 8700K, or AMD Ryzen?
The Intel i5-8600K is a return to an old argument. Before Ryzen’s launch, and before the i5-7600K, the fact was that most i5 CPUs were perfectly adequate for gaming, if not more than adequate. As the i5 lineup aged, though, a game would occasionally fall through the cracks for more frametime variance, and then the R5 lineup shipped. The AMD R5 CPUs were far more competitive with Intel than the R7 CPUs were, when considering same-cost gaming-targeted chips. For R5s, they kept up well enough with Intel in gaming and offered greater room for hobbyist production that, overall, the CPUs just made more sense than an i5.
Now, though, the i5s are giving AMD a fight. The i5-8400 would make more sense with a B360 or H-series motherboard, and so it sits this round out until more appropriate motherboard options ship. The i5-8600K, however, is fully overclockable and belongs on a Z370 board, even if one of the cheaper ones. The 8600K and 8400 alike reintroduce the “an i5 is fine for gaming” argument, but it is primarily in the context versus an i7 – just like it used to be, back when AMD couldn’t dream of competing (see: FX series).
And that has shaped up like this: An i5-8600K, for a person who is primarily playing games, is more than adequate when compared to an i7-8700K. In most instances, ignoring special use cases like livestreaming via H264, production tasks, or 144Hz framerates, an i7 would be excess spending. The i5-8600K’s high frequency and core count make it fully capable of gaming at its own similarly high framerates, and significantly more mobile and future-looking than the 7600K was.
That said, it’s also $300 today, at time of writing, and that means it’s not really competing with the R5 1600 – as names would suggest – but the R7 1700 (+ OC) CPUs. For gaming, sure, an 8600K is a great buy. The extra two cores help, but not enough to make up for deficit in things like Blender. A lot of people don’t use things like Blender, don’t do 3D modeling, don’t do rendering – those people can still look toward Intel, just note that we believe the 8600K should be closer to $200-$250, not $300. For folks who do intend to spend a reasonable amount of time doing workstation tasks, Ryzen still looks like the best value for that.
The 8600K is a superb overclocker, though, making it fun to play around with as an enthusiast. It’s also among the highest two performers on our gaming benchmarks, for which it deserves great credit. The i5-8400 or R5 1600(X) CPUs both offer potentially better value, diminishing returns considered versus spend, but it just depends on the price category of the build.
Editorial, Test Lead: Steve Burke
Testing: Patrick Lathan
Video: Andrew Coleman
