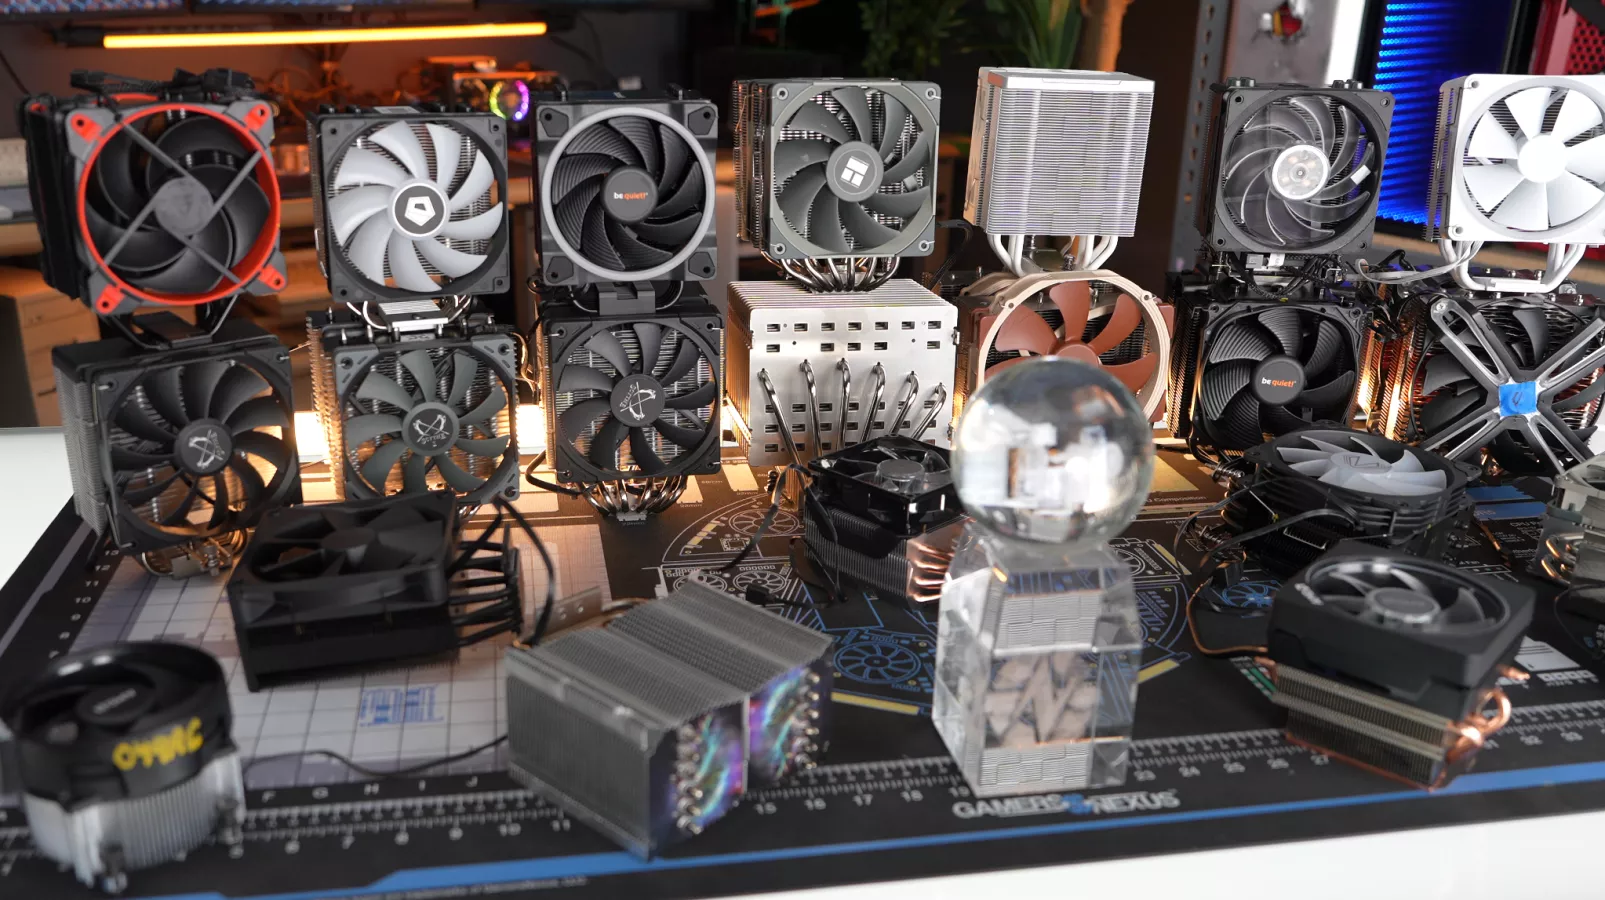
We've tested dozens of CPU coolers. These GN Mega Charts include our air vs. liquid benchmarks & more.
The Highlights
- The data on this page is intended as a long-term support / long-term reference dataset
- We will update this page a few times a year. The URL is permanent for our full cooler bench results
- This page will not cover pressure tests, installation, or mounting. We will only cover data. Check the reviews for more nuanced opinions or concerns
- This is a part of our Mega Charts series. You can check our Features page for more of these
- Please consider supporting this effort
Table of Contents
- AutoTOC

This is another of our GN Mega Charts series! You can find all Mega Charts on the Features page, such as our CPU power consumption mega charts.
This page will be regularly updated with the latest of our CPU cooler benchmark performance numbers, including links to CPU cooler reviews, comparisons against stock coolers (and discussion over whether it’s worth upgrading something like an AMD Wraith or Prism cooler), and more. The page will run on a slight latency from our latest reviews, but will be updated a few times a year with larger charts than you’ll find in those latest reviews. There are a few reasons for the truncated reviews charts, but the main one is simply legibility: Particularly in video format, it’s hard to fit much more than ~20 items (with 2-3 bars each) while still maintaining usefulness, like on mobile. The other is to focus the discussion or viewer in the short time a chart is on screen. This page doesn’t have those limitations.
We’d like our audience to think of these Mega Charts round-ups as an “LTS” (or Long-Term Support) version of our data. They don’t get updated constantly, but allow us to maintain publication of quick-reference material and a stable set of data. This is a permanent page. This URL will always contain the Mega Charts round-ups for coolers.
Credits
Test Lead, Testing, Writing
Steve Burke
Testing
Mike Gaglione
As a note, we’re currently working on revising our CPU cooler test methodology to move to a new platform. When we do and eventually update this page, we’ll probably split the sections into “chaptered” headers for old and new test benches. For now, all of this was conducted on the same bench.
Best CPU Coolers | Benchmarks Chart Gallery
There are important notes below this, but we’re going to provide all the charts right up front to make this as convenient and accessible as possible! If you want to learn about the methodological choices, the limitations, and the individual coolers (with links to their reviews), you can continue down past the charts gallery. We’re not yet sure how we’re going to change this Mega Charts page when we refresh our cooler benches soon, but we may end up keeping both sets of data here (with the 2019-2023 bench lower down and the new bench higher up).
In either event, you can find an update log at the bottom of the page. You can learn about our methodology here. Presenting the gallery first assumes some knowledge of the user. If you are unfamiliar with the nuances, we’ll provide some resources below it. Here it is!

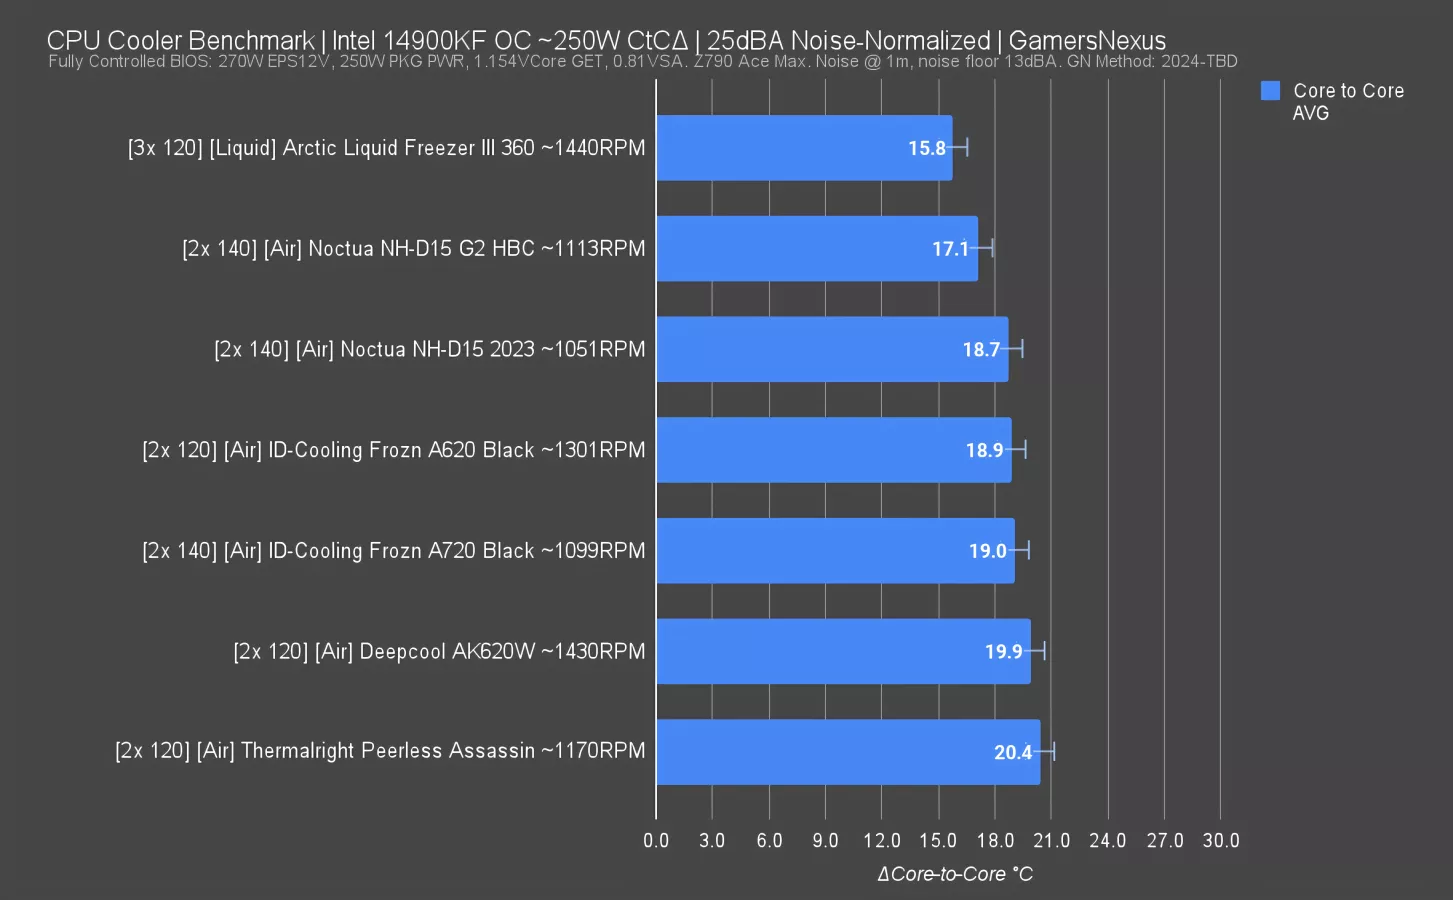
Intel 14900KF CPU Cooler Benchmarks
CPU Thermals: Intel 250W Noise-Normalized & 100% Fan Speed


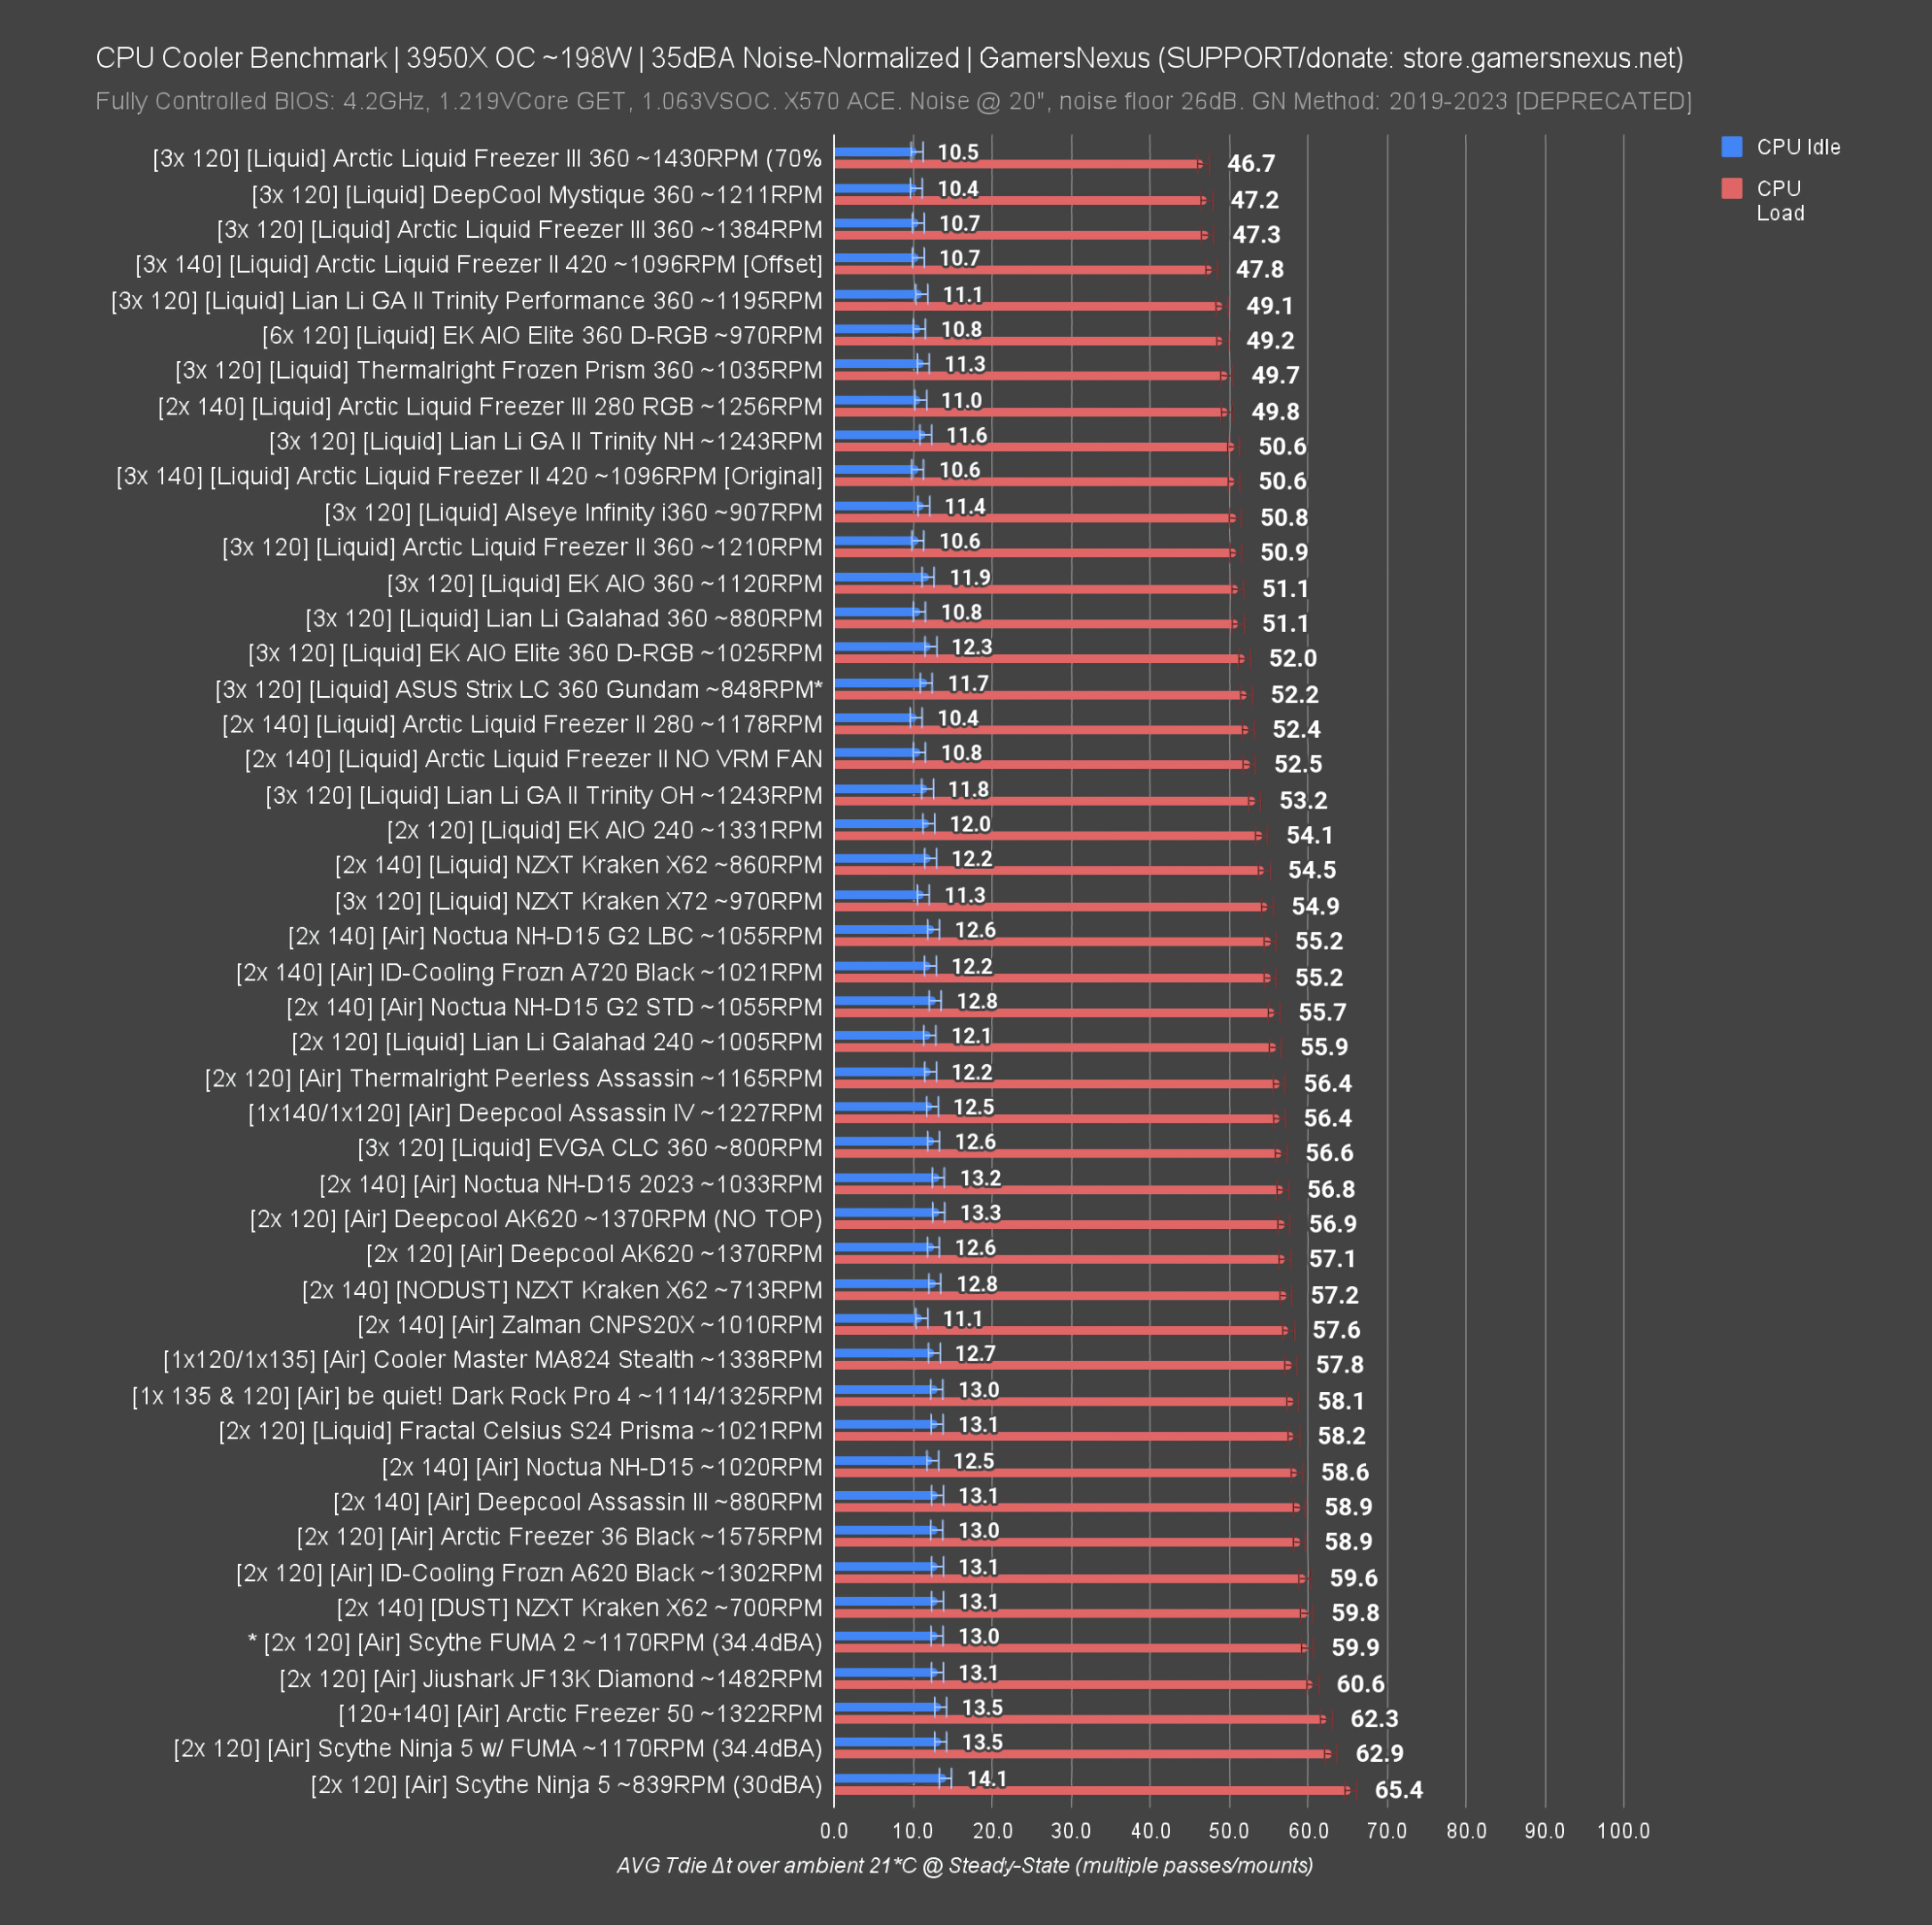
CPU Thermals: AMD 200W Noise-Normalized & 100% Fan Speed


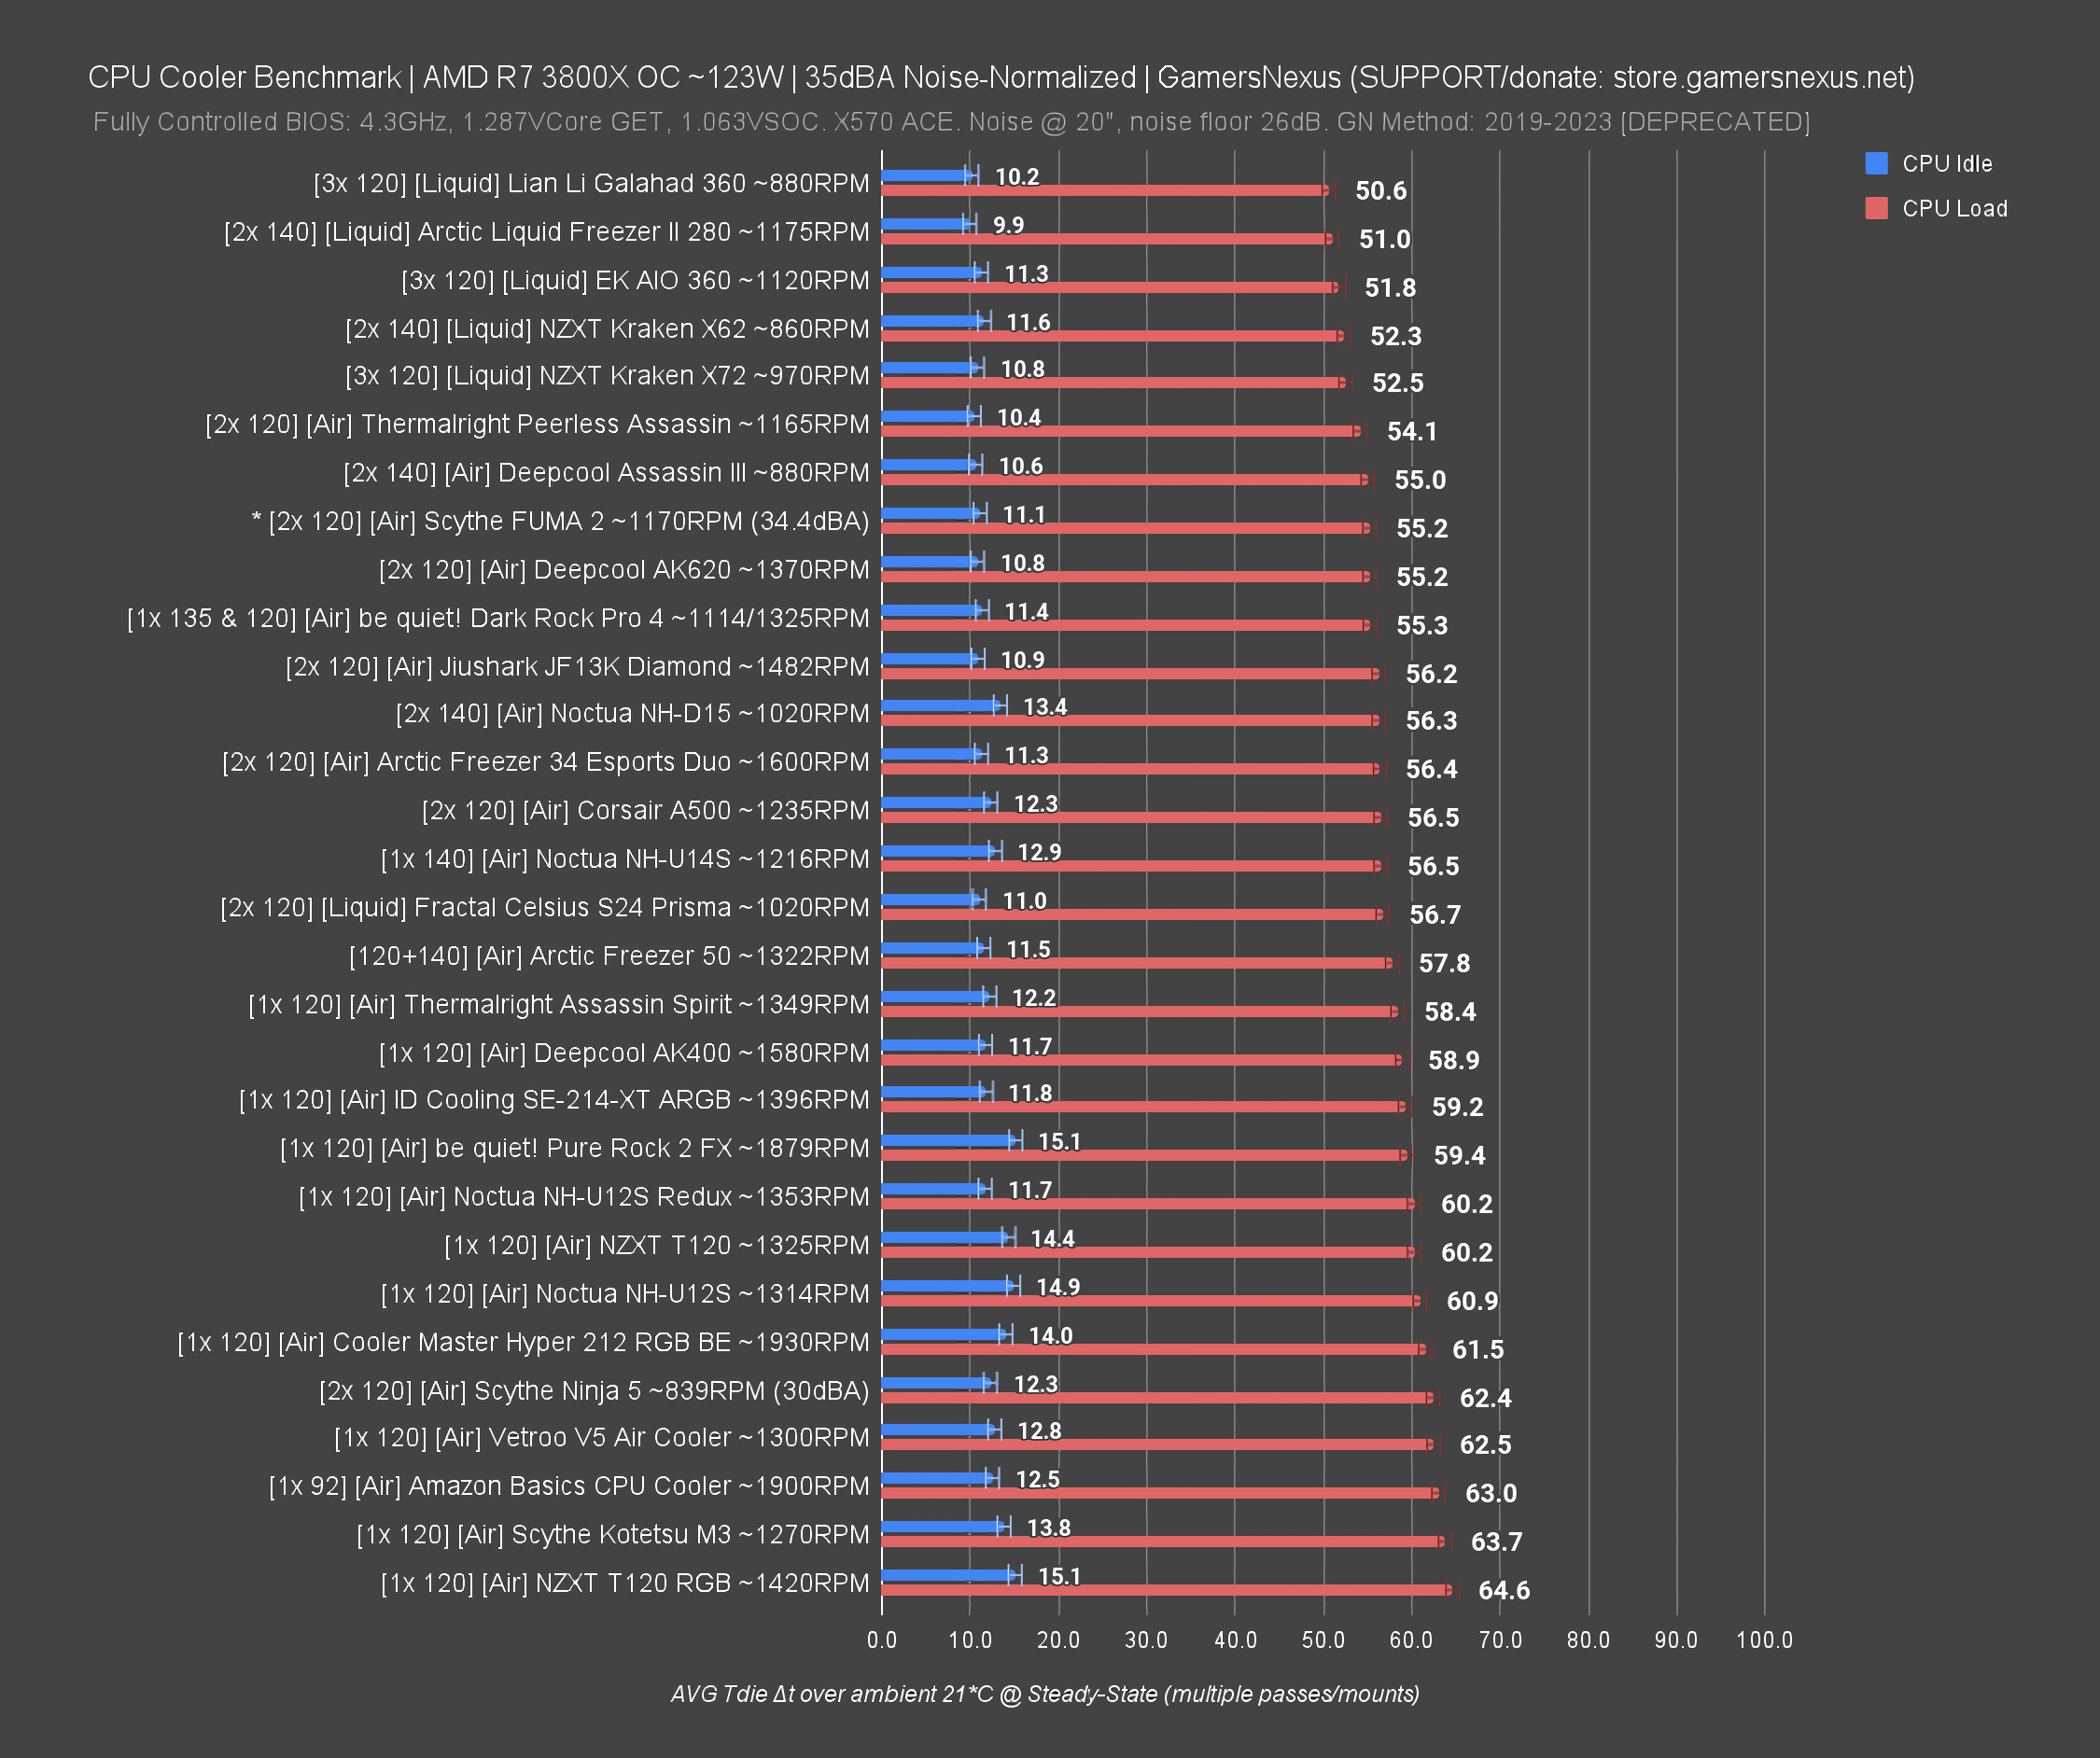
CPU Thermals: AMD 123W Noise-Normalized & 100% Fan Speed

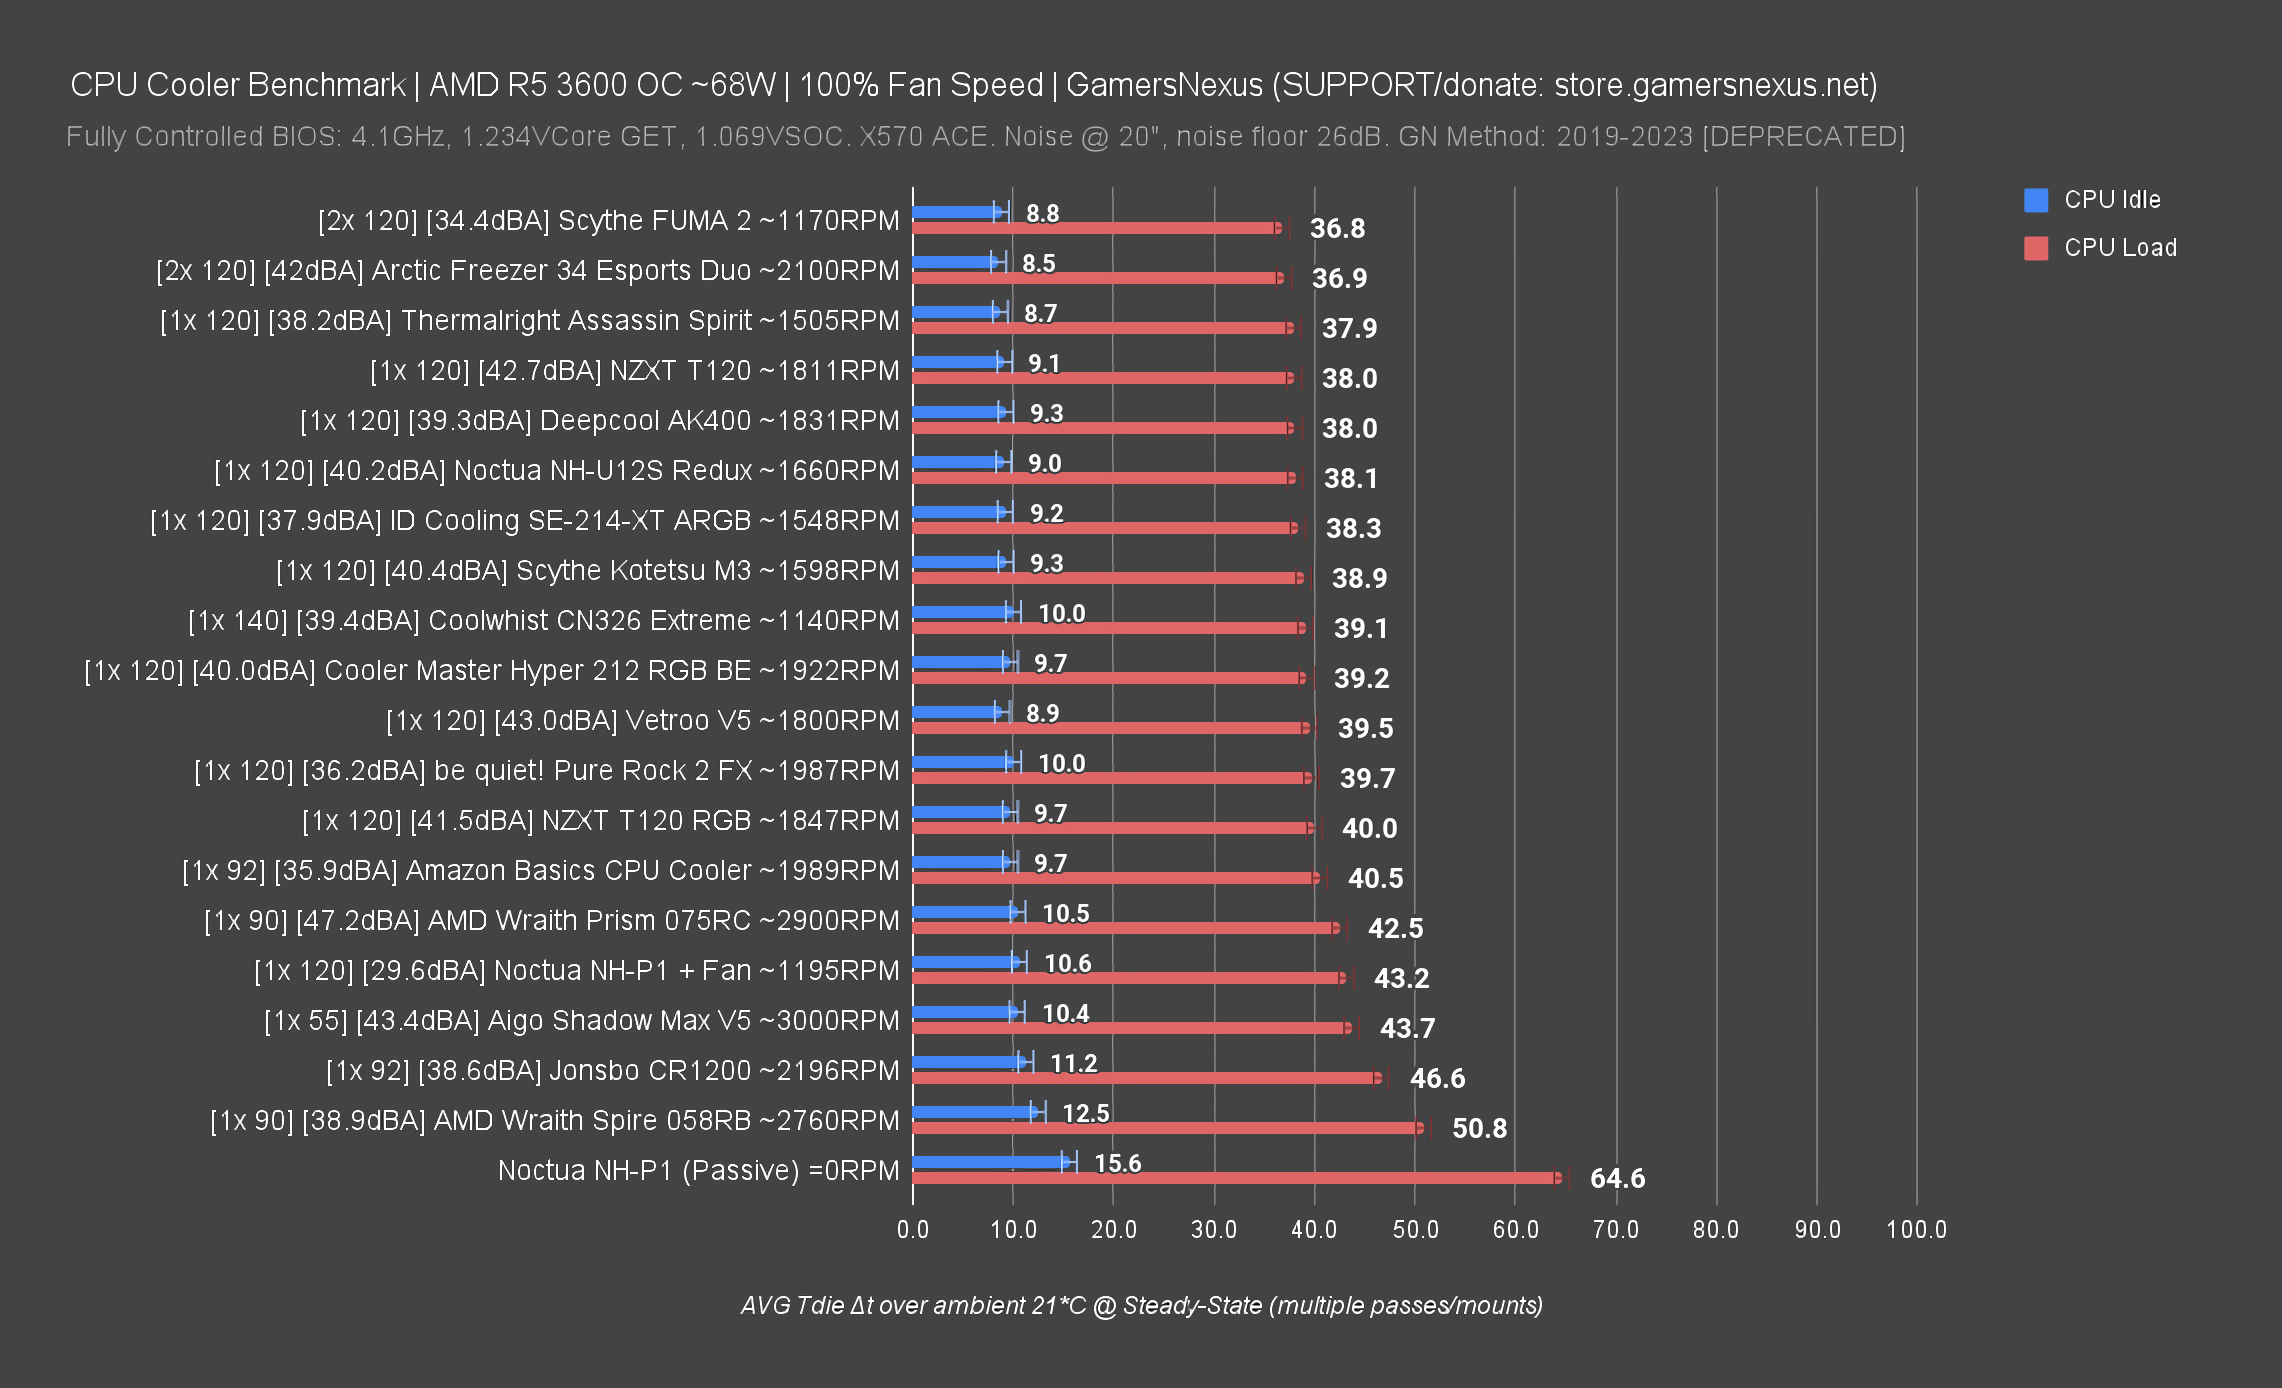
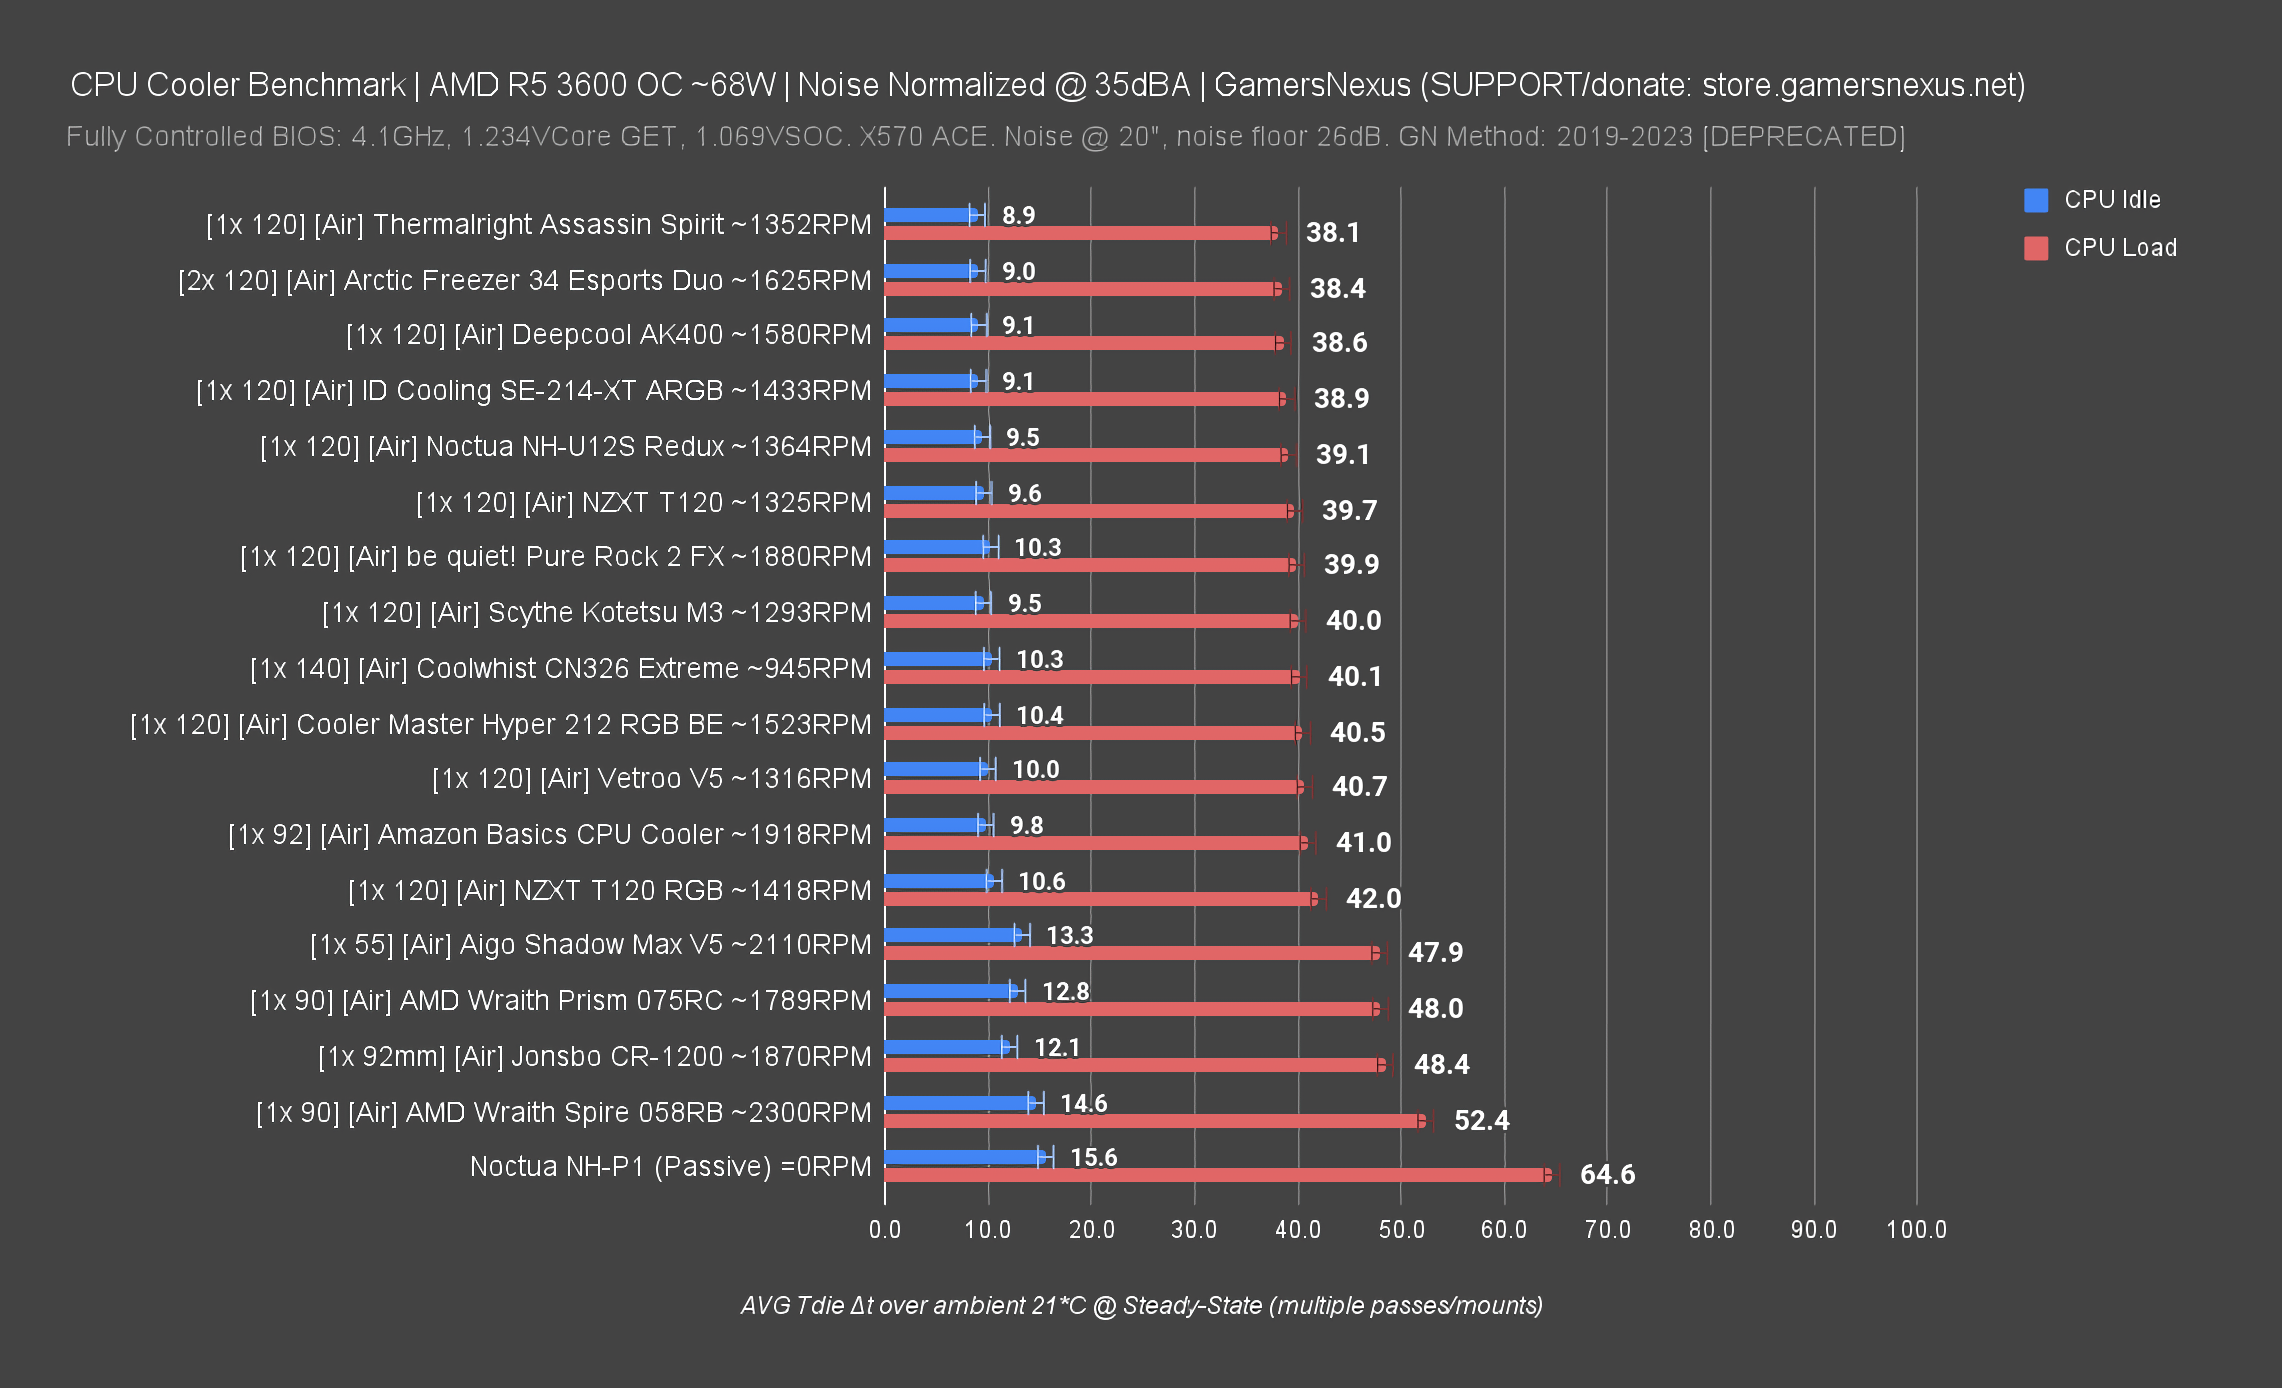
CPU Thermals: AMD 68W Noise-Normalized & 100% Fan Speed
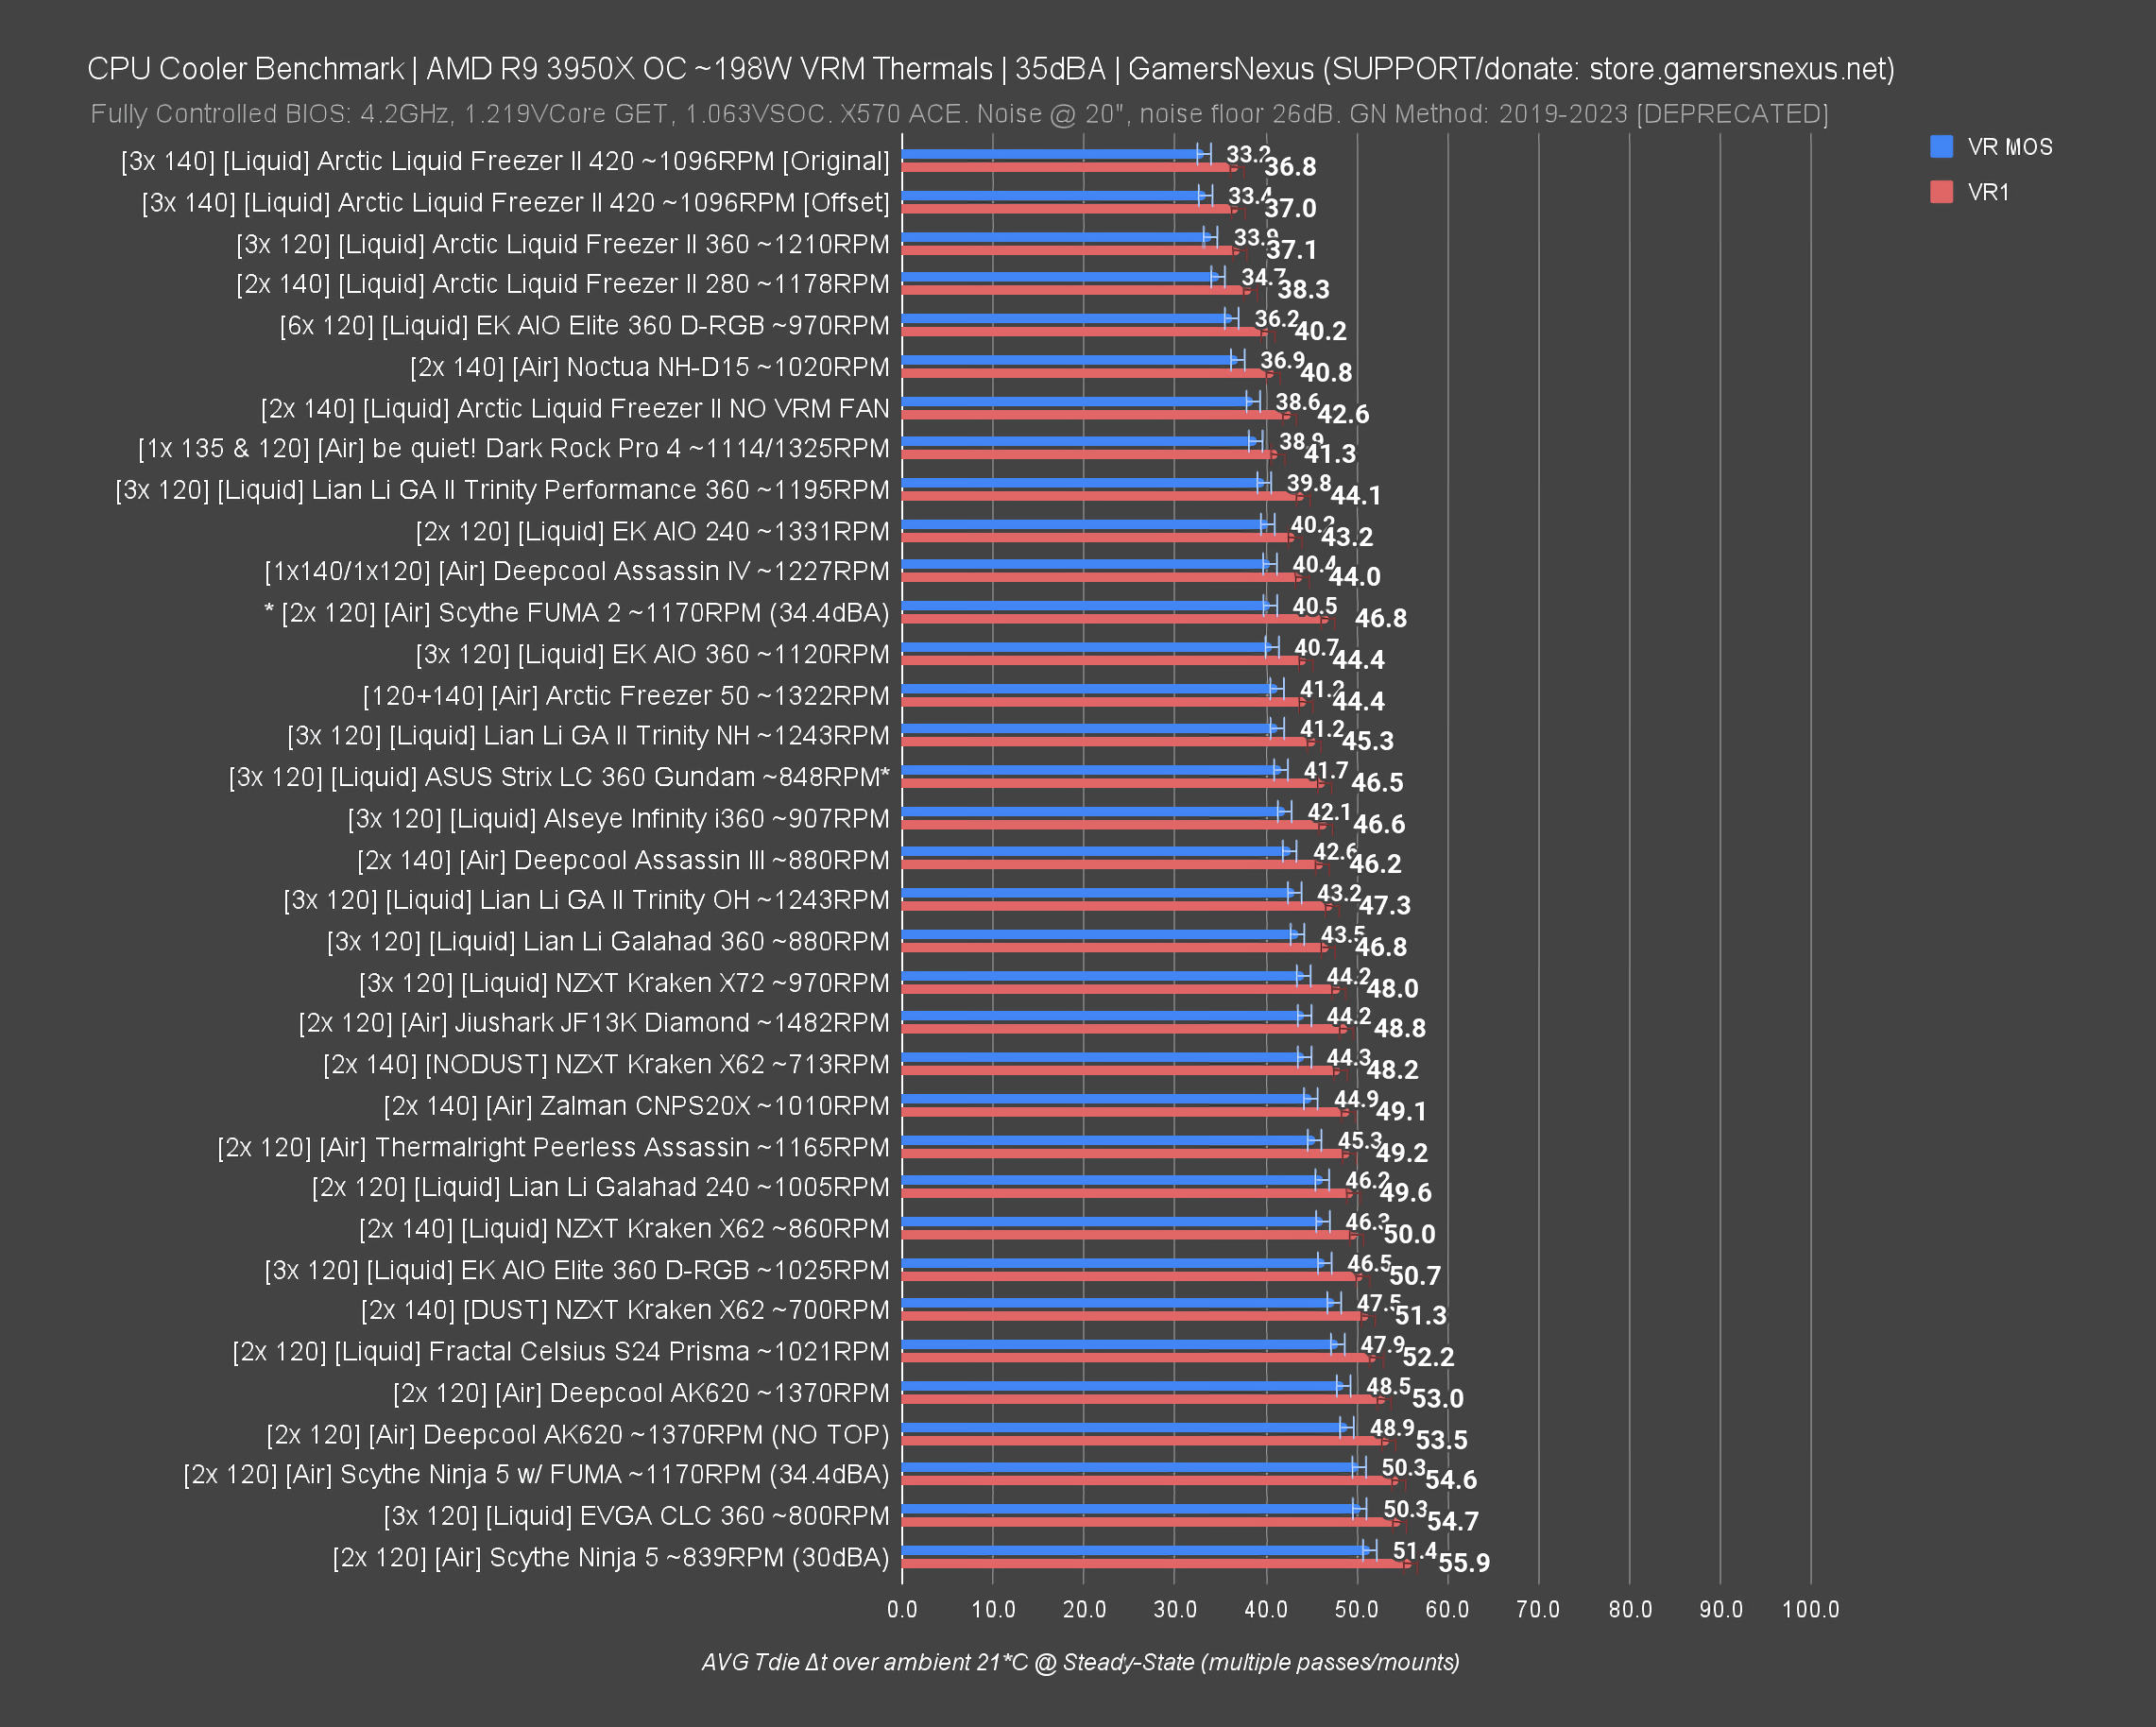
VRM Thermals: AMD 200W Noise-Normalized
There are some very specific notes for this one that we’d encourage you to read before going too far with this information. Those are below.
Using This Page
This page will contain all of the updated information, as explained above, as we continually roll-out reviews. The reviews will always contain the newest and freshest data, along with the analysis, but this page will serve as long-term reference material. This page will not contain individual cooler analysis. This page also won’t talk about mounting quality, installation, pressure maps (which are a major part of our reviews), or individual gripes, criticisms, or praise of coolers. Instead, it will be fully data-focused (again, sans pressure). If you identify a cooler you’re interested in on this page, we’d encourage you to check our review. Remember that good thermal performance does not necessarily mean it’s a good product.
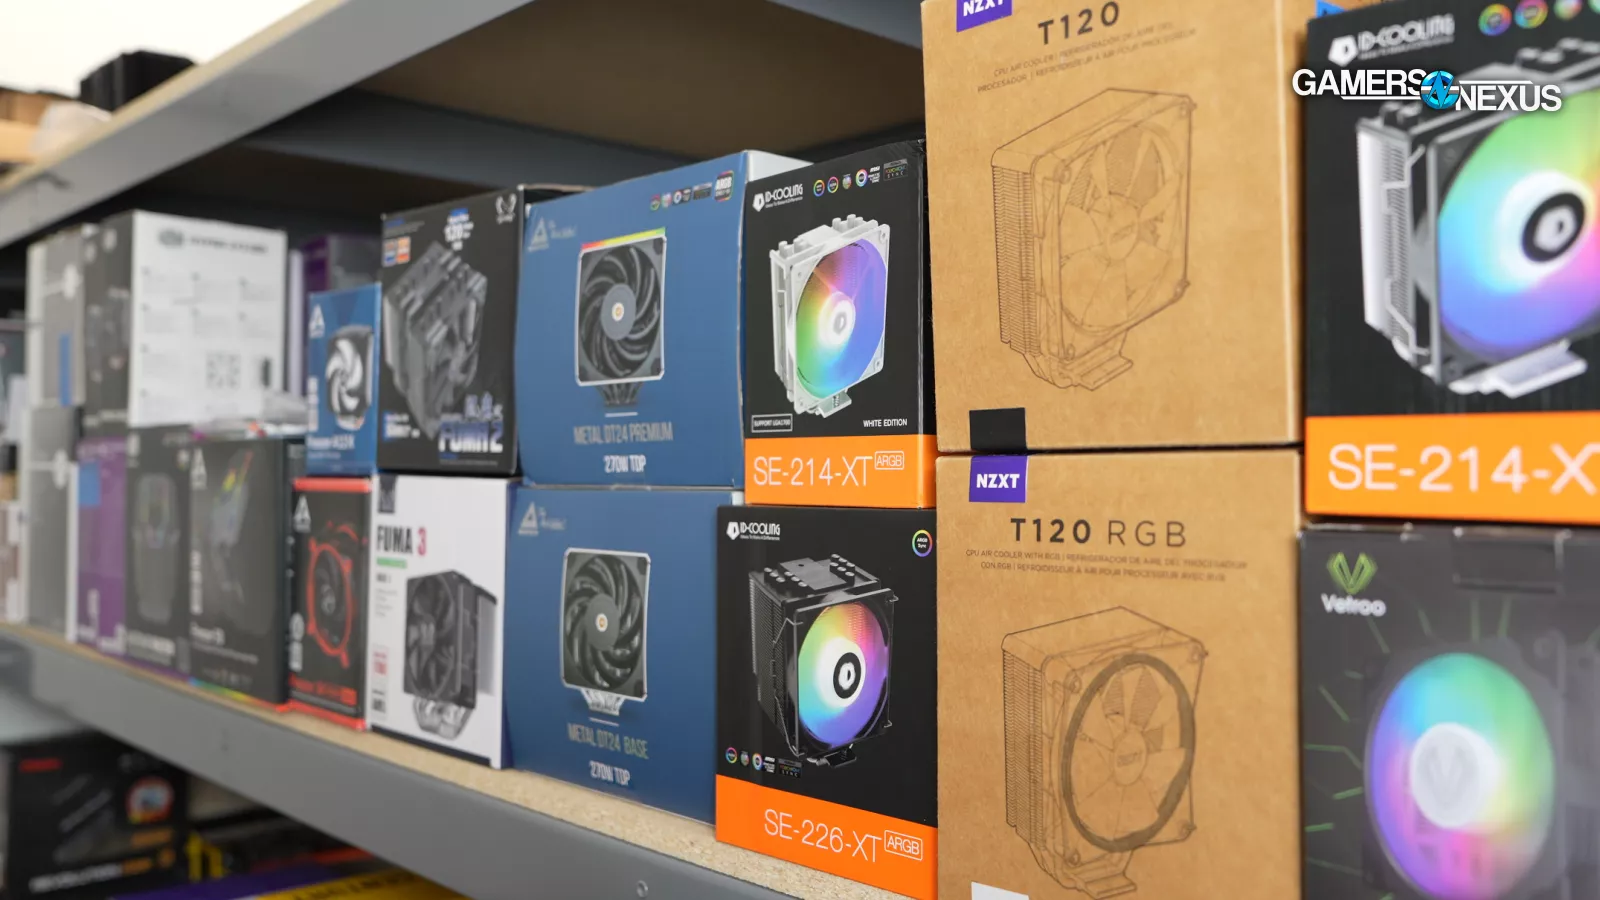
For coolers listed, you can Ctrl+F to find whether the one you’re interested in is included in any of these charts. We’ll have a table below that links to Amazon and Newegg pages for the coolers (with affiliate links) and links to the original reviews, if present.
Mega Charts pages should serve as bookmark-able reference material. The URL will remain the same, so save it for regular reference. An update log will be maintained at the bottom. As we are currently an ad-free website, we ask that if you find this page routinely useful and want to support our maintenance of it, that you please support our efforts. You can do this a few ways:
- Patreon: This is a monthly subscription of any amount to help fund our continued efforts
- Direct donation: This is a one-time, direct donation of any amount and will ensure we incur the lowest fees
- GN store purchase: This is the best way to support. You can get a PC building accessory or tool, a mouse mat, a t-shirt, glassware, or any other item you find useful while also supporting us
Testing Methodology
Results, as always, are fully dependent on methodology. One of the most often user errors we see is people saying “my CPU runs at 80 degrees,” then looking at a 60-degree result on our chart as a clear improvement. Keep in mind that unless everything is the same, they really can’t be compared this way. Thermals are one of the most isolated tests we run, and as opposed to a 3D Mark score, they cannot be compared cross-platform to yield any useful information. They can be compared intra-platform (as we’re doing here) to determine the most likely “best” CPU coolers, or to do tests like air vs. liquid coolers for PCs, and then you can use that information to apply to your build.
GN CPU Cooler Test Bench (2019/20-2023)
This is the bench we used for all of the testing shown here. The bench was built in ~2019 and fully publicly launched in 2020, following about 6 months of internal data validation.
| Part | Component | Provided By |
| CPU | AMD Ryzen 5 3600 - Used for lower ~68W heat loads for small coolers. AMD Ryzen 7 3800X (2 chiplets active) - Used in all cooler benchmarks. AMD Ryzen 9 3950X (3 chiplets active) - Used for higher heat loads to show scaling on big coolers. | AMD |
| Motherboard | MSI X570 MEG ACE | GN Purchase |
| RAM | GSkill Trident Z Royal DDR4-3600 CL16 | GSkill |
| GPU | EVGA NVIDIA GeForce GT 1030 SC (passive cooler, second slot down) | GN Purchase |
| PSU | EVGA 1600W P2 | EVGA |
| OS | Windows 10 | GN Purchase |
Platform Choice & Heat Loads
The heat loads represented in this testing include:
- ~190-200W
- ~123W
- ~68W
This was conducted on an AM4 platform with an X570 ACE motherboard that has now been in service for about 4 years. We’ve been impressed with its resilience to non-stop thermal stress. Given its survival, we’ll be using an X670 ACE board for our new AM5 benches.
Measurement & Environment
Again, this is described in detail in the methods piece. The basics are below:
Thermals: Thermals are measured with a mix of HWiNFO64 Engineering Edition and a thermocouple reader. We use a calibrated K-type thermocouple to monitor ambient temperature at the inlet of the CPU cooler, then subtract that from the averaged Tdie readings (at steady state) to produce a “Delta T over ambient” number. That’s what’s presented in the charts. We find that, within the small deviations in ambient air temperature in our test environment, this is functionally completely linear. If we see a +/- 0.5 degree Celsius fluctuation in the course of the test, this approach helps to smooth that change to isolate only the true impact to thermals from the CPU and the cooler. Testing is done in a 21C environment that is carefully controlled.
Flatness: With our original methodology, flatness is measured point-to-point with a precision needle instrument that measures the distance in microns from a known 0-point (calibrated annually with certification). The instrument allows us to measure the point-to-point deviations in surface flatness. A “flatter” surface, generally, is not inherently better; however, our test mostly looks for major craters or pitting in the surface of the coldplate. The best example of where we found an issue was in the Corsair A500 CPU cooler, which had some large gaps that caused it to actually sheer paper when mounted on top of a sheet of it.
Power: Power is arguably the most important aspect of cooler testing, as it’s what dictates the end result. We measure power into the EPS12V rails constantly throughout the test with a clamp. This is primarily for internal use so that we can ensure the bench is not drifting with time and that BIOS hasn’t applied some sort of unexpected voltage somewhere. EPS12V cable measurements allow us relatively ‘true to life’ measurement of the current, just with VRM efficiency losses included. One thing we’ve noticed is that power does drift with higher temperature “coolers” (technically, the CPU runs hotter, but that’s because of the cooler): In such instances, this is part of the test. We’ve found that there is typically a 4% reduction in power leakage for every 10-degree reduction from the cooler, although this isn’t a perfect science. For instance, one of our tests has a 48-degree result at 191W. Adjusting the fan speed to worsen the performance to ~65 degrees (over ambient for both) led to a 206W measurement, which is approximately a power reduction of about 7.28% for a ~17-degree reduction in performance.
Acoustics: With this older methodology, we were still using our room acoustic measurements. These are being retired as we replace them with our hemi-anechoic acoustics chamber, which was a ~$250,000 build project that we filmed. You should check it out! This methodology uses a room measurement in a ~26-27dBA noise floor at 20” measurement. The bench is fully passive other than the cooler.
Limitations
This testing, like all testing, has limitations. There are aspects of cooler performance not represented here, and likewise, some results could be more specific to the bench and methods used than other results. We always want our audience to be aware of the limitations of testing, as there is no such thing as a fully representative, perfect test, so it’s all about knowing how to leverage the information within the limits of its capabilities and usefulness.
Although much of this is discussed in our methodology piece, a few basics are below:
First, this testing was done on an AM4 platform. Generally speaking, methodologically, what matters most is the amount of power going into the chip and the heat load being tested. In theory, two parts that both draw 200W should have a somewhat familiar or largely similar hierarchical ranking of coolers. But this isn’t always that clean: A few of the biggest limitations are IHS shape and design, die or chiplet location, IHS size, and mounting hardware included with the cooler (for instance, if a manufacturer includes a to-spec kit for AMD, but an undertorqued spec for Intel).
One of the reasons we’ve moved on from our AM4 standardized cooler test platform and are working on rolling-out an AM5 + LGA1700 platform is to do with IHS curvature and shape. AMD’s IHS is relatively flat, all things considered, and Intel has a slight curvature to it. Intel also uses a more oblong design (in the LGA1700 generation), whereas AMD is generally square. One of these isn’t necessarily better than the other, but they can have an impact on cooler performance. In some cases, it’s a dramatic impact. In many, particularly with lower-end coolers, it’s not as noticeable since less engineering goes into matching the coldplate to the IHS. It’ll be double the work to test both AMD and Intel in the future, but doing so will account for any coolers that tune for IHS design.
In other words, while you can (generally speaking) assume the same or similar hierarchical ranking of “best” CPU coolers from these charts, you should also be mindful of differences in your intended use. If you intend to build an LGA 1700 system, then the ranking may be altered. Barring a major oversight by the cooler manufacturer (which, of course, is half of our job to look for -- hence adding both CPU types), good performance on AM4 should lead to good performance on LGA 1700. But it’s not always the case, so that’s the limitation of testing here.
A lot of times though, we’re talking about single-degree differences. For many people, these don’t matter.
Let’s get into the charts from our galleries earlier, but with some extra information.
List of CPU Cooler Comparisons: Best Coolers for Gaming PCs
The below table contains all coolers tested and present on these charts.
CPU Thermals: 200W Noise-Normalized & 100% Fan Speed

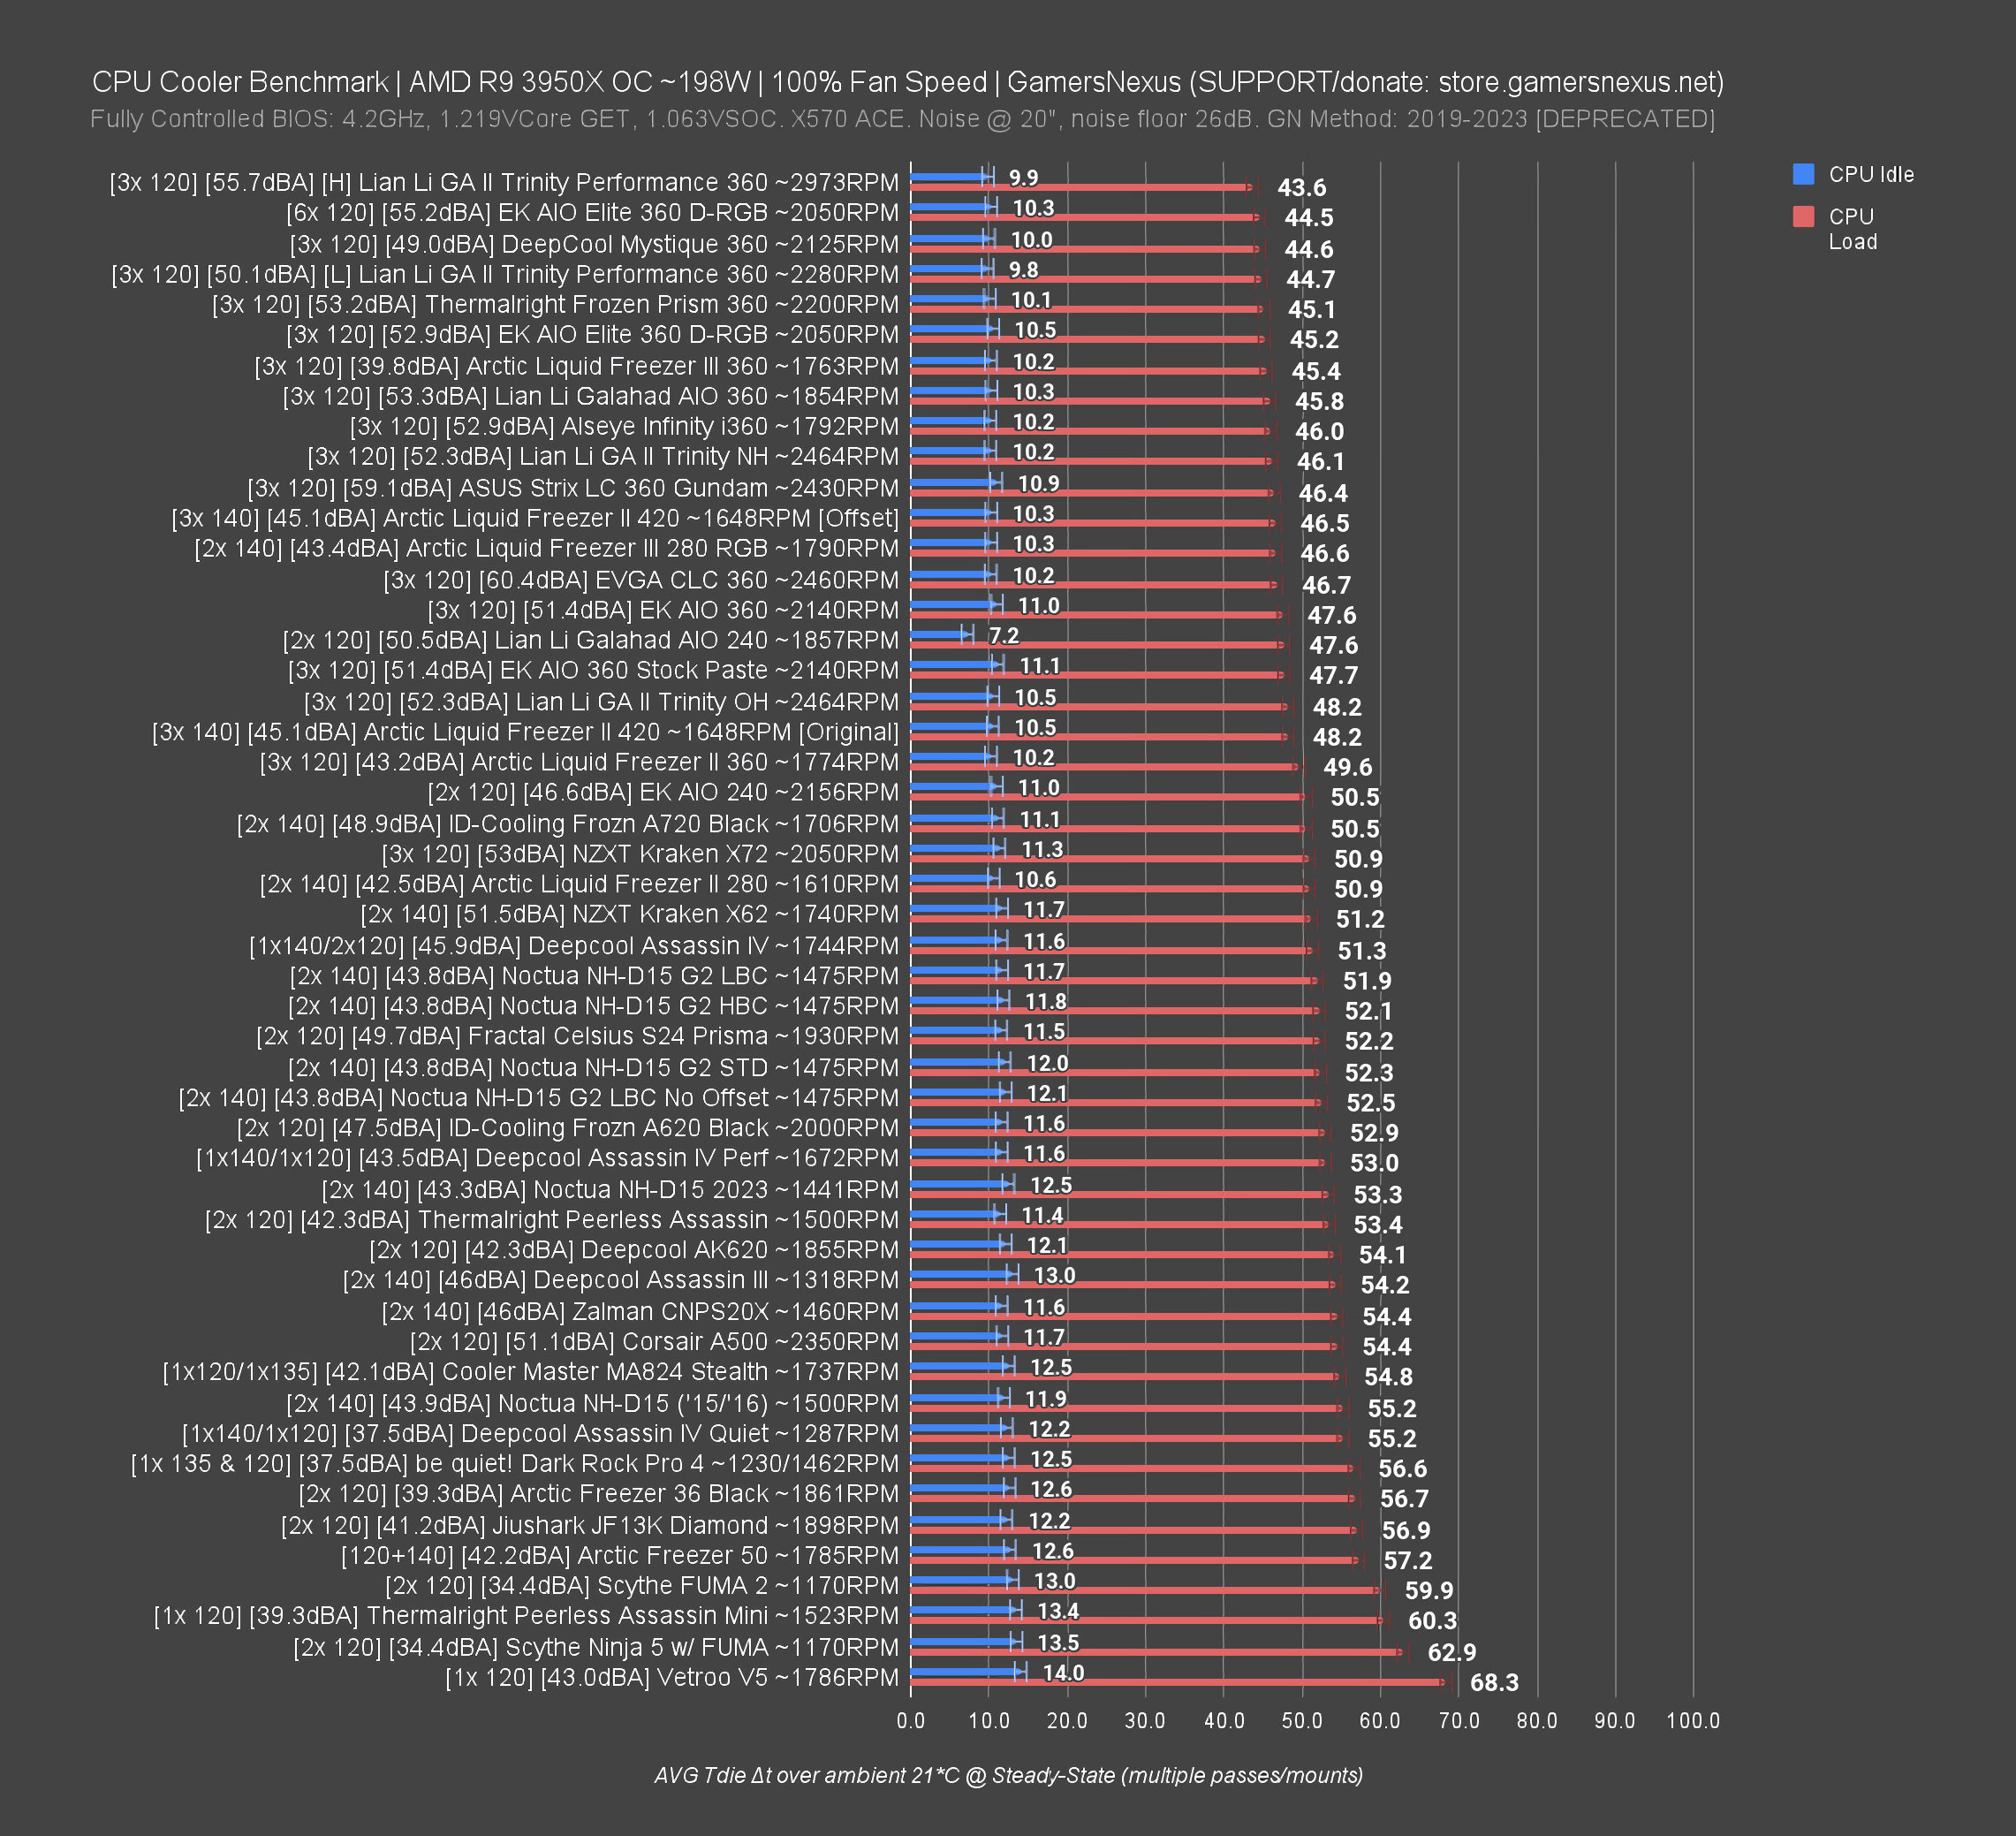
The above charts gallery includes data from our ~200W CPU heat load, representative of many modern high-end gaming CPUs. These are the most power-intensive tests we ran with the AM4 methodology.
The charts include a noise-normalized test and a 100% fan speed test (irrespective of noise): in the noise-normalized test, we define whether the coolers are liquid or air next to their names; in the 100% speed tests, we define their noise levels at that speed. In all tests, the stock (included) fans are used unless otherwise noted. Some coolers include an extra fan and are noted if so. We average the RPM between all fans present for simplified representation.
Remember that 100% fan speed tests do not control for noise levels, and so generally speaking, with a similar radiator or tower, faster (louder) fans will “win” on 100% charts. The noise-normalized result is what we generally weigh as the most important for a cooler, as it shows us a more like-for-like scenario. 100% results are still useful though, as they give an understanding for the maximum performance potential. In those charts, the “efficiency” of the result matters: You can look at the noise level (next to the cooler) against the temperature. If there’s a result that scores better than another while being quieter or the same, that result is more “noise efficient” (by our terminology) for the temperature we get.
CPU Thermals: 123W Noise-Normalized & 100% Fan Speed
Important: We are now moving to lower heat loads. As heat load reduces, the differences between high-end coolers diminish. It is not fair to judge a high-end cooler’s peak performance based on an underwhelming heat load, sort of like how it wouldn’t be fair to judge a CPU based on a load that’s GPU-bound; however, we still include those results because they’re real-world numbers that may help put into perspective the possibility of over-buying your cooling solution. Typically, the biggest advantage from an “overbought” cooler is that you can reduce noise levels more notably.
CPU Thermals: 68W Noise-Normalized & 100% Fan Speed
Now for the lowest heat load charts. This data also gives us a look at stock CPU cooler performance vs. ‘aftermarket’ coolers, like the AMD Wraith Prism and AMD Wraith Spire stock coolers vs. the Thermalright Assassin Spirit, Cooler Master Hyper 212, and more.
VRM Thermals
Now we’ll get into VRM thermals. These results can be wildly variable depending on how the platform is tested. VRM thermals are influenced by coolers primarily from the position of the fans: If a liquid cooler has a VRM fan atop it, that’ll obviously benefit the VRM thermals. We showed that here. Likewise, if an air cooler uses 140mm fans that sit low in the heatsink, they’ll pull air over or push it into the VRM heatsinks to cool the MOSFETs that we measure.
Liquid coolers are side-mounted on the test bench in such a way that would represent a top-mounted orientation (intake) in a case. If you intend to front-mount your AIO, the fans will not benefit the VRM -- likely not at all -- and you’d need case fans to help it. Air coolers can be directly compared here, but liquid coolers can only be compared under the assumption of the same mount as tested.
Likewise, for noise-normalized testing, you’ll see some liquid coolers seriously struggle with VRM thermal performance. The EVGA CLC 360 is a great example of this in our charts, as its pressure wanes significantly after the reduction for acoustics, causing it to lose pressure through the radiator and lack power when it hits the VRM heatsink.
These charts are also most useful for low-end motherboards where VRM thermals are a concern. A lot of modern boards are overbuilt, which reduces the necessity for ancillary VRM cooling.
Update Log
The below marks our updates and change log for this page. The format is in MM/DD/YYYY:
- July 14, 2024: Added data for the D15 G2 on 200W AMD. Added data for the Arctic Freezer 36, Peerless Assassin 120 Mini, ID-Cooling A620, ID-Cooling A720, Cooler Master MA824, and Thermalright Frozen Prism 360
- July 7, 2024: Added Intel LGA1700 (14900K / 14900KF) 250W heat load, following the Noctua NH-D15 G2 review
- December 2, 2023: Initial creation of the page with first dataset following our Best Air Coolers round-up