Inspired by the Baldur's Gate team, we wanted to publish our own patch notes for the site this month
The Highlights
- Mega Charts are the next big implementation for the GN site
- We also improved some site functionality and speed, especially mobile legibility
- The table of contents overhaul delivers on a common point of user feedback
Table of Contents
- AutoTOC

Intro
We’ve been hugely inspired by the Larian Studios team developing Baldur’s Gate 3 and their impressive communication with the community for each major game patch. Although we can’t boast the 1000 improvements, features, and fixes they published for Patch 4, we did want to compile our recent change log for the site for those of you who want to know all the new details.
Our biggest change this past week came in the form of GN Mega Charts, which introduces our take on a years-old community request to publish a singular location for our most up-to-date information and benchmarks on certain component categories. There were other updates in addition to that, but we’ll embed the video for that one below.
Credits
Writing
Steve Burke
Camera, Video Editing
Vitalii mAkhnovets
Publishing Log
The past few weeks, we have published a number of articles to the website. These include dense, special feature pieces that are heavy on images and history (like the Voodoo / 3dfx retrospective), reviews and revisits (like the Ryzen 2700X in 2023 tests), and the Mega Charts that’ll get their own discussion section.
Because we are backdating a lot of articles to their original publishing date, they may not show up on the front page when converted to web format. To help you catch up on what’s been published lately, we’ll list it all below -- the team has been busy fulfilling this years-old promise to bring back the written content!
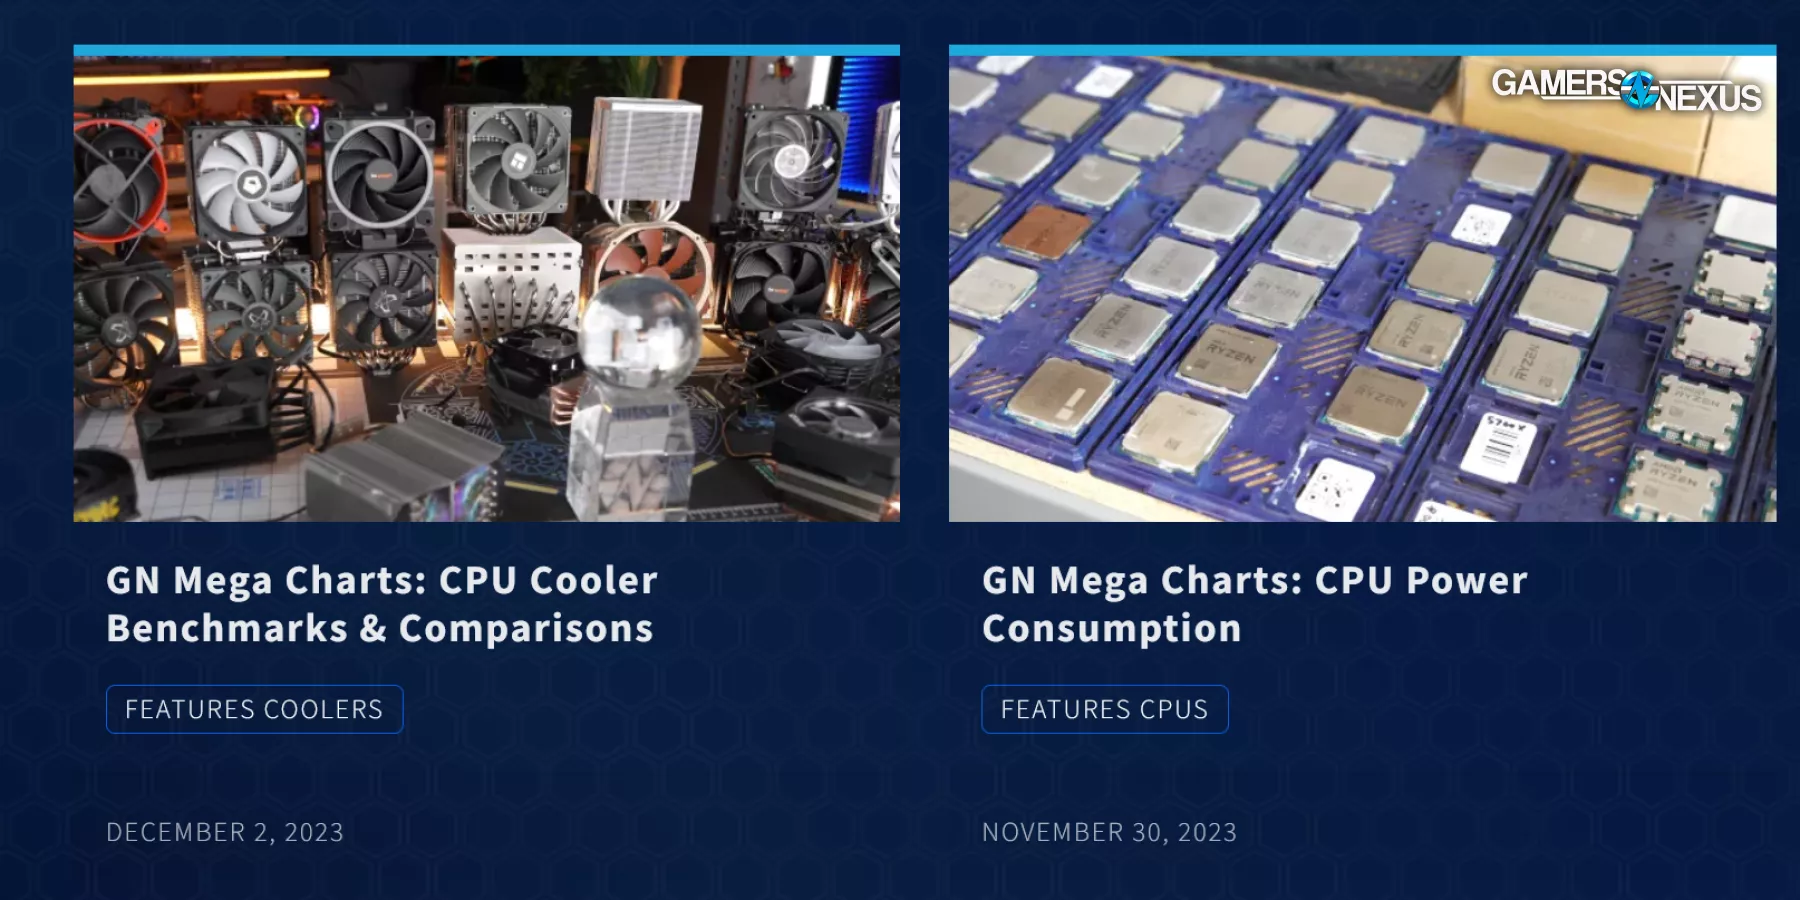
Mega Charts
- GN Mega Charts: CPU Cooler Benchmarks & Comparisons (permanently maintained/ongoing updates)
- GN Mega Charts: CPU Power Consumption (permanently maintained/ongoing updates)
Special Features
- Back from the Dead: 3dfx's Unreleased Voodoo5 6000 Quad-GPU Card (original video publish date: April 7, 2023)
- They Changed Everything: Valve Steam Deck OLED vs. LCD Tear-Down (November 11, 2023)
Round-Ups
- Best CPUs of 2023 (Intel vs. AMD): Gaming, Video Editing, Budget, & Biggest Disappointment (original video publish date: November 22, 2023)
- Best & Worst GPUs of 2023 for Gaming: $100 to $2000 Video Cards (original video publish date: November 23, 2023)
- Best Cases of 2023 So Far (original publish date: July 14, 2023)
Reviews
- Noctua NH-P1 Passive CPU Cooler Review: Benchmarks, Schlieren Photography, & Mechanics (original video publish date: June 29, 2021)
- AMD Radeon RX 7900 XT vs. RTX 4070 Ti Revisit in 2023: Benchmarks & Price Drops (original video publish date: October 31, 2023)
- AMD Ryzen 7 2700X in 2023: Benchmarks vs. 5800X3D, 7800X3D, & CPU Upgrades (original video publish date: November 16, 2023)
- Intel Core i9-14900K CPU Review & Benchmarks (original video publish date: October 18, 2023)
- Intel is Desperate: i7-14700K CPU Review, Benchmarks, Gaming, & Power (October 17, 2023)
Reasoning
Just to share our reasons for each of these:
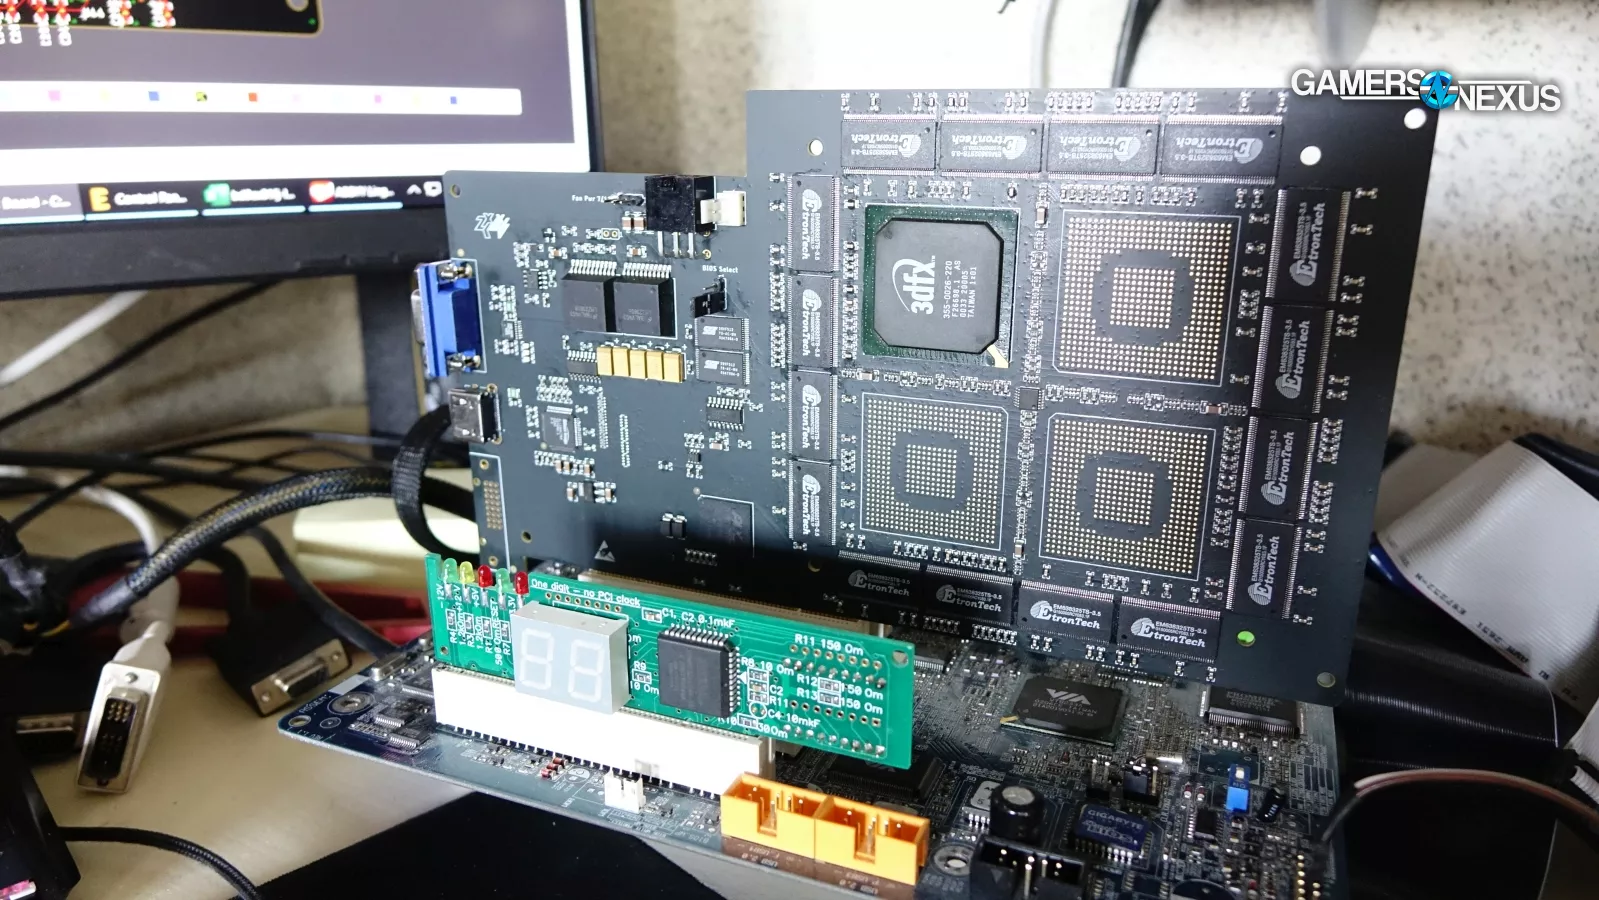
The 3dfx / Voodoo piece is just plain cool. You all loved the video, especially for its historical and retrospective elements. That preserves well as text. We also wanted to get all the resource links and citations in one place for anyone who wants to study 3dfx further.
The Noctua NH-P1 remains an extremely relevant cooler even today, despite its 2021 release. We recently named it as one of the best coolers in our 2023 round-up, showing how relevant it is even today. It deserved an article conversion.
The Best Of round-ups were just obvious choices. They’ll perform well, from a business standpoint, but they’re also useful. A lot of people searching Google for that kind of information will land on spammy comparison sites without any actual data, so hopefully we can reach some of those people.
As for the more recent reviews, those are just keeping with the promise to deliver reviews to written format as soon as we can for long-term reference.
Site Improvements
In addition to what our team has done for article content, Wendell’s team has been busy patching and improving the website. They’ve made a number of large and small improvements based on emails from our readers (thank you for those!), including the below:
- A table of contents has been added (more below)
- Site speed has been improved even more. It was already fast, but we did some header image optimization to reduce image size of the feature / article hero image
- Some improvements to UI and layout for mobile and tablet devices, mostly related to usability
- Some improvements to font and text spacing in certain scaled viewing conditions
Table of Contents
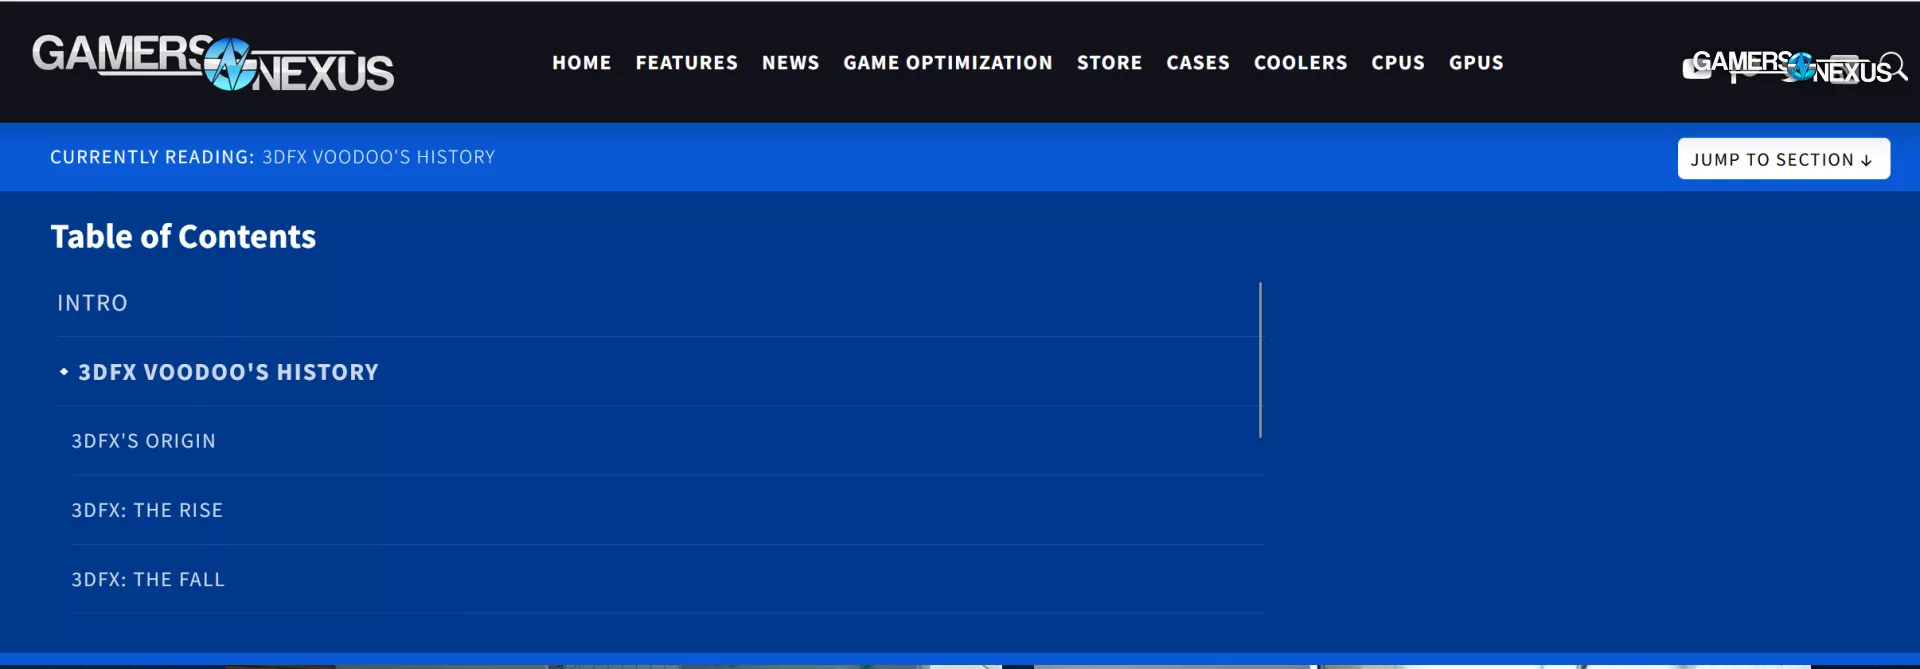
The Table of Contents addition has been impressive. Krista on Wendell’s team (both at Level1 Techs) did all the styling work and, without any input at all from us, was able to execute on an awesome-looking navigational and UI improvement.
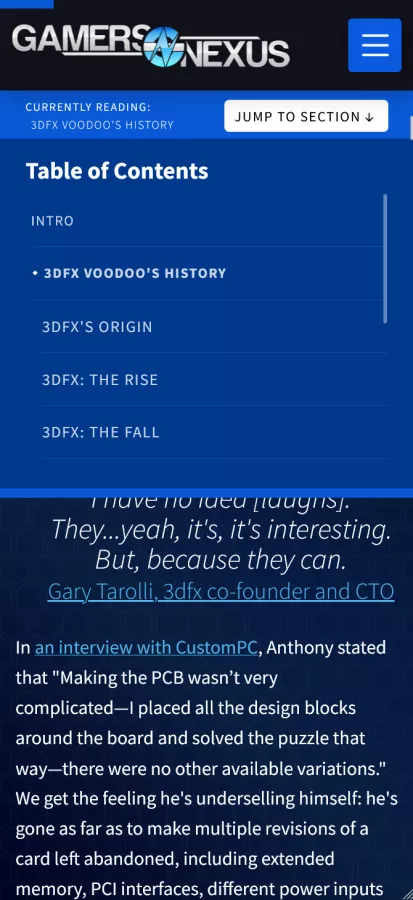
The ToC also works great on mobile.
This table of contents uses a separate drop-down from the site main menu nav to give you headings to jump to for quick navigation. You can also use it at the top of the page. We love how it came together visually and functionally. For those curious about the back-end, implementation basically just relies on anchors and headings.
The Level1 team also added a progress bar to articles that is thematically matched with our chart timer sidebars in the review videos. It’ll help you keep track of your place and how far along you are in case returning later.
Both of these features were added as a result of our choice to try and keep everything to a single page format. The multi-page format of reviews largely exists to extract as many pageviews as possible from a single visitor which, on advertising-heavy sites, multiplies the revenue somewhat linearly per page visit. It also makes the site appear more “valuable” because it inflates the pageview count. For us, being ad-free and independent (not seeking acquisition or trade between big publishers), neither of these matters. The single-page layout is faster to navigate -- but not if it’s too text and image dense. The ToC helps fix a lot of these navigational limitations of single-page layout.
Note that, for organizational purposes, it’s possible we integrate a pagination system for long-term Mega Charts pages (to host older methodologies at the same URL) in the future, but we’re not sure how we’ll handle that yet.
GN Mega Charts
As for the mega charts, that’s largely explained in the video -- but some of the script is below:
We’re introducing a new series called GN Mega Charts, where we’re publishing all of our directly comparable data in full format. This is the amalgamation of literally tens of thousands of test passes over the last couple years, all in just a handful of charts that get perpetually updated.
One of the biggest community requests for the last 4 years has been publishing charts in a place where you can know it has our full dataset. We dedicated this entire year to catching up on community requests and backburner projects like the website, which we wanted to rebuild years ago but finally did recently with Wendell, and now we’re knocking out another of those big community requests.
We’re super excited about this. The Mega Charts page will exist at permanent URLs, so you can always visit those pages to get the full dataset for each component category we review.
The biggest reason we can’t do full charts in videos is because of the 16:9 limitation of video format, where taller charts become completely illegible. There are other reasons too, like just trimming expired data for game tests, but the main one is commonly vertical limitations.
But we’re going to walk you through some of the detail we published today and the vision for the next round of them.
Here’s what we’ve got so far:
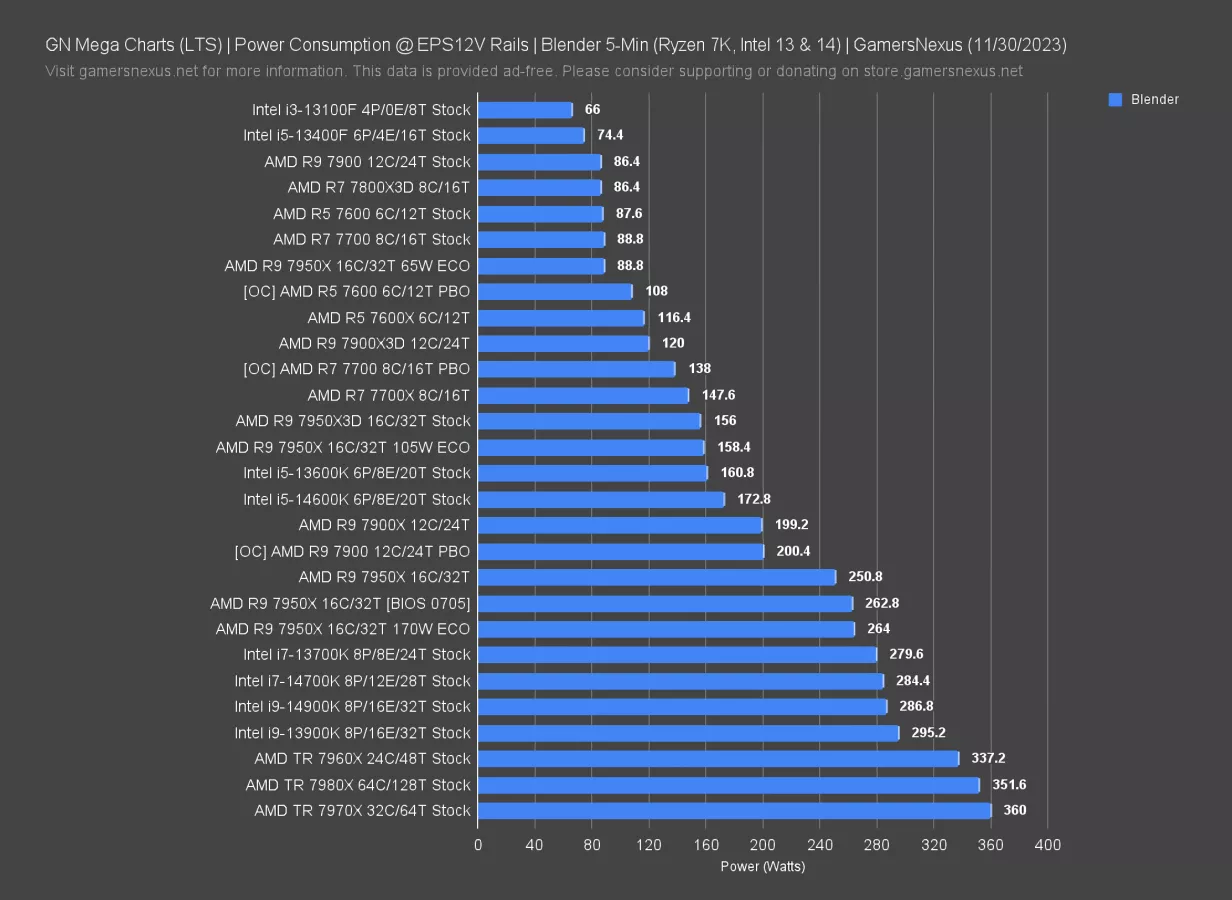
We introduced a Mega Charts page for CPU power consumption, which includes charts for over a decade of CPUs that we’ve tested for power consumption, plus our latest efficiency chart and some notes on the methods. We also just made this mega charts page for the CPU cooler reviews, which compiles all of our validated cooler tests from the last several years on the same comparable platform.
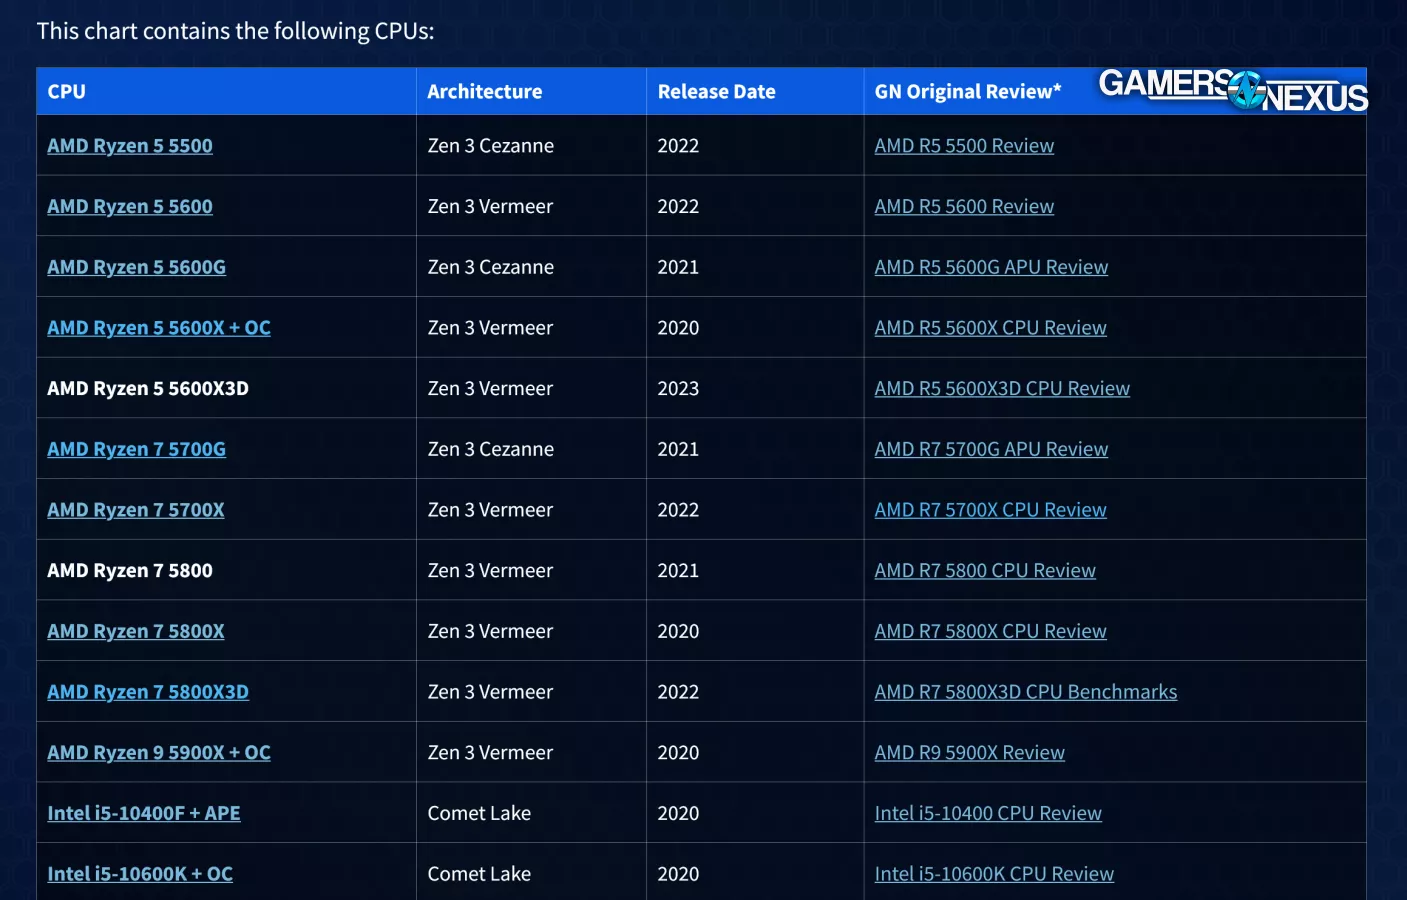
The CPU power consumption test page also features these huge tables of CPUs by name, so you can easily ctrl+F the CPU name and know if it’s in one of these charts. This also lets you find our original review or other coverage all in one quick-launch place. All the video reviews are linked there, so if you can’t find a particular chart you wanted, you can probably find it in the table on the page.
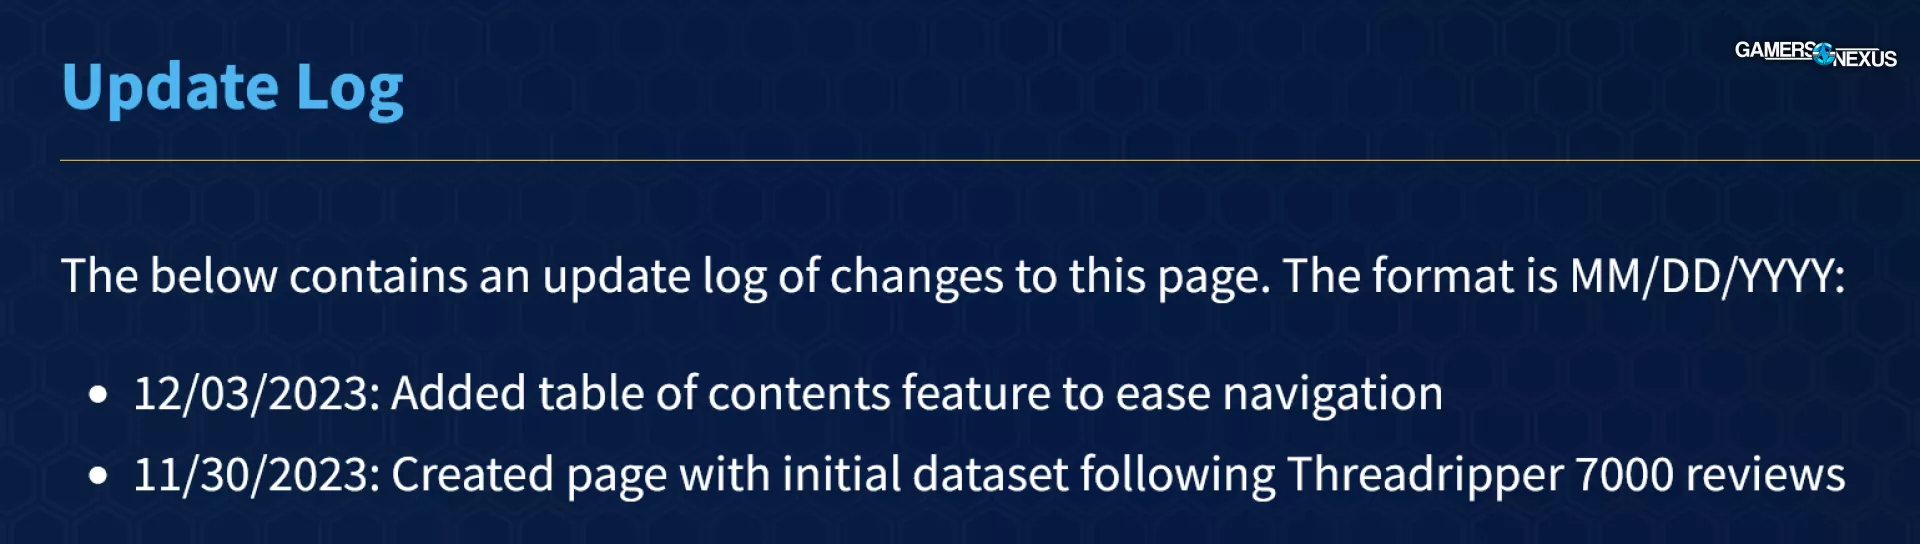
All of these Mega Charts pages will also feature update logs so you can see when it was last maintained and updated. This helps with data transparency but also just from a historical and usability standpoint.
Plans for Mega Charts
Here’s the vision for where these are going.
We plan to update these a couple times a year, so they won’t necessarily have the absolute latest data (you’ll find that in the video reviews, as always, and the articles as they go up), but they will have the most data.
Our current project here is to build out the craziest acoustics data page you’ll find on coolers. Mike has been working in the hemi-anechoic chamber for weeks now to collect and log noise samples, frequency spectrum data, and noise levels for CPU coolers. I basically wrote the standard operating procedure, figured out the methodology and the scientific approach we want to take, and then set Mike loose on it, and he’s been burning through coolers in there fast.
The plan for the cooler acoustics mega charts page will require some more custom website coding work from Wendell’s team. The dream is that you’ll have a big table of cooler noise levels with sample noise files, so you can actually just click an embedded play button to hear the audio sample. We’re also hoping to have a function where when you click the cooler line item, it’ll drop down and show you a frequency spectrum plot.
All of this will take some time to build and code, and to parse the data, but that’s the next big vision for the site. It’ll also all land on YouTube first-and-foremost, where we’ll be publishing updates as we go and as we collect everything.
In addition to all of this, we’re planning to add the CPU and GPU gaming benchmarks to these same types of pages.
We’re also working on this for cases. Our case test bench has been out of commission for most of this year because we’re finally replacing it with a new bench and methodology, but with hundreds upon hundreds of lines of tested cases, we want to archive that permanently before we move on -- it’s about 7 years of data!
The cooler benches are also getting updated this year. As these get updated, the mega charts pages will remain and keep the prior generation of cooler data -- but we’ll either move them to a different URL (like an archive) or just push them way down on the page. This might be an actually useful situation for pagination or something.
Using These Pages
Each of the mega charts pages puts the charts up at the top in galleries, but we’ve included detailed methodological information, testing background, and some notes on how we think the pages should be used. But the first goal is to just make a dataset and page that’s as useful as possible, so all of it was put up at the top despite having a lot of important nuance behind the data.
Our hope is that people will bookmark these pages any time they need to learn something about a particular product. We’ll still run into chart size limitations, just in terms of what’s reasonable to put on a screen (and what’s searchable/scannable by eye), so we’ll sometimes break charts up into pieces. The CPU power page is a great example of this.
We recently went back through over 6 years of power testing data to put the power charts together. We still have more that’s not on here yet, but this is just everything that we were able to vet in the last couple days.
For these, everything is directly comparable from one chart to the next (and the usage guidelines on the page will always explain this for you, in case that changes), but we split them up to make them easier to navigate. They’re mostly split generationally or by year, so there’s power data for Ryzen 7000 alongside Intel 13th & 14th series CPUs, Ryzen 5000 with Intel 10, 11, and 12 series, 3000 with 8th and 9th, Ryzen 1000 and 2000 with Intel 7th Gen, and a miscellaneous and legacy chart for everything where we didn’t know what to do with it.
The awesome thing is that all of this is directly comparable. We even kept the X axis the same on as many as possible so you can more easily visually check the differences. We had one note for the legacy chart since it’s going so far back in time that we didn’t have any official guidance from AMD or Intel back then, but you can read that note on the website if you want.
The whole point of all of this though is that we’re trying to offer as much as possible while also offering all the caveats and explainers in writing. There is some responsibility required with navigating all this data since we have nuances, such as the nuance of legacy component testing being done with fewer controls (since we were brand new to all of this back then), but the data is there if someone might need it as a launching point. The newer the data, the more controlled it is too.
But since all of that was done with the same methodological approach on the data capture side, all the numbers are grouped together.
Future Ideas
A couple notes on future improvements:
First, we could go with javascript charts or something at some point, or text-based ones, some kind of Anandtech-like bench, but for now, we’re keeping everything as simple and lean as possible. Wendell is the only person we trust to develop this site, and likewise, we need processes that mesh well with our current workflow so we don’t just become so slow as to be useless. We’ll clean up and improve as we go on, but our belief is that this is an iterative process. We’re starting with function-first, as we always have. Also, speaking frankly, we’re concerned about data scraping from bots and LLMs that could rip us off.
The table of contents was probably the biggest improvement. A lot of you have been asking for that. We still have to retroactively add it to some of the other articles, but at least going forward, we’re slowly beginning to add it to the denser material.
This has been an awesome year for our processes at GN. We’ve been quieter than in years past in some ways, like in our case reviews, because we’ve been totally overhauling every test bench this year. But it’s felt good to get the website done. Like I said last time, this is something I promised even before the fan tester -- years before -- and it took us until this year to do it. Sometimes, we move really slowly -- but that’s because we’re trying our hardest to do things right, or at least our version of “right.” Even still, perfect is the enemy of good, so now we’re in an awesome place to just start putting things out in the fastest, most function-first way possible.
We’ve been lining them up and knocking them down. We’ve been making small tweaks and corrections, as has Wendell, as viewers have emailed us with requests or notes.
We’re really trying to make this a permanently referential resource to provide long-term value and accessibility. It’s not as good from an advertising or views standpoint to do this, but the community support makes it possible. We want this to be treated as a lookup engine for whatever you need. And since all that data is collected on our own controlled platforms and not less controlled user platforms, you know the data quality is high and that comparability is also present.
More patch notes soon!