Less than a year from launch, the RX 7900 XT’s lower price point makes it a more compelling GPU in 2023
The Highlights
- When the RX 7900 XT first launched, we called the card a greedy upsell
- Despite momentarily dropping to the low and mid $700s, it recently went back up to around $800 -- but that's still down
- We’ve seen the card get as low as $720 after instant rebate, making one of the best value high-end cards.
- Original MSRP: $900
- Release Date: December 13, 2022
Table of Contents
- AutoTOC

Intro
AMD’s RX 7900 XT has finally become the competitor it should have been -- sort of. It’s time to do a revisit, because the new pricing makes this card a lot more competitive than it was at launch. We called it a greedy upsell back then and said that AMD was out of touch, especially with its own 6950 XT pricing that killed the 7900 XT’s worth (and against the 7900 XTX that we'd just reviewed).
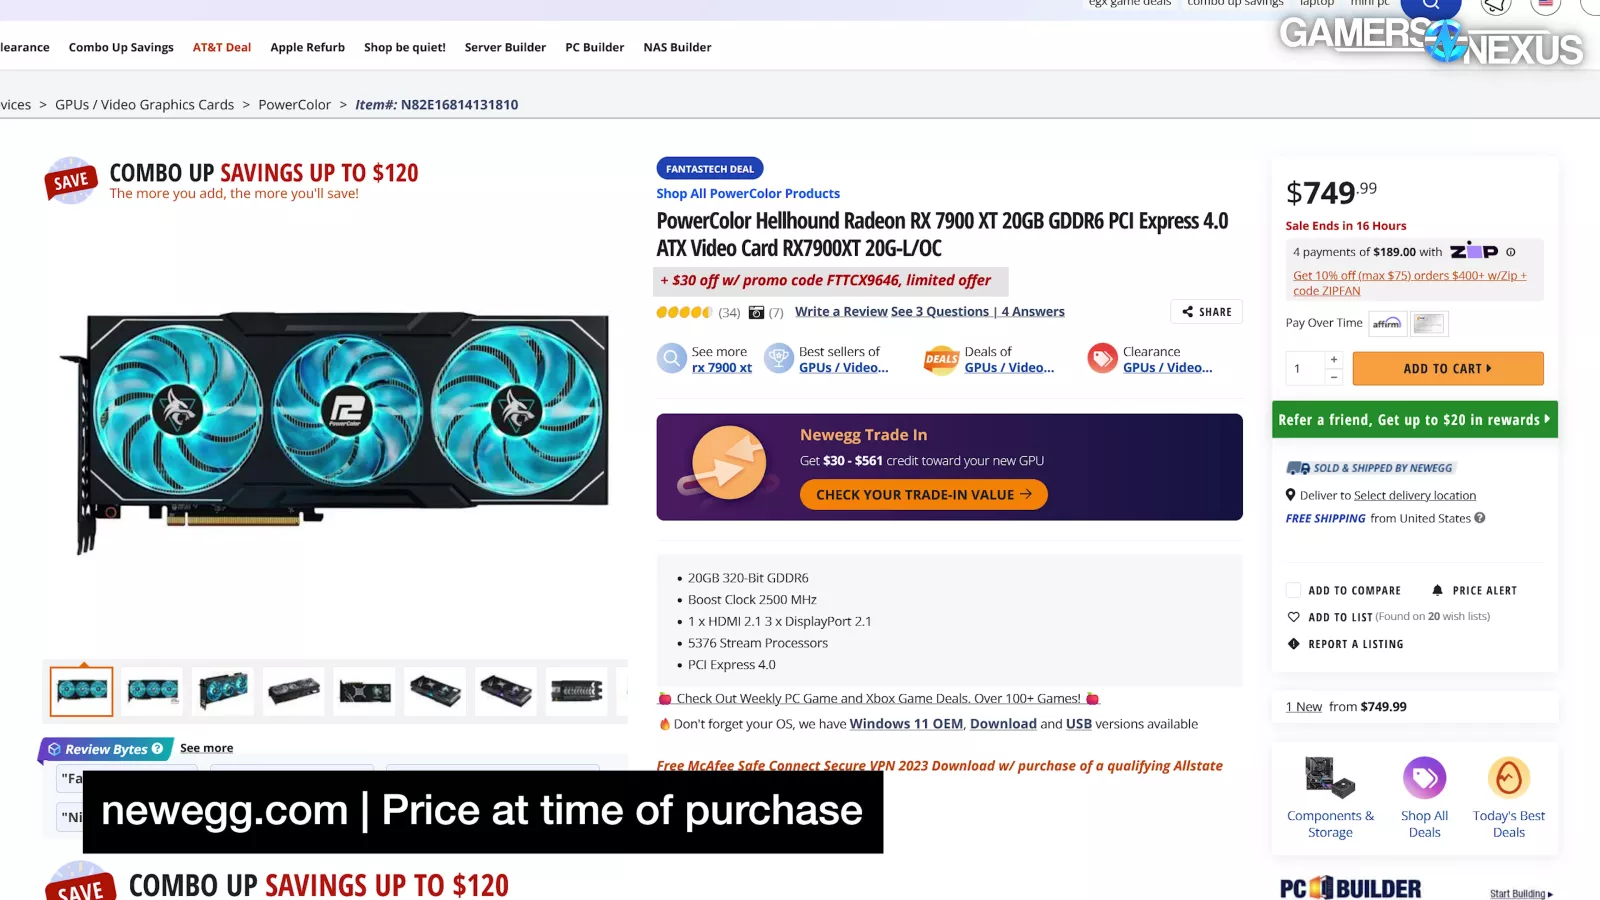
The cheapest SKU we could find was the RX 7900 XT Hellhound. The pricing has been all over the place lately, unfortunately. We purchased it when it was $720, which was a $30 instant promo stacked on top of a seemingly new $750 baseline price. Apparently that was an incredibly narrow window though, because by the time we finished our in-depth testing of the card and writing the review, the price had changed again. And not just the promo price, but the entire price: On all US retailers we had checked, the price climbed from $720 discounted and $750 baseline to a new $800 baseline.
That took us by surprise, because every retail listing we saw gave us the impression that $750 was the new baseline. We’re skeptical whether the price might have just risen to drop once we hit Black Friday in a few weeks.
(Editor's note: As of 11/12/23, when we're entering this as an article, the price has slightly dropped again -- now $780 -- aligning with our above suspicions).
Credits
Testing, Host, Writing
Steve Burke
Testing
Mike Gaglione
Jeremy Clayton
Camera, Video Editing
Vitalii Makhnovets
Camera
Tim Phetdara
Writing, Web Editing
Jimmy Thang
Either way, that means we bought it at a $180 decline from the launch MSRP of $900, or if you were to buy it right now, it’d be a $100 drop from launch MSRP. Both are a big shift from the launch price.
Despite our immeasurable disappointment of the rug being pulled on us, we’ll forge ahead with a rewrite of this article to accommodate both the illusive $720 price and the $800 one.
PowerColor RX 7900 XT Hellhound Review
Either price would put the 7900 XT in close competition with NVIDIA’s RTX 4070 Ti. Regardless, the price has been generally trending down. The focus today will be on head-to-head value comparisons between the most relevant competition that can be bought new. This is meant to be more of a convenient buyer’s guide and recap.
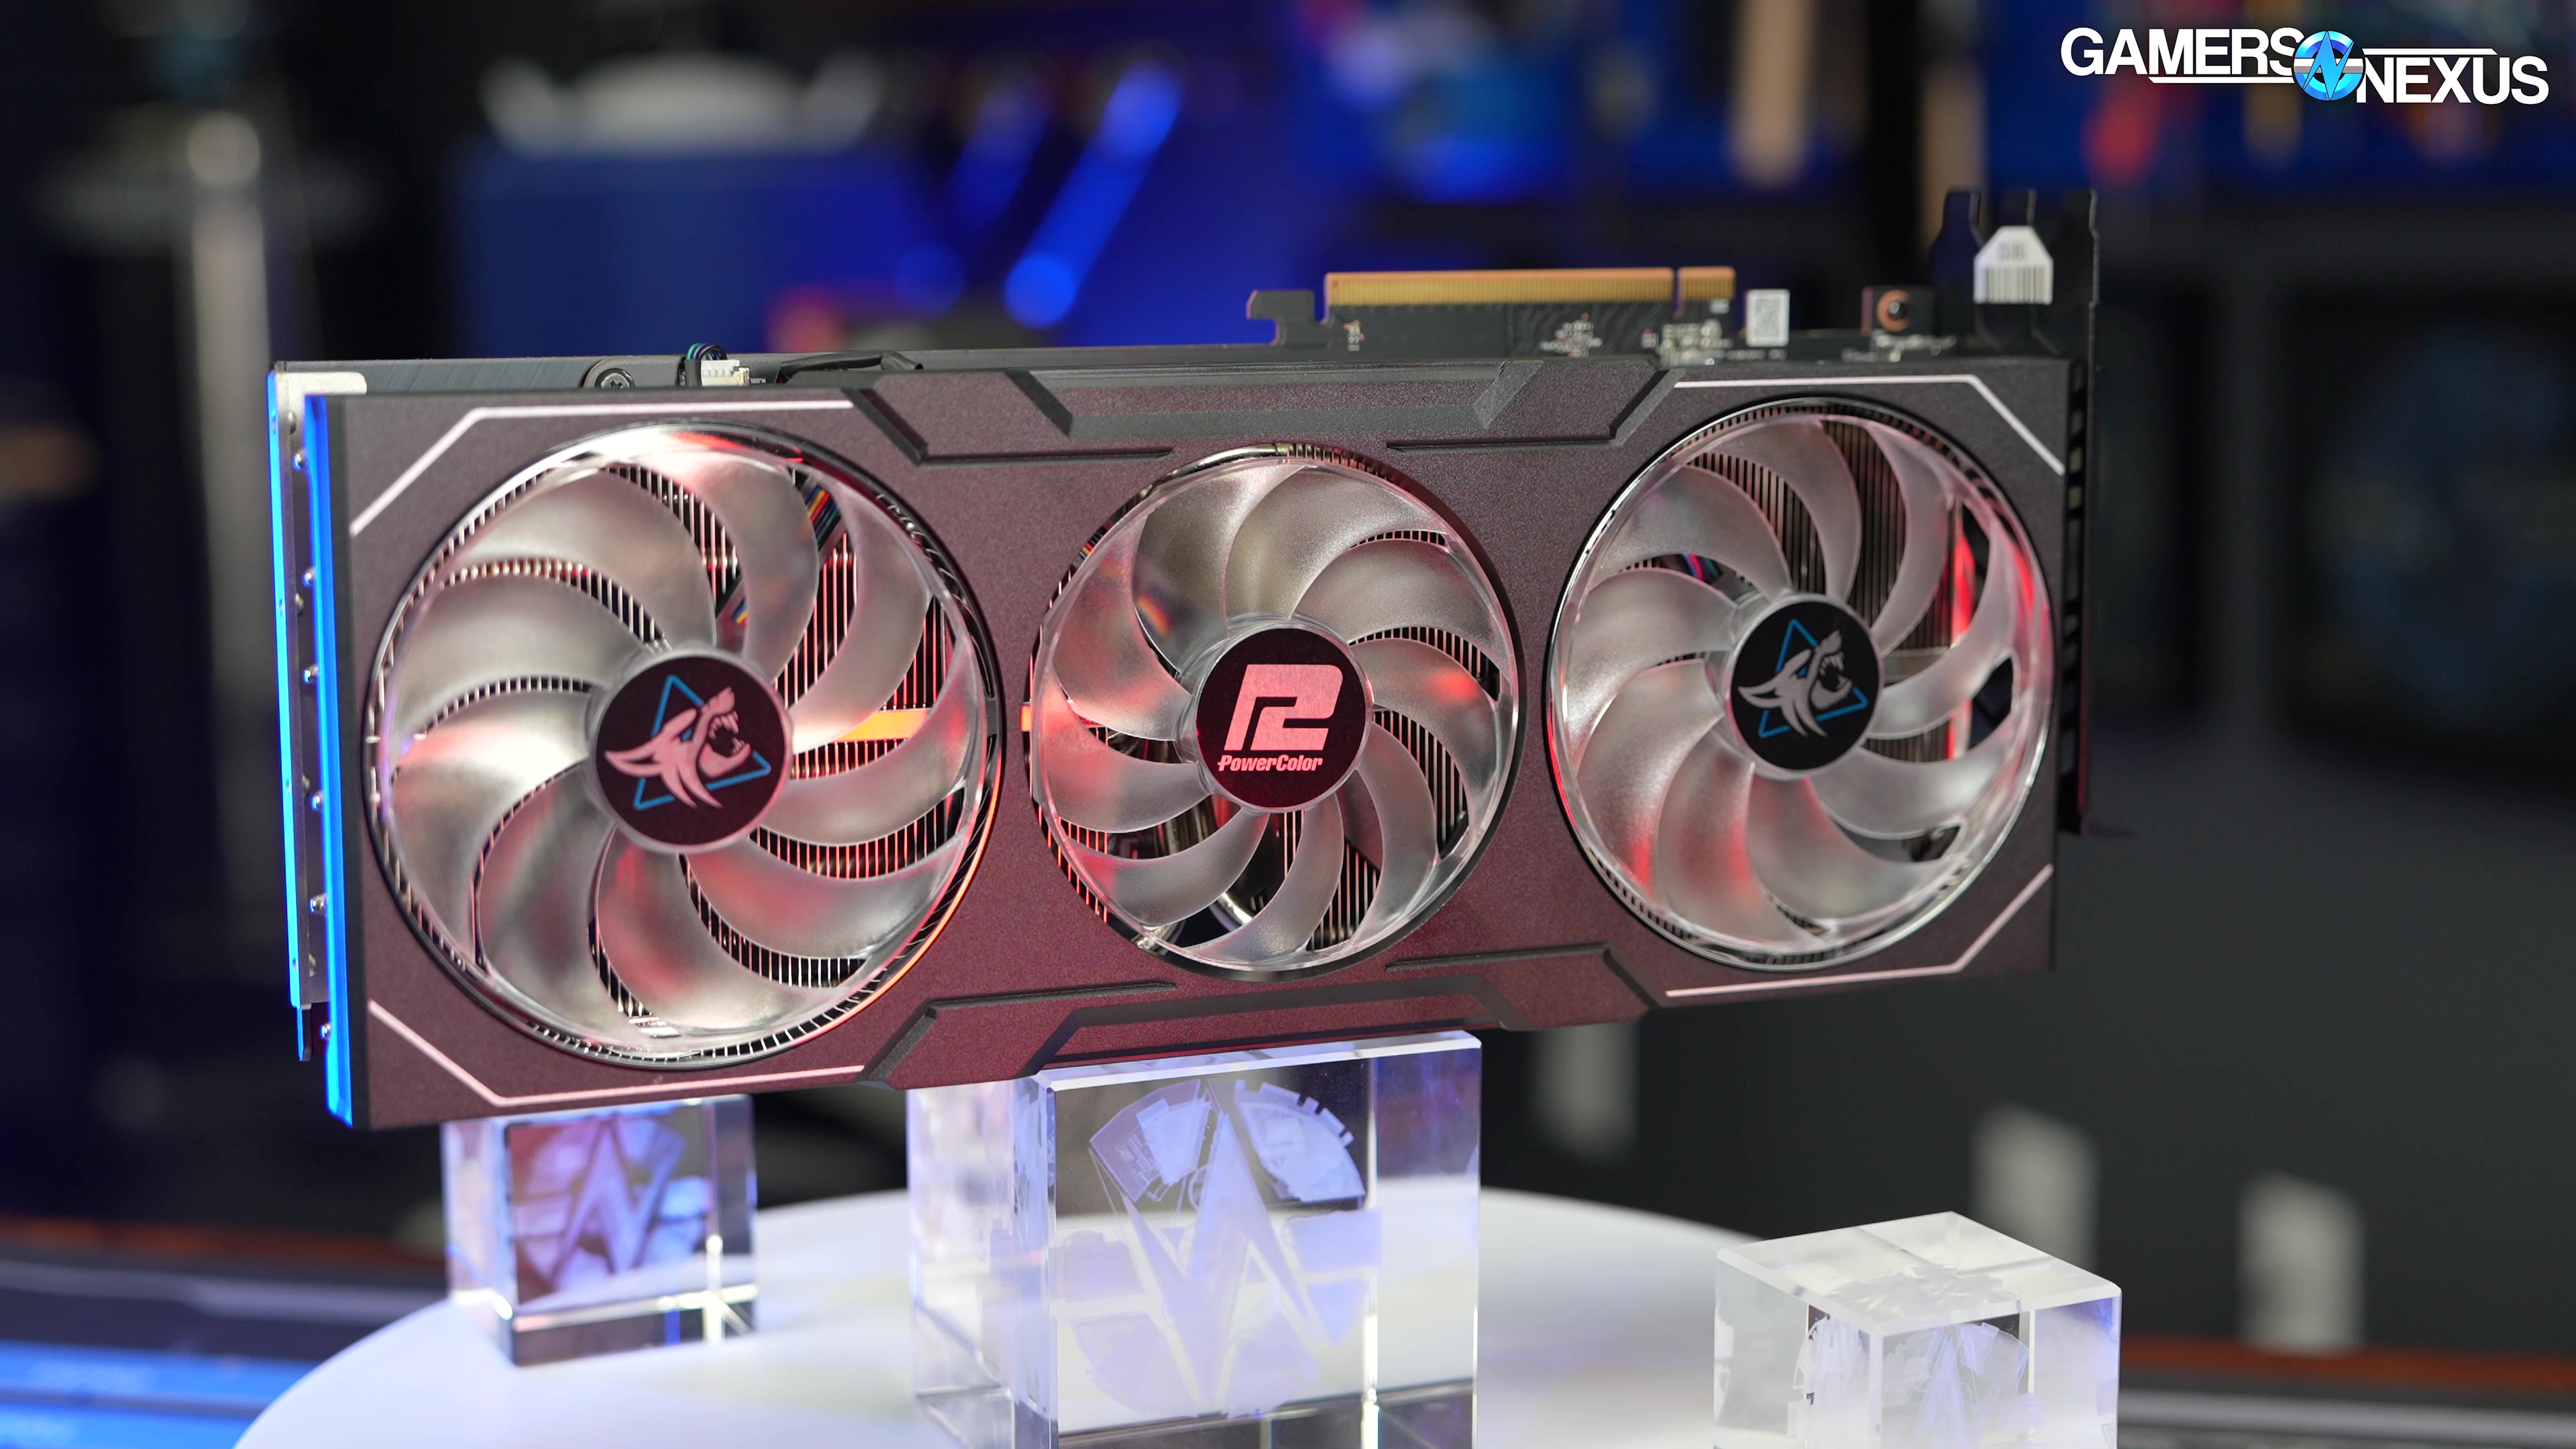
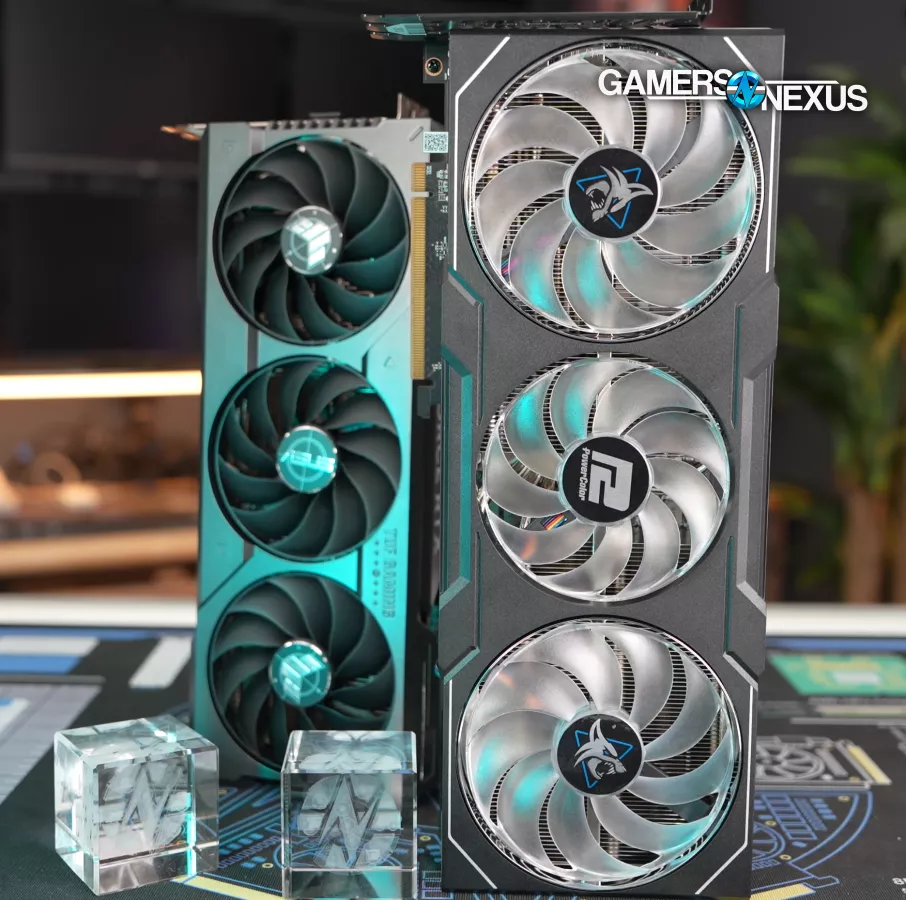
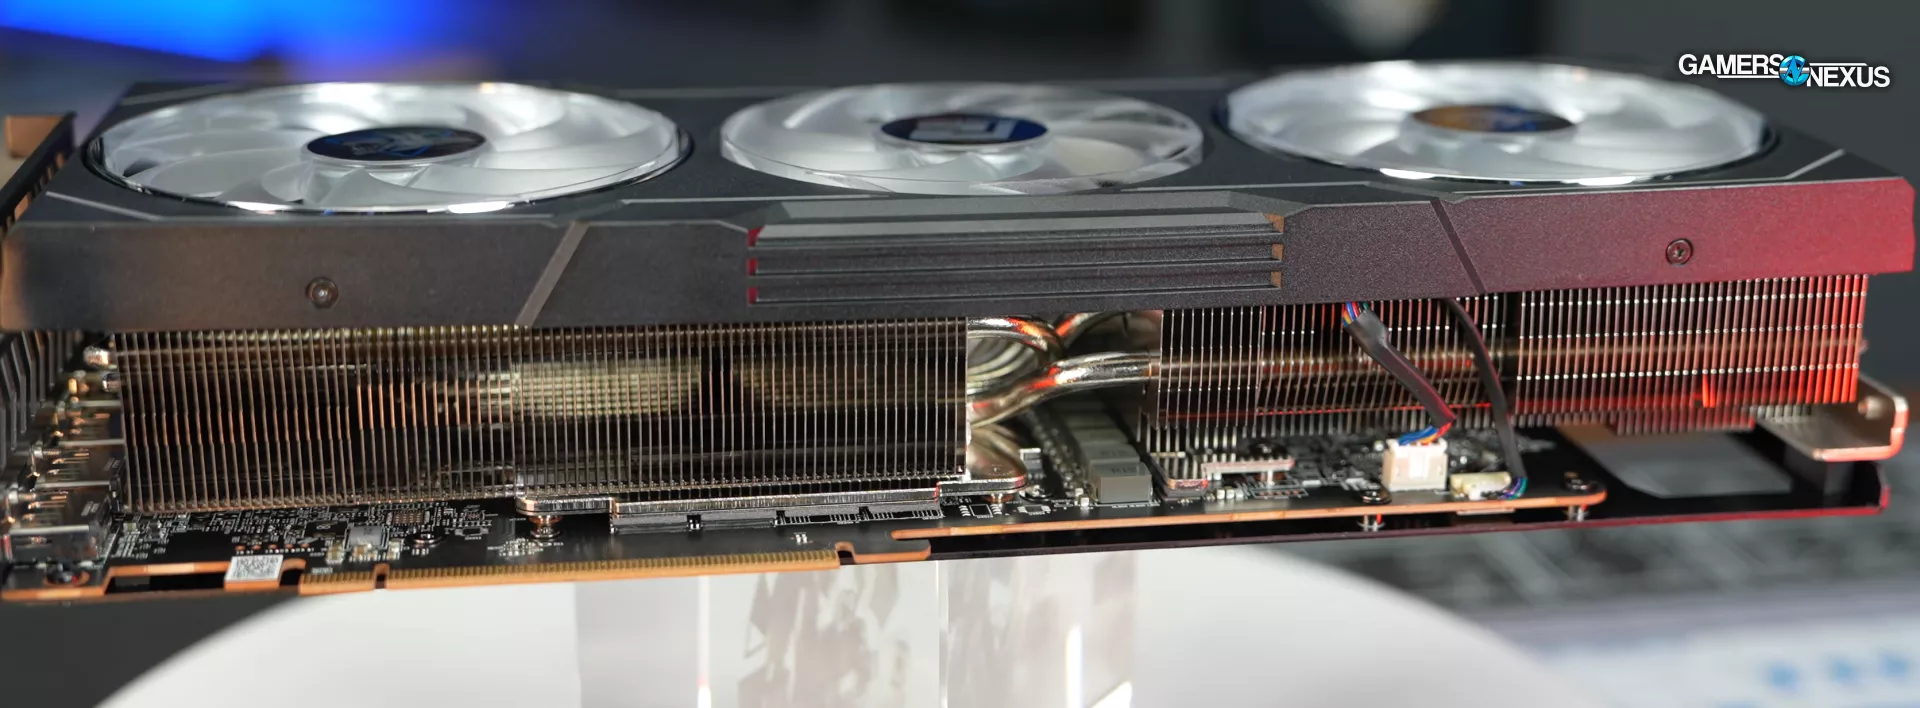
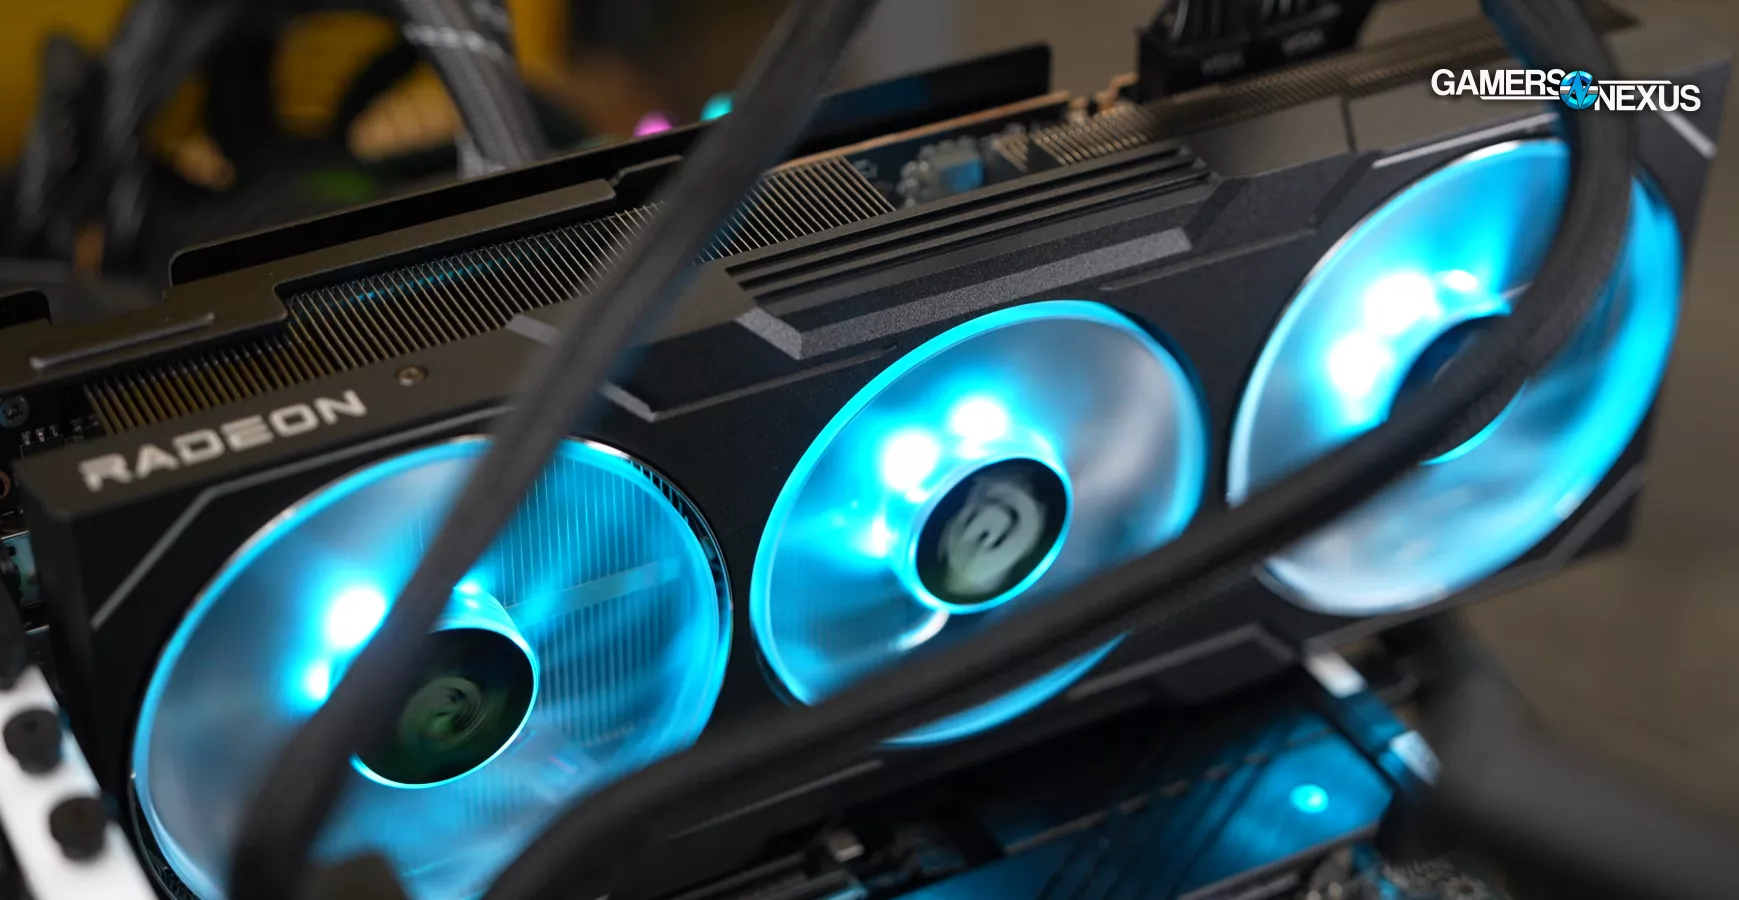
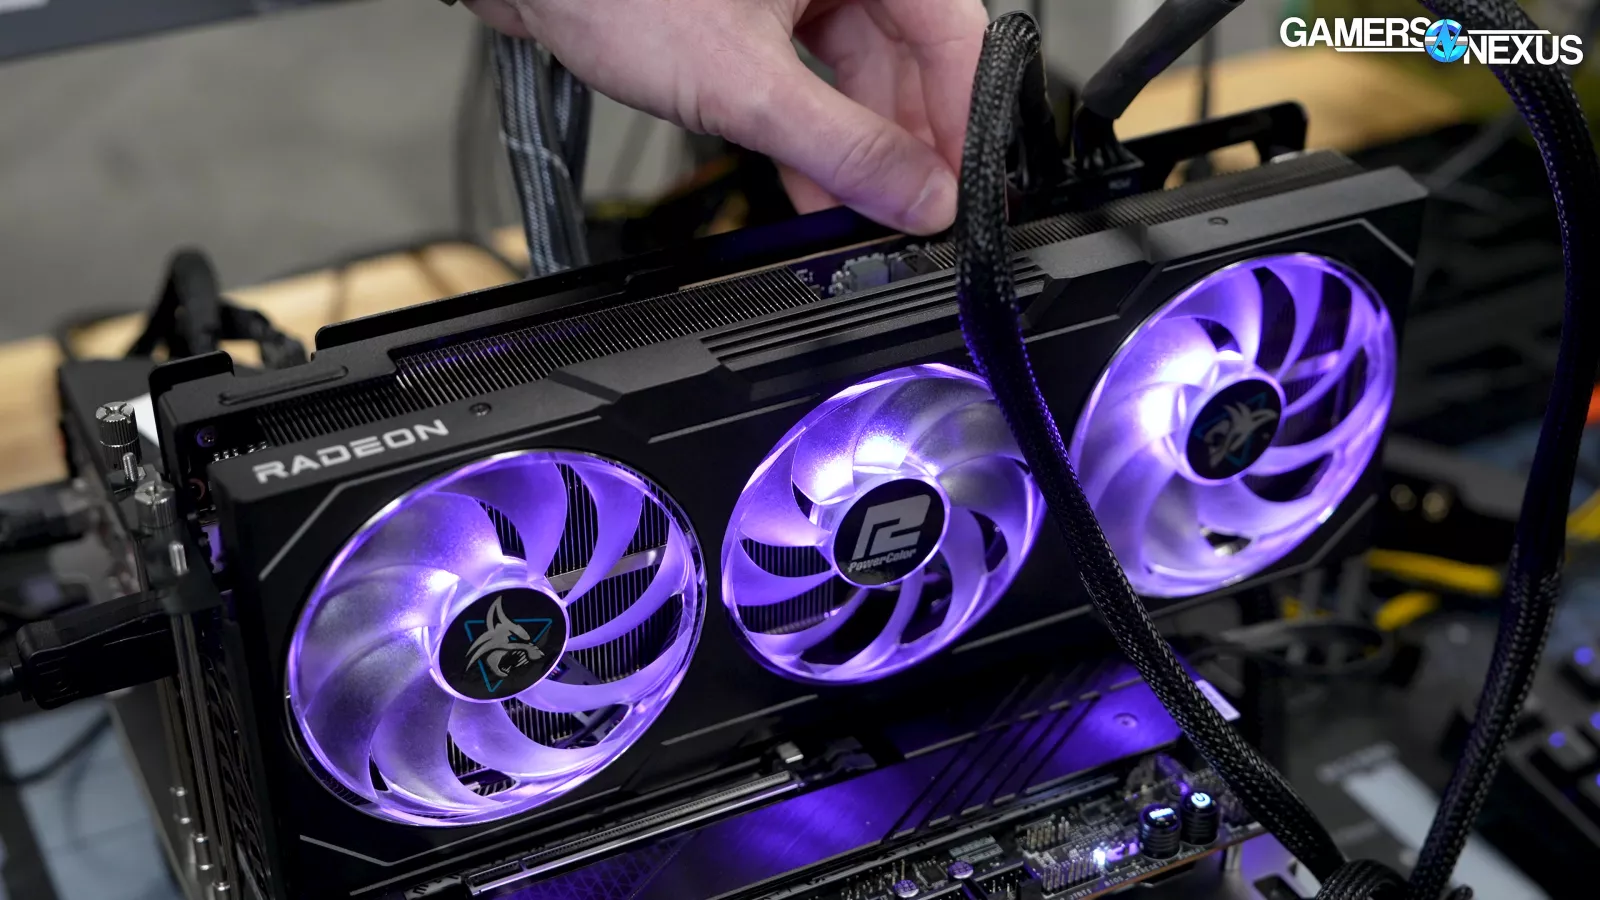
This review will specifically test the PowerColor RX 7900 XT 20GB Hellhound model, which is one of the cheaper ones regularly available in the US. The Hellhound uses a 3-fan cooling solution, has a dual VBIOS switch, and has a physical toggle for LED control (with three pre-programmed options: purple, blue, or off - the rest is done via software). Testing largely focuses on value today of an RX 7900 XT in general, but we also included frequency analysis for the clock, thermals, and power consumption.
AMD Radeon RX 7900 XT Price History
We’ll start with the prices as of October 30th, then briefly look at the prices from a couple weeks ago when we bought the card.
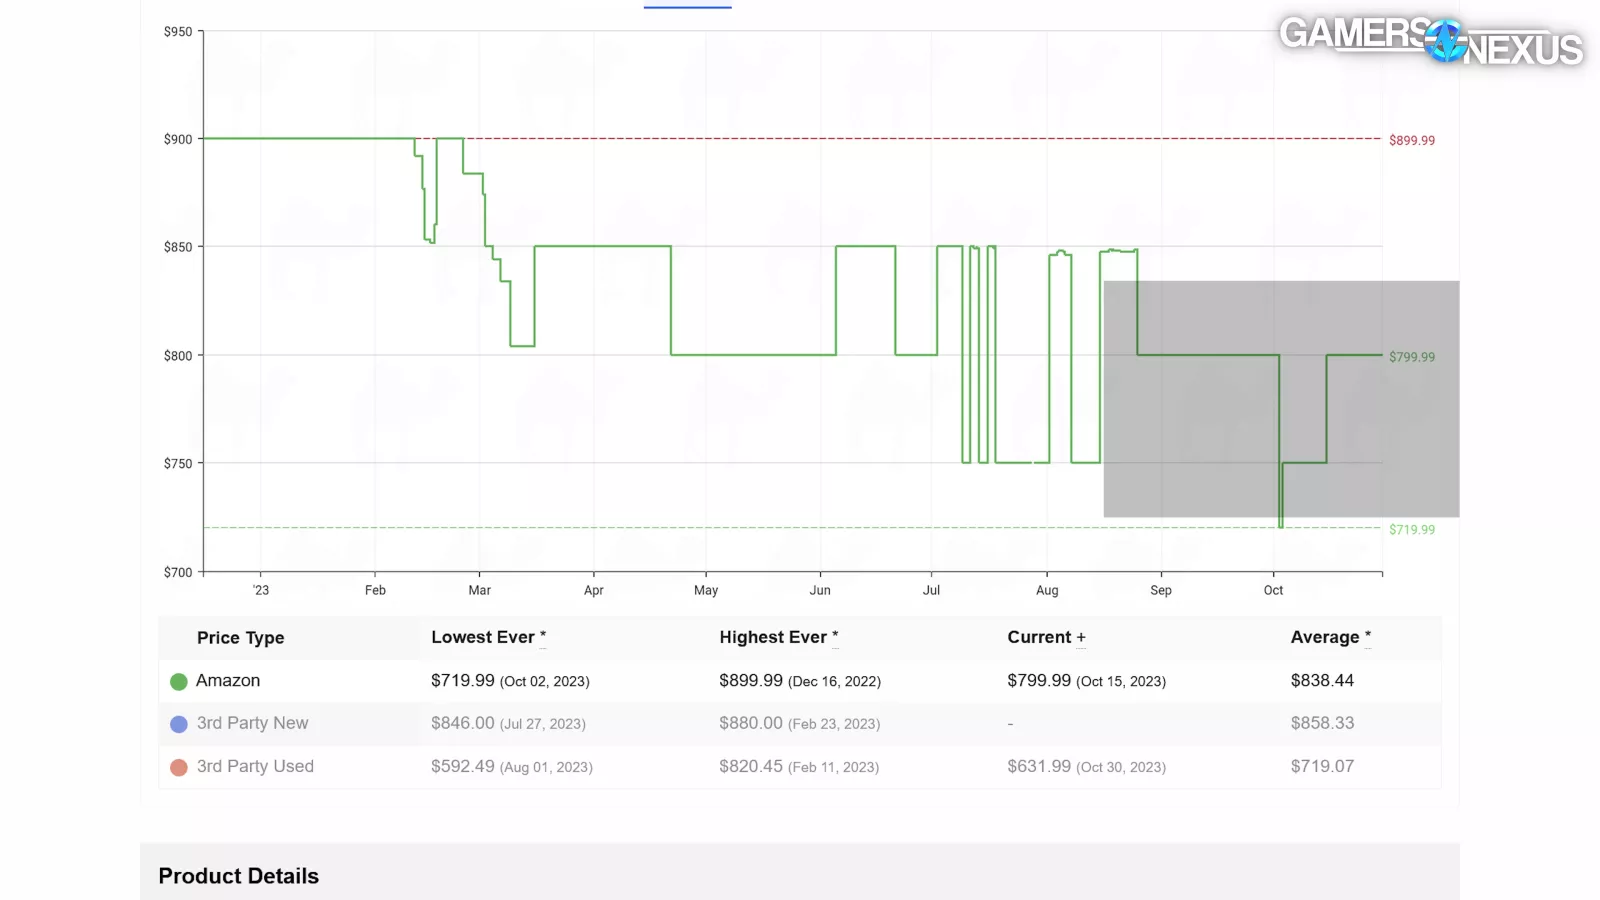
First off, looking at Camel Camel Camel, a price comparison engine, we happened to buy the cards right in the narrow dip above. It didn’t last long. The $850 baseline seems to be vanishing though, so that’s moving in the right direction.
AMD Radeon RX 7900 XT Pricing Update (2023 End of Year)
Doing a quick Newegg search for new-in-box and shipped-by-Newegg 7900 XT cards, factoring in instant promos but ignoring mail-in rebates and gifts, we ended up with these prices.
| RX 7900 XT | October 29, 2023 | October 13, 2023 |
| PowerColor Hellhound | $800 | $720 |
| Sapphire Pulse | $800 | $730 |
| ASRock Phantom Gaming | $800 | $740 |
| XFX MERC310 | $800 | $750 |
| ASRock Taichi | $820 | $820 |
| Gigabyte Gaming | (Out of stock) | $875 |
| ASUS TUF | (Out of stock) | $970 |
Most recently, the 7900 XT on Newegg seems to land at around $800. That’s unfortunate. It’s still better, but it was commonly available for $720-$750 a few weeks ago. The same is true of Amazon listings, and you can find the Hellhound on Amazon here.
NVIDIA RTX 4070 Ti Pricing Update (2023 End of Year)
| October 29, 2023 | October 13, 2023 | |
| Zotac GAMING Trinity OC | $770 | $770 |
| MSI Ventus | $800 | $800 |
| Gigabyte Windforce OC | $800 | $800 |
| ASUS TUF | $800 | $800 |
| MSI Ventus White | $800 | $810 |
| Gigabyte Eagle | (Out of stock) | $810 |
| MSI Ventus 3-Fan | $800 | $810 |
| ASUS ProArt | $830 | $820 |
| PNY VERTO | $800 | $820 |
| MSI Ventus White 3-Fan | $830 | $830 |
| MSI Gaming | $830 | $830 |
| MSI Gaming | $840 | $840 |
| ASUS ProArt 3-Fan | $840 | $840 |
| MSI Suprim | $850 | $850 |
| Gigabyte Gaming OC | $870 | $870 |
Looking at the 4070 Ti, prices are largely unchanged this past month. Overall, the 4070 Ti can commonly be found for around $800 -- so the 7900 XT at its new price is a direct competitor and, as of October 30th, doesn’t currently have a big pricing advantage. If it drops back to $720, it will. The few $770 4070 Tis that are out there would have an advantage.
NVIDIA RTX 4070 Pricing Update (2023 End of Year)
| October 29, 2023 | October 13, 2023 | |
| Zotac Gaming Twin Edge | $520 | $520 |
| Zotac Gaming Twin Edge OC | $550 | $550 |
| MSI Ventus | $550 | $550 |
| Gigabyte Windforce | $550 | $550 |
| MSI Ventus White | $550 | $560 |
| ASUS Dual | $600 | $600 |
| ASUS Dual OC | $600 | $600 |
| ASUS Dual OC White | $600 | $600 |
| MSI Ventus 3-Fan | $600 | $600 |
| MSI Ventus OC 3-Fan | $600 | $600 |
| Gigabyte Gaming | $600 | $600 |
| PNY VERTO EPIC-X | $600 | $600 |
| Gigabyte Eagle | $610 | $610 |
| MSI Gaming X Slim | $630 | $630 |
| ASUS TUF OC | $670 | $670 |
Next, we looked at the RTX 4070. You can definitely get it for under 600 dollars in the US. With a little timing, you should be able to get it for around $550 with relative ease. But there’s a more important alternative at this price class -- and it’s a close competitor to AMD’s 7900 XT.
AMD RX 6950 XT Pricing Update (2023 End of Year)
| October 29, 2023 | |
| XFX MERC 319 | $600 |
| ASRock Phantom Gaming | $600 |
| XFX MERC 319 | $620 |
| XFX MERC 319 (Variant) | $620 |
| (Amazon) AMD Reference | $680 |
The 6950 XT is almost completely gone at this point. We found 4 total first-party listings between Newegg and Amazon (update, 2/9/24 - some of these are no longer available and have been de-linked):
- ASRock Phantom Gaming RX 6950 XT on Newegg
- XFX RX 6950 XT MERC319 on Amazon
- XFX RX 6950 XT MERC319 on Newegg (no longer available)
- AMD Reference RX 6950 XT on Amazon
But AMD is almost definitely not making this card anymore. It’s on its way out. That’s unfortunate, because at $600, it’s a killer price as compared to the 7900 XT. But we still need to look at how the 7900 XT is today, especially since these cards will soon be gone and it’ll replace them.
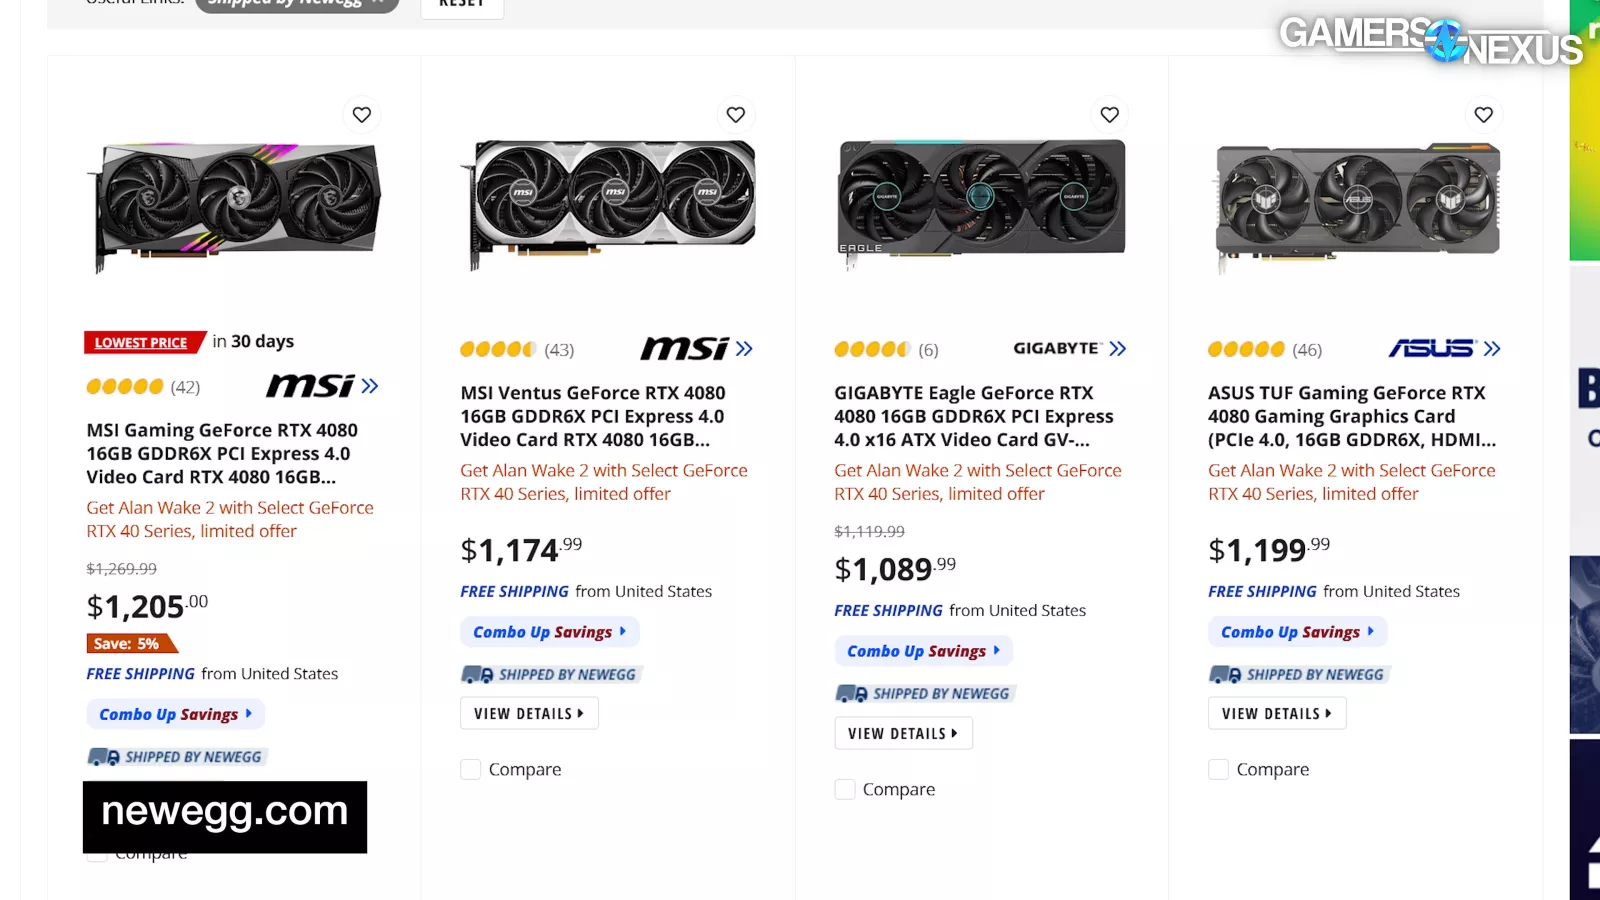
We also pulled-up the RTX 4080 -- and were shocked at how expensive it has remained.
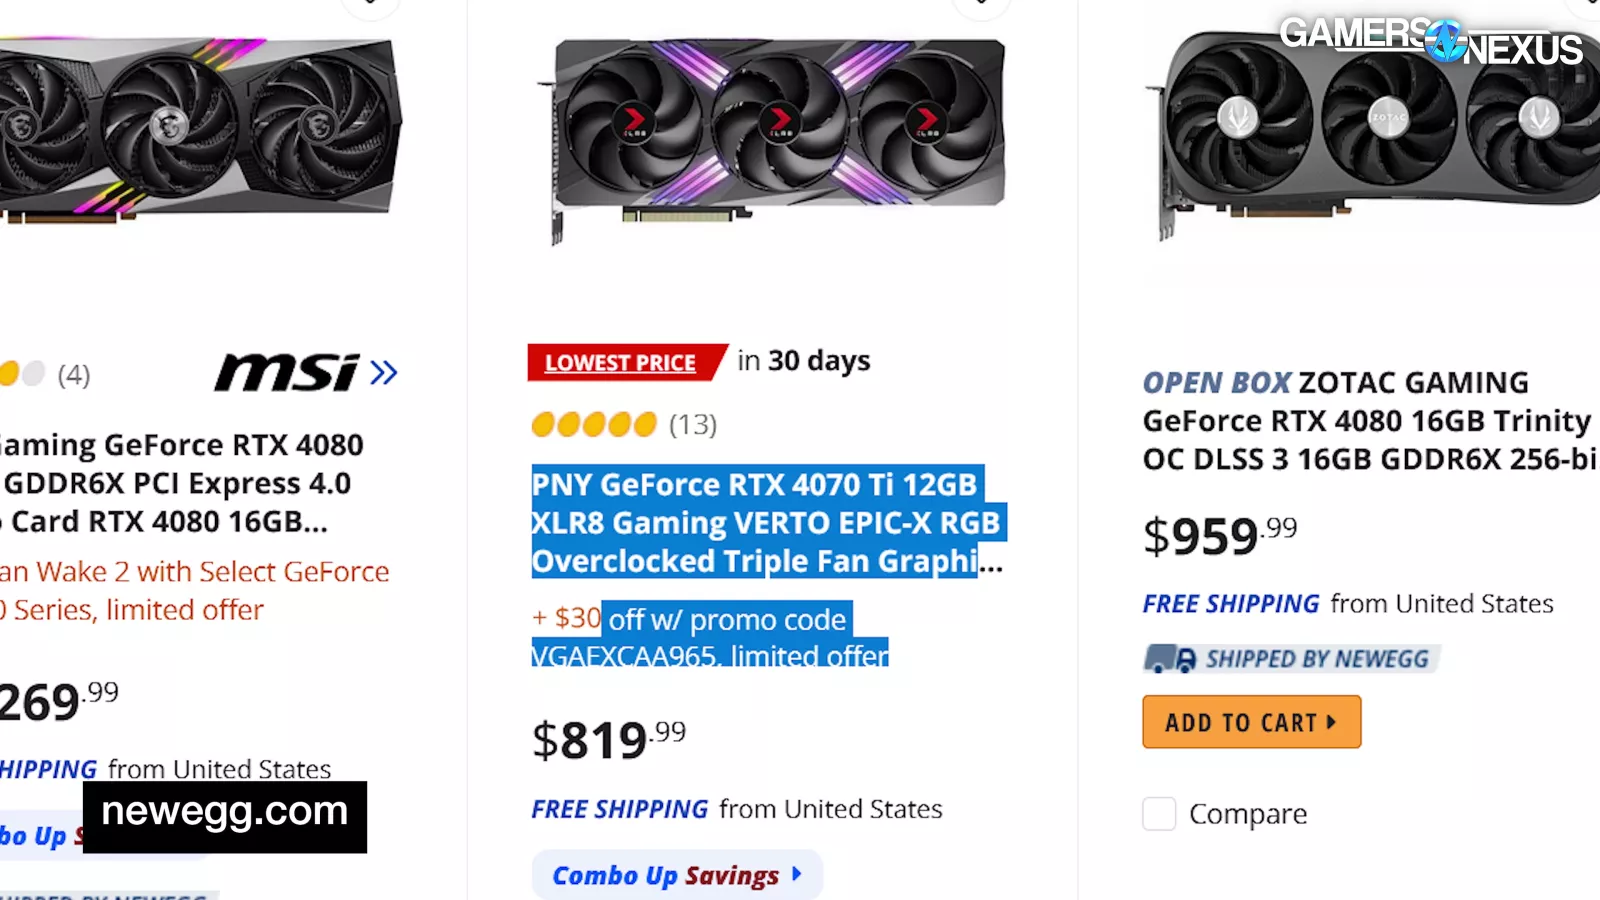
We also found it poetic that Newegg confused an RTX 4070 Ti with an RTX 4080, considering that’s what it originally was called.
AMD Radeon RX 7900 XT European GPU Price Trend
But we know all of you aren’t in the US, so we did our best to aggregate some data for Europe.
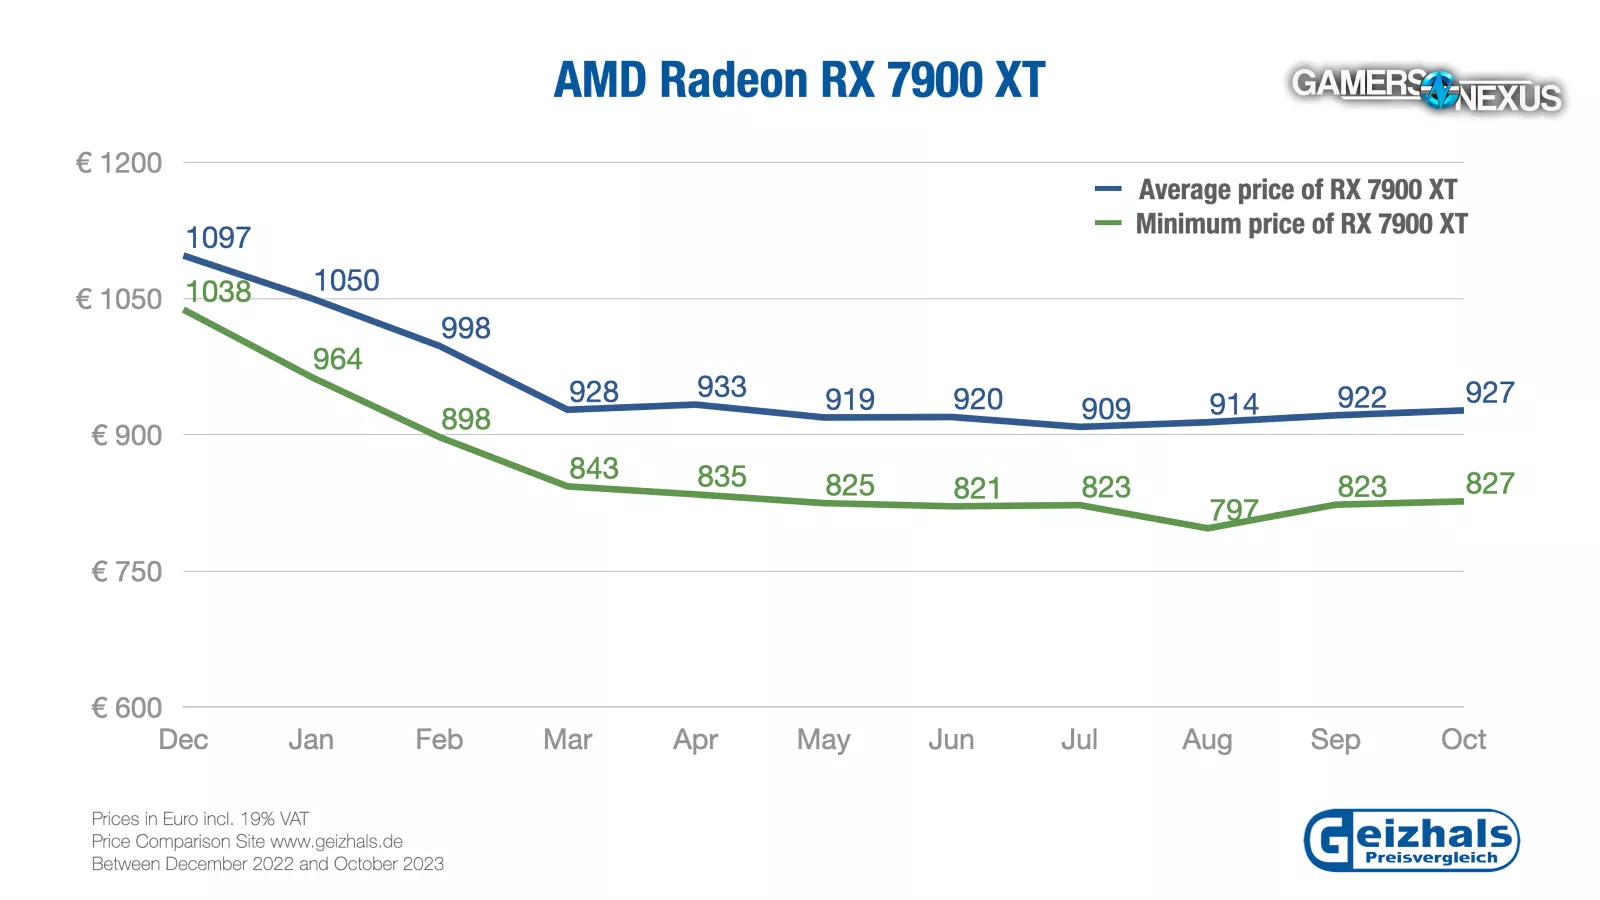
Geizhals caters to Germany, Austria, and Switzerland and provides mountains of pricing data and trend-line information. We asked Geizhals to utilize its price trend data to help us show the price reduction since launch, and they were awesome to quickly get us this chart. This chart includes 19% VAT, plus European pricing and being in Euros, so for our Americans in the audience: Europe has the bigger number.
It’s leveled-off, and is lower than launch.
Geizhals Price Data (Provided to GamersNexus) | 10/23
| Current Best Price(10/23) | Current Retailer Offers* Not inventory | |
| ASRock Radeon RX 7900 XT Phantom Gaming OC | 849 | 19 |
| ASRock Radeon RX 7900 XT Taichi OC | 912 | 18 |
| ASUS TUF Gaming Radeon RX 7900 XT OC | 919 | 46 |
| Biostar Radeon RX 7900 XT | 1069 | 7 |
| GIGABYTE Radeon RX 7900 XT Gaming OC | 927 | 33 |
| MSI Radeon RX 7900 XT Gaming Trio Classic | 1039 | 11 |
| PowerColor AMD Radeon RX 7900 XT | 899 | 3 |
| PowerColor Hellhound Radeon RX 7900 XT | 855 | 33 |
| PowerColor Red Devil Radeon RX 7900 XT | 915 | 27 |
| Sapphire AMD Radeon RX 7900 XT | 1214 | 1 |
| Sapphire Nitro+ Radeon RX 7900 XT Vapor-X | 908 | 45 |
| Sapphire Pulse Radeon RX 7900 XT | 840 | 45 |
| XFX AMD Radeon RX 7900 XT | 870 | 5 |
| XFX Speedster MERC 310 Radeon RX 7900 XT | 859 | 26 |
| XFX Speedster MERC 310 Radeon RX 7900 XT | 835 | 32 |
Geizhals shared data with us that showed the best-priced 7900 XTs in its region include the XFX MERC, with 32 offers, and the Sapphire Pulse. PowerColor might not have the same distribution advantages in Europe, as its Hellhound is currently 20 Euros over the XFX card there.

AMD RX 7900 XT GPU Benchmarks (2023 Revisit)
This testing was performed with our standardized GPU test bench (unless otherwise noted). You can learn more about our test benches here.
| Part | Component | Provided By |
| CPU | Intel Core i7-12700KF Overclocked (4.9GHz P-Cores, 3.9GHz E-Cores) | Bought by GN |
| Motherboard | MSI Z690 Unify | MSI |
| RAM | DDR5-6000 G.Skill Trident Z (manually tightened timings) | G.Skill |
| Cooler | Arctic Liquid Freezer II 360 @ 100% Fan Speed | Bought by GN |
| PSU | EVGA 1600W T2 Supernova Corsair AX1600i | EVGA Corsair |
| OS | Windows 11 | Bought by GN |
Let’s go over the quick competitive comparisons before we get into the detailed charts.
NVIDIA RTX 4070 Ti vs. AMD RX 7900 XT (2023 Revisit)
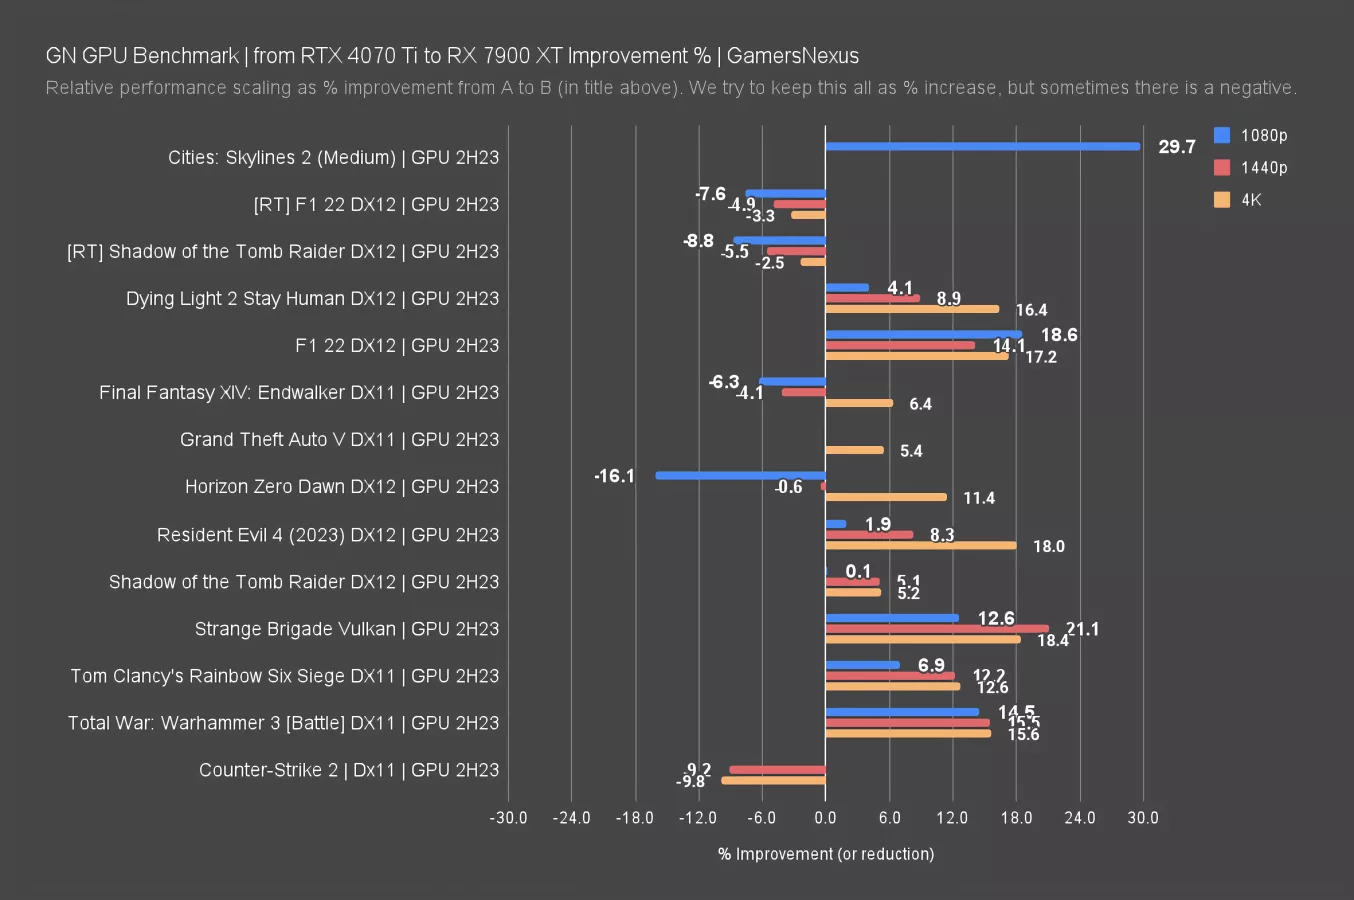
This chart shows a top-level recap of AVG FPS scaling across several recently tested scenarios. A bar to the right is improvement for the 7900 XT, a bar to the left is percentage performance reduction against the RTX 4070 Ti. If the bar goes left, the 4070 Ti wins.
The RX 7900 XT has the majority of victories, and most of them are double-digit victories. The Skylines 2 test was particularly wild, although that game is one of the worst-optimized games we’ve tested in a long time. But it’s still a valid lead.
In ray tracing tests, the 7900 XT runs 3% to 9% worse. The lower NVIDIA advantages are at 4K, where NVIDIA’s architectural choices have limited the 4070 Ti’s ability to continue scaling. The 4070 Ti also had two break-outs in rasterization: In Final Fantasy at 1080p and 1440p, the card scaled further before hitting the CPU limit. The 7900 XT seemed to encounter a mixture of a driver overhead limitation and CPU limitation. It appears there’s a driver overhead advantage in this particular title with this CPU for NVIDIA.
In Counter-Strike 2, NVIDIA just has a legitimate advantage.
This re-establishes that NVIDIA maintains a ray tracing advantage, but that AMD holds a strong advantage in both rasterization performance and overall capabilities at higher resolutions like 4K. The biggest disadvantage was its price, which WAS resolved when it was $720-$750, as that had the 7900 XT consistently cheaper than the 4070 Ti. Right now, they’re about the same price. The 7900 XT is still advantaged in these charts, but if you went heavy on the ray traced games, NVIDIA would be the advantaged card.
NVIDIA RTX 4070 vs. AMD RX 7900 XT
Let’s look at the 4070 vs. the 7900 XT. We’re adding this so that you know what you’d gain by spending an extra $270 or so.
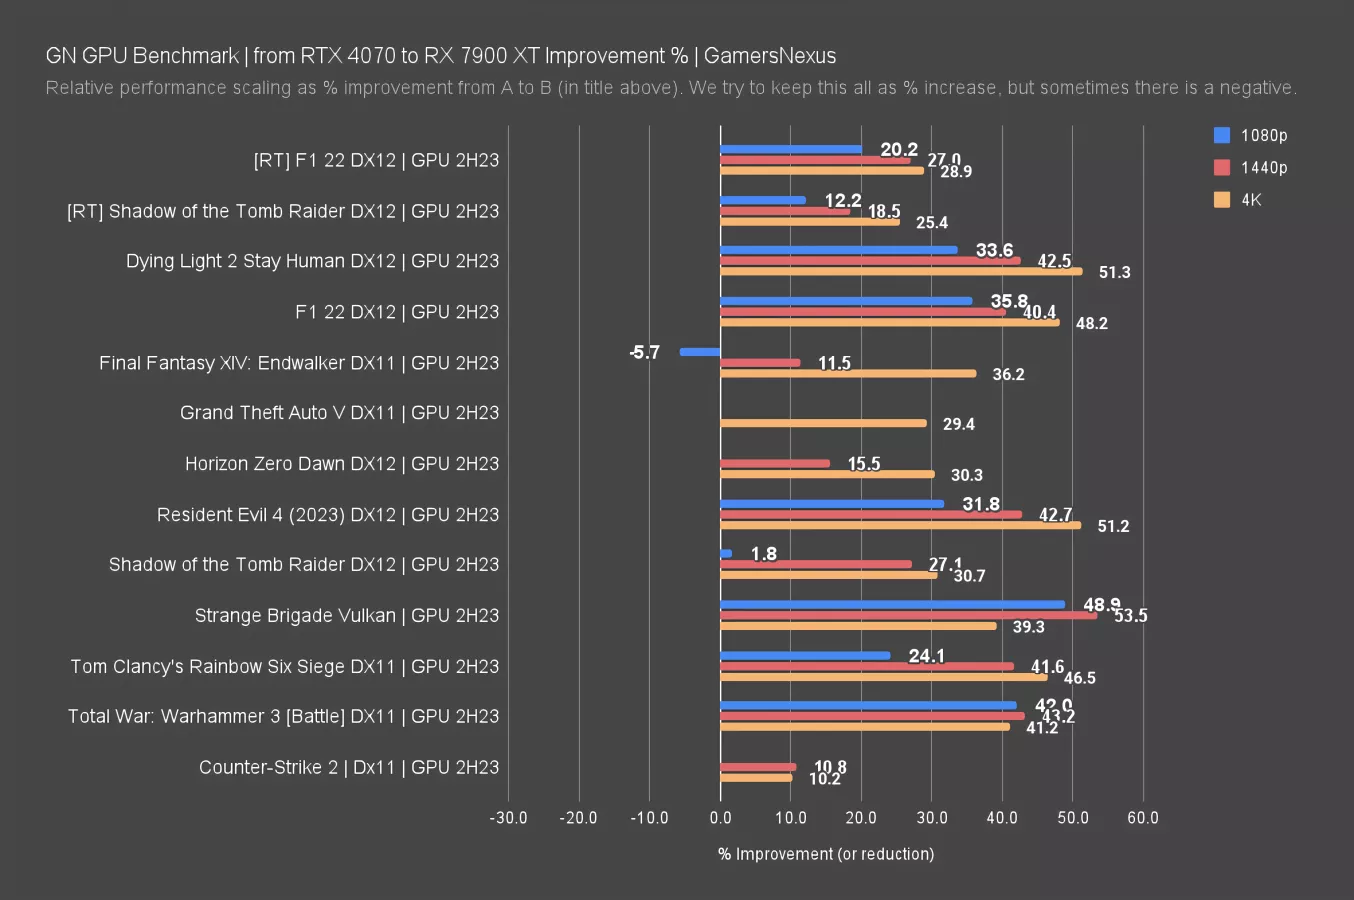
The 7900 XT maintains an advantage in the 40-50% range for many of these games when at 4K. The 1080p results are often CPU-bound, hence lower scaling.
In ray tracing, we’re seeing a maximum of 29% advantage for the 7900 XT. The 4070 holds a 6% lead in Final Fantasy 14 for our testing, indicating the same CPU-bound behavioral advantage that we saw in the 4070 Ti.
Overall then, whether we look at the cheapest or the average cost from our earlier tables, the price increase to $720-$750 is about 35-38% for the 7900 XT for a 40-50% increase in 4K and 1440p performance, or if we look at the new-new pricing of $800, the 7900 XT is about 45% more expensive.
RX 7900 XT vs. RX 7900 XTX
We’ll next look at the 7900 XTX against the 7900 XT.
GN GPU Pricing Update | RX 7900 XTX | Oct. 2023
| October 29, 2023 | October 13, 2023 | |
| ASRock Phantom Gaming | $950 | $890 |
| PowerColor Hellhound | $950 | $900 |
| Sapphire Pulse | $950 | $900 |
| MSI Gaming | $980 | $970 |
| ASUS TUF | $1,080 | $980 |
| Sapphire Nitro | $1,030 | $980 |
| Gigabyte Gaming | $1,030 | $1,030 |
| ASRock Taichi | $1,100 | $1,040 |
| XFX MERC310 | $930 | (No data) |
The pricing here was as low as $890, with general availability at $900. Now it’s generally available at $950, with several cards boosting over $1,000. We’re not sure what happened, but everything jumped for AMD’s card prices.
AMD RX 7900 XT vs. AMD RX 7900 XTX Comparison
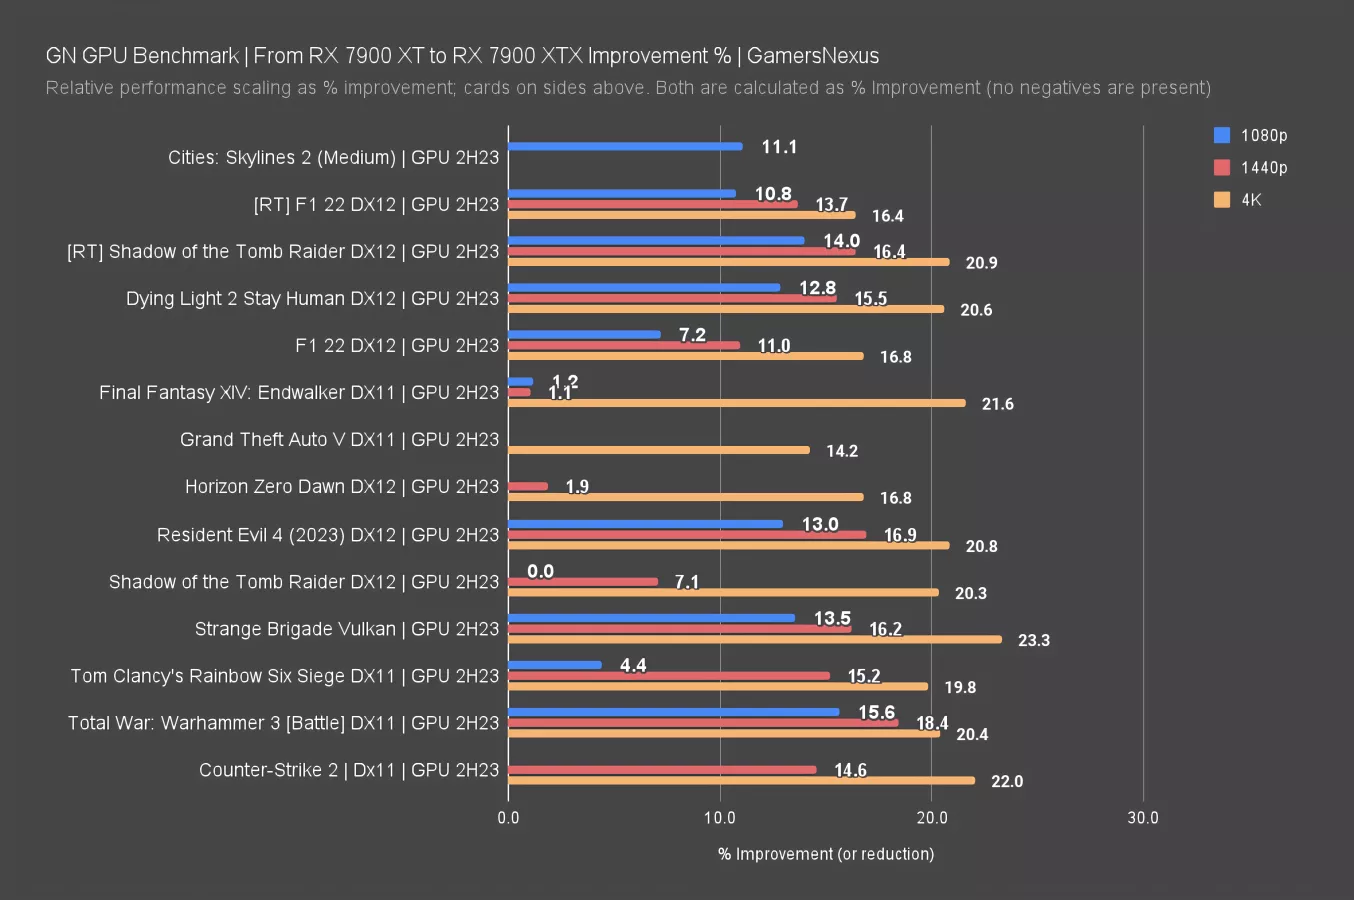
Here’s a comparison chart. The bar represents the percent uplift of the AMD RX 7900 XTX over the XT.
Generally speaking, we’re seeing about a 20% uplift at 4K from the upgrade. 1440p tends to be around 15%, with 1080p less reliable since several of these games can start truncating the results.
At the October 13th pricing, that would have been a $170 increase to buy the XTX, or 24% more money cheapest-to-cheapest in exchange for 20% more 4K performance. Now, at $800 baseline against $950 baseline, that’s a 19% cost increase.
That’s not as linear as we see lower down the stack, so you’re starting to pay the “just the best” premium for the XTX. Remember that you’d also need to begin considering the RTX 4080, as it begins to pop-up nearer the XTX than the XT.
Overall, we’d say the value of the RX 7900 XT is stronger than that of the 7900 XTX if at those $720-$750 prices, evidenced by the more linear performance scaling than shown here. But as they draw closer, the upsell scenario reappears.
That’s a better spot than the XT was in at launch for relative value against competitors, but it was nearly an undeniable victory at the price two weeks ago -- other than the 6950 XT as an alternative.
But we want to make sure the cheapest options are actually any good, so we ran some basic thermal, power, and frequency tests of the Hellhound.
PowerColor RX 7900 XT Hellhound Comparison

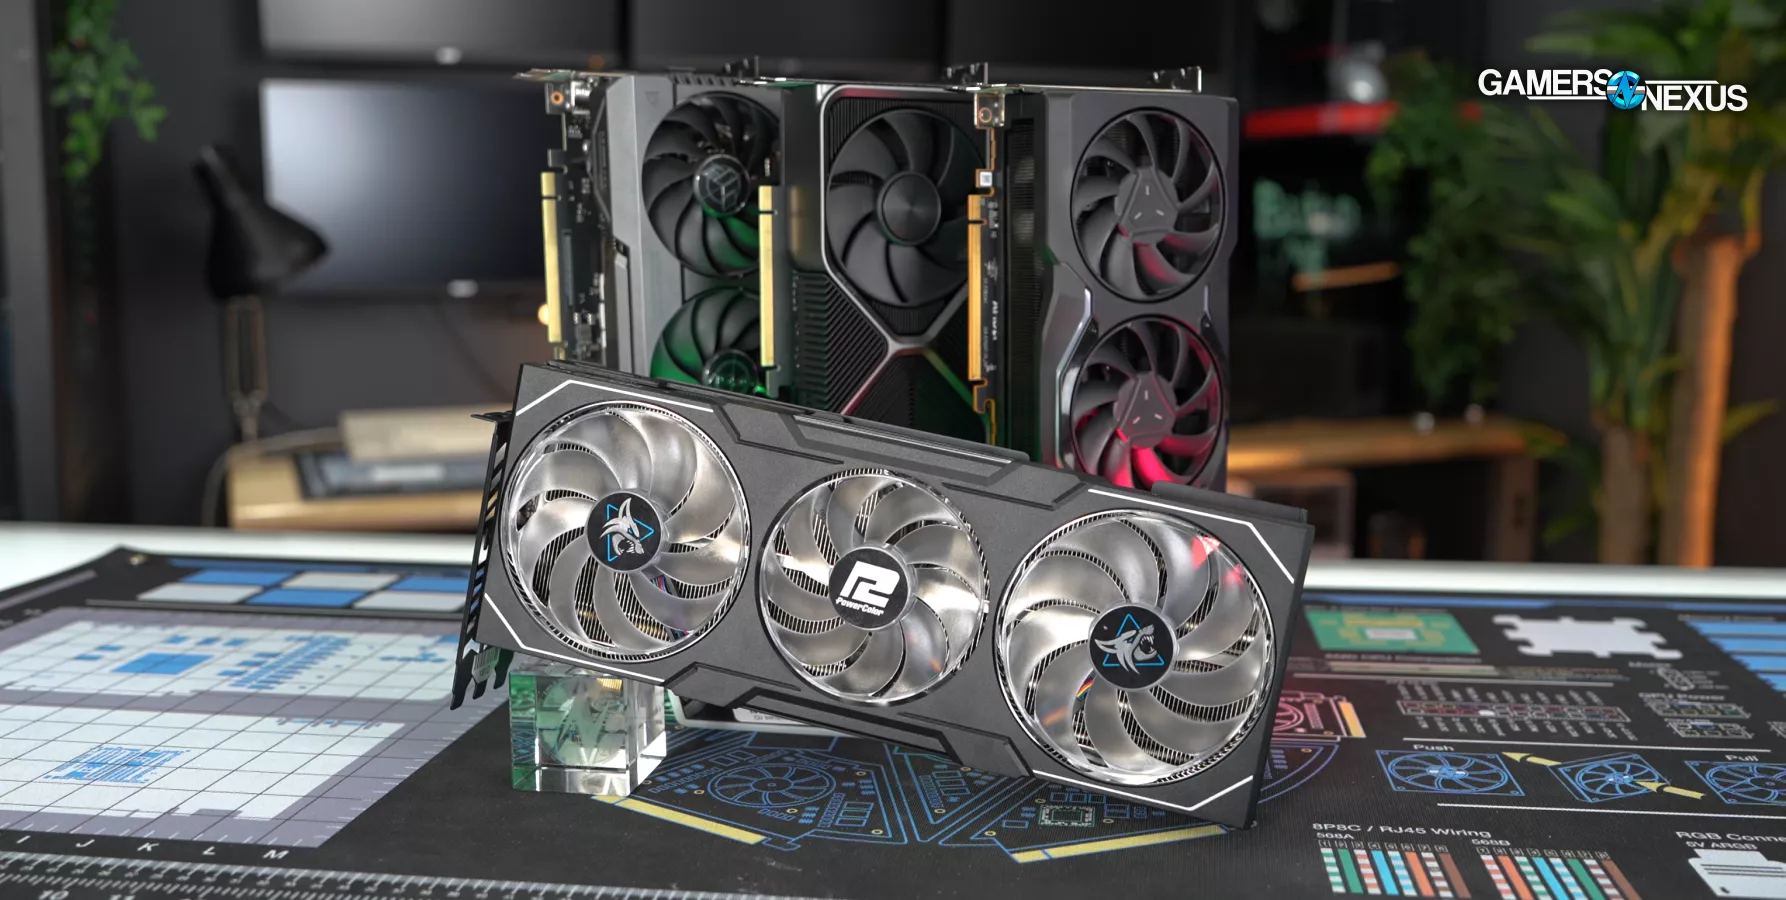
GPU performance in games is largely the same between cards. Typically, the difference between something like a Sapphire Nitro, PowerColor Hellhound, Gigabyte Windforce, or other add-in board partner card ("board partners" or "AIBs") comes down to what we'd classify as quality of life features. These are things like thermals, noise, VBIOS options, overclocking features, power consumption, and visuals.
Strictly speaking to gaming performance, it's rare to see more than a 1-3% swing from one partner model to the next. The better place to focus is on these quality of life features when weighing alternatives.
The next section will specifically look at the Hellhound in these departments. Again, we bought this particular model because it was the cheapest one, so we want to make sure that (aside from hitting the basics of gaming performance targets) it still runs well.
PowerColor Radeon RX 7900 XT Hellhound Frequency
This card has dual VBIOS, which is typically a feature associated with more expensive cards. That’s great to see, especially because it gives you a backup in case the firmware ever gets bricked.
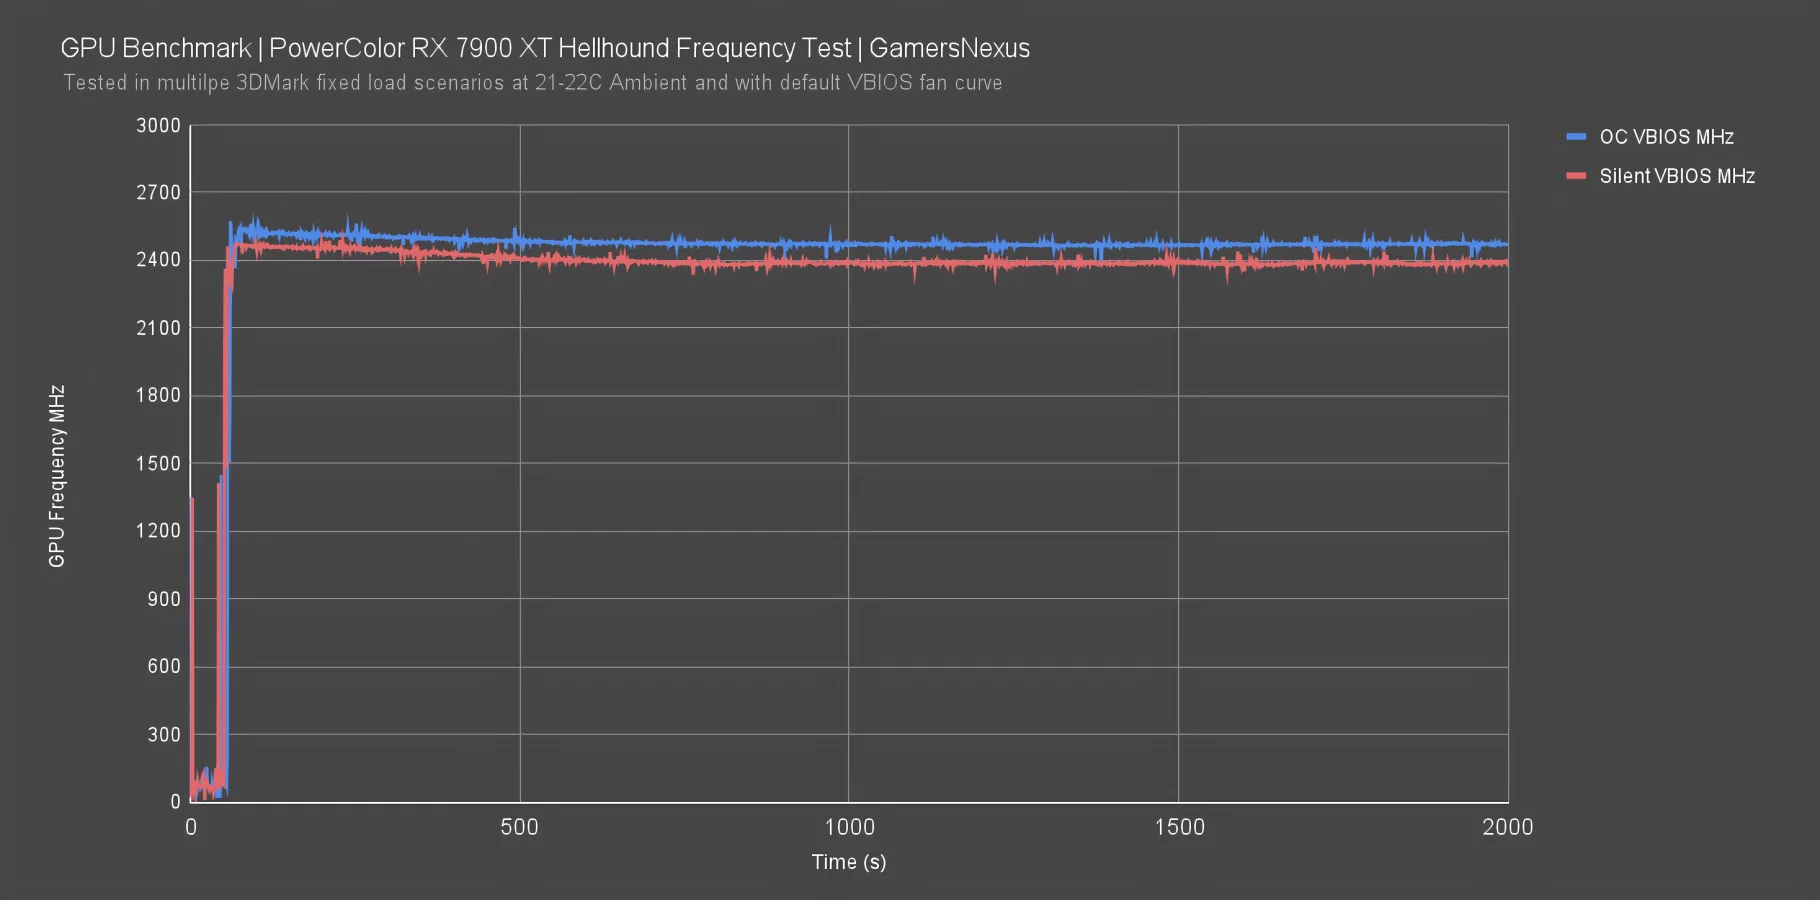
Quickly evaluating the frequency, we found the OC VBIOS ran at about 2484MHz when at steady state, so it drops around 90MHz from start due to heat gain. The Silent VBIOS appears to work this time -- we’ve had issues with PowerColor messing that up in the past -- and the clocks drop to 2390MHz. This is a big reduction, but is intended to reduce fan speed by reducing heat load from the GPU. We’d strongly recommend starting with OC, which is default from the factory. If it bothers you, you can always set it to silent (just reboot in between).
AMD Radeon RX 7900 XT Thermals
Thermal performance has long been a challenge for partner models with AMD’s more recent generations -- mostly for hotspot thermals.
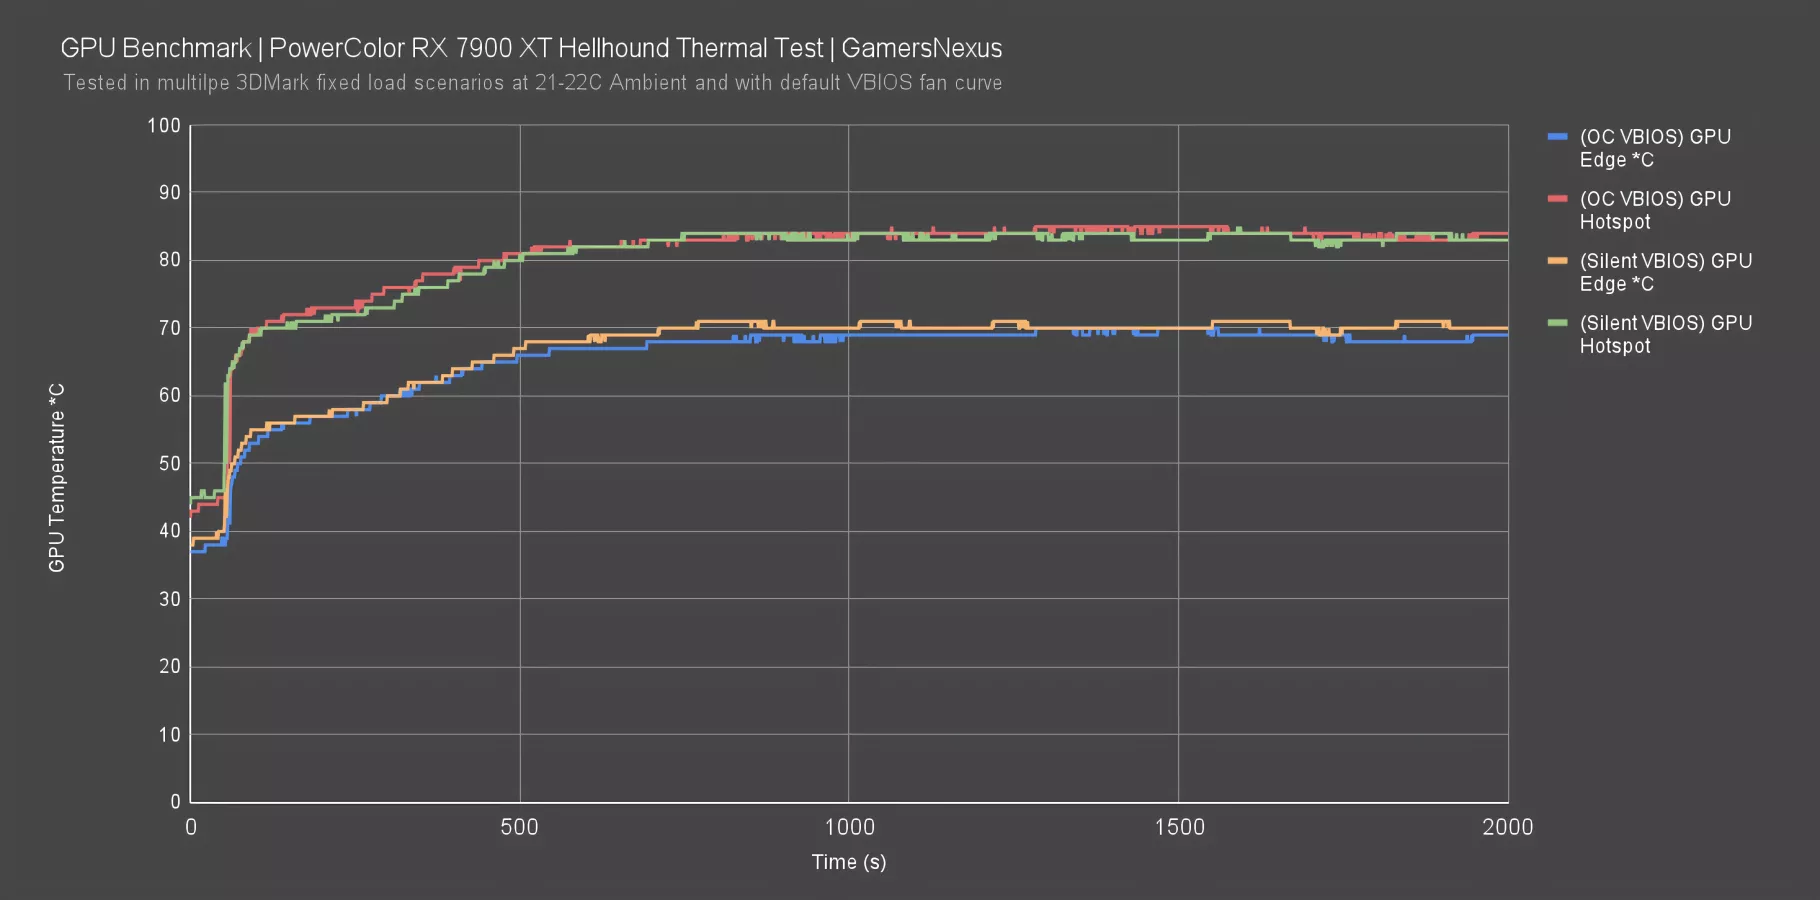
In this test, the OC VBIOS had the card running at about 70 degrees Celsius edge temperature, with hotspot at about 84 degrees. That’s well within spec -- far better than we’ve seen on some of the reference designs. It’s not the best performer we’ve encountered and is less capable than the Nitro, but it’s also the cheapest we’ve tested so far and it’s still performing in a way that doesn’t concern us when it comes to thermals.
The silent VBIOS doesn’t change the temperature much, but that’s because PowerColor dropped frequency. Fan speed actually only came down by 3% here as well, so there’s more they could do to properly capitalize on the word “silent” in their VBIOS naming.
AMD Radeon RX 7900 XT Power Consumption
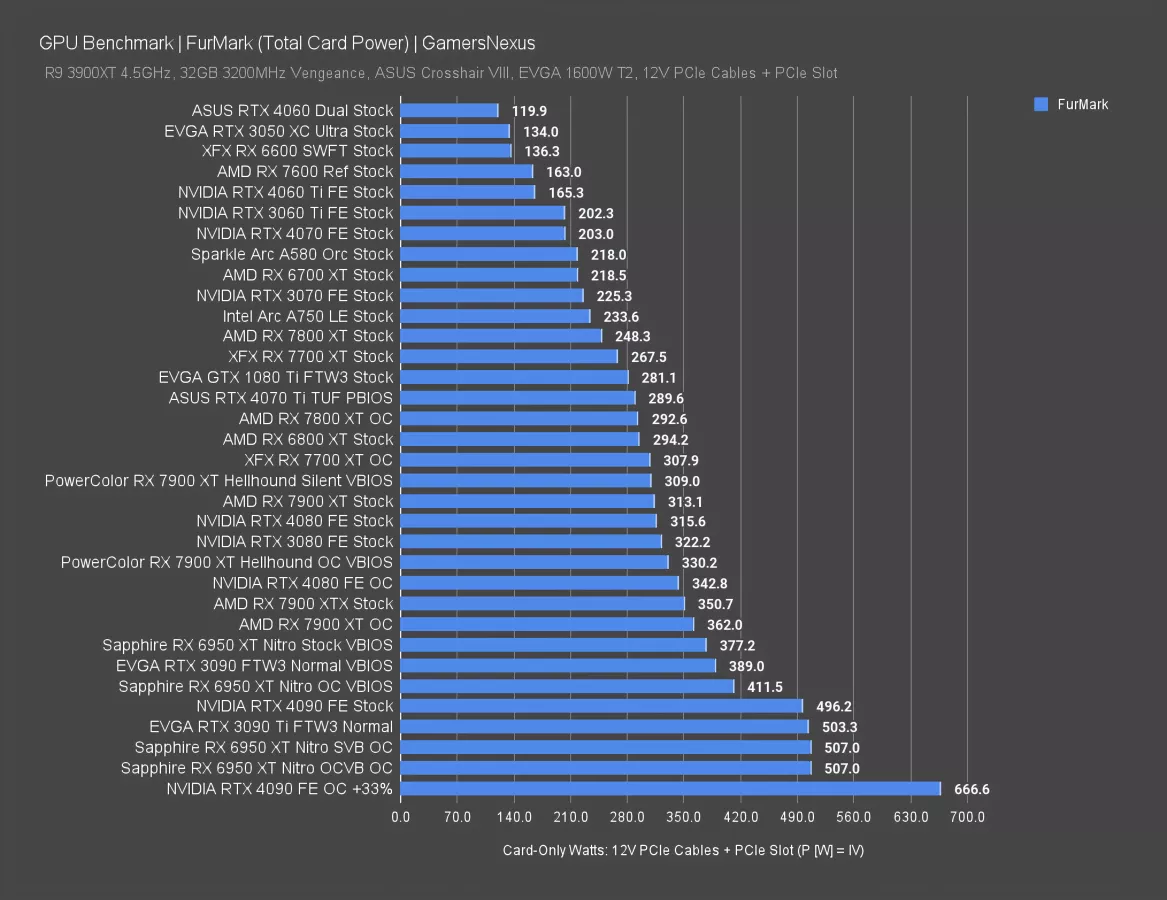
For power consumption, the RX 7900 XT reference card was at about 313W, with an overclock on it landing at 362W. The Hellhound ran at 309W for the silent VBIOS and 330W on the default OC VBIOS (without overclocking though, that’d naturally increase further).
The RTX 4070 Ti ran at 290W in the TUF’s default Performance VBIOS, significantly lower than the 330W we’re seeing on the default Hellhound -- but that’s part of the exchange for the price advantage of the XT. As for the XTX, the reference model pulled about 351W when stock.
AMD Radeon RX 7900 XT Game Benchmark Recap
We know a lot of you like a flood of data, so we’ll briefly look at some full gaming charts. To get these in full depth, check our recent RX 7800 XT review or our previous 7900 XT review. We’ll just speed through some here.
Starfield GPU Benchmarks
We’ll look at Starfield first, a game we ran full standalone GPU benchmarks for previously. We also published an optimization guide on this site. This one has had an overall AMD advantage for GPUs.
Starfield 4K/High Benchmarks
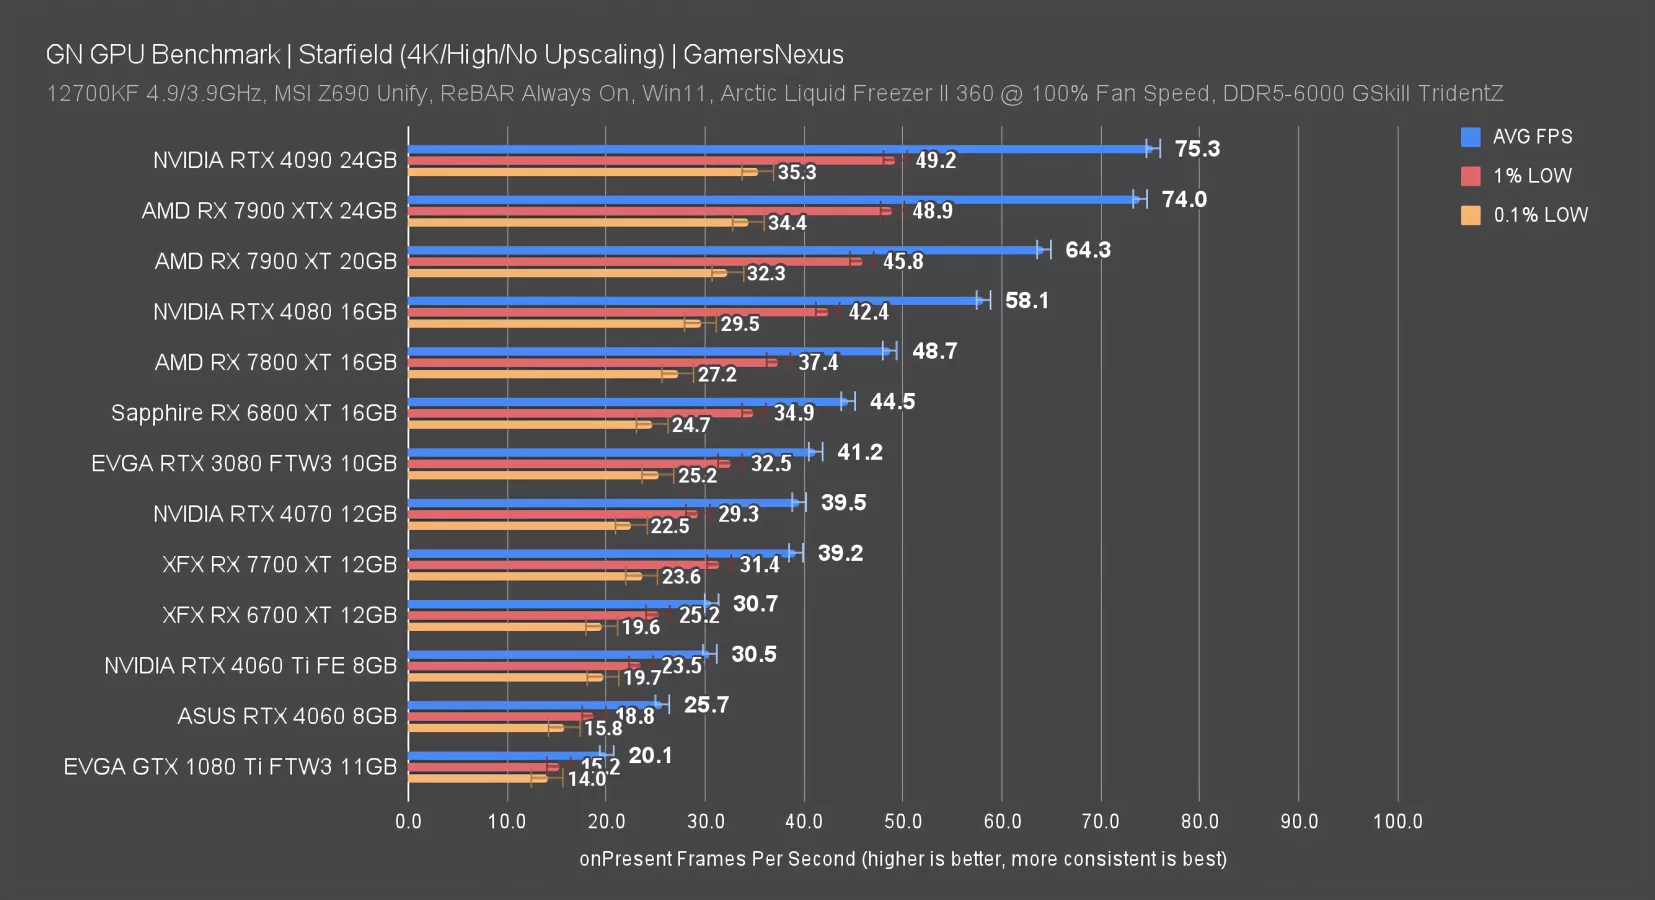
In Starfield at 4K/High, we had the 7900 XTX at 74 FPS AVG and the 7900 XT at 64 FPS AVG. That’s a 15% improvement with the XTX. The 4080 is left in the dust by the 7900 XTX, which has a 27% lead. The XT has an 11% lead.
The XT shows that it can definitely be a 4K gaming card, especially without ray tracing. Against something cheaper, like the 7800 XT, we’re seeing a 32% lead for the 7900 XT for about $300 more. That’s a sharp loss in performance-per-dollar with the 7900 XT, but it also moves performance into a different category.
Starfield 1440p/High Benchmarks
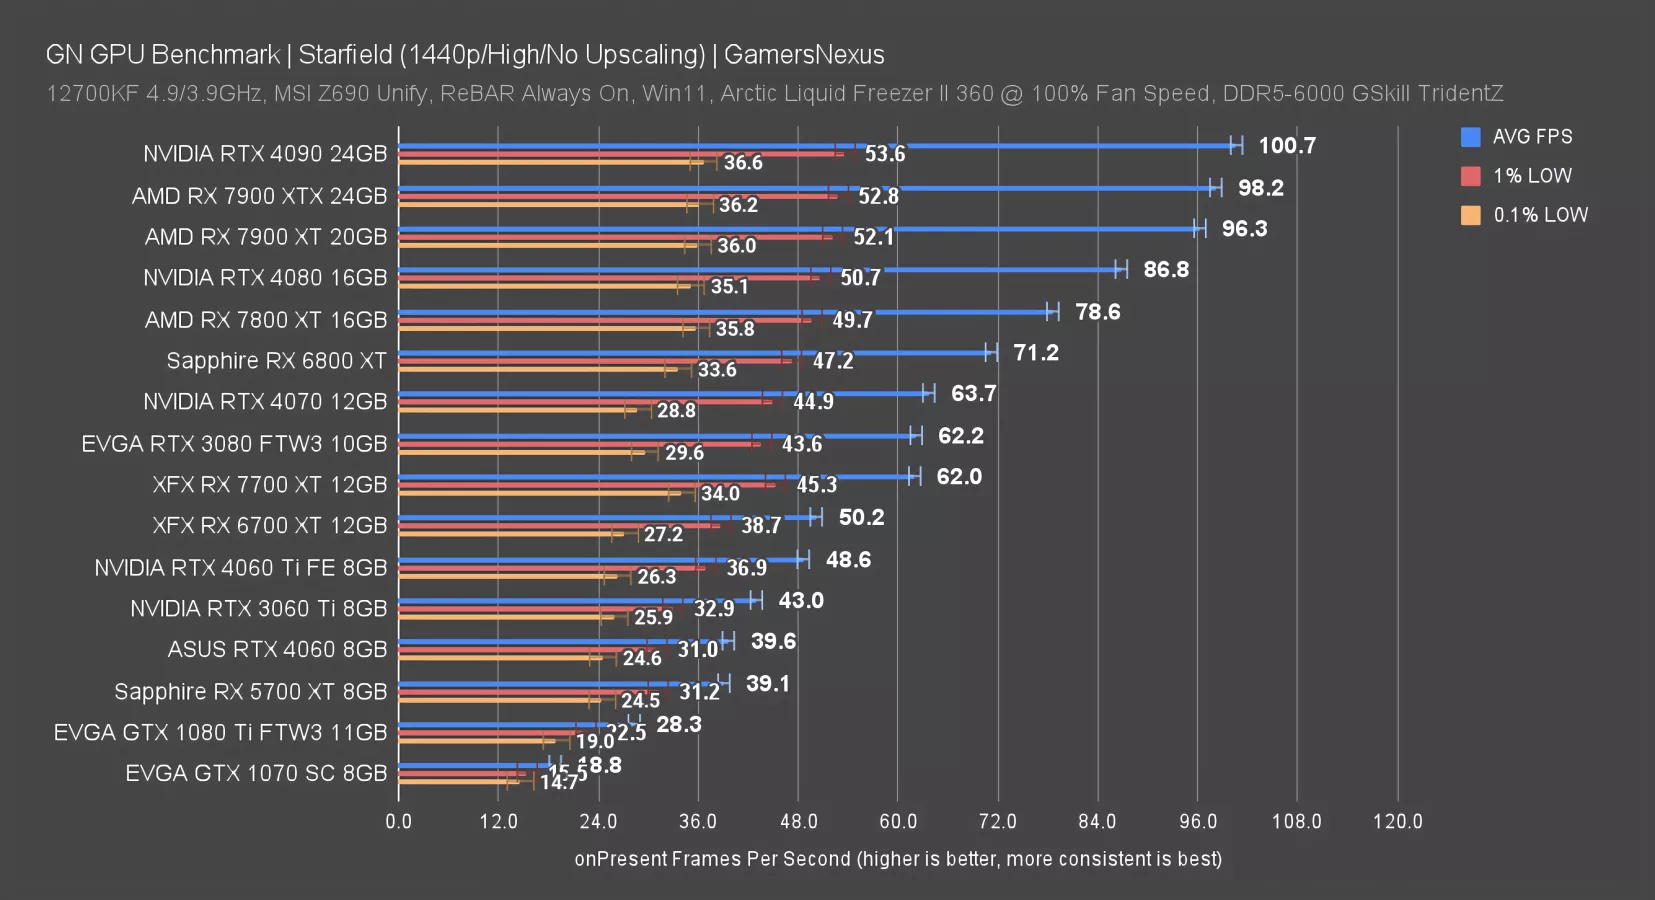
At 1440p, the 7900 XT and XTX are about the same. That’s because we’re now CPU-bound in this title.
Cities: Skylines 2 GPU Benchmarks
Let’s briefly look at the impressively buggy Cities: Skylines 2, which has bugs as bad as inverse graphics settings at higher presets. We just ran a full benchmark test and graphics comparison for this game that you can check out here.
Cities: Skylines 2 1080p/Medium Benchmarks
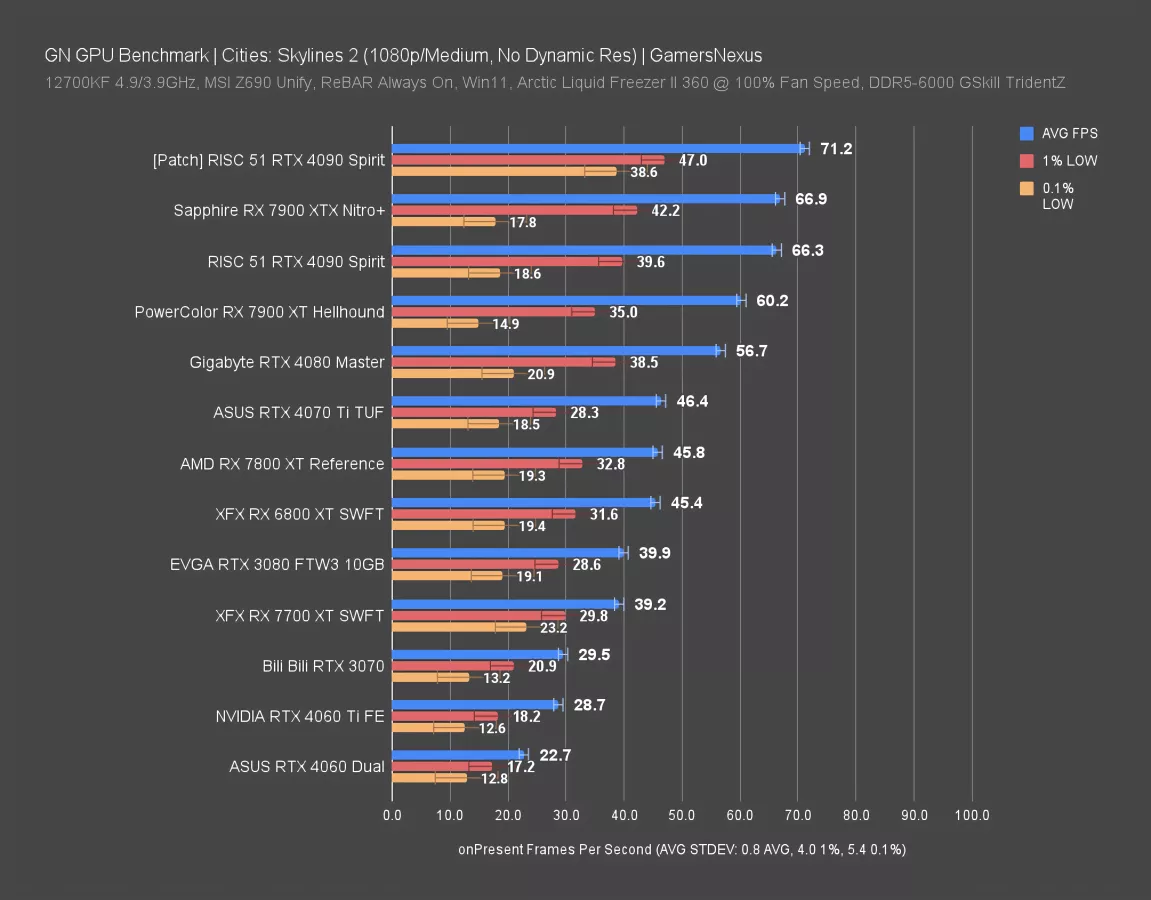
This starts at 1080p -- and don’t get us wrong: It won’t go up from here. The game is functionally unplayable at higher resolutions. It’s like 2009 all over again.
Before the patch, the 7900 XT was around 60 FPS AVG with these settings. Lows are all over the place, but that’s the game and it’s universally true for the cards. The XTX is about 11% better here. The lead over the 4070 Ti is about 30%, as we showed earlier. The 7800 XT gap is similar: $300 less would land you at 46 FPS AVG with these settings instead. The 4080 is down at 57 FPS AVG.
(Ray Tracing) F1 2022 GPU Benchmarks
We’ll look at F1 2022 now, but using ray tracing for the testing.
F1 2022 1440p/Ultra Benchmarks with Ray Tracing
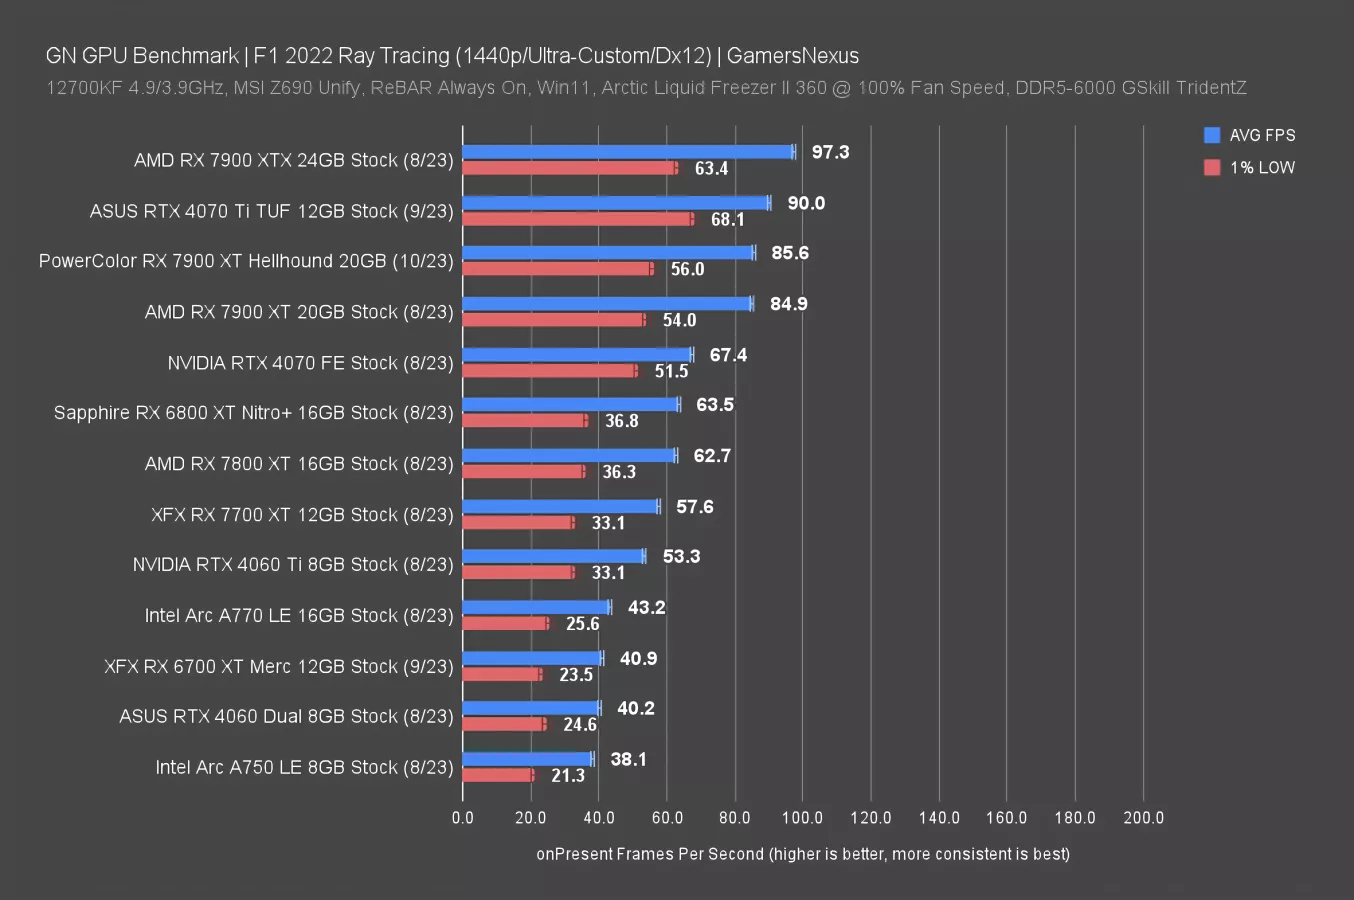
At 1440p ultra with ray tracing, the 7900 XT ran at about 85-86FPS AVG. That has the Hellhound just behind the 4070 Ti here, so we’re seeing the ranks flip. As expected, the 4070 Ti holds an advantage with RT tests. That’s about 5% for the 4070 Ti. The XTX is about 14% ahead of the XT here.
Shadow of the Tomb Raider GPU Benchmarks
Shadow of the Tomb Raider 4K/High Benchmarks
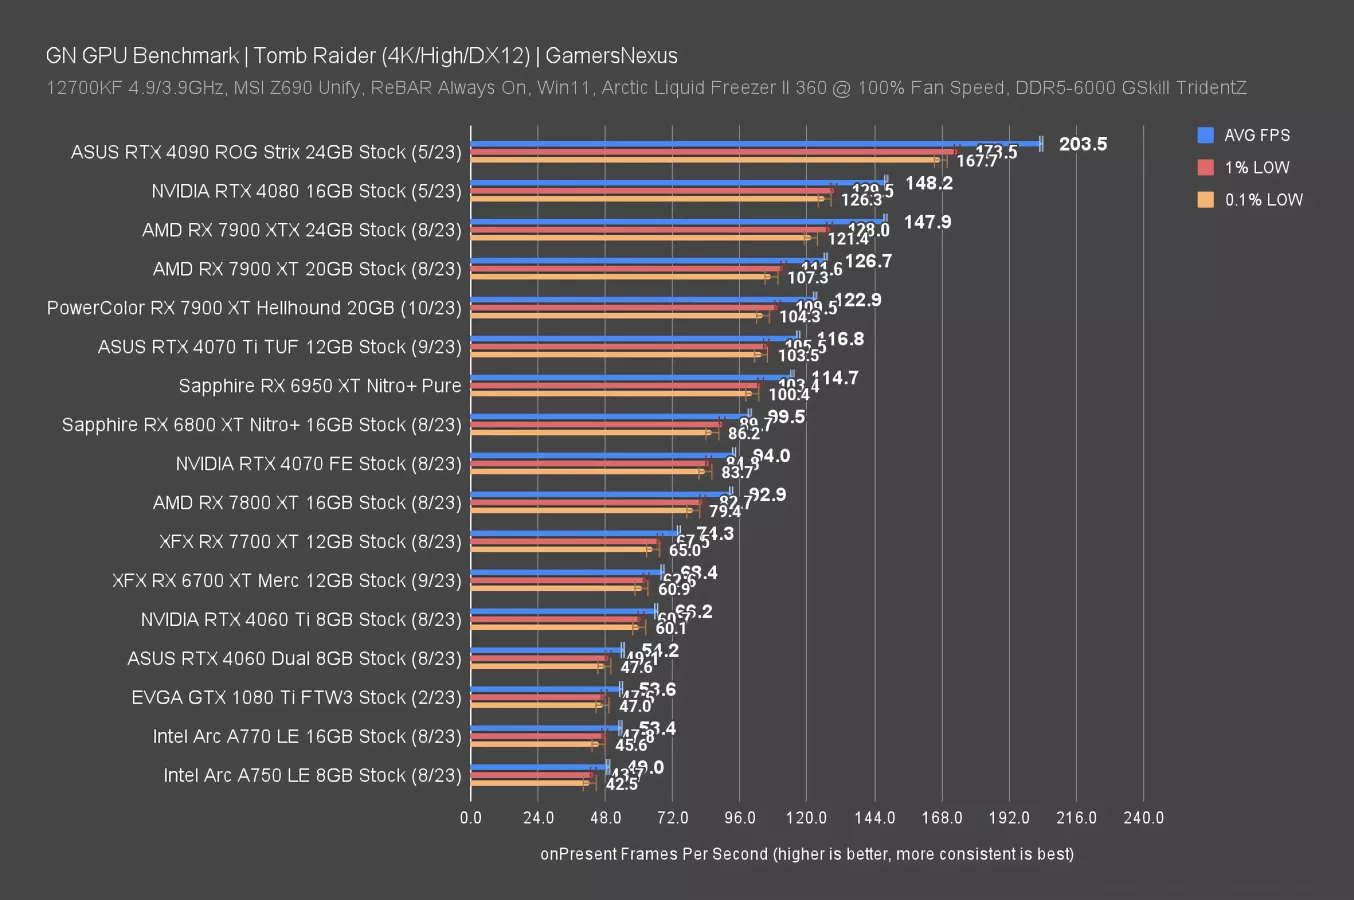
In Shadow of the Tomb Raider at 4K/High, the RX 7900 XT ran at about 123-127FPS AVG. That has the XTX about 17% ahead. The RTX 4080 is roughly tied with that, with the 4090 establishing a ceiling. The 4070 Ti isn’t too far back, with the 7900 XT ahead by 5% to 8.5%, depending which card it is. The 6950 XT remains compelling value here, with nearly equal performance to the 4070 Ti but a $200 cheaper price.
Baldur’s Gate 3 GPU Benchmarks
We’ll quickly look at Baldur’s Gate 3 now. This game isn’t intensive enough for a card like the 7900 XT to be fully leveraged, but that’s the point -- that’s why we’re showing this game.
Baldur’s Gate 3 4K/Ultra Benchmarks
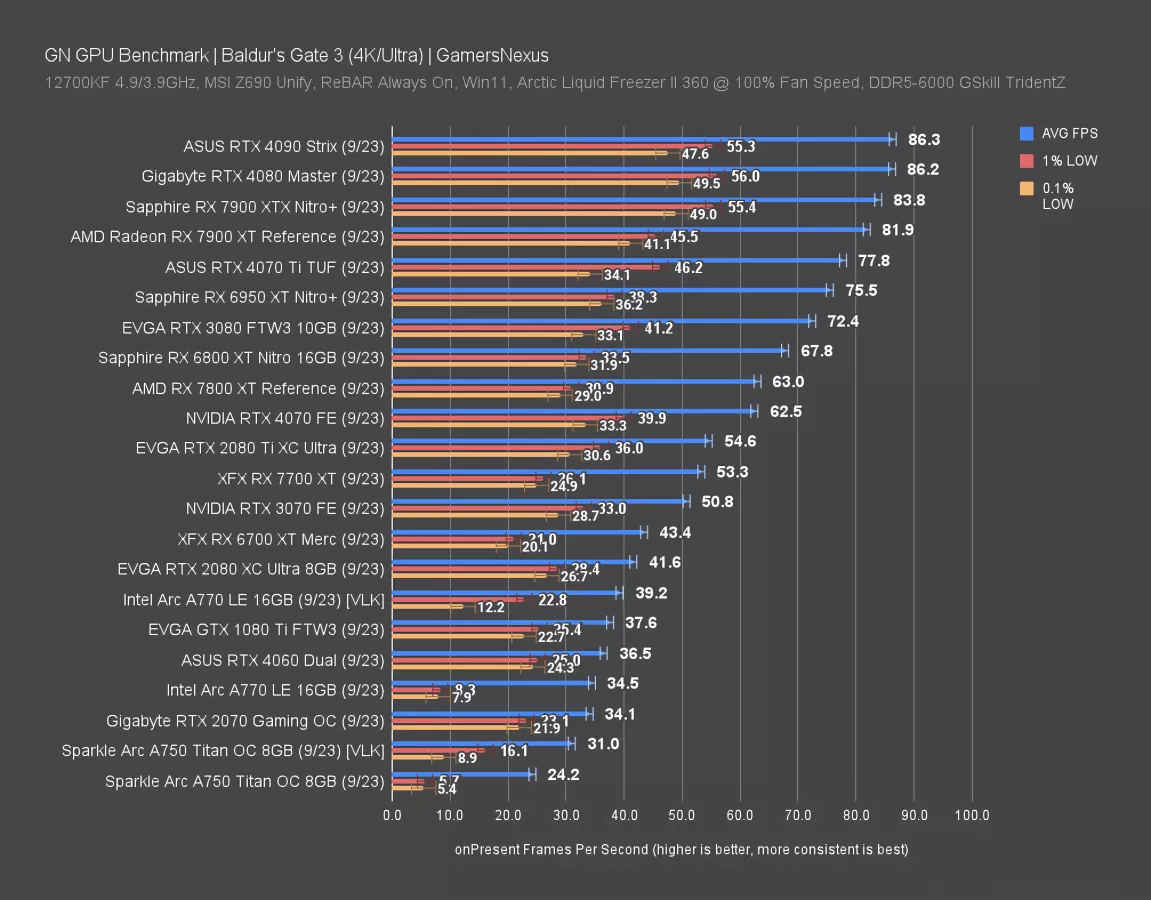
At 4K/Ultra, the 7900 XT is CPU-bound and ranked alongside the 7900 XTX, RTX 4080, and RTX 4090. The 4070 Ti and 6950 XT are nearby. We wanted to show this chart because it helps put into perspective what you really need: If you’re playing less intensive games like this primarily, you could save a lot of money by dropping down to something like a 6800 XT, 7800 XT, or RTX 4070. All of these are still relatively high-end cards, but with massive cost reductions.
Conclusion on the AMD RX 7900 XT
When we purchased the RX 7900 XT Hellhound, it was one of the best values for a high-end, current-generation card you could buy. We were excited about the card at that price point, but that didn’t last. It quickly rose from $720 to $800. The only reason it’s worth repeatedly mentioning is because we’re highly suspicious of the price climb in such close proximity to Black Friday, which is, of course, America’s most sacred holiday when we celebrate consumerism. We wouldn’t be surprised if the cards drop again. If they do, and if the competition doesn’t similarly drop, then the 7900 XT would become the best value in its price class.
Currently, that award remains with the 6950 XT at $600, but those won’t last. There are only a few left at major US retailers at the time of this writing, so we’ll operate under the assumption it’s functionally gone. But if you can get an RX 6950 XT, they're a great deal: If you do happen to grab one, the differences are often +/- 5% from the 7900 XT, with the max range at around 10%.
The recent price increase has tempered our enthusiasm around the 7900 XT’s value and put it in more direct alignment with the 4070 Ti’s price. The 4070 Ti has advantages in ray tracing, particularly when at lower resolutions like 1080p. Those evaporate as you approach higher resolutions. The 4070 Ti might also have a feature set advantage, but that’d depend on whether you view frame generation and Reflex as a value-add (or things like ray reconstruction, which we tested here). AMD’s FSR3 Fluid Motion should help compete here, but for now, NVIDIA has a wider spread of its DLSS technologies.
Our original thoughts on the 7900 XT were clear: We called it a “greedy upsell,” which at the original launch positioning, it absolutely was. Unfortunately, the price changes have contracted the XTX and XT close to one another once again, but it's going in the right direction. Back then, we also noted that the 6950 XT and 6900 XT were far better values. That’s still true if you can find them around $600, but the 6900 XT is basically gone in new-in-box fashion, and the 6950 XT will follow.