We test the RTX 5080’s thermals, frequency, gaming benchmarks, ray tracing, power efficiency, and more
The Highlights
- The RTX 5080’s performance is within striking distance of AMD’s RX 7900 XTX
- At the low end, we saw only a 7-10% performance uplift from the 5080 over the 4080
- The RTX 5090 performs 30% to 68.9% better than the RTX 5080 at 4K in our tests
- Original MSRP: $1,000
- Release Date: January 30, 2025
Table of Contents
- AutoTOC
Intro
We’re going to provide the bottom-line up front: The NVIDIA RTX 5090 (Be mindful of scalped prices) is anywhere from 30% to 68.9% better than the RTX 5080 (Be mindful of scalped prices) at 4K, depending on game, with results commonly in the 45-55% range. Against the AMD RX 7900 XTX of similar price, the 5080 (Be mindful of scalped prices) is within striking distance. They are commonly within 10% of each other. As for the generational gain of the 5080 vs. the 4080, it depends on the game. We saw 16%-20% in some tests, but we also had several results as low as 7-10%, which is about as boring as possible.
There’s a ton more nuance to get into, but that gives you some expectations in case you got what you needed and want to dip out. One of the more interesting tests we’ll be getting into though will be efficiency, where the RTX 5080 ends up potentially making a case for itself more than the power-hungry 5090 did. Its lower power budget helps there. The thermal testing is also interesting, considering the 5080 FE drops to paste rather than liquid metal and also makes changes to the heatsink itself.
Editor's note: This was originally published on January 29, 2025 as a video. This content has been adapted to written format for this article and is unchanged from the original publication.
Credits
Test Lead, Host, Writing
Steve Burke
Testing
Patrick Lathan
Testing, Video Editing
Mike Gaglione
Writing
Jeremy Clayton
Camera
Tim Phetdara
Writing, Web Editing
Jimmy Thang
We’re keeping this review really simple and short (by our standards) today.
First up, we have to disclose some office gambling behind the scenes. Jimmy has bet Jeremy that if the 5080 can beat the 4090 (Be mindful of scalped prices) at any one benchmark, he’s going to get some free tater tots.
RTX 5080 Pricing
We’ll quickly cover pricing.
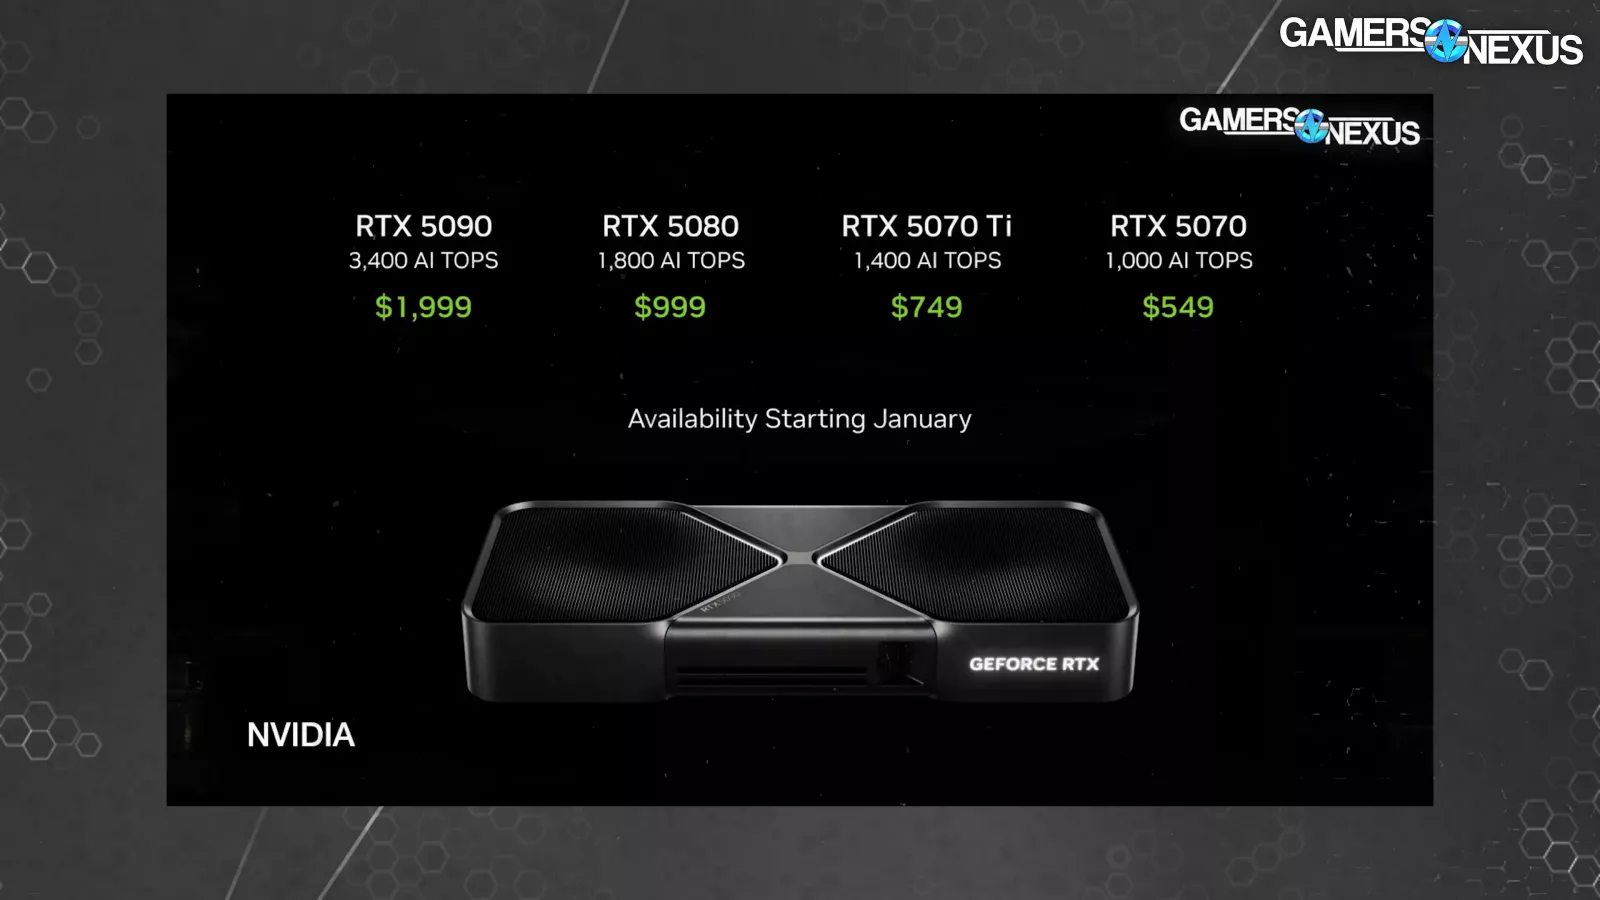
The NVIDIA RTX 5080 has an MSRP of $1,000 and launches on January 30th, along with the $2,000 MSRP RTX 5090.
The 5070 Ti at $750 and 5070 at $550 will follow in February. Pre-launch pricing on Best Buy indicates that MSRP options will be slim outside of the NVIDIA Founders Edition, so adjust your personal value assessment based on what they actually show up for on launch day. The most expensive one we can see right now is $1,400 – and we’d say don’t buy that one.
The previous generation RTX 4080 launched at $1,200 (watch our review) following the infamous “unlaunch” of the “4080 12GB” – which actually became the 4070 Ti (Be mindful of scalped prices). More recently, the 4080 Super (Be mindful of scalped prices) launched at $1,000, providing a value increase despite its nearly indistinguishable performance from the base 4080.
AMD’s Radeon RX 7900 XTX is the closest price competition for the 5080, which currently starts as low as $830 but is more commonly around $930. Down from that is the 7900 XT, ranging from $650 to $710 and in a decidedly lower price bracket. AMD says its 9070 series cards will be arriving in March.
Intel GPUs haven’t scaled up to this market category yet – that’s a hopeful “yet,” for the record.
Overview
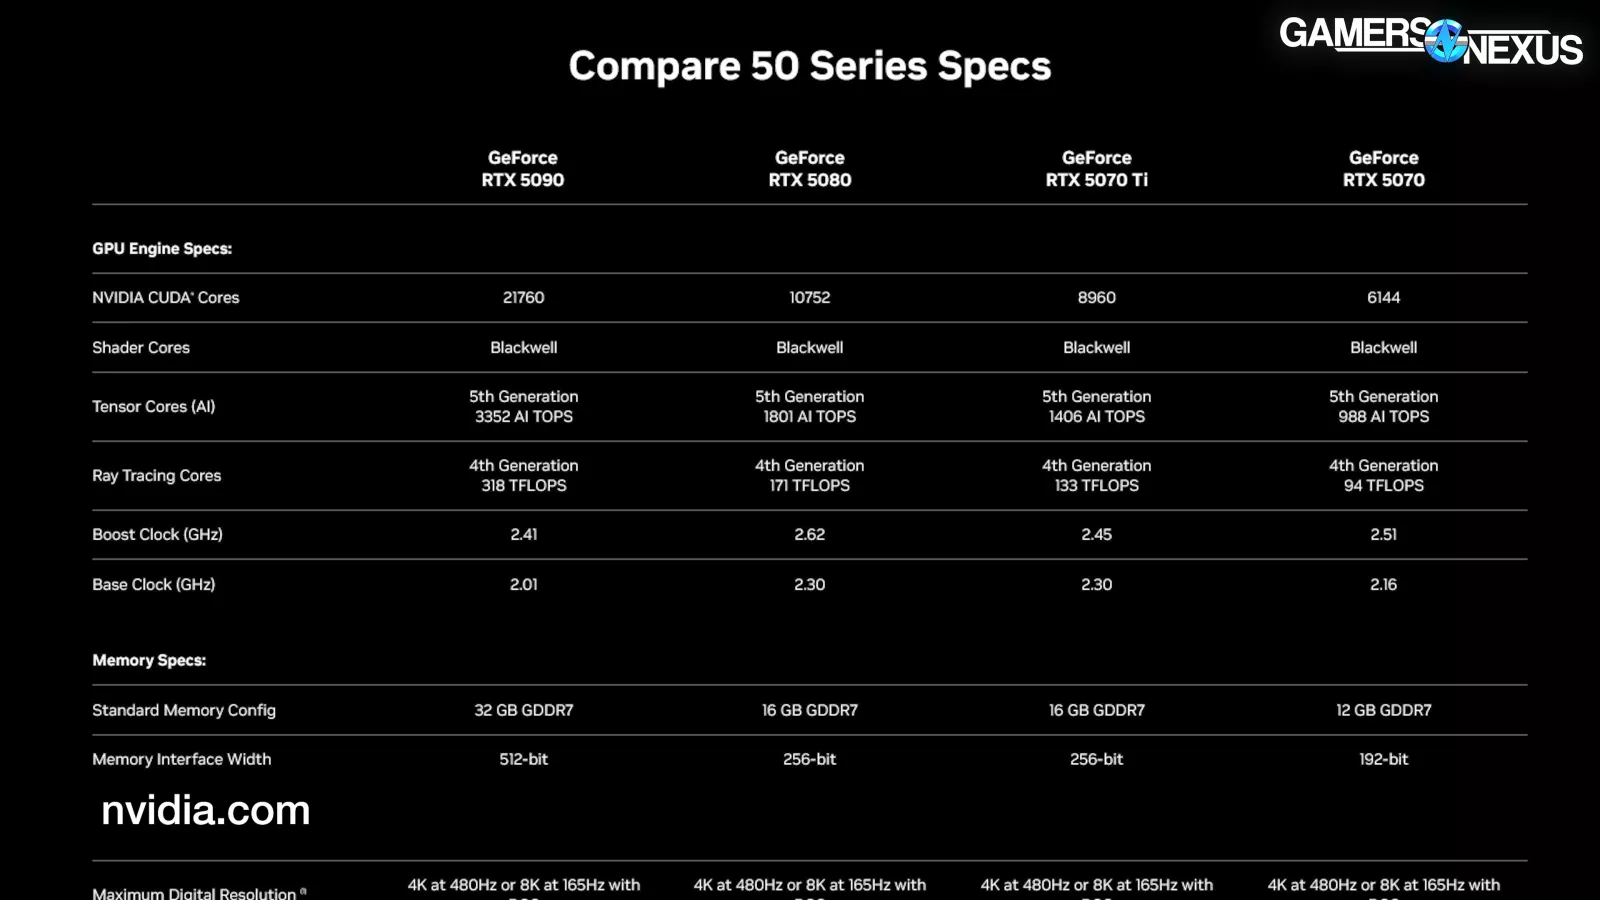
And now for a quick overview of the basic specs. For the full details, check out our announcement coverage of these cards.
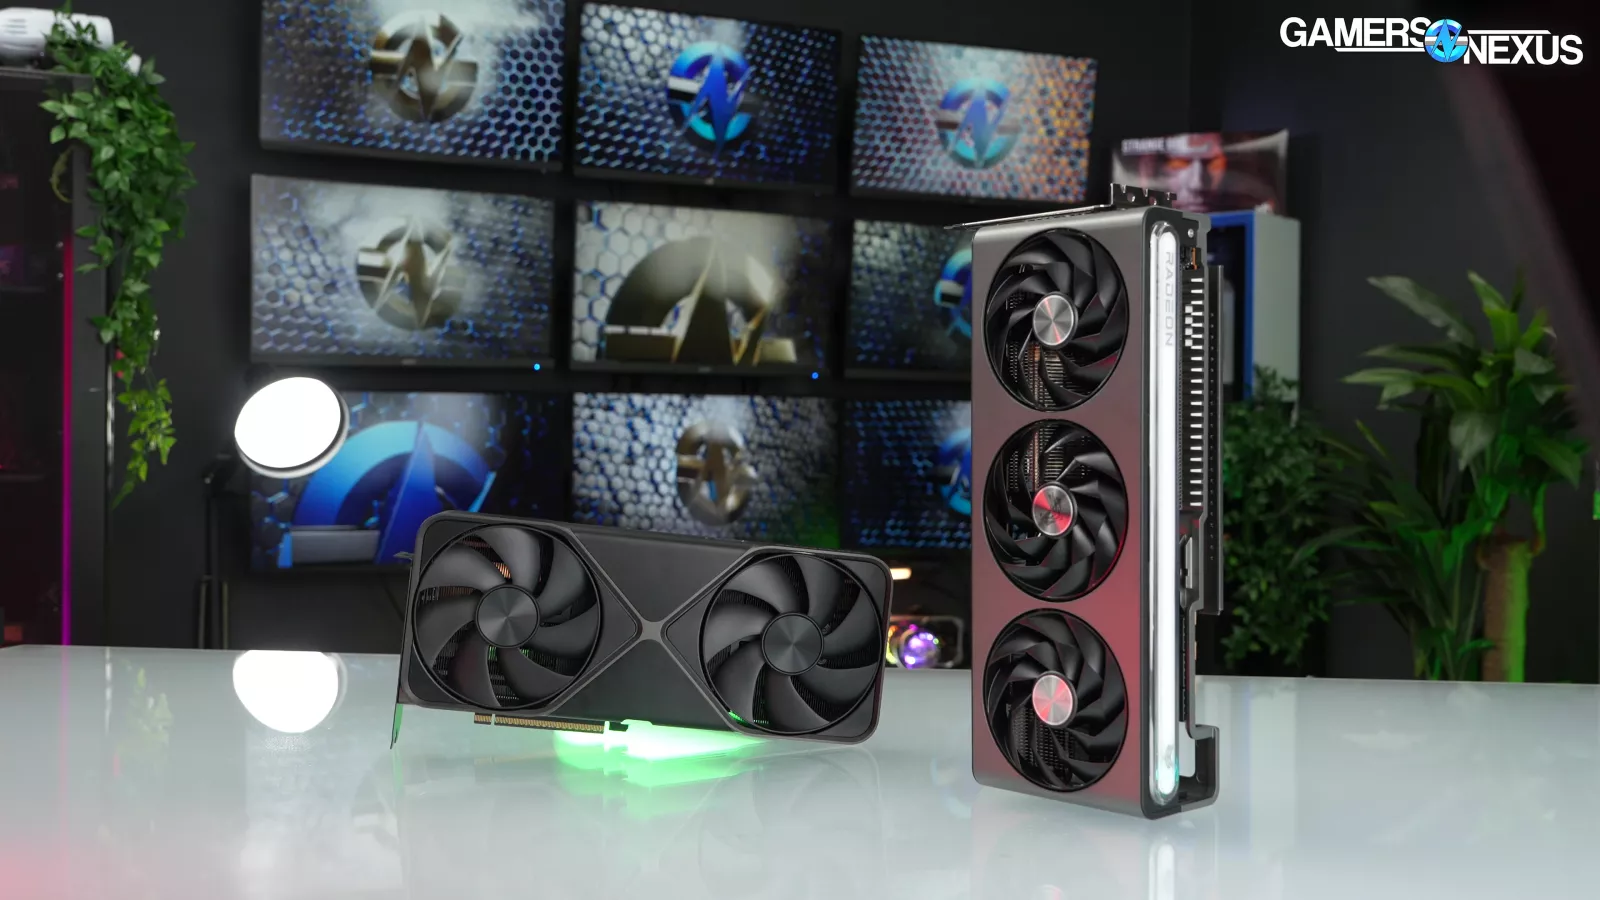
The Blackwell architecture-based RTX 5080 has 10752 CUDA cores and 16GB of GDDR7 on a 256-bit bus. These specs are way down from the 5090’s configuration – almost exactly half – making for probably the biggest gap there’s ever been between the top 2 tiers on launch day.
The RTX 5080 is also a PCIe Gen5 card, but as our recent PCIe scaling benchmark with the 5090 showed, it barely makes a difference at all in games to run on Gen4 – or even Gen3.
This review will again focus on high-end GPUs, and you can see our test methodology here. As a reminder, our site is free of third-party ads and contains our game settings and test bench. To see the low-end, check out our Intel Arc B570 review.
RTX 5080 Thermals
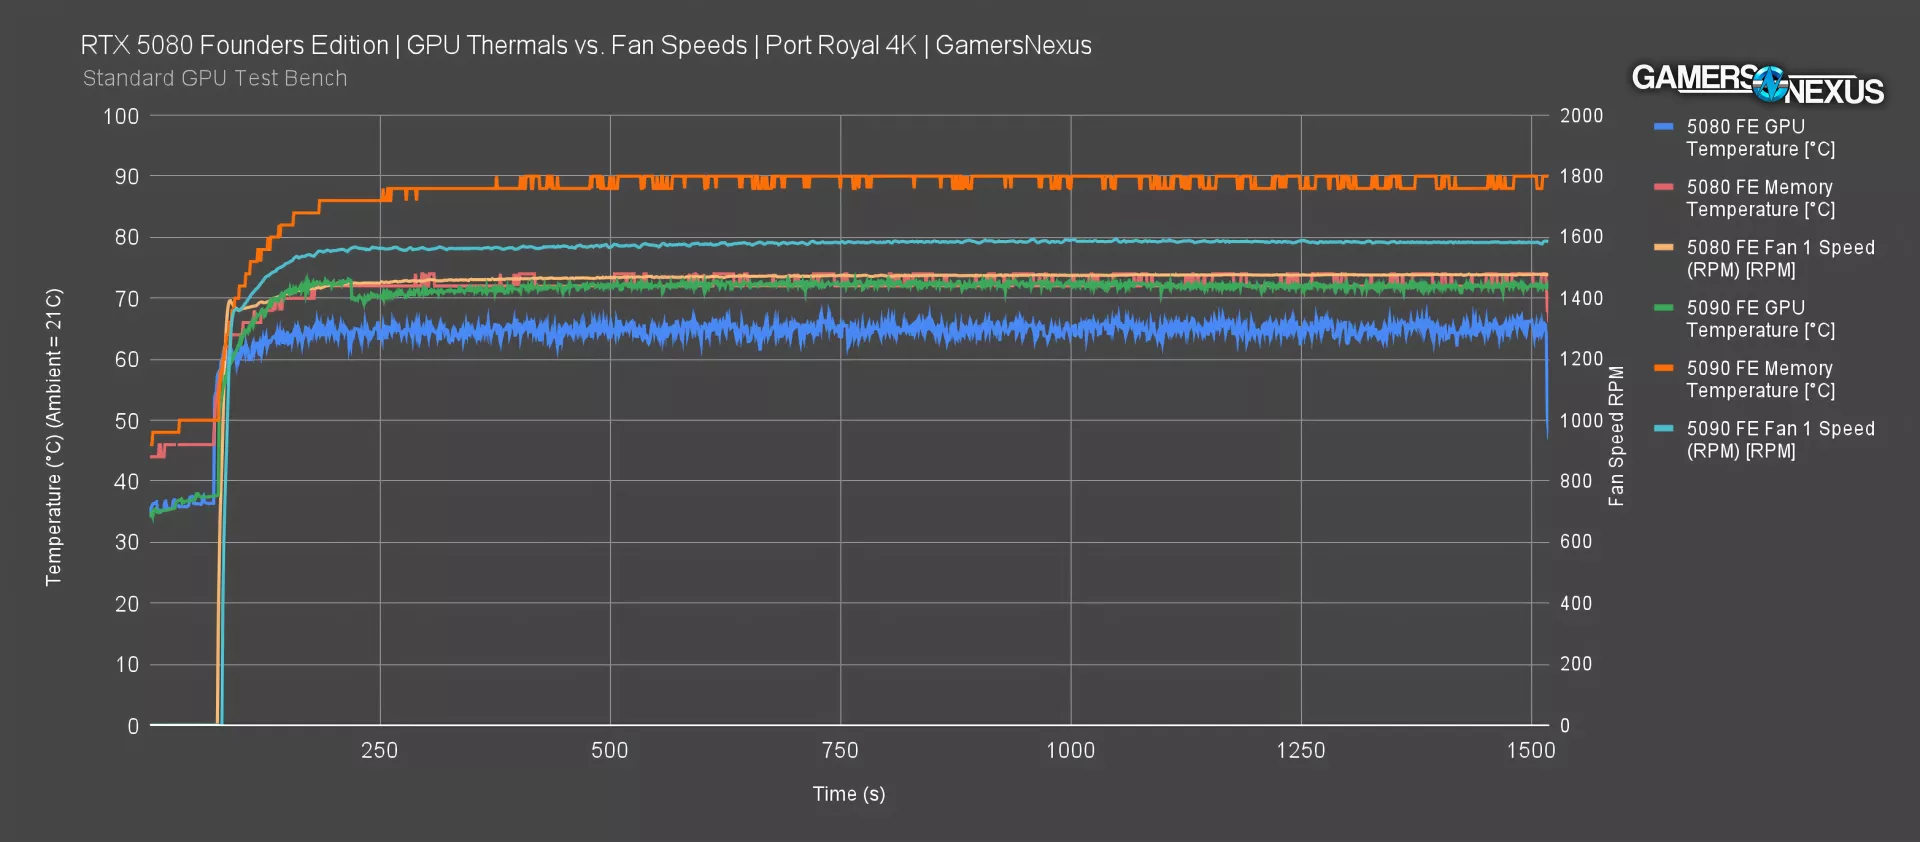
Here’s the thermal chart.
Under a full workload for the GPU, the RTX 5080’s temperature with auto settings landed at 65-66 degrees Celsius for the GPU. Considering the change to thermal paste from liquid metal, the real impact here to reduce the temperature is in the power consumption reduction. We’ll look at RPM as well, though.
The memory temperature plotted at about 72-75 degrees Celsius for the 5080, which is well within the TjMax restrictions of the memory on the card, which should be about 105 degrees for that.
As for 5080 fan speed, it held about 1,470-1,500 RPM. That makes its acoustic profile similar to what we saw in the 5090 review, so you can check that for noise samples and a frequency spectrum. It’s a little quieter overall.
The 5090’s GPU temperature in this test was 72 degrees Celsius, with the 5090’s memory at 90 -- we weren’t happy about that, despite being within spec. Once in a hotbox case, that 90 degree result becomes a concern. Finally, the 5090’s fan ran about 100 RPM higher when left to its own devices, resulting in a 5080 FE, which despite moving away from liquid metal is not really at a disadvantage. It’s doing okay overall, especially because of the fact that the power consumption is down.
RTX 5080 Frequency
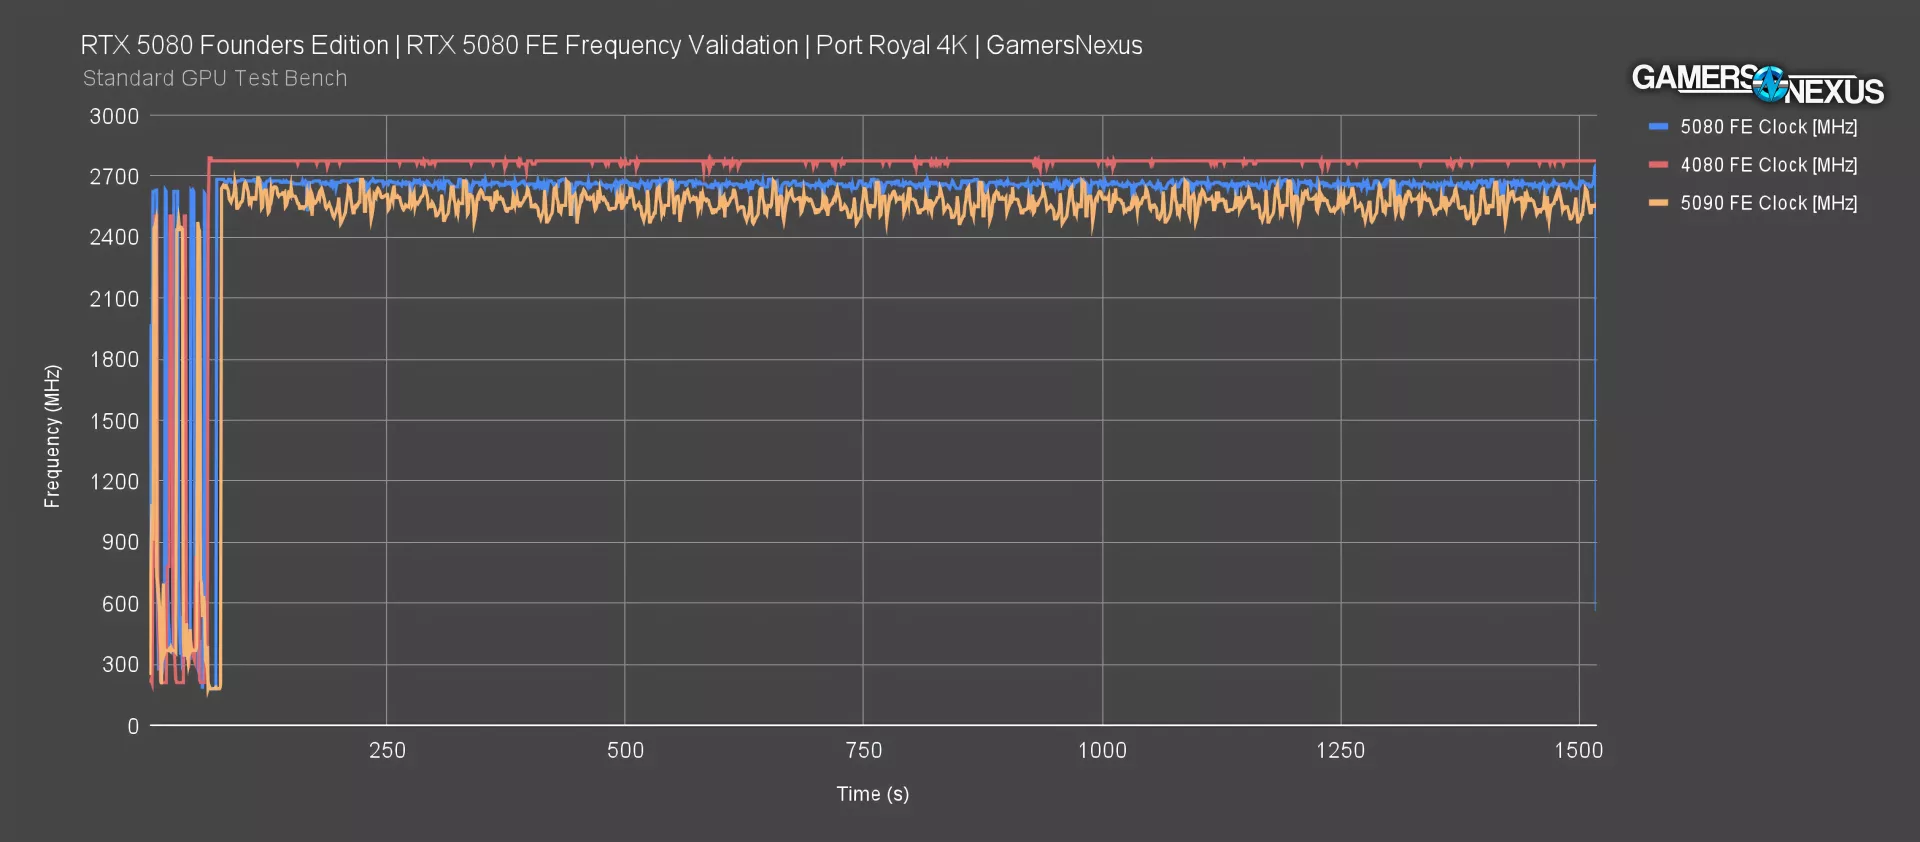
Frequency validation is up now. This is just to ensure the card is hitting at least the spec set by NVIDIA.
The RTX 5080 clocks in this benchmark held relatively flat, although not perfectly flat, at around 2670 MHz. NVIDIA’s website claims 2.62 GHz boost clock, so it is technically exceeding the minimum spec.
The RTX 4080 ran at about 2775 MHz in this benchmark, consistent with what we saw between the 5090 and 4090 (watch our review). The frequency is higher on the 4080, but the architecture has changed and made this an indirect comparison.
The RTX 5090 bounces around between 2475 to 2670 MHz or so, mostly landing below the 5080. It’s relatively common for the fuller configurations to run lower clocks, but higher core counts.
RTX 5080 Gaming Benchmarks

Time to get into game testing. We’ll keep these short this time since the comparison is relatively simple.
FFXIV 4K

Final Fantasy 14 is up first and at 4K.
The RTX 5080 landed at 112 FPS AVG, behind the RTX 4090’s 139 FPS AVG result and the 5090’s 182 FPS AVG result. That makes the 5090 faster than the 5080 by a massive 62%.
AMD’s 7900 XTX directly competes with the 5080, but does allow the 5080 a lead of just under 10 FPS in this benchmark. Lows are about the same between them.
Against the 4080 and 4080 Super, the 5080 is about 15% better.
Generationally by name, the 3080 (watch our review) held a 71 FPS AVG in this benchmark, yielding a 58% uplift to the 5080. The 2080 Ti’s (watch our review) 54 FPS AVG gets basically doubled by the 5080.
As a note, some of these charts have the 1070 (watch our review), 1060 (watch our revisit), 2060 (watch our review), and other older cards on them. The 1080 Ti (watch our revisit) hasn’t been rerun yet this year.
FFXIV 1440p

At 1440p, the RTX 5080 held 217 FPS AVG against the 5090’s 317 FPS AVG. We’re not fully CPU-bound here, so the 5090 still has relatively high scaling at 46% ahead of the 5080. For the same comparison, the 4090 led the 4080 original by 36% and the Super by basically the same because they’re basically the same card.
The 7900 XTX (watch our review) remains neck-and-neck with the RTX 5080, with the two functionally identical from a player experience standpoint. The 5080 is technically ahead. The 7900 XTX is the strongest competition to the 5080 in this rasterized test when looking at pricing.
The 4080 and 4080 Super improve from about 200 FPS AVG to 217, or a relatively boring 8-9%.
Down the stack, we have the 7900 XT at 171 FPS AVG, the 4070 Ti at 151 FPS AVG, and the 6950 XT at 150 FPS AVG. The generational comparison to the 3080’s 129 FPS AVG gives the 5080 a 68% improvement, a bit better than observed at 4K.
FFXIV 1080p

Finally for Final Fantasy, 1080p has the 5090 at that same impressive 407 FPS number we mentioned last week, with the 5080 at 302 FPS AVG. Despite the heavier CPU load, the advantage remains 35% for the 5090 over the 5080; still, that’s nothing compared to what we saw at 4K.
The 4090 leads the 5080 by 24%, at 376 FPS AVG to 302. The 7900 XTX is closer than ever to the 5080 and is tied in all practical senses. It’s looking good here, especially with the price, but this ignores ray tracing testing that tends to still favor NVIDIA.
Black Myth: Wukong - 4K

Black Myth: Wukong is up next, tested first at 4K and rasterized. This is a heavy workload for these cards, with the RTX 5090 at 86 FPS AVG and holding strong frametime pacing as indicated by the 1% and 0.1% lows. The RTX 4090 is next (at 67 FPS), followed by the RTX 5080 at 58 FPS AVG. This has the 4090 as 16% better than the 5080 and the 5090 as 48% better than the 5080.
The RTX 4080 Super (read our review) and 4080 are functionally identical and give the 5080 an underwhelming 6 FPS lead, which is about 12%. The 5080 also leads the 7900 XTX by 17%, with AMD’s card falling disproportionally behind in this test with its 49 FPS result. Lows on the 7900 XTX are commendable though and show impressive consistency.
Strong prior-gen cards include the 3090 Ti (watch our review) at 45 FPS AVG and 3080 at 36.6 FPS AVG, with the 3080 yielding an uplift of 57% to the RTX 5080 and similar for the 6950 XT (read our review).
Black Myth: Wukong - 1440p

At 1440p, the RTX 5090 leads the chart at 130 FPS AVG, making it 23% better than the 4090 and 34% better than the RTX 5080.
The 5080 and 4080 are disappointingly close at only a 9% improvement for the 5080. The lead over the 7900 XTX also reduces down to 13% here, with lower resolution drawing them closer.
Noteworthy other cards include the 3090 Ti at 74 FPS AVG, the 7900 XT (read our revisit) at 71 FPS AVG (which isn’t bad considering its price at various points in history), the 3080 at 62 FPS AVG, and the 2080 Ti at 45 FPS AVG.
Black Myth: Wukong - 1080p

Scaling continued at 1080p, where the 5090 boosts to 160 FPS average from the 130 FPS result at 1440p. The RTX 5080 still trails the 4090, but they get close and the 4090’s advantage is reduced to 6%.
Generationally, the 5080 leads the 4080 by 7%, down from its lead of 9% at 1440p and 12% at 4K. The 7900 XTX still trails by about 10 FPS here. It’s a shame that AMD decided not to compete at the high-end this generation, as a generational step over the current XTX may have been a serious contender to the 5080. There’s still time though.
Starfield - 4K

Starfield is up at 4K. First, we have to address this absolute roast of a comment from our 5090 review. “I would like to correct one mistake GN made in this review, where they stated that there aren’t many reasons to play Starfield at 1080p but in actuality there aren’t many reasons to play this game at all.”

Ouch. Well, anyway, at 4K, the RTX 5090 held 108 FPS AVG and led the 5080 by 41%. Not the best we’ve seen, but still a large gap. For reference, the 4090’s 92 FPS AVG led the 4080’s 71 FPS by 30%. Comparatively, that makes the gap between the last generation 90 and 80-class cards smaller than the current generation.
Against the 4080, the 5080 is about 5 FPS improved. That’s not very exciting. NVIDIA’s angle will probably be pricing.
The 7900 XTX actually defeats the 5080 on a technicality in this one as well, with frametime pacing equivalent between them and the average FPS functionally identical. There is no perceptible difference between these, which is a benefit to the 7900 XTX in this rasterized scenario.
Starfield - 1440p

At 1440p, the 5090 climbs to 147 FPS AVG and leads the 5080’s 110 FPS result by 34%. That reduces the lead versus 4K. The 7900 XTX also climbs with a very slight but irrelevant victory over the 5080, with the lows identical when rounded.
Against the nearly perfectly matched 4080 and 4080 Super, the 5080 holds an unimpressive 2.5% lead. That’s not very exciting.
Older cards worth highlighting include the 3080 FTW3 (RIP EVGA) at 72 FPS and 2080 Ti at 50 FPS AVG. AMD’s 7900 XT is also noteworthy for its performance when considering some of its historical pricing.
Starfield - 1080p

At 1080p, the RTX 5080’s 132 FPS AVG gives the 4090 a lead of 17% and the 5090 a lead of 24%. The 5080 matches the 4080 equally here, with the 4080 Super within error -- just like its entire pointless existence, sort of like Starfield at 1080p.
The XTX also nearly equals the 5080, although NVIDIA has an advantage on a technicality.
Dragon’s Dogma 2 - 4K

Dragon’s Dogma 2 is up now, first at 4K rasterized.
The RTX 5090 ran at 133 FPS AVG and held well-paced lows behind it. Its lead over the 4090’s 98 FPS is 35% here, with the lead over the 5080 at 57%. This is one of the largest gaps thus far. For comparison, the 4090 led the 4080 non-Super by 36%, meaning that the 4090 and 4080 were closer together than the 5090 and 5080 are to each other.
The 7900 XTX’s 77 FPS AVG has it outperforming the 4080 cards and behind the 5080 card, which leads by 10%.
The 3080 did OK in this test at 50 FPS AVG, with a 71% improvement to the 5080.
Dragon’s Dogma 2 - 1440p

1440p has the RTX 5080 at 134 FPS AVG, achieving 71% of the performance of the RTX 5090 at about 50% of the price. The RTX 4090 leads the 5080 again, this time by around 20 FPS.
As for AMD, the 7900 XTX lands at 126 FPS AVG for a 10 FPS gap between the two cards. The 4080 lands at 122 FPS AVG, keeping the 5080 at 10% ahead.
Dragon’s Dogma 2 - 1080p

1080p has the cards crushed together, although there’s still a gap of 49 FPS between the 5090 and 5080. That’s 30%, which is a lot for 1080p, but this isn’t necessarily a scenario to plan for.
The RTX 4080 is right next to the 5080. Although the gap is 10 FPS average, the reality is that very few people would notice 165 FPS vs. 156 FPS, particularly in this game.
Cyberpunk: Phantom Liberty
This is where we would test Cyberpunk: Phantom Liberty -- if it worked. We’ve had repeated issues with getting the 50-series cards to run Cyberpunk without some sort of game-level issue occurring where it just won’t launch or crashes. We had this with the 5090, but reinstalled the game and that fixed it. We can’t state for certain that it is a fault of the 50-series cards and not some other game update, especially as Cyberpunk has had so many problems over the years, but what we can say is that it continuously kept breaking. We removed it from this review until the game is more stable. Again, we’re not sure if it’s unique to these cards or not, but we know that Jay had similar issues in his testing.
Dying Light 2 - 4K

Dying Light 2 at 4K is next. The 5080 ran at 81 FPS AVG, giving the 4090 a 13% lead and the 5090 a 56% lead. That’s a large improvement for the 5090 over the 5080. The 4090 improved over the 4080 by less, at 36% here.
The 5080 leads the 7900 XTX by 12% here, with the 7900 XTX’s 73 FPS AVG result landing between the 5080 and 4080. Speaking of, the 5080 leads the 4080 cards by about 21%.
We’re seeing large gains from the 3080 to the 5080, as expected, with the 2080 Ti below even the 3080.
Dying Light 2 - 1440p

At 1440p, the RTX 5080’s 149 FPS AVG puts it close to the 7900 XTX’s 141, with lows between them also comparable. The 5080 is advantaged, but that gap was larger at 4K. The 5090 also has its lead cut down to 45%; although still significant, the doubled price with the 5090 jeopardizes its value for anyone not using it in VRAM-intensive work scenarios.
The 4080 cards were again almost identical, re-proving why we didn’t waste our time in that review. The 5080 leads them by 12%.
Dying Light 2 - 1080p

At 1080p, the 5090 led the 5080 by 44%, which is really more impressive for the 9800X3D (read our review) than anything else. That is a gigantic gap when considering how any prior CPU we’ve used for these benches would be bottlenecking the top 2-3 cards. The 4090 also maintains a lead of 19% over the 5080.
Resident Evil 4 - 4K

In Resident Evil 4 at 4K, the RTX 5080 fell behind the 7900 XTX by 4 FPS. Lows are about the same, but advantaged on the 7900 XTX. The 5090’s lead over the 5080 is massive in this one, at 68.9% with these settings. That’s a huge gulf. Looking back, the 4090 led the 4080 by 47%. There are two main ways to look at this: One, the 5090 is just that good; two, the 5080 is just that unimpressive.
To figure out which it is, we can compare the 5080 to the 4080. The improvement here is 19%. NVIDIA’s best argument for itself will be the price as compared to the original 4080. The 7900 XTX wins that argument in this particular game, though.
Resident Evil 4 - 1440p

At 1440p, the advantage in the 5090 over the 5080 is reduced to 56%, though that’s still a lot. The 4090 is still more than 50 frames per second faster than the 5080, with the 7900 XTX now 4% ahead. That’s not a huge gap, but considering the generational difference and price of the XTX, we remain disappointed that AMD has signaled it likely won’t launch a replacement this generation. Maybe they’ll reconsider.
The 5080’s lead over the 4080 drops to just 11% here.
RTX 5080 Ray Tracing Benchmarks

We’re on to ray tracing testing now.
Ray Tracing: Black Myth Wukong 4K

Black Myth: Wukong is up first, with a caveat that this game is unbelievably NVIDIA favored. We have other RT tests that are more balanced, but this is one of the heaviest workloads and also happens to benefit NVIDIA. Cyberpunk would also fit that bill, but we removed it for the stability issues we mentioned.
At 4K with FSR as defined in the chart title, the 5090 held 88 FPS AVG, the 4090 ran at 65 FPS AVG, and the 5080 ran at 59 FPS AVG. That sets a 15% lead over the 4080 FE’s 51 FPS AVG.
Some notables: The 3080 just can’t really handle these settings and is down at 28 FPS AVG. Jumping to the 4080 from the 3080 would be an 83% improvement, with the 5080 giving an uplift of 112% total from the 3080.
Sadly, the 7900 XTX is worse than the 3080 in this benchmark.
As for the 5090, it ran 51% higher framerate than the 5080 with these conditions. Sadly for Jimmy, the 5080 did not defeat the 4090 here -- but there’s hope.
Ray Tracing: Black Myth Wukong 1080p

At 1080p but still with the same FSR settings, the 5080 operated at 122 FPS AVG and -- what’s that? -- the 5080 outperforms the 4090 in this one by 1.5 FPS AVG. No one said the win had to be meaningful and a win is a win -- and as soon as I reported the results, I heard they were considering a rematch with the 5070.
The 5080 roughly matches the 4090 in this result, with the 5090 leading the 5080 by 30%. The 1080p restriction with FSR is what’s making this less exciting than typically.
Ray Tracing: Dragon’s Dogma 2 4K

Dragon’s Dogma 2 with RT is up next. This one is more balanced.
The RTX 5090 at 4K ran at 113 FPS AVG with maximum RT, which puts it 33% over the 4090 and 57% over the 5080. The 7900 XTX is much more competitive in this one than Black Myth, running at 66 FPS AVG and landing between the 4080 Super and 5080.
The generational uplift is 16% from the 4080 FE to the 5080 FE.
Ray Tracing: Dragon’s Dogma 2 1440p

At 1440p and still with RT, the 5080 held about a 7% lead over the 7900 XTX. That’s not bad for AMD’s last gen card in this game. As for the 4080 FE, the 5080 is about 10% ahead. Not very exciting for NVIDIA overall with the 5080 in this one. Let’s move on.
Ray Tracing: Dragon’s Dogma 2 1080p

At 1080p, the 5080’s 146 FPS AVG had it only about 9 FPS over the 4080. The 5090 still keeps a 33% lead over the 5080, despite slimming down versus the 4K result’s 57% gap.
This isn’t that interesting, so let’s skip ahead.
Ray Tracing: Dying Light 2 4K

With ray tracing for Dying Light 2 and tested at 4K and upscaling, the RTX 5080 ran at 67 FPS AVG and trailed the 4090 by over 10 FPS, with the 5090 leading the 5080 by 63%.
Over the 4080, the 5080 leads by about 17%. The 7900 XTX is between the 3090 Ti and 4070 Ti (watch our review), trailing the 4080, and obviously therefore trailing the 5080.
Ray Tracing: Dying Light 2 1440p

At 1440p with RT and upscaling, the 5080’s 117 FPS AVG lands it 12% ahead of the 4080. The gap is shrinking here. The 7900 XTX trails somewhat significantly here and gives the 5080 an advantage of 35%.
Ray Tracing: Dying Light 2 1080p

At 1080p, the 5090 proves that there’s still headroom in the CPU (impressively) with its 224 FPS AVG, leading the 5080 by 41%, but the 4080 and 5080 get squished together with only a 9% advantage to the 5080 between them.
The 7900 XTX is closer to the 3090 Ti here, keeping the 5080 about 30% ahead.
Ray Tracing: Resident Evil 4 4K

Finally for RT, Resident Evil 4 at 4K with upscaling is up. The RTX 5090 ran at 210 FPS AVG with these settings, or a 54% improvement over the 5080’s 136. The 7900 XTX is much more competitive here, with the title generally being a lightweight RT implementation. We keep it around for that reason: If we have a heavy one like Black Myth, it helps to balance representation with a light one. The 7900 XTX looks much better here than in other RT tests.
The 4080’s 117-119 FPS AVG makes the scaling in the 5080 overall boring, unfortunately, with the improvement being hardly noticeable.
Ray Tracing: Resident Evil 4 1440p

Here’s 1440p. The 5080 jumps to 205 FPS AVG, the 5090 to 290 FPS AVG, and the 7900 XTX to 195. The XTX is still competitive here, especially given the price and generational differences; likewise, the 4080 still makes the 5080 relatively uninteresting. This feels like a sidegrade.
RTX 5080 Efficiency
Power efficiency testing is next, measured using power interposers and capturing only GPU power. We are not measuring total system power for this and instead isolate for the GPU. The PCIe slot is intercepted and measured as well.
Power Consumption: Idle

Idle power consumption is far better on the RTX 5080 than the RTX 5090. Keep in mind that idle power testing is very situational to the monitor, refresh rate, and power plans -- but our test setup is identical unit-to-unit, so that’s all that matters here. They are all under the same conditions.
Under these conditions, the RTX 5080 was at 12.75W when idle on the desktop. This is close (but improved upon) the RTX 4080’s 15-16W idle power draw, both of which are far below the 4090’s 29W and 5090’s 46W power consumption.
Efficiency: FFXIV 4K

Final Fantasy 14 at 4K had the RTX 5080 at the top of the chart for efficiency. Comparatively, this is a great result. Its 298W draw here leaves headroom in the TDP budget, with the relatively high framerate enabling it to outperform the 269W 4080 Super for efficiency and performance alike. It also outdoes the 5090, which scored 0.34 FPS/W. The 5080 significantly outdoes the RX 7900 XTX, which ran at 0.24 FPS/W and 430W.
This appears to be a possible strong point for the RTX 5080.
Efficiency: FFXIV 1440p

1440p gives us a lot more cards on the chart since we’ve tested more mid-range devices, but with the downside that the high-end devices scale their best at 4K. That means we lose some of the framerate scaling advantage.
The 5080 is still tied for the most efficient on this chart after rounding, aligning with the 4080 Super as the most efficient GPU we’ve tested yet. It’s at 0.75 FPS/W while pulling 290W, up from the 268W of the 4080 Super but also up in framerate. The 4090 pulled 386W here, with the 5090 at 520W.
Efficiency: F1 24 4K

For efficiency in F1 24 at 4K and with RT, the RTX 5080 ties the 4090 and is within reasonable variance of the 4090 and 4080 Super results. The 5080 pulled 330W in this test, putting it notably lower in power consumption than the RTX 5090’s 569W draw here, but still more than the 4080 Super’s 291W. The 7900 XTX is significantly less efficient in this particular workload, hampered in part by RT but also just by its 422W draw.
RTX 5080 Conclusion

Check back soon for our ITX testing with the FE cards and for transient power testing coming up. We’ll look at power excursions in that. We also have a story about MFG, or multi-frame generation, almost entirely complete and coming up. That’ll delve into NVIDIA’s new DLSS and frame generation tech in detail.
Otherwise, that’s all the numbers for now. The quick recap is:
- Thermals on the 5080 FE cooler are good overall and the acoustic profile is similar to the 5090 FE cooler. Check our 5090 FE review for that
- The efficiency is toward the top of the charts and the card seems to be more within the optimal power range than the 5090 (Be mindful of scalped prices)
- For gaming performance, this is one of the largest gaps we’ve ever seen between the top 2 cards
- The 5090 leads the 5080 (Be mindful of scalped prices) anywhere from 30% to nearly 70% in 4K benchmark results
- The 5080 is a relatively boring uplift over the 4080, unfortunately. This must be why NVIDIA has pushed MFG so hard
- The 7900 XTX is a strong competitor in rasterization, but is assailable in ray tracing
- Finally, the low VRAM capacity continues to be an unfortunate way to segment the 90-class cards into the professional user camp. The 5080 being a 16GB device destroys its usefulness to people who do work like our Premiere and Blender rendering -- but that’s probably the plan to drive 5090 sales
- Unfortunately, the 4090 cards have largely evaporated or there might be a strong argument for them still with the VRAM boost
With several partner models listed at $1,200 to $1,400 in pre-launch listings, the value isn’t compelling. We also continue to take issue with NVIDIA’s hugely misleading “benchmarks” on its website:
The 5080 is shown as being 2x the speed of the 4080 in several tests, but again, this has to do with its MFG 4X Mode that’s only available on the 50-series. We’re testing that. The boring range of 10% to maybe 20% in some situations is more common. We ranted about this in the 5090 review if you want more.
This is why NVIDIA is pushing MFG so hard: The 5080 otherwise is a boring product generationally. When the gap is sometimes 10 FPS over the 4080 Super at the same price, it’s just hard to get excited about. It seems like a tool to create 5090 sales.
As for the bets of tater tots within the office, it looks like Jimmy wins this one. They’ll have a rematch for the 5070 and 4090.