With the 4080 Super being marginally faster and cheaper than the original 4080, we take a closer look at its value
The Highlights
- The 4080 Super features 5.3% more CUDA cores and a slightly faster clock speed than the original RTX 4080
- Compared to the original RTX 4080, the 4080 Super only performs roughly 1-3 percent better
- The best thing about the 4080 Super is that it’s $200 less than the original 4080
- Original MSRP: $1,000
- Release Date: January 31, 2024
Table of Contents
- AutoTOC

Intro
Unlike NVIDIA -- and AMD with the 7600 XT launch -- we’re not wasting any time with BS today. The answer is 1 to 3%. That’s the percent improvement of the RTX 4080 Super over the original RTX 4080. We spent 20 hours of testing to create a 1-sentence performance summary, so thanks everyone for reading. Remember to go to the store to support us!
Lame NVIDIA RTX 4080 Super
The only thing good about the launch of the RTX 4080 Super is the price reduction, because otherwise, it’s functionally the same performance as the RTX 4080. The difference is largely just noise. If this were still $1,200, it’d easily be one of the biggest wastes of time as reviewers we could spend -- but the $200 price drop helps a little bit. The trouble is that the 4080 always should have been cheaper. It was never a $1,200 card, as we said in our launch review, and unlike the modern “low-end” cards like the 7600 XT 16GB, the VRAM difference on the 4080 against the 4090 is actually meaningful. For us and many other workstation users, it’s the difference in viability as a workstation GPU. With enough VRAM to power an editing machine competently, maybe the story would be different. But as a gaming card, the 4080 never should have been $1,200.
Editor's note: This was originally published on January 31, 2024 as a video. This content has been adapted to written format for this article and is unchanged from the original publication.
Credits
Test Lead, Host, Writing
Steve Burke
Testing
Mike Gaglione
Video Editing
Vitalii Makhnovets
Camera
Tim Phetdara
Web Editing
Jimmy Thang
And that makes the price reduction feel like some kind of Stockholm syndrome: It’s kind of a good thing, and the value certainly improves, but it’s also difficult to praise something that has moved from complete insanity into just moderate derangement. Traditionally, many years ago, this card wouldn’t have existed: NVIDIA would have cut the prices instead, but today’s NVIDIA instead values the additional marketing push it gets from attaching a new sticker to the end of what performs like an old card. And it’s working, clearly, because instead of a line item in a news story, we’re talking about it here.
Objectives of this Review
This review won’t be like our other GPU reviews from the last few weeks. We do have all the same data, but sincerely, it’s 1-3%. Multiply 0.03 against any number in any chart and add it to the 4080 result and you’re at or above our 4080 Super result. Instead, we’ll spend some time running comparisons at the $800-$1,000 price point and will recap some of the current market options.
We were originally planning to go HAM with this review and include more latency testing and all the other new tests we’ve been running, but upon seeing performance, it’s really just not warranted -- especially after the past few weeks of reviews. We’ll publish a full dataset on the site soon in our Mega Charts entries for GPUs, but for today, it’s not necessary and is just a waste of everyone’s time. There’s no real nuance here.
The RTX 4080 Super has 10,240 CUDA cores and uses a perfect AD103 die. The original RTX 4080 was also AD103, but cut down to 9728 CUDA cores. This could be for yield reasons. The end result is that the new 4080 Super has 5.3% more CUDA cores, but it also has an advertised slight clock bump.
GPU Reviews Test Bench
You can find additional test methodology notes in our Test Benches Living Document.
| Part | Component | Provided By |
| CPU | Intel Core i7-12700KF Overclocked (4.9GHz P-Cores, 3.9GHz E-Cores) | Bought by GN |
| Motherboard | MSI Z690 Unify | MSI |
| RAM | DDR5-6000 G.Skill Trident Z (manually tightened timings) | G.Skill |
| Cooler | Arctic Liquid Freezer II 360 @ 100% Fan Speed | Bought by GN |
| PSU | EVGA 1600W T2 Supernova Corsair AX1600i | EVGA Corsair |
| OS | Windows 11 | Bought by GN |
RTX 4080 Super vs. RTX 4080 Specs
| 4080 Super | 4080 | 4070 Ti Super | 4070 Ti | 4070 Super | 4070 | |
| GPU | AD103 | AD103 | AD103 | AD104 | AD104 | AD104 |
| Cores | 10240 | 9728 | 8448 | 7680 | 7168 | 5888 |
| Tensor Cores | 320 | 304 | 264 | 240 | 224 | 184 |
| RT Cores | 80 | 76 | 66 | 60 | 56 | 46 |
| Memory Size & Type | 16GB GDDR6X | 16GB GDDR6X | 16GB GDDR6X | 12GB GDDR6X | 12GB GDDR6X | 12GB GDDR6X |
| Bus Width | 256-bit | 256-bit | 256-bit | 192-bit | 192-bit | 192-bit |
| Memory Bandwidth | 736 GB/s | 716 GB/s | 672 GB/s | 504 GB/s | 504 GB/s | 504 GB/s |
| Base/Boost (Advertised) | 2.29/2.55GHz | 2.2/2.5GHz | 2.3/2.6GHz | 2.3/2.6GHz | 1.98/2.48GHz | 1.9/2.48GHz |
| ROPs | 112 | 112 | 96 | 80 | 80 | 64 |
| TMUs | 320 | 304 | 264 | 240 | 224 | 184 |
| TDP | 320W | 320W | 285W | 285W | 220W | 200W |
| Launch MSRP | $1,000 | $1,200 | $800 | $800 | $600 | $600 |
| Announce Date | January 8, 2024 | September 20, 2022 | January 8, 2024 | January 3, 2023 | January 8, 2024 | April 12, 2023 |
| Release Date | January 31, 2024 | November 16, 2022 | January 24, 2024 | January 5, 2023 | January 17, 2024 | April 13, 2023 |
RTX 4080 Super vs. RTX 4080 Performance Recap
And here’s the chart to join the recap.
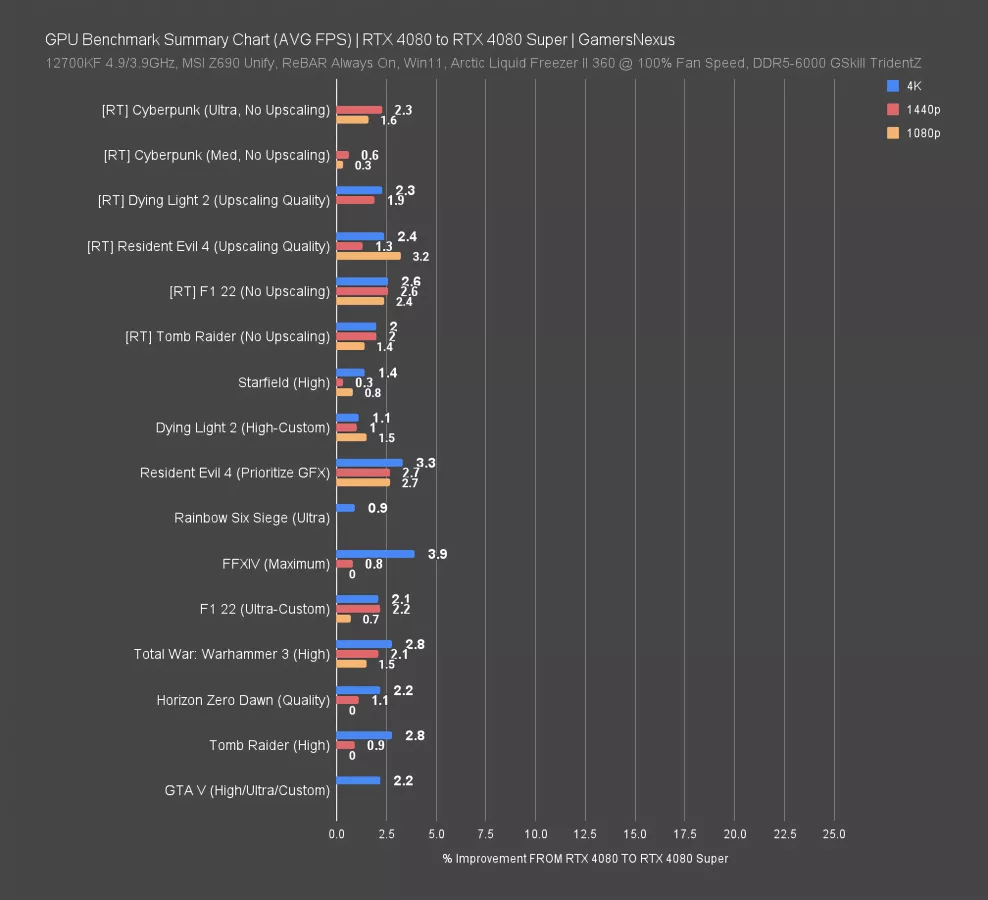
We could spend the usual 30 minutes chart spamming to show our work, but this image summarizes it pretty well. And genuinely, you can multiply any of these percentages against the 4080 result on a chart from last week and you’ll know where it lands.
With the 4070 Ti Super launch and the relative lameness of the card, we said it seemed possible that NVIDIA was couching its weakest launch between the two better cards: The 4070 Super and the 4080 Super. Well, other than the value improvement of the 4080 Super, we were definitely wrong about that one. The 4080 Super is a lot less exciting than we’d anticipated. We weren’t expecting the world with that specs change, but certainly better than an average uplift of 1.9%.
RX 7900 XTX vs. RTX 4080 Super Comparison (Ray Tracing)
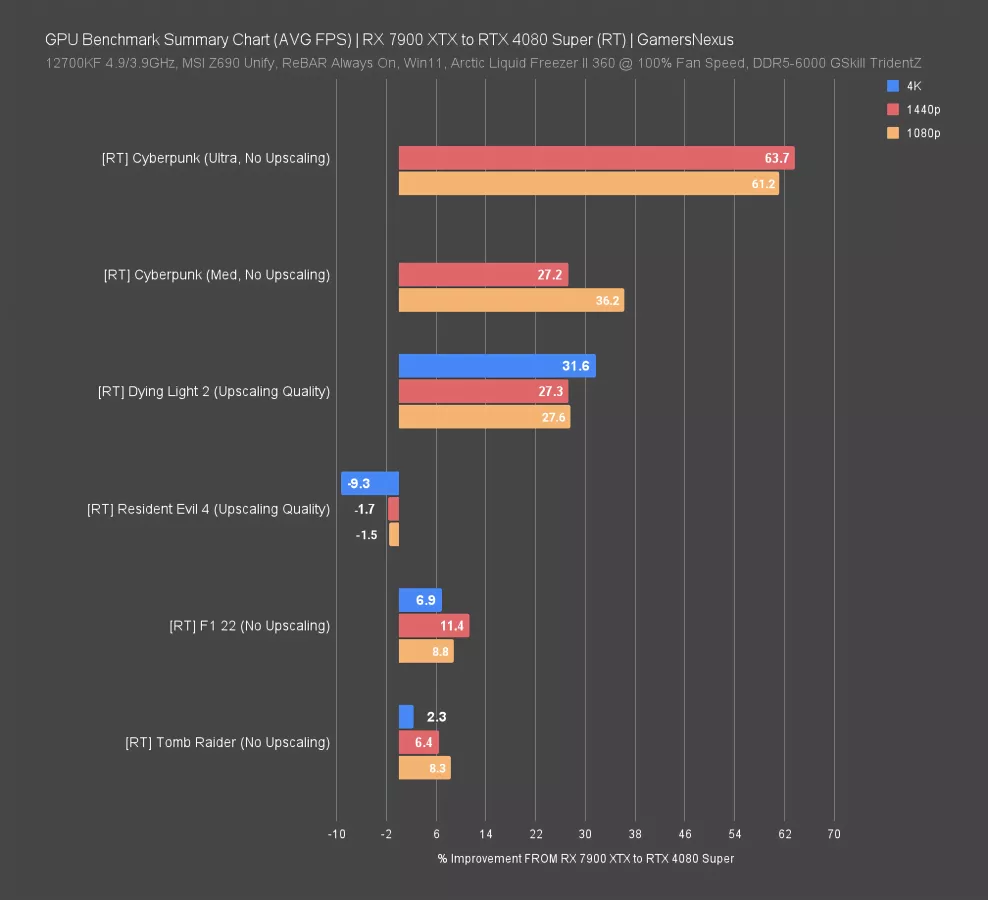
Here’s a quick comparison of the RX 7900 XTX vs. the RTX 4080 Super, first showing only ray tracing in isolation because the advantage flips. The favor is toward NVIDIA here, whereas the raster favor is toward AMD.
In the chart above, we see the unbelievable lead NVIDIA holds in Cyberpunk ray tracing, which we just re-added, when running on Ultra RT settings. That disproportionate advantage falls as the RT settings are reduced, with medium going from a 60+% NVIDIA favor to about a 30% favor -- still huge at rough price equivalence. Dying Light 2 shares this behavior.
Resident Evil favors AMD here and is a lighter RT workload, so that makes sense. Tomb Raider and F1 are also both medium to lighter-weight RT workloads. That gives us a fairly full picture of the types of RT games right now, where we have those which heavily leverage ray tracing and swing the performance toward NVIDIA in big ways and those which supplement less heavily.
RX 7900 XTX vs. RTX 4080 Super Comparison (Rasterization)
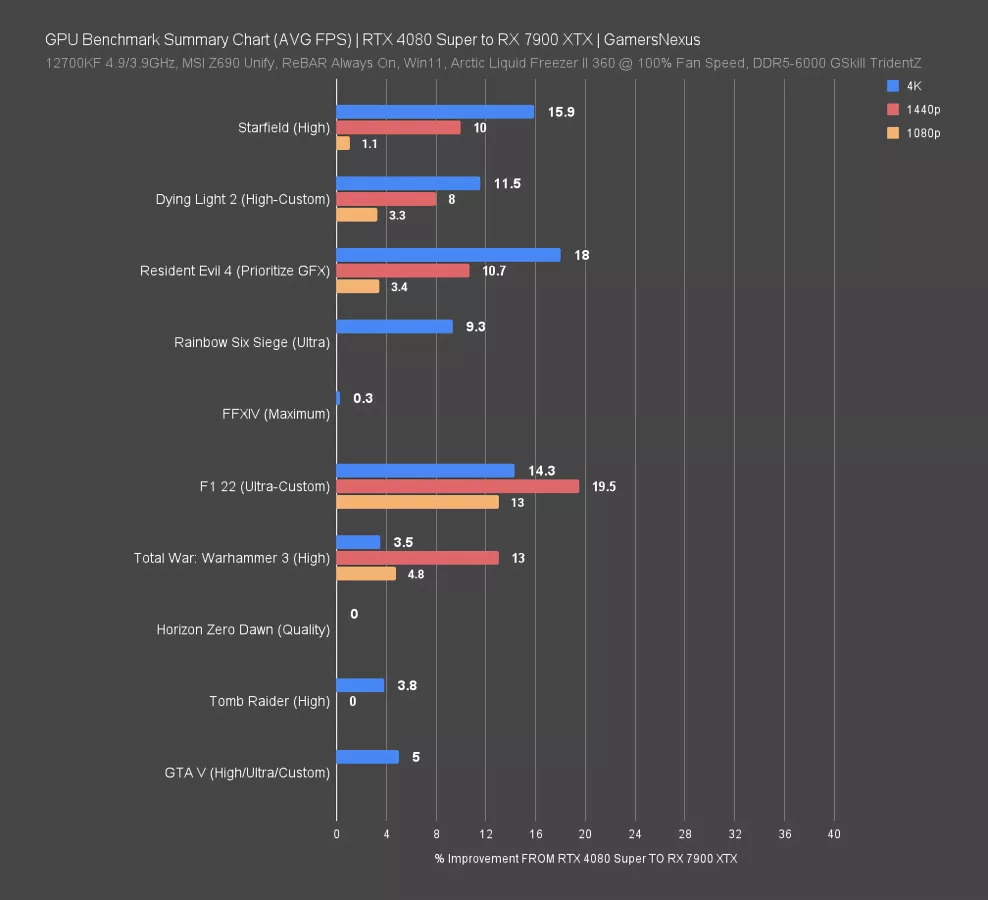
For the rasterization comparison between these two, AMD leads or is equal with the 4080 Super. Overall, it’s anywhere from about equal to 20% ahead in raster performance, with particular strengths in Starfield at 4K, Dying Light 2 at 4K, Resident Evil 4 at 4K, F1 at 4K and 1440p -- and actually not bad at 1080p, despite approaching bottlenecks. If you mostly play non-RT titles or you aren’t interested in using the feature in heavy RT games like Cyberpunk and Alan Wake 2, then the 7900 XTX might be better value, but it really depends on what games you intend to play.
Value and Dollars Per FPS Considerations
So let’s talk about that aspect: the value. That’s more interesting today, anyway.
We don’t normally do FPS/$ (or $/FPS) charts just because they require a lot of caveating and aren’t quite as objective as we’d like them to be (just due to some inherent loss of nuance), but they definitely have their place. This is the place.
The following charts don't take into things like power efficiency, professional workloads, frame pacing, and frame delivery, but they’re still useful.
Cost Per Frame - 1440p, 4080 vs 4080 Super
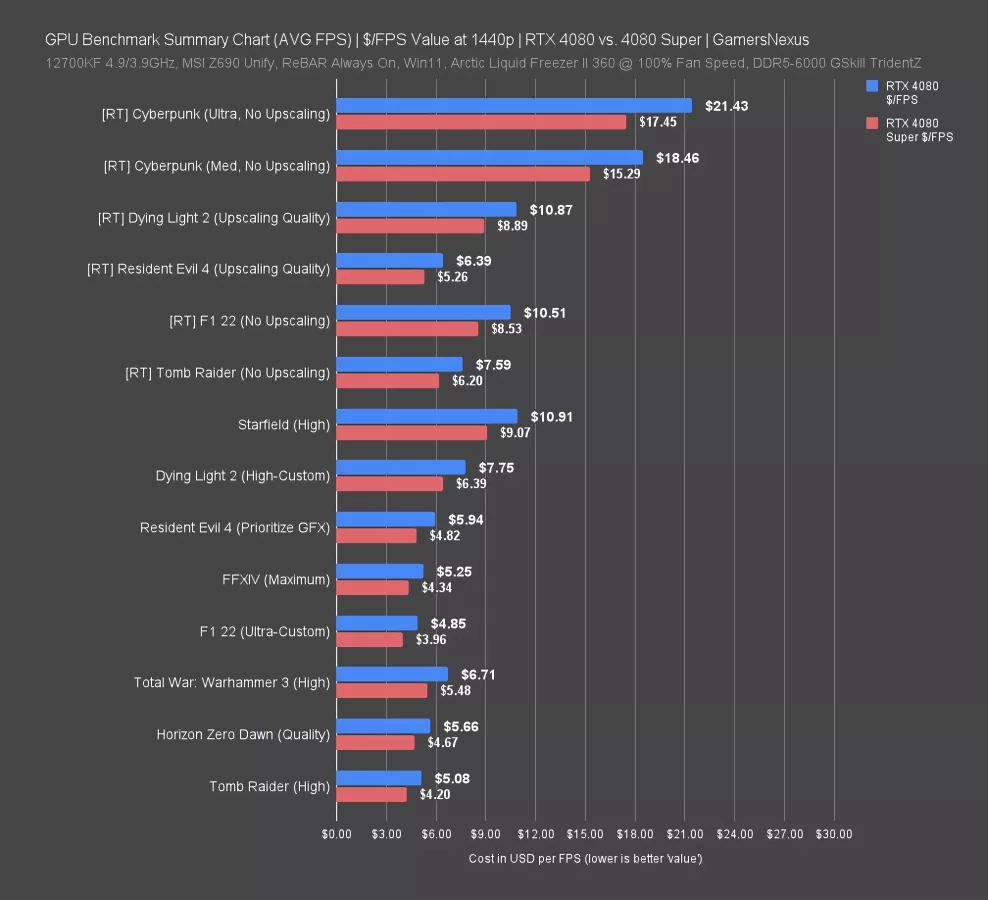
Here’s 1440p in the battle of 4080 vs 4080 Super. If we were to draw a line at an approximate average, it’d be in the $8 to $9 per FPS range for the original RTX 4080, or $6.5 to $7.50 range for the RTX 4080 Super. Generally speaking, you can see that the gap from the 4080 to the 4080 Super, where lower is better, improves by a similar amount per card.
% Reduction in Cost Per Frame - 1440p, 4080 vs 4080 Super
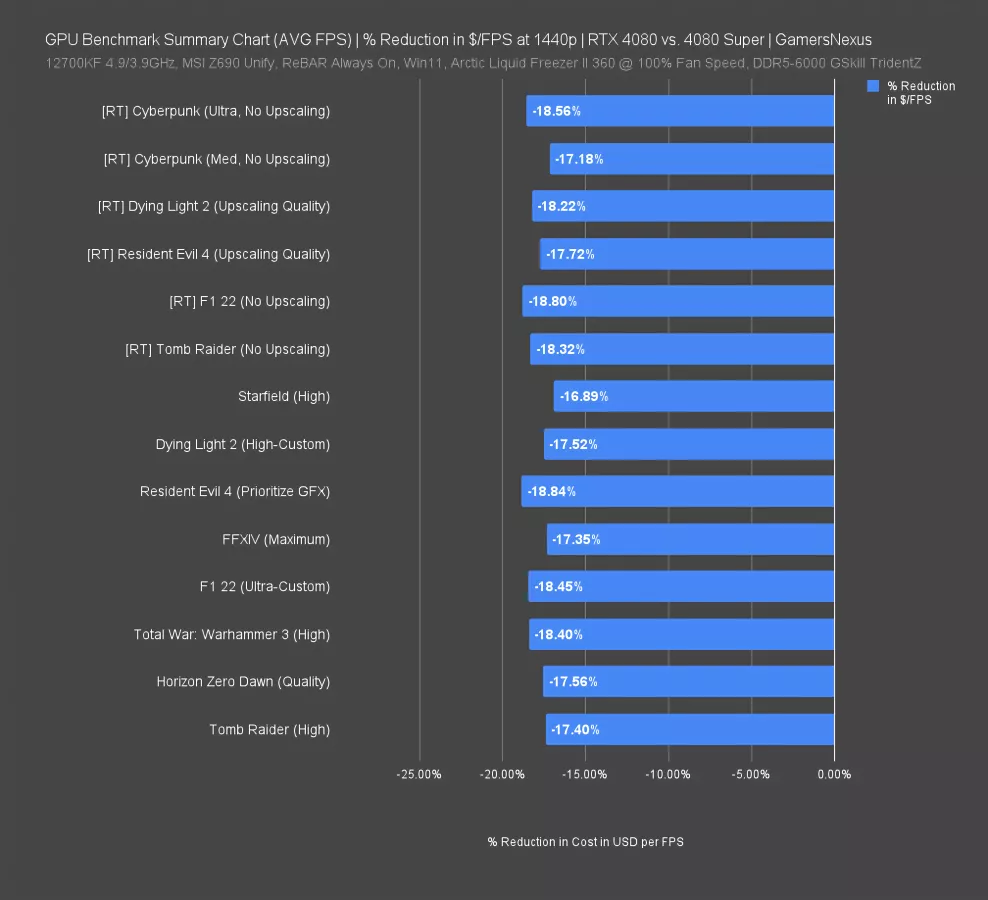
For perspective, let’s look at these numbers as a percent reduction in cost per frame.
This is just the percent improvement, where we are defining improvement as reduction in cost per frame, from the 4080 to the 4080 Super. The reduction in USD/FPS tends to be about 17%, so if you wanted an objective look at the change in “value,” which inherently has some subjectivity to it depending on the buyer’s situation, this is about as close as we can get between the two cards.
So, depending on if you’re NVIDIA or a realist, you could say that they improved 1-3% or you could say they improved 17%. It just depends on if you’re getting paid to say it.
As we said earlier, this entire launch is functionally just a price reduction of an existing product. It’s a good thing to reduce the price, but they’ve done it in a confusing way -- and we wonder whether the cost to fab a cut-down 4080 die is meaningfully lower than a 4080 Super die. If it is, and if we ignored NVIDIA’s desire for maintaining ASP and margin, then it might have been more exciting to cut MSRP further. But then that’d look like an admission of a bad launch price, so maybe that was never in the cards. As we said last year, NVIDIA had an RTX 4080 problem where no one was buying them for a while. It’s been the opposite for the 4090, which everyone seems to want.
The GPU market has definitely changed.
Let’s look at some more numbers.
Value: RX 7900 XTX vs RTX 4080 Super
The next one looks at the 7900 XTX (review here) also at 1440p. We’ll use some 4K numbers in a moment. For the 7900 XTX, we’re working off of an average of a selection of cards available at retailers. This table shows our work.
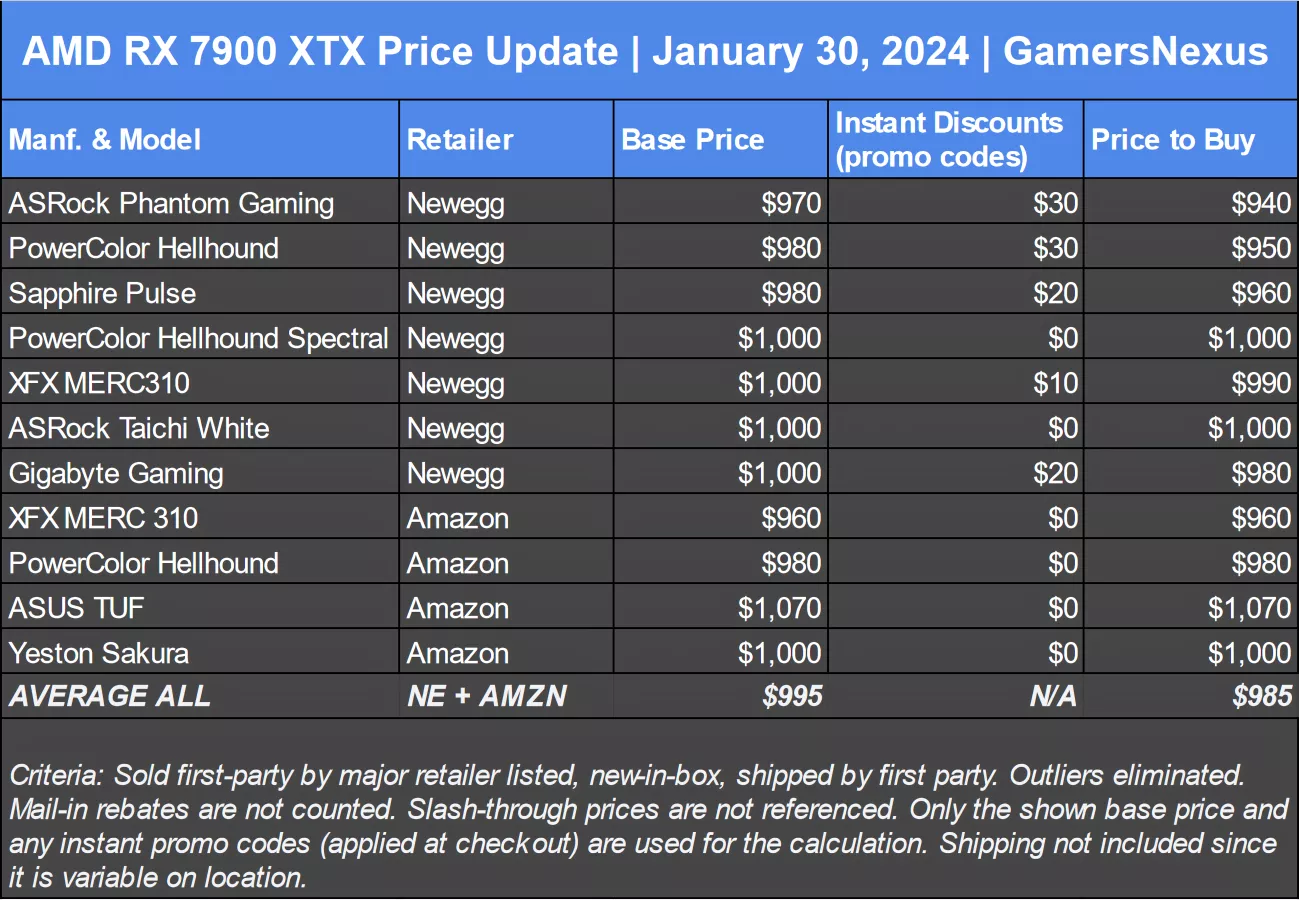
Currently, the average RX 7900 XTX will cost about $985 in the US from the two largest retail options. The cheapest option yesterday was the Phantom Gaming at $940, which seems to be in good supply. It’s tough to know which price to use for the chart coming up since the instant promos are likely temporary to compete with this launch, so to simplify things, we’ll use the best price and the average price. That’s $940 and $985. Remember that the average 4080 Super is likely to trend above $1,000 as well.
Cost Per Frame - 1440p, 4080 vs 4080 Super
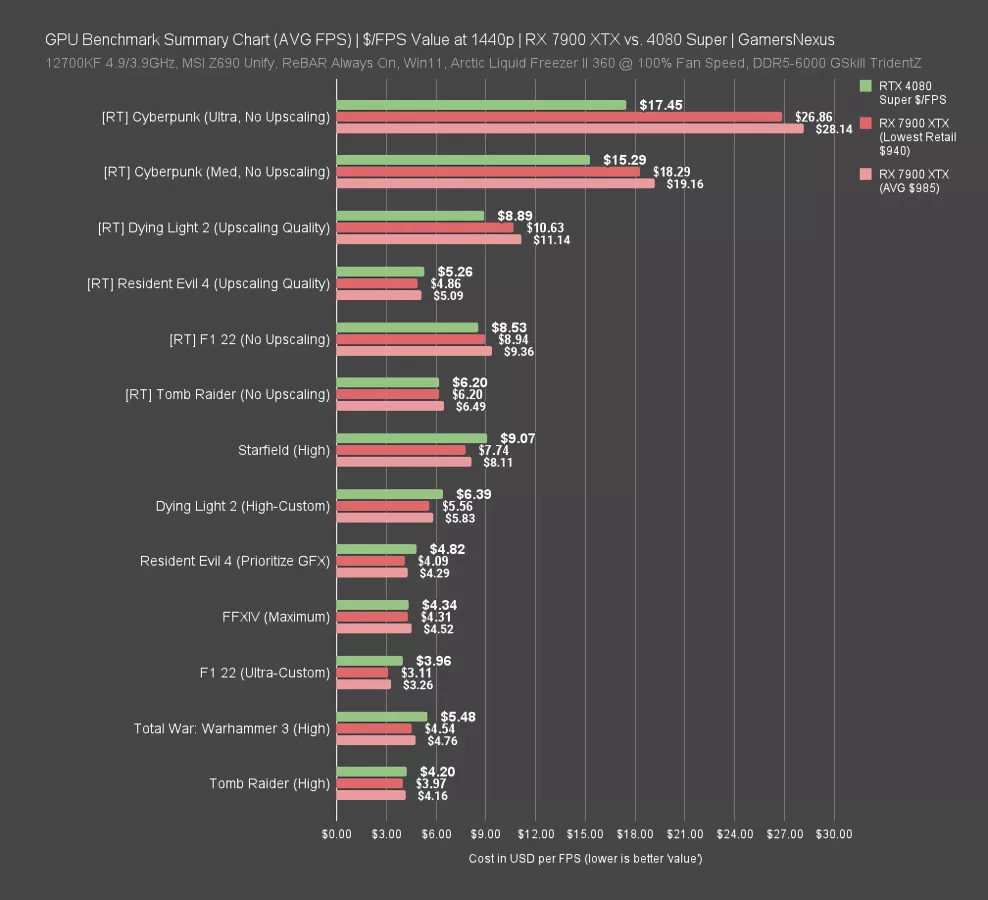
Here’s the price per frame chart. We have two values for the 7900 XTX to make comparison easier. The 4080 Super is assumed at $1,000, since we have no retail units to compare as of writing.
First looking at RT performance, particularly in Cyberpunk with ultra settings, AMD is getting killed for value. But remember, this specific test produces massive, double-digit percentage point increases with NVIDIA over AMD. The medium results are less intensive for the ray tracing workload, and as a result, the numbers level-out. NVIDIA still produces better value per frame.
In Dying Light 2, NVIDIA again maintains an advantage against both AMD price points. Resident Evil favors AMD, F1 with RT marginally favors NVIDIA, and Tomb Raider with RT has them about equal.
For rasterization performance, AMD generally has an advantage. It is typically below or roughly equal to NVIDIA in the games in the bottom half of our chart for rasterization. AMD’s performance is typically higher here or very close. That’s benefitting it in value here compared to in RT benchmarks.
% Reduction in Cost Per Frame - 1440p, 7900 XTX vs. 4080 Super (RT)
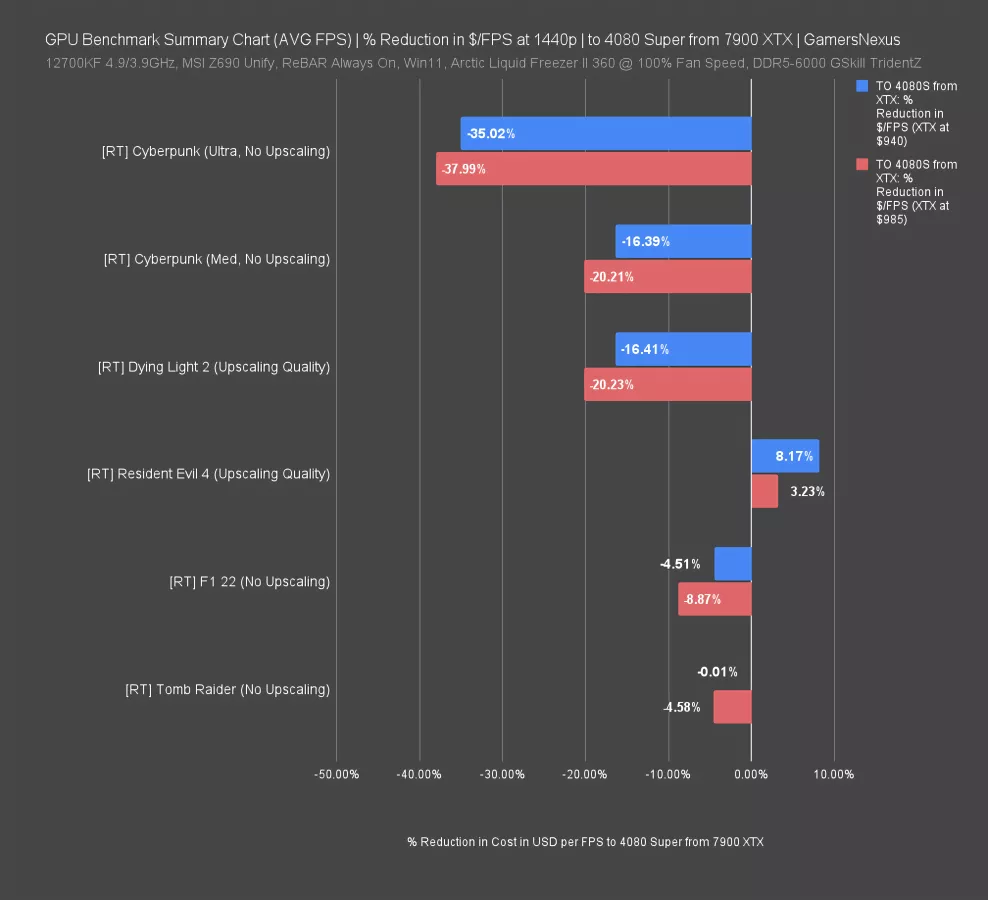
Here’s the % reduction in cost per frame with RT, moving to the 4080 Super from the XTX. At $985 for the XTX, the reduction in cost per FPS for the 4080 Super, despite a higher base cost, is 38% for Cyberpunk with Ultra RT, 20% at medium or in Dying Light, 9% for F1, and 5% for Tomb Raider. AMD has an advantage in our Resident Evil tests.
At $940, those numbers reduce to 35%, 16%, 4.5%, and equality in Tomb Raider.
% Reduction in Cost Per Frame - 1440p, 7900 XTX vs. 4080 Super (Rasterization)
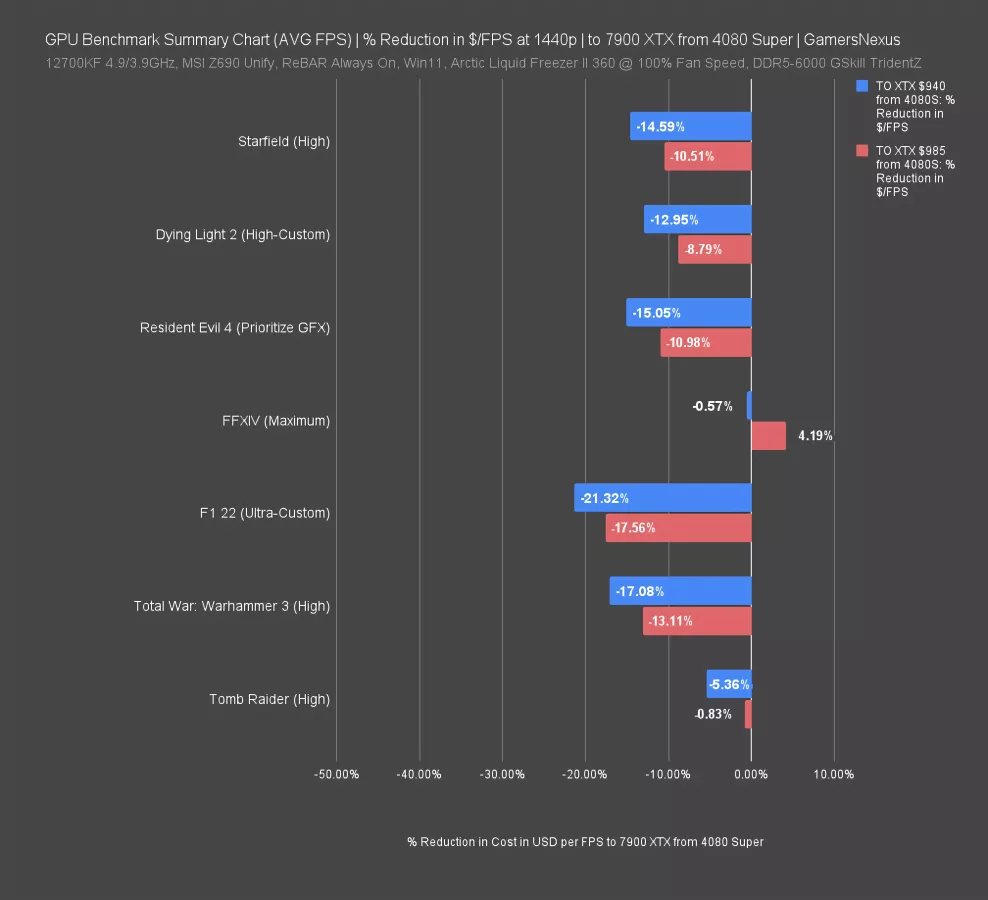
Let’s look at rasterization and flip the chart. Because the XTX tends to be better in these tests, the reduction in cost per FPS now favors the XTX. Buying AMD instead of NVIDIA here would give you a 15% lower cost per frame at $940 in Starfield and Resident Evil 4, 20% in our F1 test, and 17% in our Total War test. NVIDIA has a driver overhead advantage in our testing approach for Final Fantasy 14, so it levels out. The $985 options lose value, of course, but you’d need to determine if they have features you value more. They are still ahead of NVIDIA.
NVIDIA’s Progress
The next section will just look at NVIDIA’s progress in value.
A couple notes here: Price per frame value like this gets fuzzy when you exit direct head-to-head comparisons. Our main reservations about this kind of chart relate to how people actually shop: Generally speaking, people have a budget in mind or are determining it, then will buy roughly within a range. That means a head-to-head value chart can help. But very few people would say, “I only want to buy the best dollar per frame card” and ignore all other nuances.
These charts smooth over those nuances, including frame pacing, efficiency, latency, or even just the fact that again, most people don’t have an infinite range and then sort by best value for the purchase.
And for one last thing, just a note that the dollar numbers aren’t cross comparable at all necessarily between reviews. The FPS values are different, so the dollar values per FPS are different. As a result, the only thing that actually matters is the ranking within any given singular chart. Also, because the resulting $/FPS number is totally arbitrary and has no baseline for some known-good value, unlike a threshold such as 60FPS, you end up just looking at the approximate size of a bar in comparison to others anyway. We’re doing this as a percent chart instead.
Our pricing here was taken by averaging reasonable cards on first-party retailers. The 4090 (review here) was about $2,000 on average at time of writing, so we did not use its $1,600 MSRP.
One more thing: These charts skew HEAVILY based on whether you’re using 4K, 1440p, or 1080p results. That’s not just a bottlenecking consideration at the low-end, but because the cards scale differently depending on their capabilities. If people like this enough, we can play around with doing one for each resolution or something. That’s what you’d really need. But enough talk of the limitations -- you understand our reservations about it, let’s take a look.
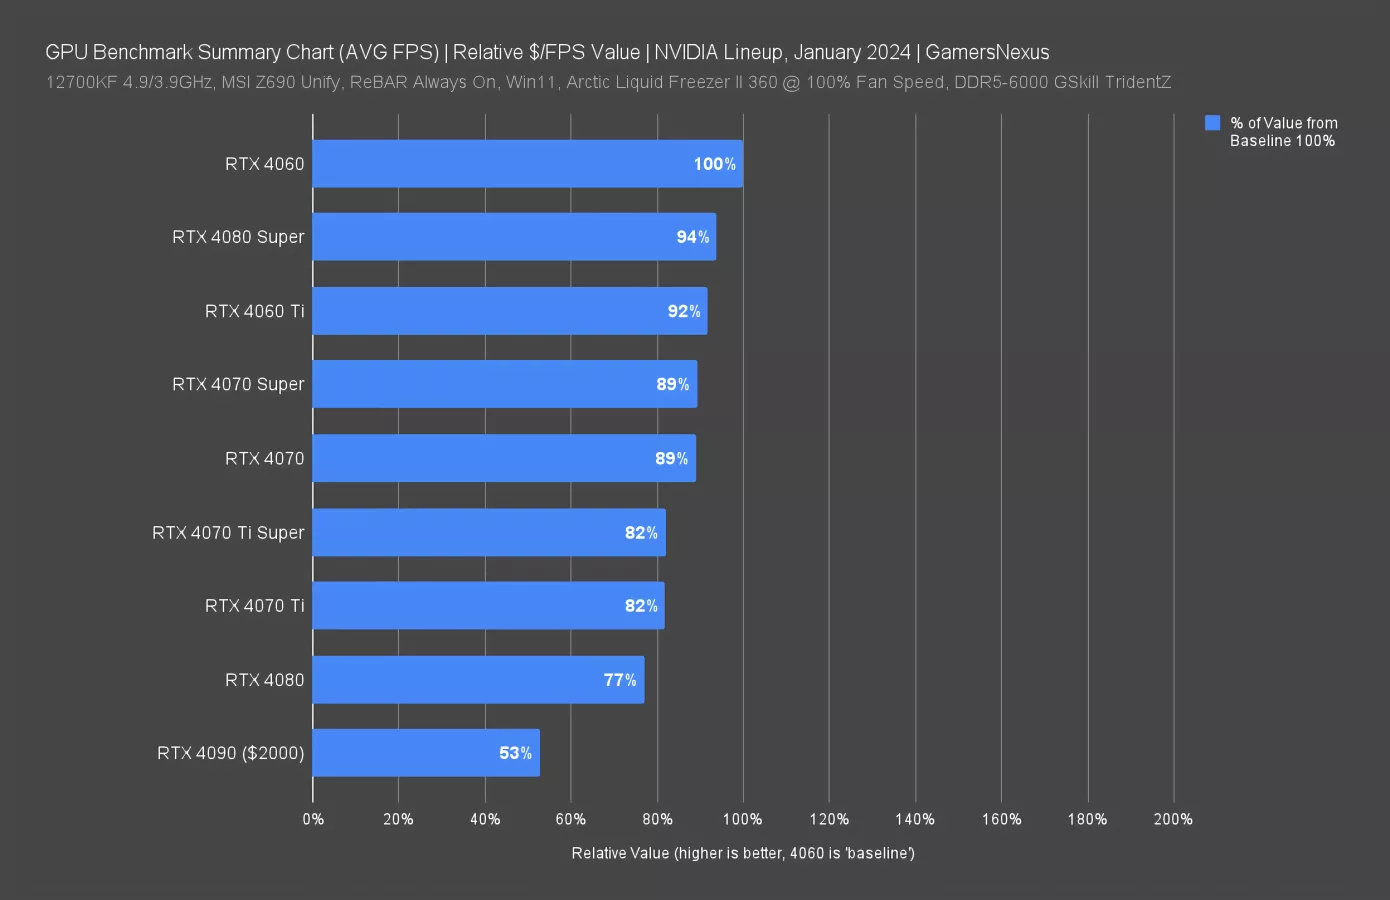
Anyway, here it is. This is new and we’re not sure if we like it, so that’s your disclaimer. No big claims for this one. Our commenters often ask for a value chart as an objective measure, but because of the hesitations explained, we don’t make them normally. This is a different approach for us.
100% is baseline best value of the cards presented on the chart, where “value” is determined as the $/FPS number. The result has the 4060 as the cheapest per FPS, so it’s at 100%. The 4090 is about half the “value,” if we want to make the decision as a community to phrase it like that and cut every single bit of nuance, like the fact that a 4060 could never do some of the things a 4090 could do. Regardless, what this does tell us is the direction NVIDIA is going.
By this chart, it would in fact appear that the 4080 Super’s new price drop has improved its “value.” The 4080 is among the worst on the chart and lacks some of those nuances that a 4090 provides. For instance, despite being a so-called “low value,” the 4090 is still the only card on this list we’d buy for our editing machines due to the VRAM, and that’s not something that gets measured in this way.
But you get the idea. We’re not sure if we like that chart or not, but it is a commonly requested one from the audience and we’ve been trying to play around with ways to slightly de-arbitrary-ize it. If you’re just looking at relative bar size anyway, might as well strap a number to it that’s a little more intuitive.
Conclusion

But at the end of the day, we come back to the 4080 Super conclusion. None of the playing around with charts actually matters and all of this can be done with the normal approach, which is just plain old critical thinking.
This review has been simple. Again, take our last round of charts and multiply the 4080 results by about 1-3% and increment it, and that’s the new result. It’s not worth singular charts in the video. It’s weird because it’s a “lame” launch with regard to the performance, and again, without that price drop, this would be getting one of the biggest roasts we could give -- just like some of NVIDIA’s cards last year.
But the price did come down, so that’s the only factor softening the ire. In this instance, the 4080 Super has indeed improved in value over the 4080. You don’t need a chart to tell you that: If a product is the same but gets a $200 price cut, its value just went up.
What’s more interesting is looking at things like the 4070, the 4070 Super, and the 4070 Ti Super to try and gauge value there. Generally speaking, as you go up the stack, the value tends to get worse. At least that’s historically been true. The 4070 Super helped revive some of that. The 4070 Ti Super, unfortunately, was a bit of a dud. Meanwhile the 4080 Super is cheaper. On the AMD side, the 7900 XTX is now effectively the direct alternative to the 4080 and 4080 Super.
In this case, we can’t praise NVIDIA as a savior for doing what should have been done a long time ago. We can, however, say that it is at least a better situation. But our hesitation to fully embrace this goes back to not getting suckered into encouraging a new method to keeping average prices high.
All of that said, one thing we noted in our efficiency testing for the 7600 XT was that the 4080’s appearance on those charts has made us at least somewhat more fond of it than previously. Before we had the FPS/W numbers, it wasn’t clear to us just how relatively efficient the base 4080 is and the 4080 Super is basically just a little better here. That’s something our review overhauls are helping with.
Anyway, that’s it for now. You have enough to work with to make your decisions. We’ll publish as many of the raw FPS numbers as we can get together soon.