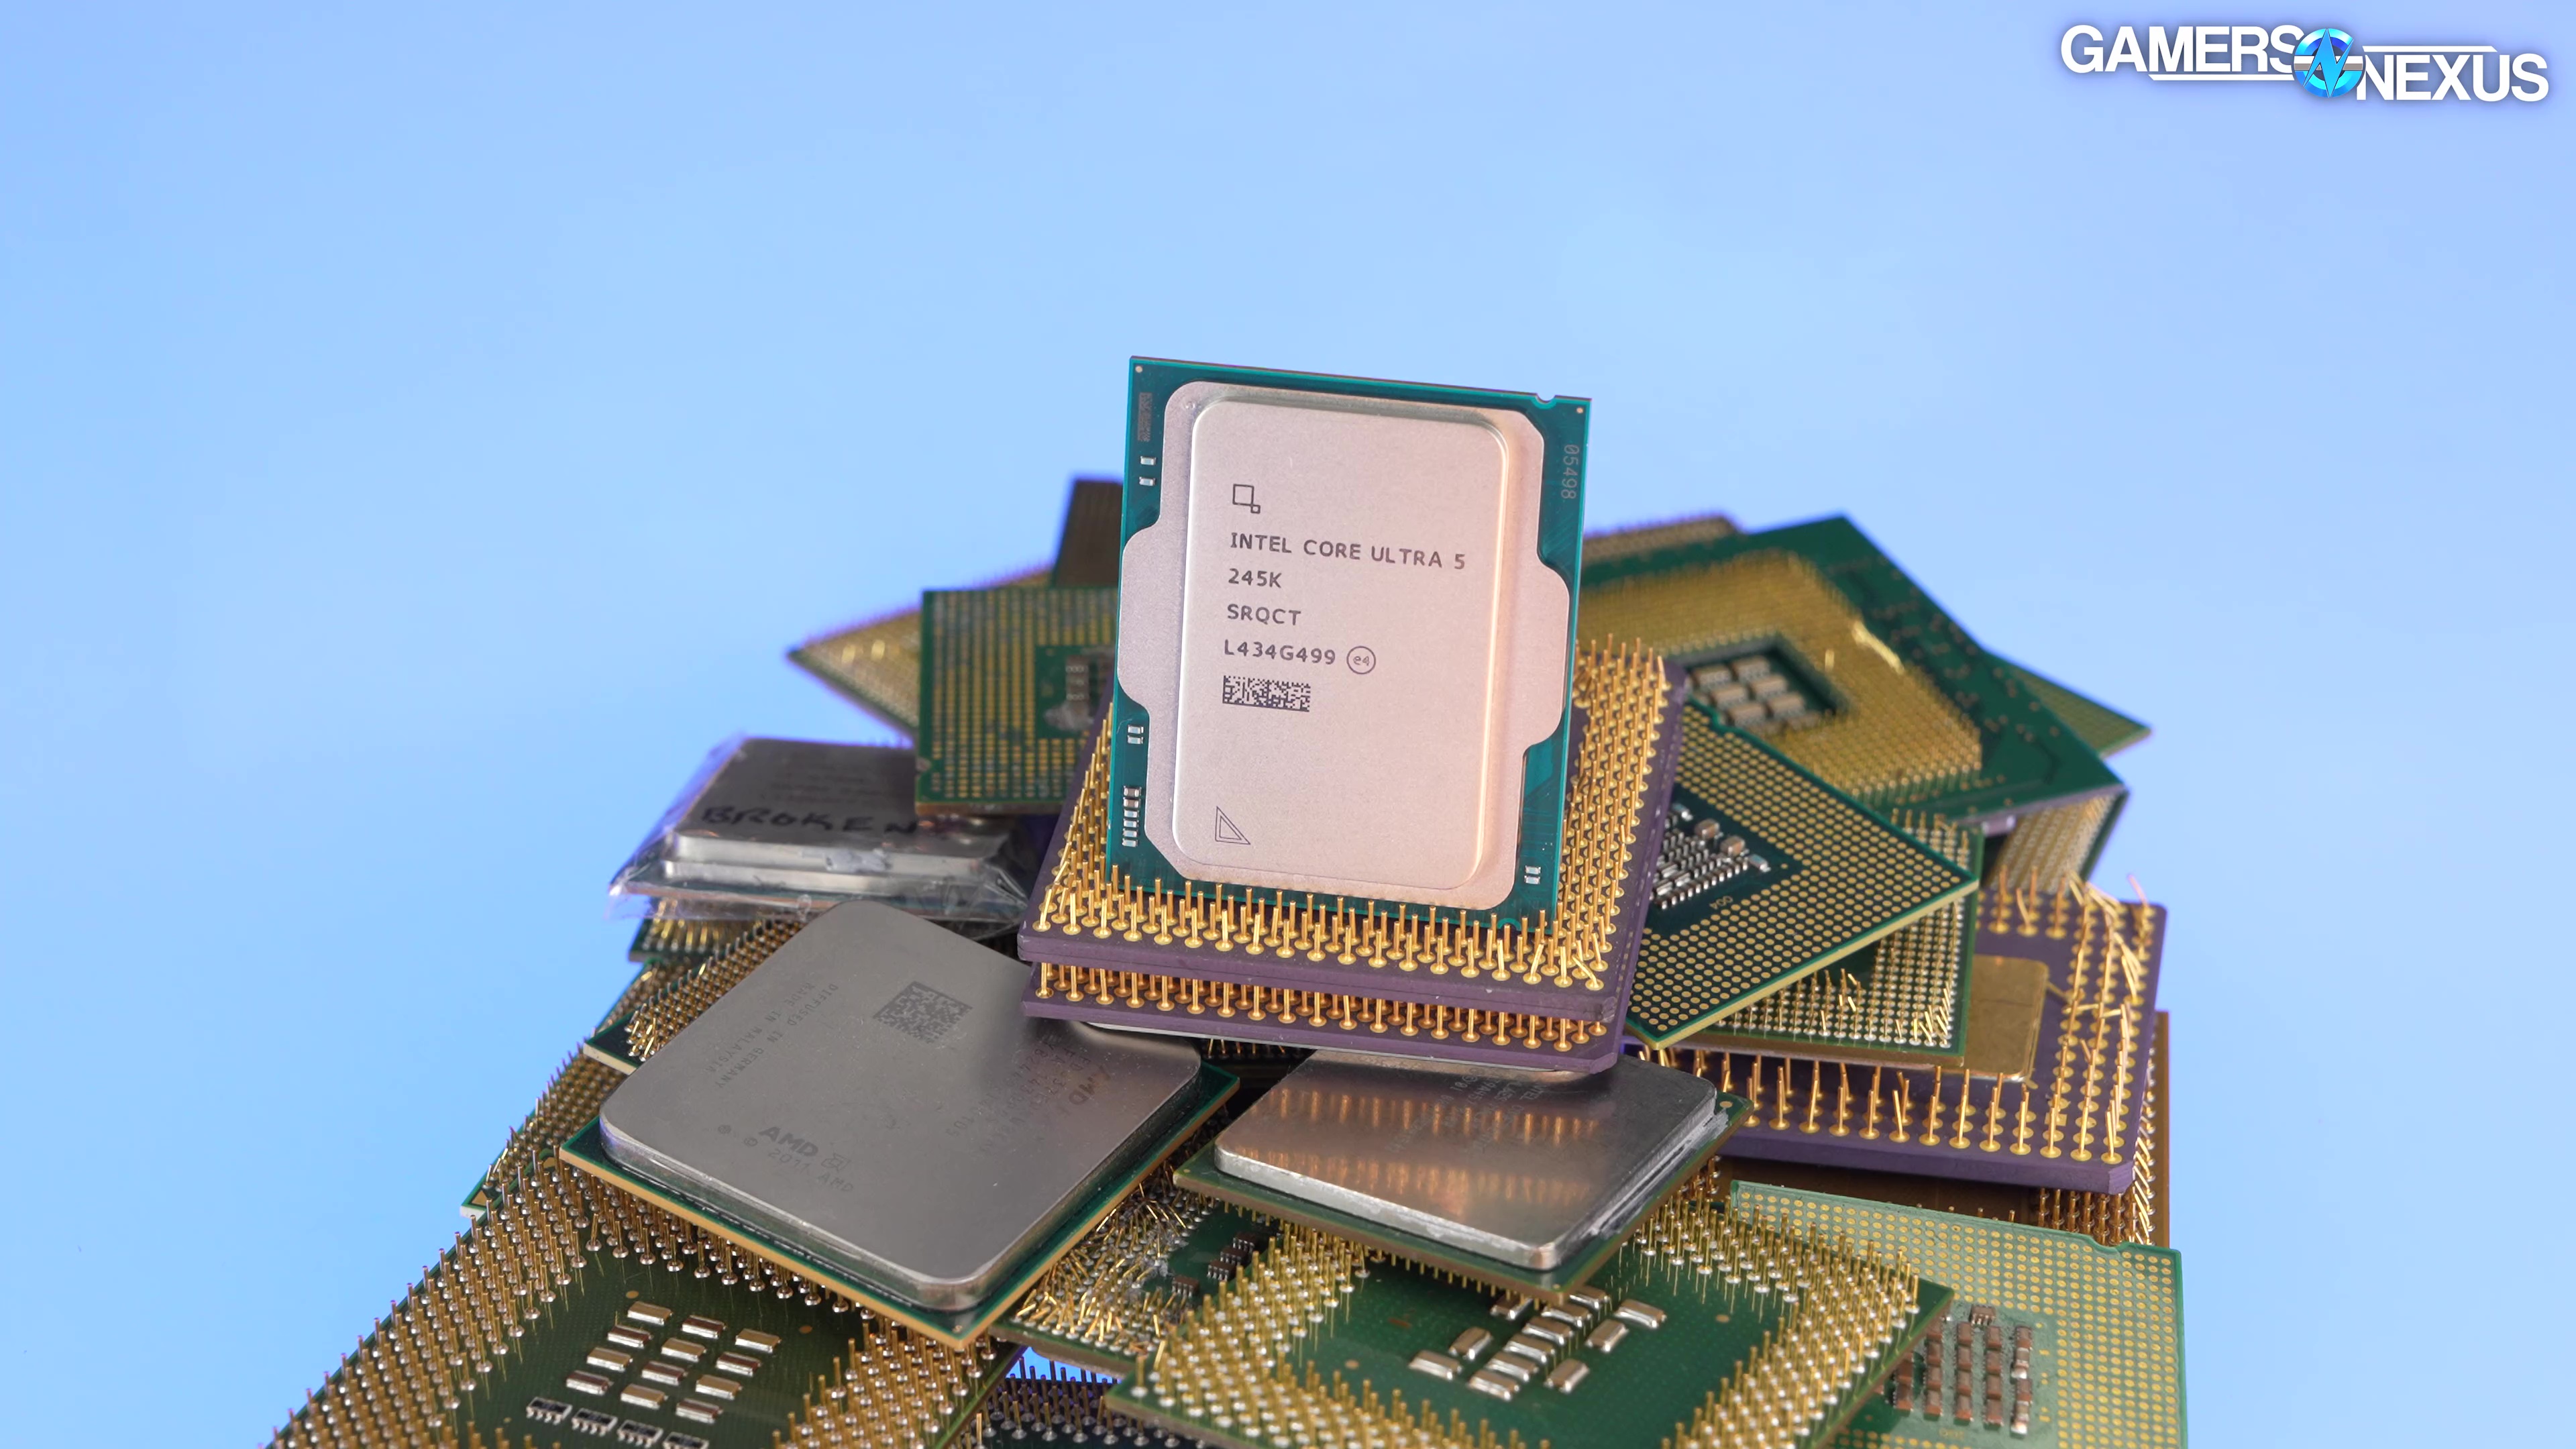
We review the Intel Core Ultra 245K CPU and analyze its efficiency, frequency, gaming performance, and more
The Highlights
- The Intel 245K has 6 P cores, 8 E cores, and 14 threads
- Despite efficiency improvements from Intel, AMD’s CPUs are generally more efficient
- Compared to older Intel CPUs, the 245K consumes less power and is more efficient but sometimes regresses in performance
- Original MSRP: $310
- Release Date: October 24, 2024
Table of Contents
- AutoTOC
Intro
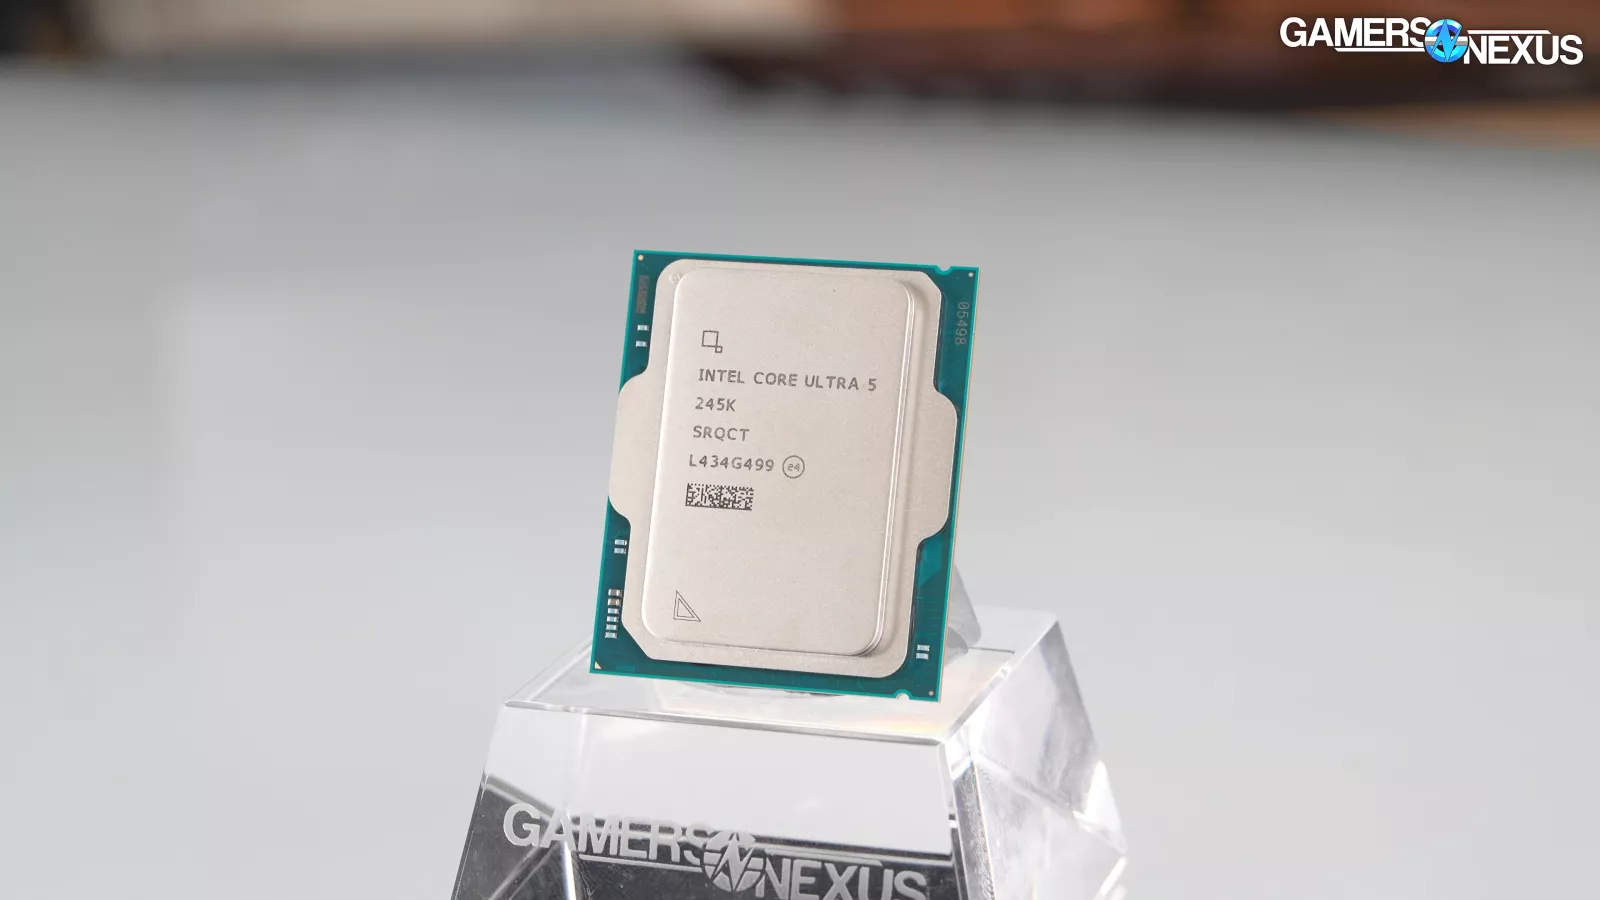
Now we’re reviewing the Intel Core Ultra 245K CPU, which you can think of as sort of a 15600K, just with a new name. This is a 6 P-core, 8 E-core part with 14 total threads. It’s priced at $310 MSRP and is meant to be a new mainstream gaming part.
Intel’s big Arrow Lake claim is efficiency and power consumption reductions, so we’ll spend a lot of time looking at that in addition to gaming and production performance.
Key comparisons against competing modern CPUs would be the 5700X3D, such as if you’re on AM4 and can upgrade one more time, the 9600X, and Intel’s prior generation parts. We’ll get into all of that.
Editor's note: This was originally published on October 25, 2024 as a video. This content has been adapted to written format for this article and is unchanged from the original publication.
Credits
Test Lead, Host, Writing
Steve Burke
Testing
Patrick Lathan
Mike Gaglione
Quality Control
Jeremy Clayton
Camera, Video Editing
Vitalii Makhnovets
Camera
Tim Phetdara
Writing, Web Editing
Jimmy Thang
Intel Core Ultra 5 245K Overview
Again, this review is hyper condensed compared to our 285K review. We really are leaving a lot of detail, but that’s because it’d be complete repeat information and is the same. We’ll focus mostly on charts today.
Intel Core Ultra 5 245K Price Comparison
Let’s start with the price comparison. These prices were taken in the week before reviews are going live, so they may change by the time it publishes.
CPU Price Comparison | GamersNexusLate October, 2024
| Newegg Price | Amazon Price | |
| Intel 245K (MSRP $310) | $330 | N/A |
| Intel 14700K | $375 | $350 |
| Intel 14600K | $250 | $225 |
| Intel 13700K | $350 | $290 |
| Intel 13600K | N/A | $225 |
| Intel 12900K | $300 | $280 |
| Intel 12600KF | $160 | $160 |
| AMD 9700X | $330 | $330 |
| AMD 9600X | $250 | $250 |
| AMD 7900 | $370 | $370 |
| AMD 7700X | $275 | $275 |
| AMD 7600 | $200 | $200 |
| AMD 5950X | $350 | $350 |
| AMD 5700X3D | $230 | $210 |
| AMD 7800X3D | $480 | $480 |
Here’s the list. Prices for both Intel’s 13th and 14th Series CPUs have recently dropped, as have some of AMD’s Zen 5 CPUs.
The 14700K is as cheap as $350 right now, which makes it a direct alternative to the 245K, despite buying into an older platform. It has at least gotten microcode updates that should resolve the major concerns. The 14600K is $225-$250 now, which is about the same price as the AMD 9600X. The 13600K is dwindling in supply, but $225 lately. The 12900K is also cheaper than the 245K, despite being on a pretty old platform, and is $280-$300. AMD’s 5700X3D (read our review) is around $210-$230 now, making it a key upgrade pathway for AM4 users. The 7800X3D is priced out of this territory, up at $480 typically. Keep in mind that a 9800X3D -- or whatever they end up calling it -- is due out on November 7th.
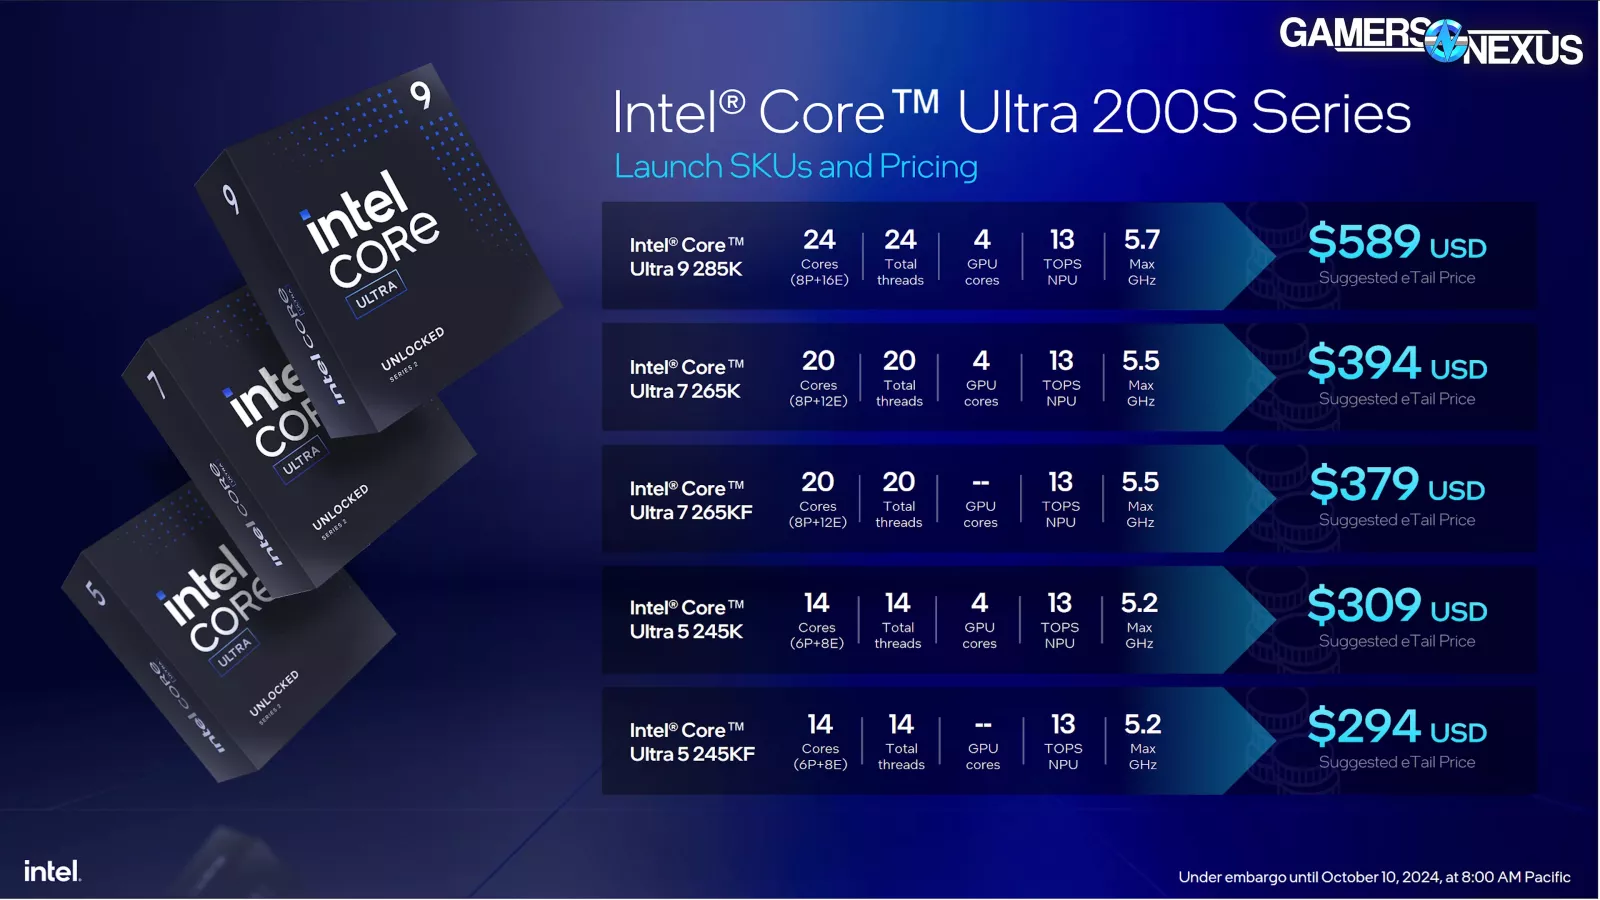
Here’s a slide showing the basic specs. The 285K is a 24-thread part and has 8 P-cores and 16 E-cores. Intel ditched hyper-threading, so it’s just the two core counts combined for thread-count. The 245K is a 14-thread part and has an advertised boost of up to 5.2GHz. Overall, Intel is focusing heavily on power consumption reductions and efficiency improvement.
But in the 285K review, we saw several areas where the CPU regressed in gaming performance. This complicates efficiency, because if the CPU is doing less work but also lower power, it’s not a clean improvement.
Let’s start with all of that.
Intel Core Ultra 5 245K Efficiency Testing
This section gets into efficiency testing. There are some really important details in our 285K review that you need to see to fully understand and appreciate this section. We’re not going to go through it all again here. The most important part is that ASUS is directing some power through the ATX12V cables on the 24-pin connectors now, so we can’t rely on purely EPS12V. We’re going to leave a lot of detail out here on the assumption you got it in the longer review.
Efficiency: 7-Zip Compression

In 7-Zip compression efficiency testing, we measured the 245K with EPS12V and ATX12V at 108.1W on average, which produced a MIPS/W rating of 1130.6, or in other words, 1130.6 million instructions per Joule.
The 245K outranked the 285K’s efficiency in the same test, meaning that the 285K is beyond the optimum point in the curve for efficiency. It’s still improved over the preceding 14900K.
The 14600K scored 768.3 MIPS/W here at 166.5W, so the 245K is improved in efficiency. The 245K’s performance in Compression MIPS is actually lower than the 14600K’s (read our review), but its power consumption dropped so drastically (even with ATX12V measured) that it has measuredly improved in efficiency, at 47% more efficient than the 14600K. Adding the 5V line includes I/O and so isn’t perfect, but even that is more efficient. We talk about why we add both in the 285K review.
AMD remains the leader, with the 9600X at 1152.8 MIPS/W, the 5700X3D at 1281, and the 7700 non-X at 1436.2.
Efficiency: 7-Zip Decompression

7-Zip decompression uses power from the same test since we combine them, but has different scores. In this one, the 245K held a score of 1090 MIP/W. Its actual MIPS throughput, which we’ll show later, is significantly behind the 14600K, so the efficiency percentage uplift is dragged down by regressive performance, despite the total power reduction. The improvement over the 14600K’s 821.9 result is 32.6%.
The closest score in MIPS throughput to this is the 5800X3D (watch our review), which is just outside of error. The 5800X3D and 245K are therefore completing about the same output and are normalized in this way, allowing the 5800X3D a staggering lead of 28% more efficiency than the 245K.
Efficiency: Baldur’s Gate 3

In Baldur’s Gate 3 efficiency, the 245K ran at 71.5W and scored 1.3 FPS/W. That has it tied in efficiency with the R7 7700 and it tied with the 9700X which wasn’t distant. These three CPUs can be looked at as nearly work-normalized, or FPS-normalized, in addition to scoring the same efficiency.
The 5800X3D has a substantial framerate lead and runs at only 65.7W, giving it a 1.8 FPS/W result at 38.5% more efficient than the 245K. The 5700X3D has a larger lead with its 51.1W result and is also typically cheaper, though on an old platform now with old I/O support. Still, it’s impressive.
Comparing the 245K to the 14600K, the lead is 44% uplift in efficiency compared to the 14600K’s 0.9 FPS/W result. The 14600K also had a slightly lower framerate in this one.
Efficiency: FFXIV Dawntrail

In Final Fantasy 14: Dawntrail, the 245K ran at 4.3 FPS/W and 51.8W, putting it behind the 9600X (which has a significantly higher framerate but about 10-11W higher power consumption) and ahead of the 14600K. The improvement over the 14600K’s 3.6 FPS/W result is 19%. The 5700X3D crushes here, up at 7.7 FPS/W and leading the 245K by 80% thanks to its lower power and its higher framerate.
Efficiency: Stellaris

Stellaris shows us simulations per Watt-hour, so higher is better despite the test being in seconds (with lower being better).
In this test, the 245K ran at 53.5W and completes 1.9 simulations per Watt-hour. That has it about tied with the 5800X3D, which likewise is roughly tied in power consumption. These are good direct comparisons.
The 5700X3D’s power consumption drop benefits it greatly here, although it slows down in simulation time. Its score is 2.4 simulations per Watt-hour, or an improvement over the 245K of 26%.
Against the 14600K, the 245K improves by 46%. The 14600K is slower in simulation time here.
Frequency Comparison
Single-Core Frequency Comparison (14900K vs. 285K)
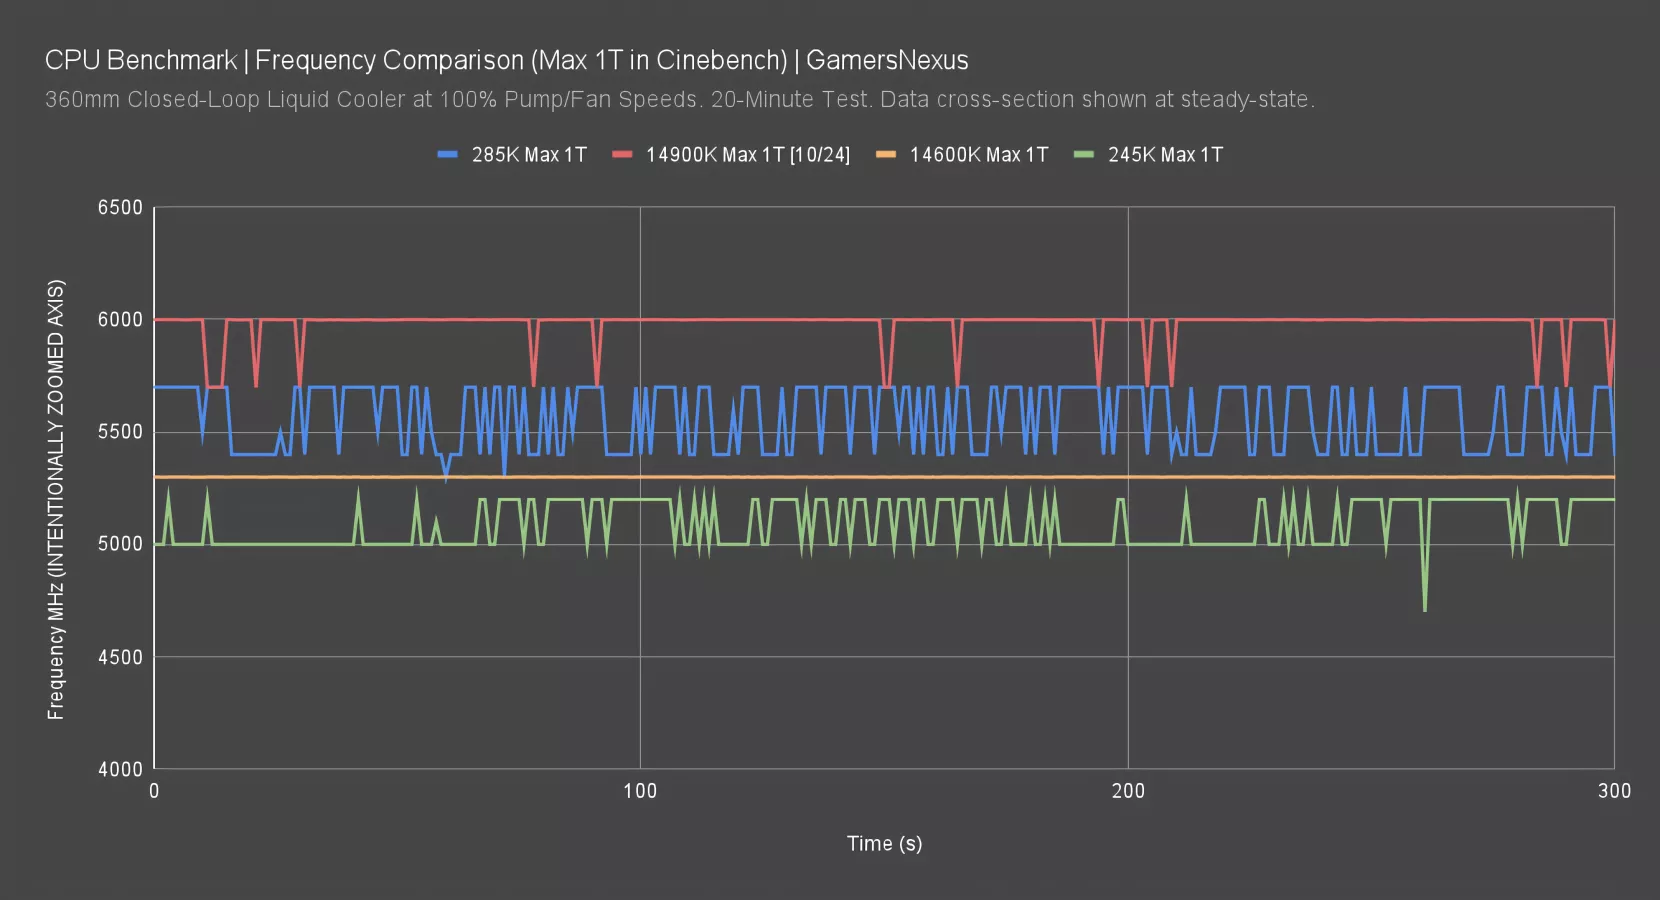
We’ll look at maximum single-core frequency under a Cinebench workload first, just to verify that the CPU does what Intel advertises.
The 285K plotted at about 5700MHz during this workload, with the 14900K at 6000MHz. The 14600K ran a maximum of about 5300MHz at any given period, with the new 245K at 5200MHz max. This is what Intel claims as the maximum, so that’s the bare minimum bar to clear and they have at least done that.
P-Core Frequency Comparison

This chart checks the P-core boosting behavior in an all-core workload. We measured the 285K at 5400MHz on average here. The 14900K’s (read our review) most recent result fluctuated around 5100-5200MHz. The 14600K has a flat 5300MHz P-core average from the original review. The 245K plots at 5000MHz for P-core boosting.
Intel Core Ultra 5 245K Gaming Benchmarks

Dragon’s Dogma 2

Dragon’s Dogma 2 is up. In this one, the 245K ran a baseline of 95 FPS AVG. This allowed it a slight lead over the similarly priced 9700X, at 91 FPS. The 245K also technically outperforms the 14600K, although realistically, they’re about equal.
The cheaper and low-power 5700X3D outperforms the 245K by 8.4% with 103 FPS AVG, a considerable lead for the older platform with the X3D-refreshed part. Moving to the 285K yields a 9.8% uplift, but you should watch our 285K review for all the nuance on that. The price jump is so significant that, especially for gaming-first builds, the 7800X3D likely makes more sense for most people.
APO did nothing here.
F1 24 - 1080p

F1 24 is up next.
The 245K ran at 307 FPS AVG here. That has the 9700X (read our review) 23% ahead at 378 FPS, the 5700X3D 16% ahead at 355 FPS, and the 14600K 4% ahead with a 319 FPS AVG. Intra-architecture, the 285K offers a 12% uplift at 344 FPS AVG. Notables that the 245K outperforms include the 12600K from 2021, at 13.7% ahead.
APO actually does something in this game sometimes: We talked about the "exciting" 1.2% gain in the 14900K. The 245K gained 1.8 FPS AVG from APO. Some of that might even not be margin of error. Groundbreaking stuff. That’s almost 0.6%!...
F1 24 - 1440p

Because APO was so impressive, you can understand why we decided to not bother dedicating time to running it for the 1440p test of F1. We didn’t want it to embarrass everything else…
At 1440p, the chart becomes truncated by the resolution increase. The end result is largely the same lower down the stack, though: The 245K remains outflanked by the 13600K and 14600K above it and encroached upon by the 12600K below it. These CPUs were already mostly CPU-bound and remain so here.
FFXIV Dawntrail - 1080p

Final Fantasy 14: Dawntrail is up now. At 1080p, the 245K ran at 220 FPS AVG. This allowed the 9700X a staggering lead of 41% for a similar price. The 7700X is cheaper than the 245K, at $280 at the time of writing, and produces a 265 FPS AVG result.
Against other CPUs: The 5700X3D outperforms the 245K by 37%, up at 301 FPS, with the 14600K leading it by 12% with its 248 FPS, and the 285K leading by 22% at 270 FPS. In our 285K review, we noted that Final Fantasy is one of Intel’s worst generational titles between the 14 Series and the Ultra 200 CPUs. As for APO, we were not able to pick up a difference outside of usual margins. The APO on result is 0.77% ahead of APO off, which is functionally noise.
FFXIV Dawntrail - 1440p

At 1440p, the 9700X’s lead is cut down to “only” -- and that “only” is doing some heavy lifting -- 22%. This is because of other limitations from the resolution change, but it shows that even at 1440p, the 245K is disadvantaged.
Baldur’s Gate 3

Baldur’s Gate 3 is up now, tested in the densely populated city center in Act III.
The 245K ran at 92-93 FPS AVG here. As a result, the 9700X improves upon its framerate by 7%, the 5700X3D’s 111 FPS result improves by 20%, and the 14600K is behind the 245K and alongside the 9600X. The 245K leads the 14600K by 6.2% here. This is at least better than what we saw with the 14900K and 285K. The 14900K was also encroaching on memory limitations, as evidenced by the 13700K and 13900K bouncing off of the same limit and the 285K with DDR5-8600 pushing ahead.
As for the 285K’s like-for-like lead over the 245K, that’s 8% at 100 FPS AVG.
Stellaris Simulation Time
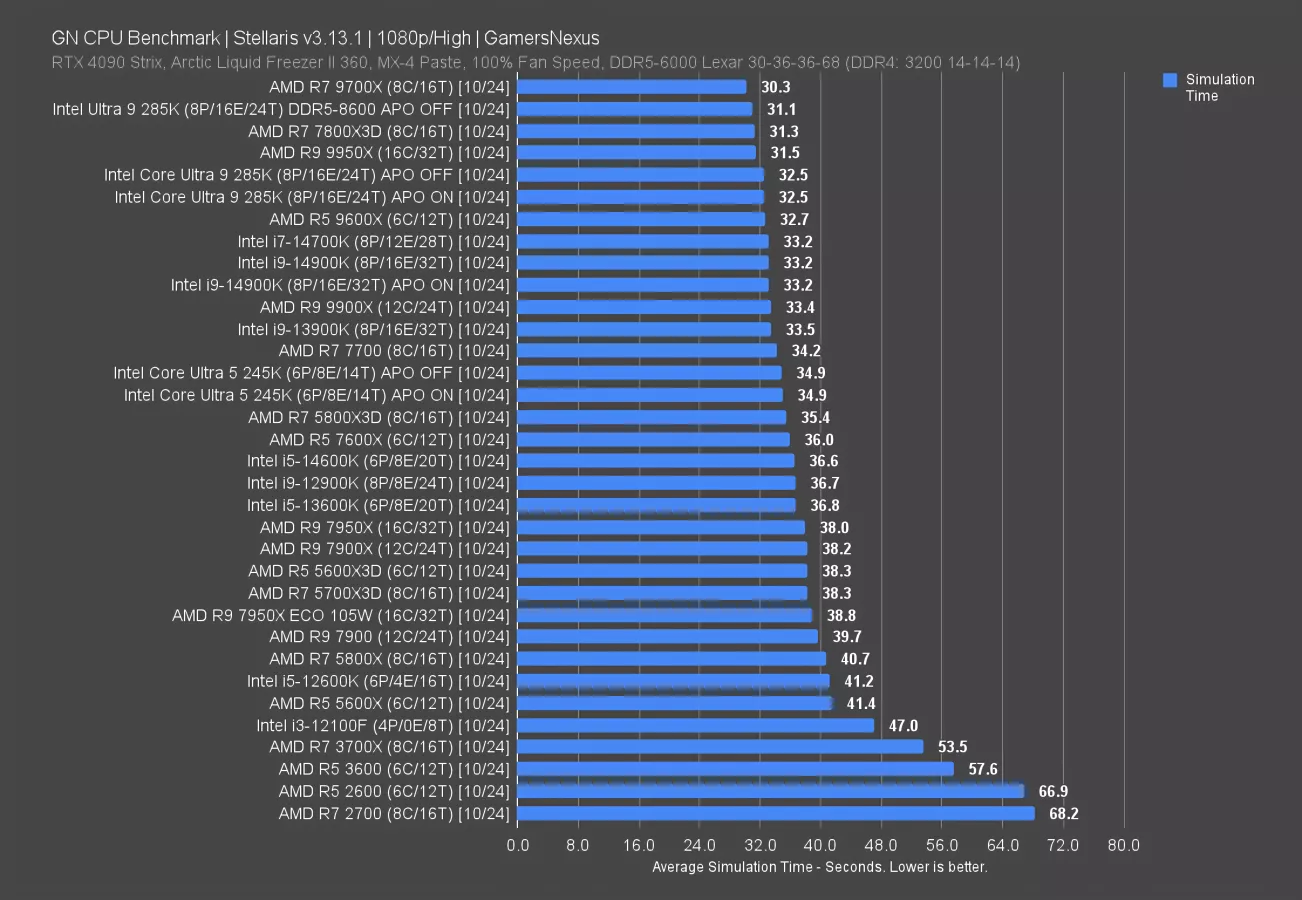
Stellaris is up next for something different. This one gives us simulation time in seconds rather than framerate per second.
The 245K required 34.9 seconds to complete the simulation, with APO doing nothing for simulation time. The result has the 245K just ahead of the 5800X3D, behind the 7700 non-X, and behind the new 9600X. Zen 5 does well in this particular benchmark.
Against the 14600K, the 245K benefits from a simulation time requirement reduction of 4.6%. The 245K also leads the 5700X3D with a simulation time reduction of 8.9%, with the 5700X3D falling back from its reduced frequency. The 285K reduces the time requirement from the 245K to 32.5 seconds, or reducing the time by about 7%.
Rainbow Six Siege
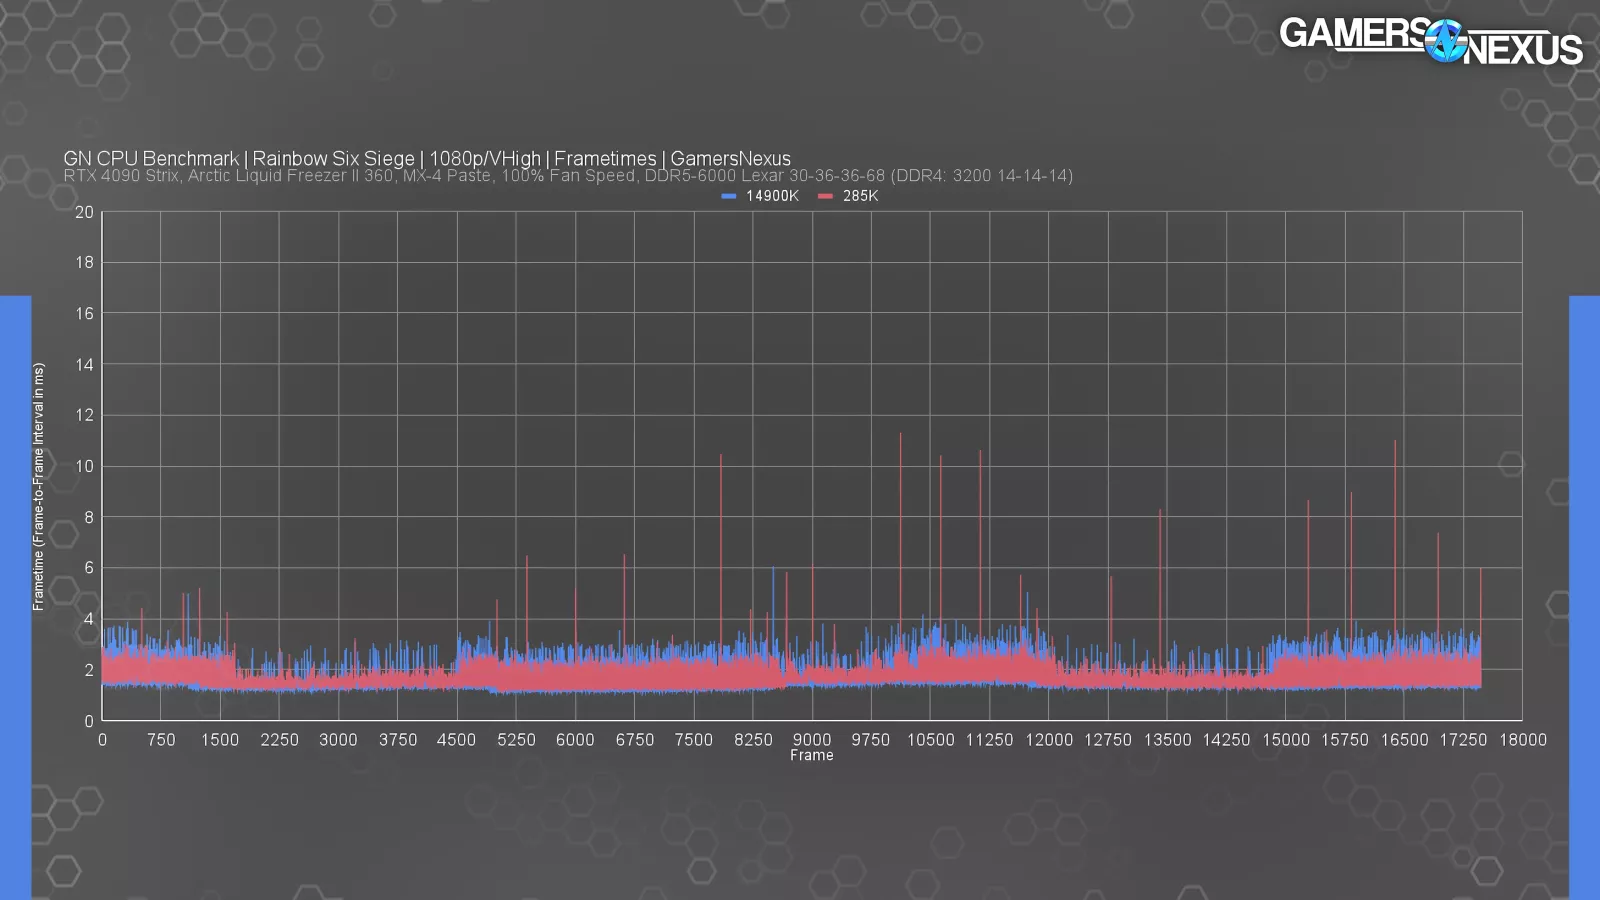
Rainbow Six Siege is next. In the 285K review, we showed the above frametime plot -- which we’ll show again here -- to illustrate some behavior where it appears as if frametime pacing is a little more tuned on the 12-14 Series CPUs than most the others we test.

Here’s the chart for the 245K. The 245K ran at about 476 FPS AVG, allowing the 9700X a staggering 31% lead at 621 FPS. The 5700X3D ran at 526 FPS, or a 10% lead. Next is the 14600K at 517 FPS for a 9% advantage over the 245K. Intra-architecture, the 285K leads the 245K by a noteworthy 22.6% -- though we still don’t recommend it against alternatives mentioned in the 285K review. That’s at least a real gap for the price gap.
Toggling APO didn’t change the 285K or 245K, though that’s not shown on this chart.
Lows remain reduced on some architectures, including Arrow Lake.
Starfield
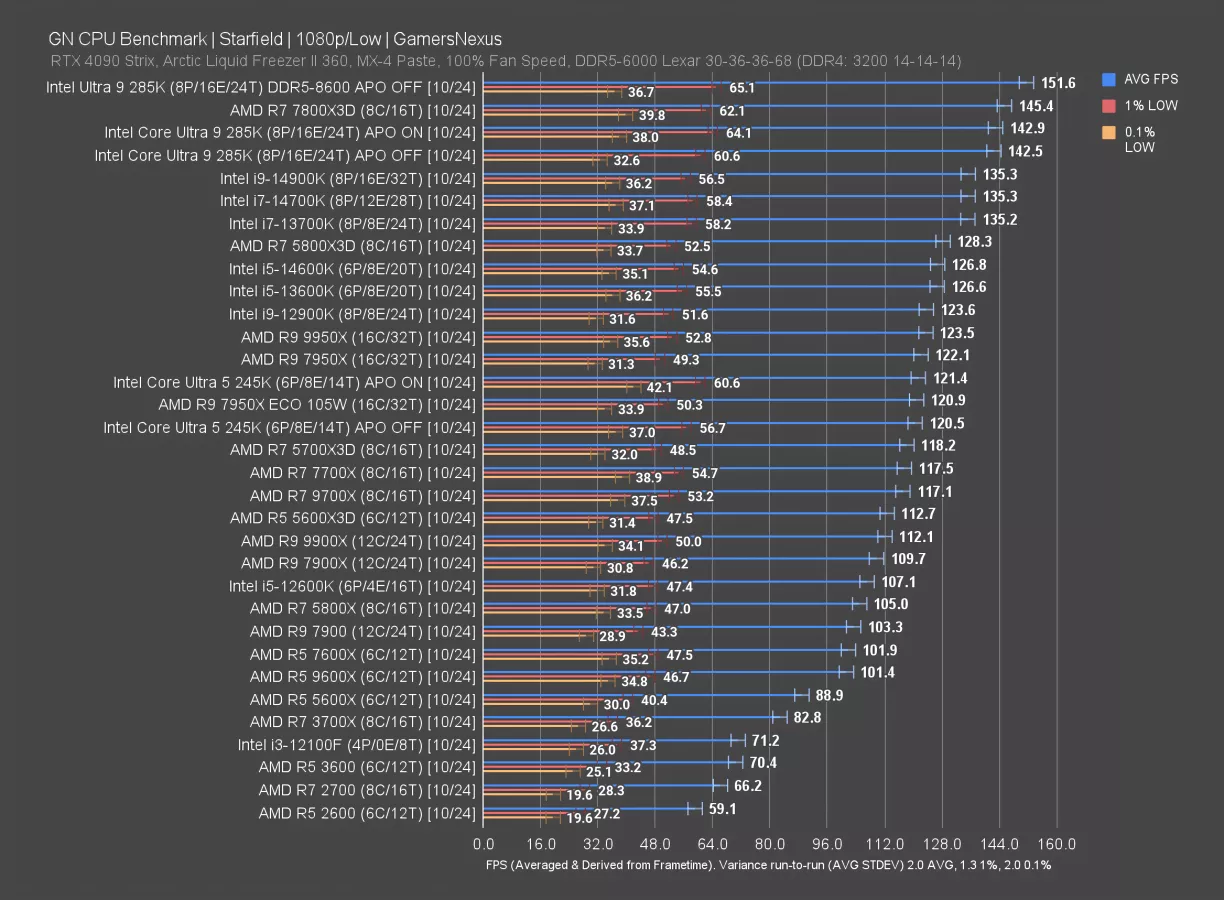
In Starfield, the 245K ran at 121FPS AVG. The 9700X held a 117 FPS result, within about 3% of the 245K but technically behind. The 5700X3D is also slightly behind, at 118 FPS. Intel’s own 14600K breaks away at 127 FPS, a 5% uplift over the 245K. Finally, the new 285K is about 18% ahead of the 245K -- similar to the gains we saw in Rainbow Six.
Toggling APO had no appreciable impact.
Intel Core Ultra 5 245K Production Benchmarks
Time to move into production tests. Like with the 285K, we’ll keep this short and focused but dense with charts.
Blender
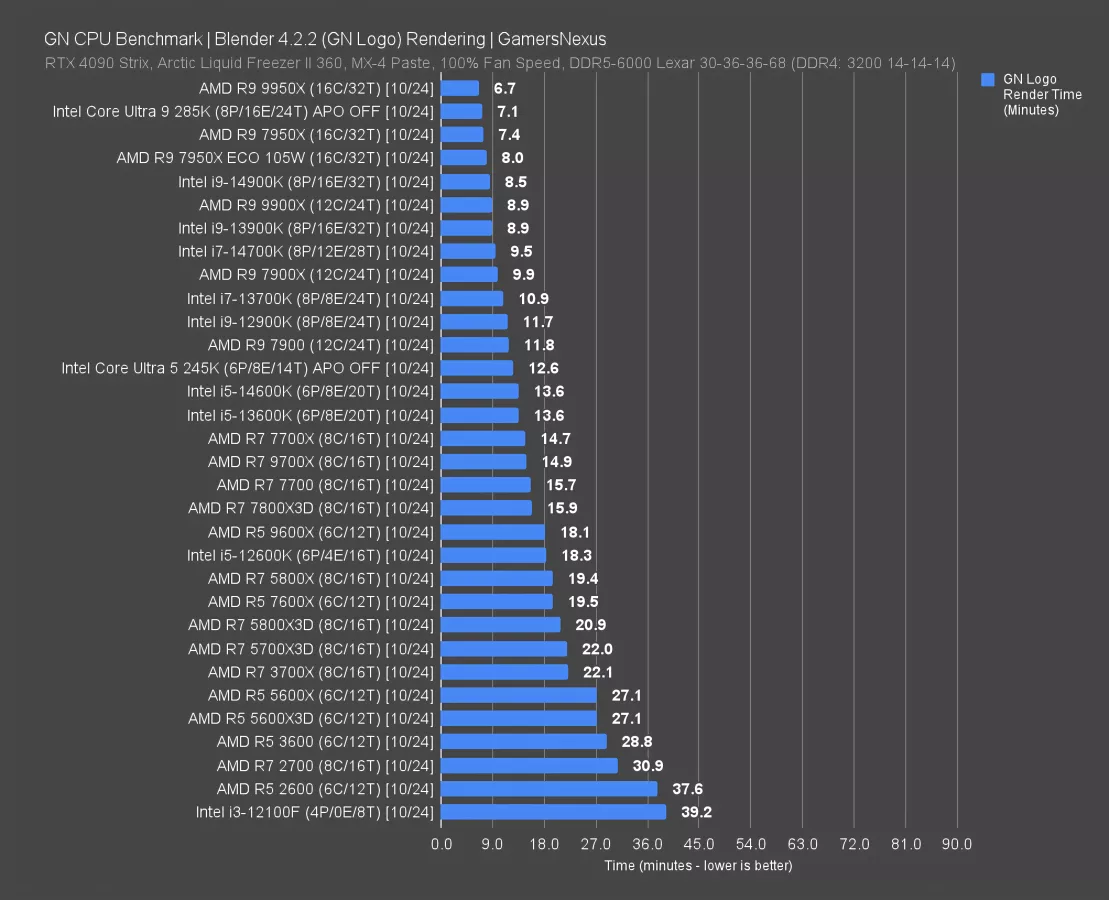
In Blender with CPU rendering, the 245K required 12.6 minutes to complete a render of a single frame from the GN video intro animation. That has it about a minute faster than the 14600K, reducing the time requirement by 7.4%. The 245K is beaten by the 14700K at 9.5 minutes, or a 24% reduction in time required. The 14700K (read our review) is $350 as we write this, which is a 13% increase in price over the 245K. The 285K was a relatively impressive performer in this test as well, with only the 9950X ahead of it. This is one of the few where Arrow Lake does OK in competitive scenarios.
7-Zip Compression

File compression with 7-Zip has the 245K at 122K MIPS, landing it behind the 13600K (watch our review) and 14600K. The 13600K improves upon the 245K by 4.1%. The 245K is just ahead of the 7700X and 9700X. The 7800X3D (watch our review) isn’t far back, but the extra cache doesn’t benefit it in our production suite.
The 285K with DDR5-8600 illustrated that this particular test benefits from better memory, providing a large uplift over the baseline 170K MIPS result that tied the stock setup with the 14700K.
7-Zip Decompression

Decompression doesn’t benefit nearly as much from the memory improvement, but does benefit from the extra threads found on some CPUs. The 14900K-to-285K comparison is an easy example of this, as is the presence of both of AMD’s 16-core SKUs at the top of the chart.
The 245K lands far down the chart, just ahead of the 5800X3D and behind the 5800X and 7800X3D. The 5800X illustrates that the higher frequency is more beneficial to this test than the extra cache on the 5800X3D. The 245K ends up beaten by the 14600K at 137K MIPS, an increase of 16%. The 13600K is similarly advantaged.
The 285K’s 193K MIPS result has it 64% ahead of the 245K, similar to the lead we see from the 14900K over the 14600K.
Ultimately, the 245K is beaten by several CPUs that are direct competitors, including the 7700 non-X (watch our review), the preceding 13700K and 14600K, the 7800X3D, and the 9700X.
Chromium Compile

Chromium code compile is up now. We explained the memory capacity change for high-end parts and the frequency limit on the 9950X in our 285K review.
In this one, the 245K required 134 minutes to complete the compile. That’s tied with the 14600K. The time requirement reduction for the 245K from the 9700X is 10% here, with the latter at 149 minutes. It’s also predictably better than the 7800X3D.
The 13700K (watch our review) reduces the compile time to 105 minutes, or a reduction in time of 21%.
Adobe Premiere

Using the Puget Suite, Adobe Premiere lands at 9824 points for the 245K. That has the new CPU sandwiched by the 7900 and 7900X above and the 13600K and 14600K below, with a more meaningful gap over the 9700X and 7800X3D. The $250 i7-13700K gives the 245K a serious run for its higher cost though, at 10616 points.
The 285K posts a large uplift over the 245K, at 15% higher in score. This was one of the more favorable tests for Arrow Lake with the 285K. That’s true too of the 245K, but there are better value alternatives (like the 13700K - especially now that Intel claims the microcode issue is fixed).
Adobe Photoshop

Adobe Photoshop is dominated by AMD in the current iteration of the software and Puget test. The 245K and 285K are far down the list, both behind the 13700K, 14700K, and almost everything modern from AMD. It’s not much of a contest here.
Intel Core Ultra 5 245K Conclusion

Here’s how it all breaks down: First off, we think you should probably just wait a week and see what the 9000X3D CPU does to the pricing and market.
That out of the way: It’s clear that Intel has, in fact, reduced its power consumption. That doesn’t mean, however, that it makes sense to purchase an Arrow Lake CPU.
Even catching the ATX12V power changes on our ASUS board, the CPU is lower power consumption and higher efficiency, even when it sometimes regresses in performance. Some games saw improved performance and lower power consumption, like Stellaris, which resulted in larger uplift than areas where we saw heavy performance regression, like Final Fantasy XIV: Dawntrail as compared to CPUs like the 14600K.
In production workloads, we saw regression from the 14600K in 7-Zip compression (though it still beats the 9700X there, so that’s impressive) and a few other areas. In Photoshop, the 245K improved on the 14600K technically, but AMD still holds a massive lead in this particular test. Premiere was a cleaner victory for the 245K, improving on the 14600K and reducing power draw.
Gaming had the 245K down around the 7700 levels in Baldur’s Gate 3 and ahead of the 9600X, but getting crushed by the 5700X3D, 5600X3D, and obviously the 7800X3D. Although the 245K’s relative positioning against the 9600X and 14600K flip-flopped, like in F1 where it was remarkably non-competitive, the global constant was that X3D outperformed the 245K. Fortunately for Intel, AMD doesn’t have any modern platform X3D CPUs that are in this price range. Until it replaces the 5700X3D in price with an AM5 part, Intel will at least have an advantage in fully modernized I/O despite disadvantages elsewhere like in raw performance as compared to something like an AM4 platform build, which is also just building into a close-to-EOL ecosystem.
Intel’s strongest argument right now is in the non-gaming workloads, but like the 285K, we just think the 245K has too much fierce competition to make sense at the moment. The efficiency improvement is important, and we talk at length about the power cost savings in the 285K review to calculate it across several years of ownership. It’s good that they improved there. It’s just that this platform (1) isn’t really ready, having already half a dozen major bugs leading into launch, and (2) is embattled on all sides by similarly priced or cheaper options.