AMD's Silent Launch: Ryzen 5 7600X3D CPU Review & Benchmarks vs. 7800X3D, 5700X3D, 9800X3D
Last Updated:
We analyze the 7600X3D’s all-core/single-core frequency, efficiency, gaming benchmarks, and productivity performance
The Highlights
- The 7600X3D is a 6-core, 12-thread X3D AM4 CPU that’s sold from Micro Center
- The cheaper 7600X performs better in some specific frequency-constrained scenarios that can’t utilize the extra cache
- The 7600X3D is one of the most efficient CPUs we’ve tested yet
- Original MSRP: $300
- Release Date: August 30, 2024
Table of Contents
- AutoTOC

Intro
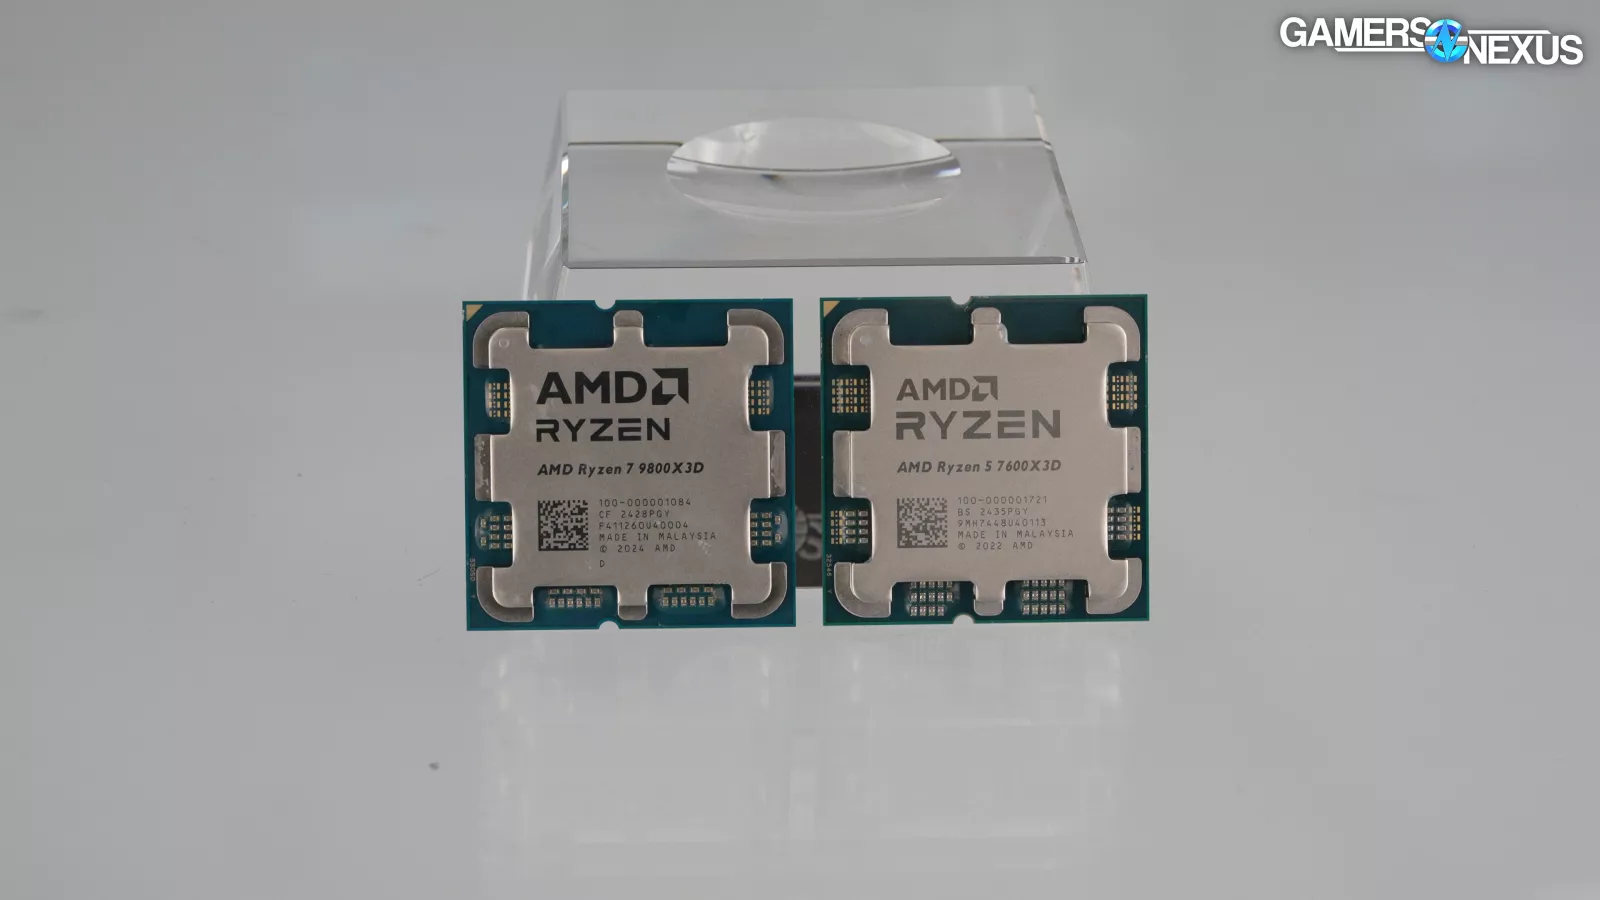
AMD somewhat secretly launched its R5 7600X3D. It’s a 6-core, 12-thread X3D part that we bought for $300 from Micro Center in Charlotte. AMD didn’t email us about this CPU, didn’t do review sampling, and just sort of quietly launched it to the market through Micro Center. It’s similar to the 5600X3D launch (read our review here).
This runs on Zen 4 and is advertised as having a maximum 4.7 GHz boost clock and 4.1 GHz base clock. TDP is listed at 65W. AMD’s 7600X has a higher 105W TDP and runs an advertised maximum clock of 5.3 GHz, or 4.7 GHz base. That’ll make the 7600X better in some specific frequency-constrained scenarios that can’t utilize the extra cache, like in our non-gaming tests, but it’ll also make it more power hungry and having that extra cache normally allows better performance in gaming, even if the frequency is lower, and it tends to be more efficient.
Editor's note: This was originally published on November 7, 2024 as a video. This content has been adapted to written format for this article and is unchanged from the original publication.
Credits
Test Lead, Host, Writing
Steve Burke
Testing
Patrick Lathan
Testing, Video Editing
Mike Gaglione
Video Editing, Camera
Tim Phetdara
Writing, Web Editing
Jimmy Thang
That’d make the 7600 more of a direct comparison for efficiency testing, as its TDP is also 65W.
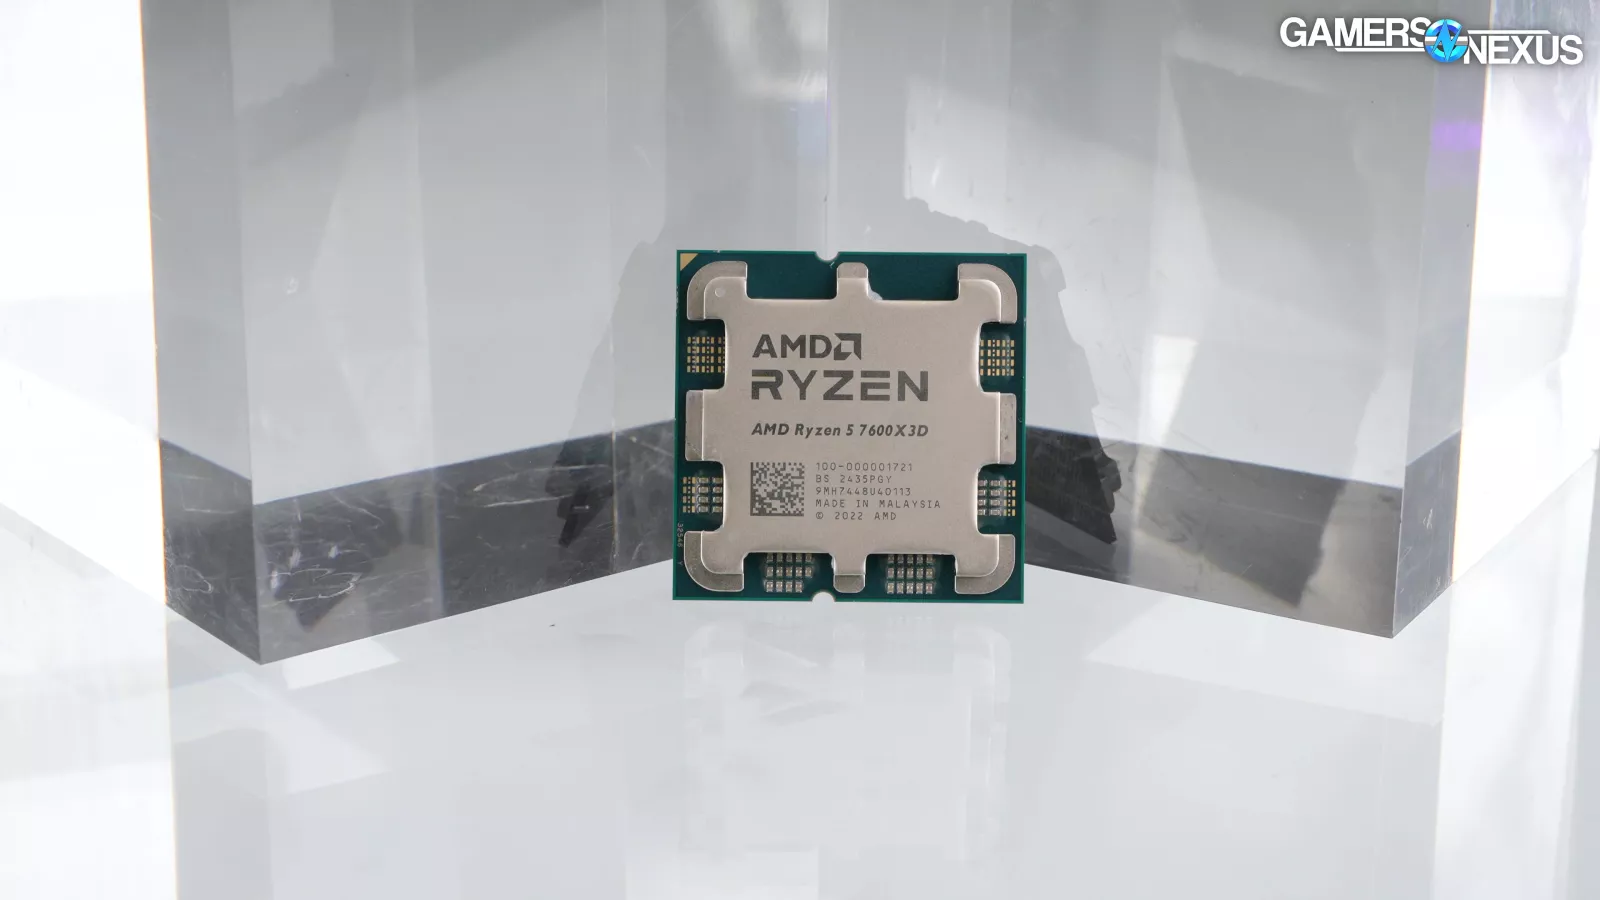
The 7600X3D was a surprise to us. A few weeks ago, we had a viewer ask why we hadn’t tested it yet -- the answer was that we didn’t know it existed, and we’re excited to work on it now. The CPU ends up being one of the most efficient we’ve yet tested thanks to its low TDP and high performance.
Let’s get into the review.
AMD R5 7600X3D Overview & Specs
Technically, the CPU is currently a Micro Center-exclusive like the 5600X3D, so we’re not sure if that’ll change or how many they’ll have.
Getting into pricing first:
CPU Price Comparison | GamersNexus (Early November, 2024)
| Newegg Price | Amazon Price | |
| AMD 9800X3D (MSRP $480) | ||
| AMD 9950X | $585 | $600 |
| AMD 9900X | $430 | $383 |
| AMD 9700X | $327 | $325 |
| AMD 7950X3D | $598 (OOS) | $598 |
| AMD 7950X | $493 | $487 |
| AMD 7900X | $396 | $319 |
| AMD 7900 | $358 | $368 |
| AMD 7800X3D | $449 (OOS) | $476 |
| AMD 5700X3D | $229 | $187 |
| Intel 285K | $630 (OOS) | NFS / OOS |
| Intel 265K | $400 | $400 |
| Intel 245K | $320 | $320 |
| Intel 14900K | $440 | $440 |
| Intel 14700K | $347 | $347 |
| Intel 13900K | NFS / OOS | $445 |
| Intel 13700K | NFS / OOS | $343 |
| Intel 12900K | $310 | $277 |
Currently, the 7600X non-3D (watch our review) is $224 on Newegg and $208 on Amazon at the time of reporting. It’s $190 from Micro Center, which is the more like-for-like comparison to the $300 7600X3D.
Other relevant parts include the 7800X3D at 8 cores and 16 threads, priced at $480 or so on Amazon and $450 on Micro Center’s site. Between the two, it’s $150 to $180 more expensive to get the R7 7800X3D (watch our review) or the new 9800X3D, which is $480.
Intel’s most relevant, modern competition might include the $320 245K, $350 14700K, $344 13700K, or, oddly, the 12900K at $277.
This review is going to be kept as simple as possible. We just launched a massive deep-dive into the 9800X3D and included a ton of charts, so coming off of all that hard work, we’re trying to go with a straight-forward review today. If you want more depth and more discussion with even more charts, make sure to check out the 9800X3D review.
For now, let’s get into a simple review of the 7600X3D.
AMD R5 7600X3D Frequency
AMD R5 7600X3D All-Core Frequency

We’ll start with a frequency inspection to understand the performance we see later.
Here’s an all-core workload. The 9800X3D we just reviewed ran at about 5225 MHz average, which is an impressive clock to hold for a 3D V-Cache part. It’s also a flat hold of the frequency thanks to the extra power budget. The 7800X3D fluctuates more due to the power constraint, holding around 4850 MHz on average.
The 7600X3D comes in below that, at 4700 to 4730 MHz, also moving up and down through the test.
For perspective, the 7600X non-3D part ran at about the same clock as the 9800X3D, up around 5225 MHz. If you see the 7600X outperform the 7600X3D in some tests, that won’t be a surprise: Anything which relies less on the extra cache than on higher clocks will see a regression in performance. This is less prevalent on the Zen 5 9800X3D due to its higher power budget and because the 9700X had a lower power budget.
AMD R5 7600X3D Single-Core Frequency

This chart is for the maximum single-core boost during a Cinebench single-threaded workload. This allows us to see how fast the cores go when unlikely to breach power limits.
The 9800X3D we just reviewed held the same 5225 MHz clock we saw in all-core testing and did so throughout the benchmark.
The 7800X3D ran faster than its all-core workload, which is more typical. That had it at 5050 MHz during this test on the fastest core per interval.
The 7600X3D is far slower than that, with a comparatively huge drop to 4750 MHz for the fastest single core per interval. That’s a large drop that will likely contribute to losses in certain titles, maybe like Final Fantasy, more than the core count difference between the two would.
The 7600X ran at 5450 MHz for the fastest single core, which will also benefit it in lightly threaded scenarios where the extra cache doesn’t contribute much.
AMD R5 7600X3D Gaming Benchmarks
Efficiency: Baldur’s Gate 3

For gaming efficiency first, we were impressed with the 7600X3D’s efficient performance in Baldur’s Gate 3. It’s the new most-efficient CPU in our testing.
Our efficiency benchmarks are a combination of both power drawn during the test and the performance output in the test, which is FPS in this situation. Tweaking either dial can improve efficiency since it’s a calculation of the two.
The 7600X3D ended up at 42.8W in this test, which has it reduced from the 5700X3D, 5800X3D (watch our review), and 7800X3D. It’s among the lowest power draw parts in this test, alongside the older R7 2700. With the 12W reduction from the 7800X3D and with performance similar to the 5700X3D, the 7600X3D ends up at 2.7 FPS/W, which is an awesome result that we didn’t expect to see. The 9800X3D is alongside it at the top, roughly tied with the 7800X3D at 2.3 to 2.4 FPS/W. This is a strong start. And for the 7600, that landed at 1.6 FPS per watt, which puts it above the 5600X, below the 5800X3D, and predictably above the 7600X, but it’s still below the 7600X3D.
Efficiency: Final Fantasy XIV

Final Fantasy 14: Dawntrail also has insanely efficient performance. The CPU is, once again, not the best performer on the charts, but it encroaches on the top and manages to do so while at 34W during this benchmark. Because the power is so much lower overall, the efficiency climbs despite a reduction in max FPS versus better AMD parts.
The end result is a 10.3 FPS/W rating, the highest we’ve seen, against 8.3 FPS/W on the 7800X3D. The 7800X3D is reaching the upper bound of what it can achieve for performance: It’s possible that this number increases with the launch of the RTX 5090, but for now, it’s stuck at 8.3 FPS/W. The 7600X original part pulls a little more power and performs far worse, landing it down at 5.6 FPS/W. That’s still ahead of anything Intel has to offer, including the 245K at 4.3 FPS/W, but nowhere close to the 7600X3D.
Stellaris
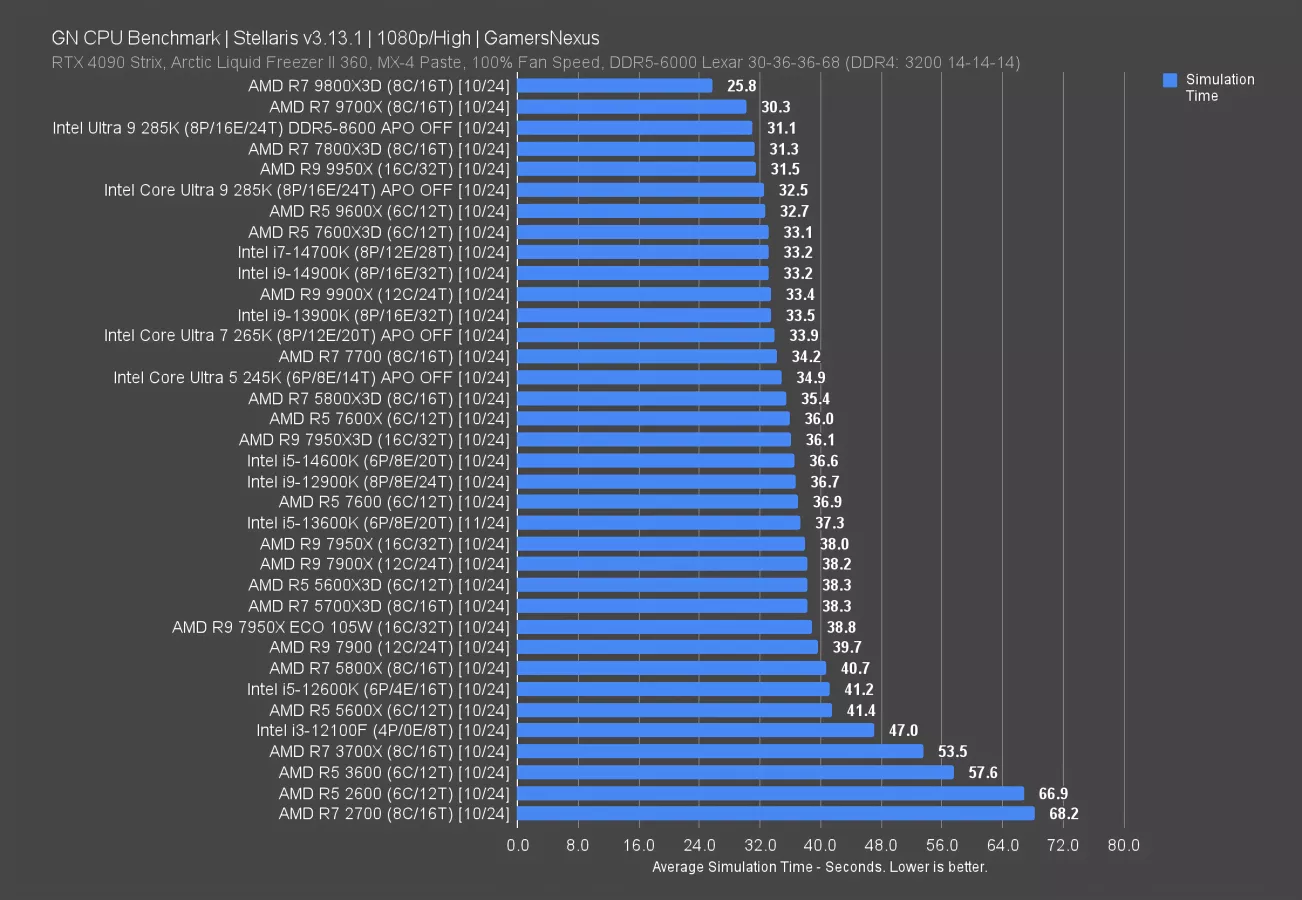
In Stellaris, the 7600X3D required 33.1 seconds to complete the simulation. This reduces the time required from the 7600X’s 36-second entry by 8%. The 9600X, from Zen 5, outperforms the 7600X3D, benefiting from the overall Zen 5 uplift we’ve seen in this specific game. Aside from that, everything else above the 7600X3D is significantly more expensive, including the 285K at $630 but providing only a 1.8% reduction in time required to simulate.
Against the 5700X3D (read our review), the 7600X3D sees a 14% reduction in time required. The same is true compared to the 5600X3D.
The new 9800X3D is aided hugely by its architecture and frequency, requiring 22% less time than the 7600X3D. The 7800X3D benefits from a 5.4% reduction in time required. Overall, the 7600X3D encroaches on the 7800X3D while being significantly lower cost, but can’t come close to the 9800X3D.
Dragon’s Dogma 2

Dragon’s Dogma 2 is up now. This is another title where the 9800X3D saw strong performance.
For this game, the 9800X3D holds a 21% lead over the 7600X3D in average FPS, at about 129 FPS to 106. The lows are proportional to the increase in average FPS. There is no particularly abnormal advantage to those found on the 9800X3D, although they are good.
Compared to the 5700X3D’s 103 FPS AVG, the 7600X3D holds a small 3.1% lead. It’s 3.5% ahead of the prior generation 5600X3D, which was also Microcenter-exclusive.
As for Intel, key comparisons include the 245K (read our review) at 95 FPS AVG and priced similarly to the 7600X3D. This gives the 7600X3D a 12% advantage in average FPS over the new 245K, with lows again proportionally higher. The i7 and i9 CPUs from the 13th and 14th series are all roughly tied with the 7600X3D, but slightly ahead. The 5800X3D maintains its position at the top of this grouping, beaten only by its newer alternatives.
Starfield

Starfield is up now. This was another strong one for the 9800X3D when we reviewed it.
In this one, the 7600X3D ran at 122 FPS AVG. That means the 9800X3D’s 169 FPS result has it about 38% ahead of the 7600X3D, a significant jaunt. The 7800X3D ran at 145 FPS AVG, offering its own improvement of 19% over the 7600X3D. The 7600X3D is definitely a lower-end part than the two flagships. Compared to the 5700X3D though, the 7600X3D is technically improved -- though basically within error at 3.2% uplift. The 5600X3D gives the 7600X3D a lead of 8.2%, widening the gap in favor of the newer Micro Center-exclusive part.
Intel’s showing includes the 245K at about the same framerate and a similar price, the 12900K at a higher framerate, and the 13600K also ahead. The 7600X3D is stunted by a combination of its lower core count and its frequency, not able to leverage the cache to the same extent as the higher-end AMD X3D parts. The 7600X3D at least holds about a 20% uplift over the 7600X, which was down at 102 FPS AVG.
Baldur’s Gate 3

In Baldur’s Gate 3, the 9800X3D experienced a large performance boost that we spent several minutes digging into in its review. It’s an outlier.
The 7600X3D is more typical: It ran the game at 116 FPS AVG, which allows the 9800X3D another 38% lead. The lows remain impressive on the 9800X3D, followed by the prior 13 series and 14 series CPUs as the next most impressive for lows. The 7600X3D is overall “fine” for lows, but its position is predictable within this stack.
The 7800X3D posted a 126 FPS AVG in Baldur’s Gate, giving it a boost of 9% for the extra $180 or so -- that doesn’t seem worth it if you have a Micro Center near you. The 5700X3D remains pretty close by as well, with a 111 FPS AVG that would be indistinguishable from the results of the 7600X3D. The 5700X3D also benefits from a fiercely competitive price.
The 245K slips down this chart, especially with Windows 24H2. It’s at 93 FPS AVG, giving the 7600X3D a 25% lead in average FPS. Lows are about the same.
FFXIV Dawntrail

Final Fantasy 14: Dawntrail is next. This one has the 7600X3D at 349 FPS AVG with lows at 164 and 79 FPS. That positions it roughly tied with the 7800X3D, both of which appear to be encountering similar limits. The 9800X3D managed to break free of this bind and post a 373 FPS result. That’s good, but it’s not as impressive as we saw in other tests.
But this isn’t meant to be another review of the 9800X3D. The 7600X3D boosts over the 7600X’s 259 FPS AVG by 35%, leading the 259 FPS entry by a significant margin. X3D in general completely divides this chart, forming a rift below the 5600X3D and everything else.
Intel’s closest competitor is the 14900K, although it’s more expensive, up at 310 FPS AVG. The 7600X3D leads even the former flagship i9 by 13%. Its lead over the 5700X3D is noteworthy, at 16%. This is because of the 5700X3D’s drop in clocks, which we know to impact its Final Fantasy performance. That’s also why the 5600X3D runs higher performance: Its clocks are typically at least 300 MHz higher.
Rainbow Six Siege

Rainbow Six Siege is up now. In this one, the 7600X3D ran at 613 FPS AVG -- sorry, 613.3… That 0.3 is important, because elite FPS gamers can see even the difference between 0.000798 ms.
The 613.3 FPS result has it up alongside the 9600X and below the 9700X (read our review). The 7800X3D ran at 622 FPS AVG -- again, sorry, 622.1 -- which means it holds a 1.4% lead. That’s basically error. These CPUs are functionally the same, with lows differentiated only by how wildly variable this particular game is.
As for the 5700X3D, the lead from the 7600X3D is a more noteworthy 17%. There’s also a big jump over the 245K, way down at 476 FPS AVG.
Generally though, the top CPUs are mostly the same. The 9800X3D is boosted, but not in a huge way like in some other games. We’re up against limits.
F1 24

In F1 24, the 7600X3D ran at about 409 FPS AVG and was flanked by the 5800X3D and 7800X3D. The 7800X3D holds a 7.2% lead in average FPS, with a big jump in the 1% and 0.1% lows. Both are ultimately acceptable. The 5800X3D’s 391 FPS average gave up a 4.4% lead to the 7600X3D. The gap against the 7600X is massive, at 409 FPS to 312 FPS, or a 31% uplift for the 7600X3D. That’s a big climb when considering the frequency and cache changes discussed earlier.
Intel’s 245K is far down the chart, more similar to the 7600X than the newer X3D variant. The 14900K is closer, but still behind at 385 FPS AVG.
Total War: Warhammer 3

In Total War: Warhammer 3, the 7600X3D ran at 484 FPS AVG. That has it in the top grouping again, but technically behind the 14700K. Realistically, in average FPS, they’re the same; however, the X3D CPUs all have large advantages in frametime consistency and pacing, as illustrated by the 1% and 0.1% lows.
The 9800X3D and 7800X3D are both encountering external limits.
The real takeaway though is that Intel continues to get bodied by X3D: the 265K and 285K both suffer from the same impact we saw to the 14900K (read our review) and 13900K, where frametime consistency plummets and large frametime spikes pop-up more frequently. This affects the averaging as well, since it drags everything down, which leads to the 285K and 265K seeming to perform worse than a lower thread-count 245K. This is a repeatable result. Even the DDR5-8600 285K entry has worse lows than the 245K, and that’s all because of scheduling. There are community mods to try and help with this, but we test games as the developer ships and maintains them.
AMD R5 7600X3D Production Benchmarks
Production workloads aren’t a big focus for R5 CPUs, so we’ll fly through these to hit the basics.
Blender
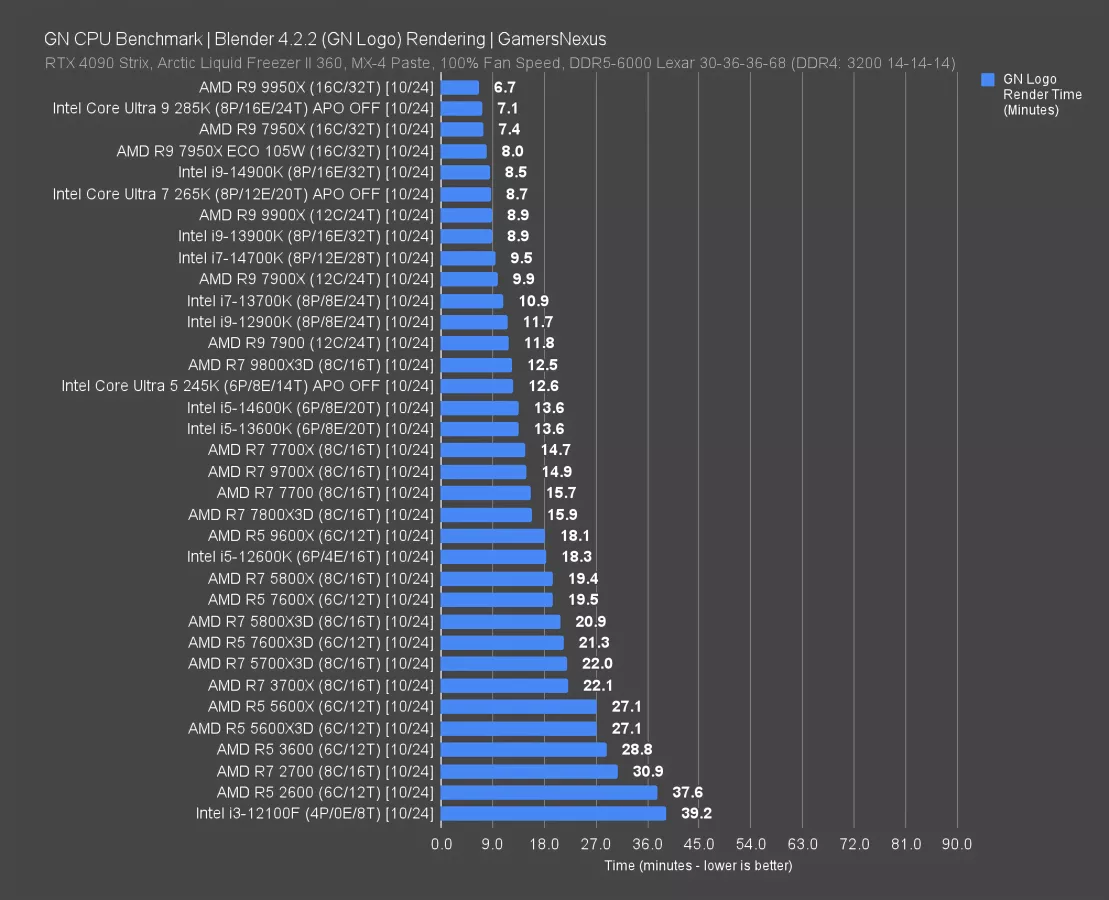
In Blender 3D rendering on the CPU, the 7600X3D required 21.3 minutes to complete a frame of the GN intro animation. This is one of the slower results, putting it in-line with the 5700X3D, 3700X (read our revisit), and 5800X. The 7600X is faster than the 7600X3D, which isn’t new behavior: While the 9800X3D actually outperformed the 9700X, generally speaking, X3D CPUs are worse in production-heavy, all-core tasks than the CPUs they stack the cache on top of. That’s because the frequency comes down on prior generations, mostly for thermal budget reasons, and this is also why Zen 5 X3D is so interesting.
So for the 7600X3D, we’re back to a situation where it’d typically make more sense to buy any other CPU above it on the chart for heavy workstation use cases that we test. If you’re building a machine that’s gaming-focused first and foremost, then the 7600X3D should still be in consideration. It’s capable of handling production-style work on the side, but there are better options for a build more purely focused on that kind of work.
The 7600X3D is beaten by the 12600K, 5800X, and many other CPUs. Blender scales cleanly with thread count, and that shows here. The 285K is also relatively competitive in this particular test, as are the 265K and 245K.
Chromium

In Chromium code compile, the 7600X3D required 208 minutes to complete the compile. That has it way down the chart and near the 5800X and 5800X3D. The 7600X3D is struggling with its thread deficit and just wasn’t built to excel at the production applications we test with. Even the 3700X isn’t distant.
The 7600X benefits from a time reduction to 198 minutes in this test, with the 9600X and 12600K ahead of that.
7-Zip Compression

In 7-Zip file compression, the 7600X3D ended up completing about 87K MIPS, putting it ahead of the 3700X and behind the 5700X3D. The 7600X is again better, at 91K MIPS, or improved by 5.2%.
As with other pre-Zen 5 X3D parts, if doing this kind of work heavily, it’d make more sense to buy something else. The part is acceptable for its price if gaming is the primary focus.
7-Zip Decompression

Decompression is similar: The 3700X outmatches the 7600X3D marginally, the 7600X3D is just ahead of the 12600K (watch our review) now, and the 7600X non-3D runs 8.8% faster.
The 9800X3D stood out here as improving on the 9700X, benefitted by its higher power budget that enables higher boosting. We covered this in the review. The 16-core parts, like the 9950X and 7950X, have a major advantage in this workload that the 7600X3D can’t unlock with its 6-core configuration.
Adobe Premiere

Adobe Premiere is tested with the Puget Suite, using a mix of RAW performance, intraframe, effects, and processing. The result is in aggregate points.
The 7600X3D scored 7832 points, which has the 7600X ahead of it by 4.2% at 8159. Next above that is the 12600K. The 245K posts a significant gain over the 7600X3D here as well. Against prior parts, the 7600X3D at least improves upon the 5700X3D and 5600X3D components in a more noticeable way. It’s just not impressive on its own.
Adobe Photoshop

In Adobe Photoshop and tested with Puget Suite again, the 7600X3D fell down the charts to 14600K levels of performance and functionally tied with the 245K. That’s an OK spot to be, but AMD dominates the top half of this chart with other components -- including the 7600X. The reason for this drop comes down to the loss in frequency, which is important to Photoshop right now.
AMD R5 7600X3D Conclusion

The efficiency on the 7600X3D is crazy. That’s great, but most people -- especially in this part of the market -- don’t buy on efficiency. From a pure performance standpoint, we get the expected Zen 4 behaviors: The 7600X3D is a little worse in production than its non-X3D counterpart in most of our non-gaming tests, but is far superior in gaming tests. Because an R5, like an “Ultra” 5, is targeted at gaming, that’s the most important aspect.
Performance achieves most of what the 7800X3D would have to offer, but at $300. For gaming, it’s a better option than Intel’s $300 options, especially over the new 245K at $320, but worse in non-gaming tasks. If you’re mostly playing games and have a budget limited to about $300 on the CPU, we think the 7600X3D makes good sense. The 9800X3D offers a meaningful uplift at $480, but is also a huge jump in price and that extra money would possibly be better spent on a better GPU to unlock more performance.
The 7600X3D’s biggest strength is its impressive efficiency. Its biggest weakness is its core count, where non-gaming tasks will be restrained. For users who tend to mix heavier “work” applications than gaming, we’d encourage considering other options to better suit those needs. Our 9800X3D review goes into some of that. But for gaming-first users near a Micro Center, the 7600X3D performs overall well.