CPU all-core power consumption benchmarks across generations
The Highlights
- This data has been collected from our CPU power consumption testing
- Data here is directly comparable and can be cross-compared between charts on this page
- CPUs have been split by release year and/or generation to make filtering easier. Ctrl+F for the CPU of choice
- This is a large, ongoing effort and will get updates at this URL permanently
- Please consider supporting this effort
Table of Contents
- AutoTOC

Intro
This is part of our long-term reference series of component charts. We will roll these out over time.
This page will be updated regularly with our latest power consumption figures for CPU testing. There will be a slight delay to incorporate the latest data following a CPU review, so the charts on this page may not be as up-to-date as our latest CPU review; however, it will contain more data than is presented in the reviews. If we were to make a software analogy, think of this page as the “LTS” (or long-term support) version of the charts: They won’t be updated as often, but will contain the most stable set of data.
Credits
Test Lead, Testing, Writing
Steve Burke
Testing
Patrick Lathan
Mike Gaglione
CPU Power Consumption Charts Gallery
There are important notes below this; however, we want this page to be as useful as possible, so we're putting the charts right at the top in a gallery format for quick reference. Please scroll down and read the methodological details for further information, and also note that the Legacy & Miscellaneous chart has an important bit of information about BIOS controls and test parameters accompanying its section at the bottom of the page. There is also an update log at the bottom. Here's the quick-reference gallery!


CPU Power Efficiency Chart
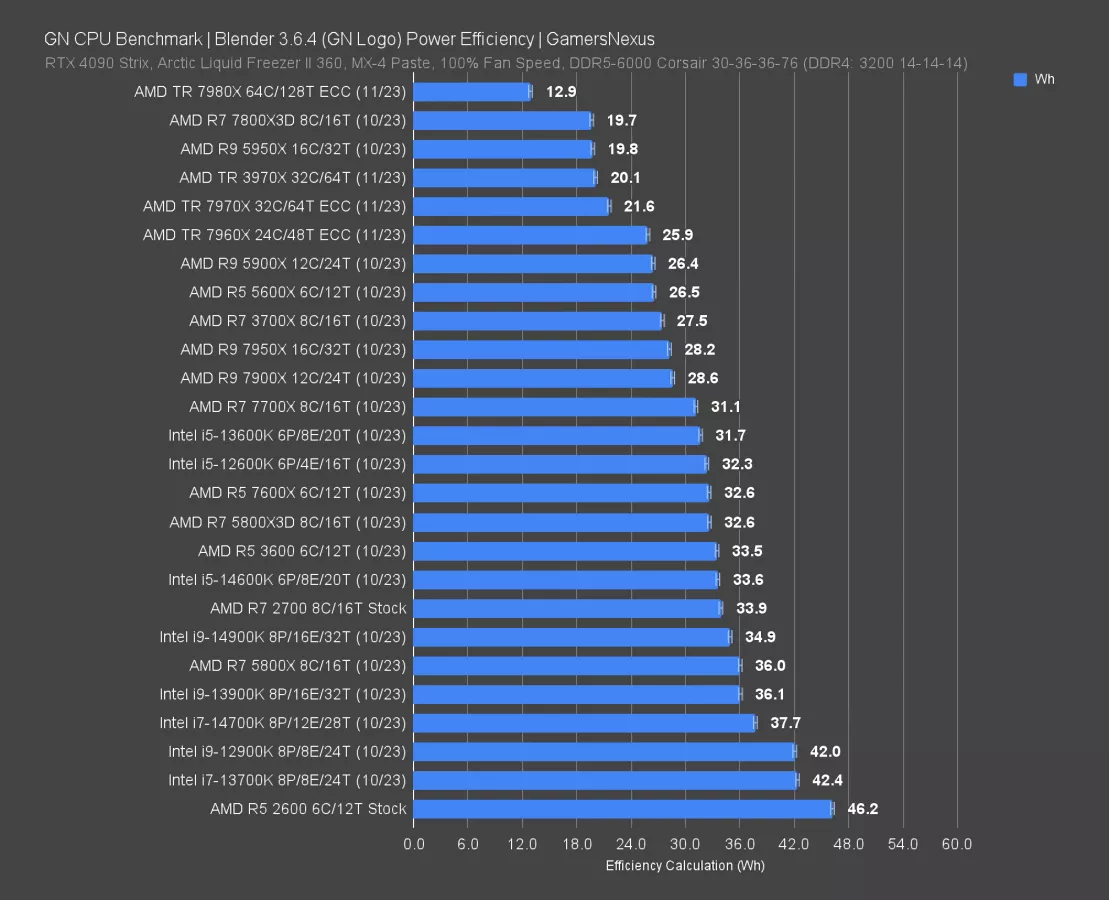
The above is the current (as in 'today,' not as in P=VI) power efficiency chart. Unlike our above (and below) power consumption snapshot tests, this chart cannot be compared across multiple test generations. That's because it relies on a unit of work (a Blender render) to complete for the calculation, and that unit of work gets updated for our review cycle every 1-2 years. Everything on the chart is directly comparable, but it cannot be compared to older versions of itself. This gives us a measure for a known and fixed unit of work (the render) versus the power required to complete that unit of work. As an example: Something that's faster and draws more power could be less efficient than something that's slower, but ultra low power.
Using This Page
This page contains a mix of test methodology information, limitations of testing data, and the data itself. We also present links and resources for the original reviews (or related content) and to the Amazon or Newegg pages, which contain affiliate links to help support this page.
Of course, we'd recommend reading the limitations and methodology section first. Once done there, we'd recommend Ctrl+F to find the CPU you care about. that will jump you to a table naming the CPUs in each chart.
We intend to update this page quarterly. The results are dependent on methodology. As long as the method doesn’t change for each chart, it can be appended going forward.
We suspect these long-term reference pages will get higher traffic volume than typical. The intent of these pages is to serve as a quick reference, permanent URL for performance data. Because we currently are ad-free on this website, we ask that if you find this page regularly useful, you please support our maintenance of this information. You can support us a few ways:
- Patreon: This is a monthly subscription of any amount to help fund our continued efforts
- Direct donation: This is a one-time, direct donation of any amount and will ensure we incur the lowest fees
- GN store purchase: This is the best way to support. You can get a PC building accessory or tool, a mouse mat, a t-shirt, glassware, or any other item you find useful while also supporting us
Testing Methodology
Unless stated otherwise, all power tests on this page were conducted using the same testing methods. The test benches have changed (naturally) for each CPU tested; however, because we isolate to only the EPS12V cables and test at a full and fixed load, the only meaningful impact to power consumption would come through motherboard changes.
Methodologically, we control all motherboard power settings (unless otherwise stated for the DUT) to match the official guidance from AMD or Intel. That means boards which run MCE out-of-box will be tuned down to operate at the proper guidance and closer to the commonly understood “spec” (although that specific word is arguable) by the community.
We are advancing and changing our testing processes for power all the time, but for purposes of maintaining a directly comparable dataset, we maintain these tests long-term.
Software Workload
The test uses a full, all-core Blender rendering workload using the Cycles renderer to load the CPU to 100%. We use an “impossible to render” GN logo frame with high sample count and resolution.
Timing & Turbo
This set of tests includes a 5-minute wait period (under load) before taking a steady state power figure. This does a few things:
First, it ensures we’ve had some time for leakage to set in and for power to stabilize. Power will bounce more at the beginning of a workload, especially on CPUs that may have features like Precision Boost or may boost to a particular thermal ‘value’ for Tdie.
Secondly, and most importantly, it ensures we are measuring after any Turbo time limits on processors that have them. We do this to make sure we are consistent in measurement. Different tests are performed for the Turbo power consumption (this occurs within the first 45-50 seconds of boost on older Intel CPUs). For all-core, steady state testing, we measure only after the CPU has stabilized. The Turbo/Tau tests are not on this page yet, but again, that primarily affects Intel CPUs dating back a couple generations.
Measurement
Although we have begun the process of changing our power measurements to use an interposer, this dataset uses a current clamp to measure the current at the EPS12V rails. We then multiply that current by the known voltage going into the EPS12V rails to land on the total power consumption in Watts. This does not include total system power, and as a result, allows us to compare even relatively ‘ancient’ data since we are eliminating the impact from GPU components. The motherboard will affect the data (via VRM efficiency losses), but we’re still getting pretty close to the ‘true’ power consumption of the CPU without moving to software measurement, which introduces new issues. The interposer method further improves this, but for purposes of this long-term reference table, we will be presenting and maintaining the clamp method data.
Environment
Testing is conducted in a 21C environment with controls to keep it +/- 1 degree Celsius. Temperature has an impact on power and leakage. All tests since ~2020 are conducted with a 360mm Arctic Liquid Freezer II AIO, with all tests prior to that conducted on a 280mm Liquid Freezer II AIO. Prior to the existence of this Arctic solution, we used the Kraken X62 CPU coolers. In all scenarios, we ensure that the CPU does not thermal throttle. If a CPU is pushing too much power for its cooling, in years past, we’d move to a 360mm CLC from a 280mm solution. Now, all tests are done on a 360 (and that seems to prevent any throttling).
For CPUs wherein a 95C target is part of the design, we let them boost within the limits of their cooling.
Limitations
This testing has limitations, and it’s important that you understand them. We want our audience to be aware of the value offered by the data we present and the limitations of the data.
First, this page currently only presents all-core, 100% load data. That means we are not presenting, for example, the extreme power consumption that might be seen in a Prime95 workload (although Blender is still a heavy, realistic workload).
Additionally, we are not currently presenting gaming power consumption in these charts (although that is something we’ve recently added, it isn’t public yet). Gaming typically uses less power in total than production workloads due to the more variable nature of gaming impact on a CPU. This becomes more complicated if the bottleneck shifts: If a CPU is fully GPU-bound due to its ultra-high performance, it might appear to draw less power than alternatives that are fully CPU-bound. Again, that’s something we’ll soon be talking about in video format. It’ll make its way to articles later. There are realistic ability and time constraints with a small team, and as such, we focus on presenting the data we find to be the most reliable and which we can maintain with the highest quality. The current approach enables those goals.
Although we collect it, we are also not currently presenting idle power consumption. This is because the idle measurements are often more complicated than stock due to Windows behaviors. We might add these in the future.
CPU Power Consumption - Blender All-Core
The below charts are our latest vetted, full power consumption charts. Data dates back several years. Because it is measured at the EPS12V cables and not total system draw, we are able to provide like-for-like comparisons between these CPUs (sans VRM efficiency losses). Keep in mind that if retested with the newest BIOS, it is possible some of these numbers change.
To keep things legible, we will be breaking these into charts based on generations and architectures that we think people will most commonly compare. The data between all charts should be almost completely cross-comparable, so you can pull two up side-by-side if both parts you're interested in aren't in a single chart.
The axis has been kept at 400W for all charts to make it easier to spot-check comparisons between charts. The one exception is for the Legacy & Misc. chart, which goes to a higher wattage.
Gaming PC Power Supply Wattage - "How Many Watts?"
These CPU power consumption comparison charts will help you understand the full load power requirements of AMD vs. Intel CPUs for each generation. These don't necessarily show power efficiency (that's a different test and requires a unit of work for comparison), but will at least give you a better idea for what kind of power supply you need for your gaming PC build or workstation build. As general guidance, our recommendation for how many watts your PSU needs is to spec for at least maximum power consumption (+ some overhead) to ensure you have enough capacity during peak loads. If you're wondering how big of a power supply to get, start first by looking at benchmarks for CPU and GPU power consumption, then go from there. Although it's unlikely you'd hit 100% load on both components simultaneously, that would allow prep for the worst case scenarios.
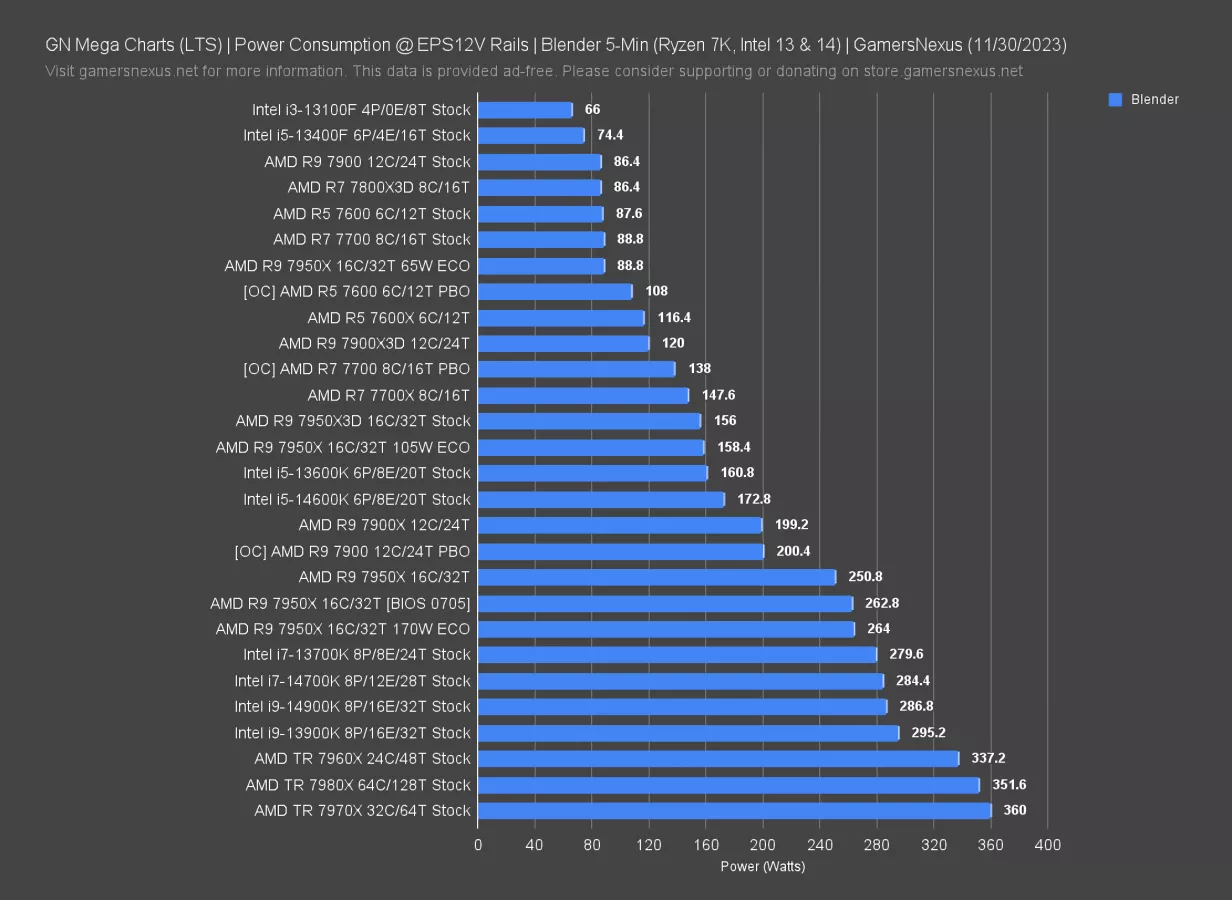
AMD Ryzen 7000, Intel 13th Gen, Intel 14th Gen Power Draw

For search reasons and Ctrl+F users, the above chart contains the following CPUs:
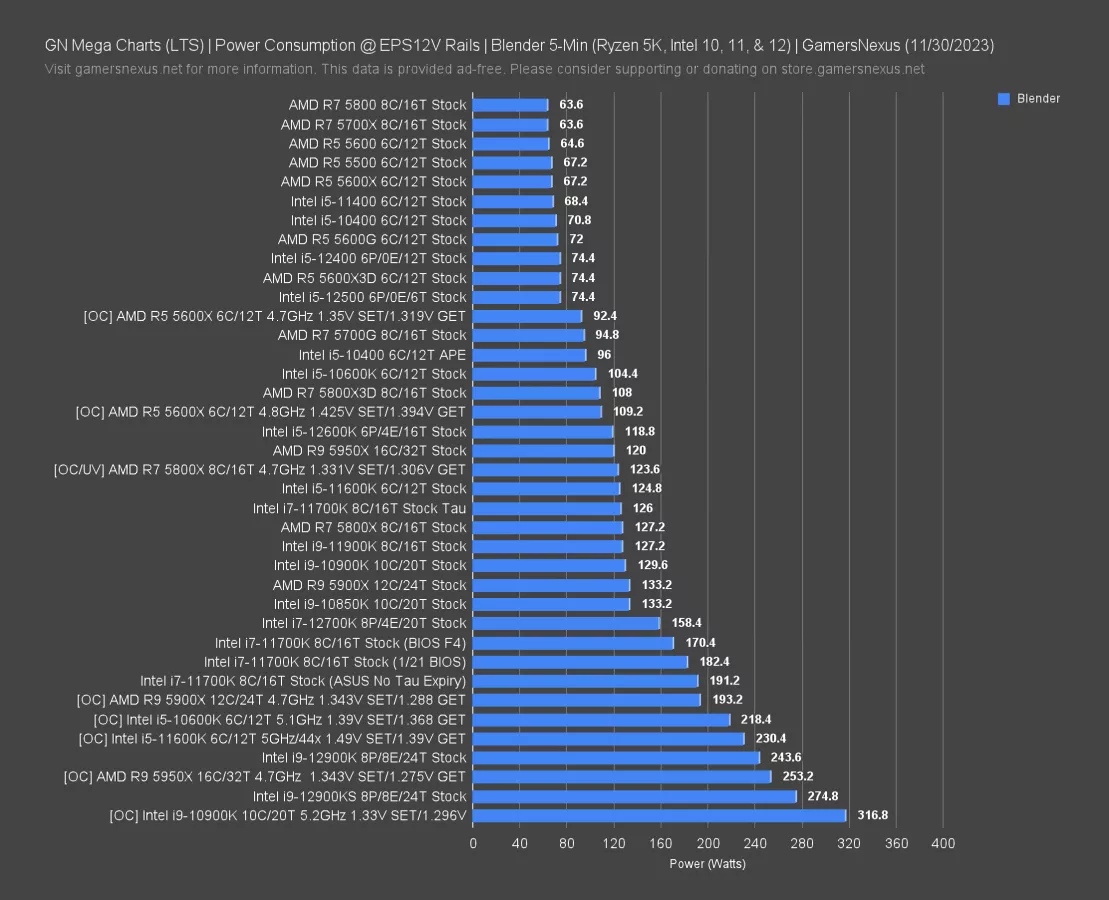
AMD Ryzen 5000, Intel 10th, 11th, & 12th Gen Power Consumption

This chart contains the following CPUs:
AMD Ryzen 3000, Intel 8th & 9th Gen Power Consumption
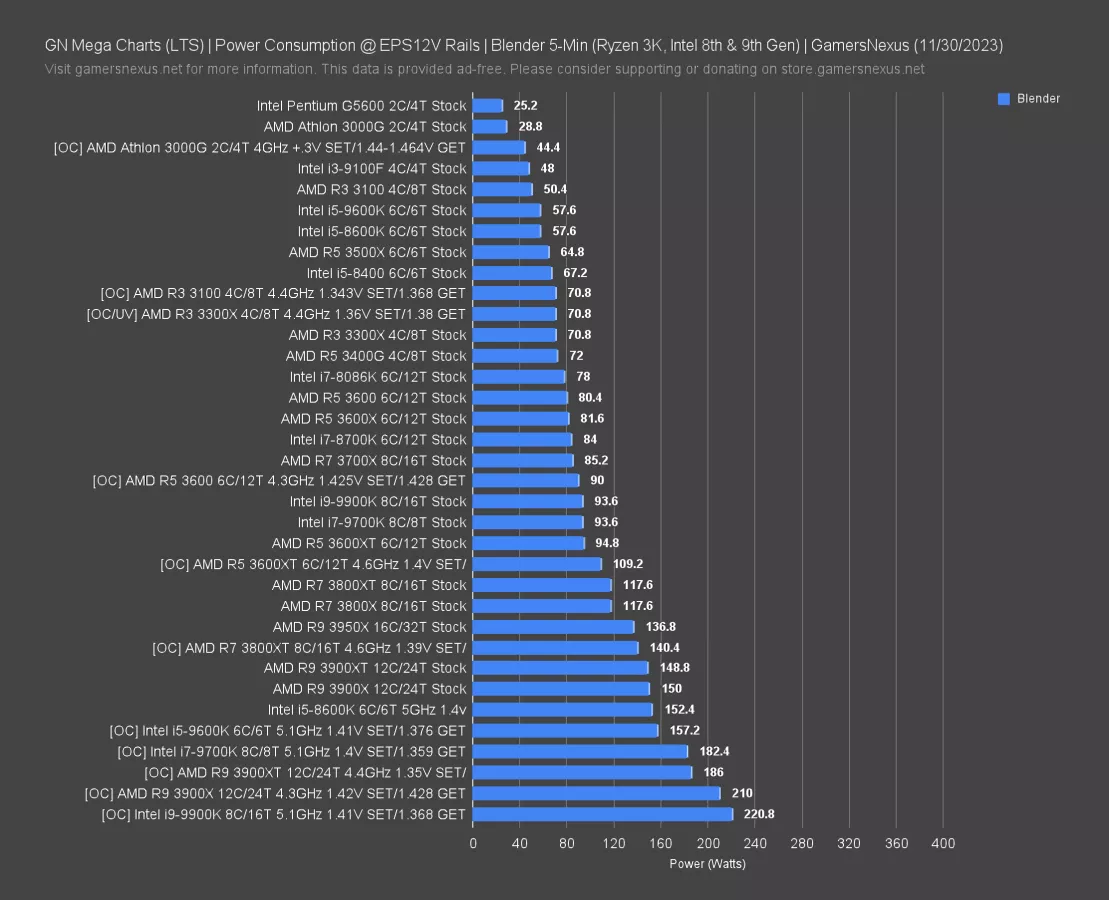

The CPUs in the above chart include:
| CPU | Architecture | Release Date | GN Original Review* |
| AMD Athlon 3000G | Zen Raven Ridge | 2019 | AMD Athlon 3000G Review |
| AMD Ryzen 3 3100 | Zen 2 Matisse | 2020 | AMD R3 3100 CPU Review |
| AMD Ryzen 3 3300X | Zen 2 Matisse | 2020 | AMD R3 3300X CPU Review |
| AMD Ryzen 5 3400G | Zen+ Picasso | 2019 | |
| AMD Ryzen 5 3500X | Zen 2 Matisse | 2019 | AMD R5 3500X CPU Review |
| AMD Ryzen 5 3600 | Zen 2 Matisse | 2019 | AMD R5 3600 CPU Review |
| AMD Ryzen 5 3600X | Zen 2 Matisse | 2019 | AMD R5 3600X CPU Review |
| AMD Ryzen 5 3600XT | Zen 2 Matisse | 2019 | AMD R5 3600XT CPU Review |
| AMD Ryzen 7 3700X | Zen 2 Matisse | 2019 | AMD R7 3700X CPU Review |
| AMD Ryzen 7 3800X | Zen 2 Matisse | 2019 | AMD Ryzen 7 3800X CPU Review |
| AMD Ryzen 9 3900X | Zen 2 Matisse | 2019 | AMD R9 3900X Review |
| AMD Ryzen 9 3900XT | Zen 2 Matisse | 2019 | AMD R9 3900XT Review |
| AMD Ryzen 9 3950X | Zen 2 Matisse | 2019 | AMD R9 3950X Review |
| AMD Ryzen 7 3800XT | Zen 2 Matisse | 2019 | AMD R7 3800XT Review |
| Intel Pentium G5600 | Coffee Lake | 2018 | Intel Pentium G5600 Review |
| Intel i3-9100F | Coffee Lake Refresh | 2019 | Intel i3-9100F CPU Benchmarks |
| Intel i5-9600K | Coffee Lake Refresh | 2018 | Intel i5-9600K CPU Tests |
| Intel i7-8086K | Coffee Lake | 2018 | Intel i7-8086K Binning Test |
| Intel i7-8700K | Coffee Lake | 2017 | Intel i7-8700K CPU Review |
| Intel i5-8600K | Coffee Lake | 2017 | Intel i5-8600K Review |
| Intel i5-8400 | Coffee Lake | 2017 | Intel i5-8400 Review |
| Intel i7-9700K | Coffee Lake Refresh | 2018 | Intel i7-9700K CPU Review |
| Intel i9-9900K | Coffee Lake Refresh | 2018 | Intel i9-9900K CPU Review |
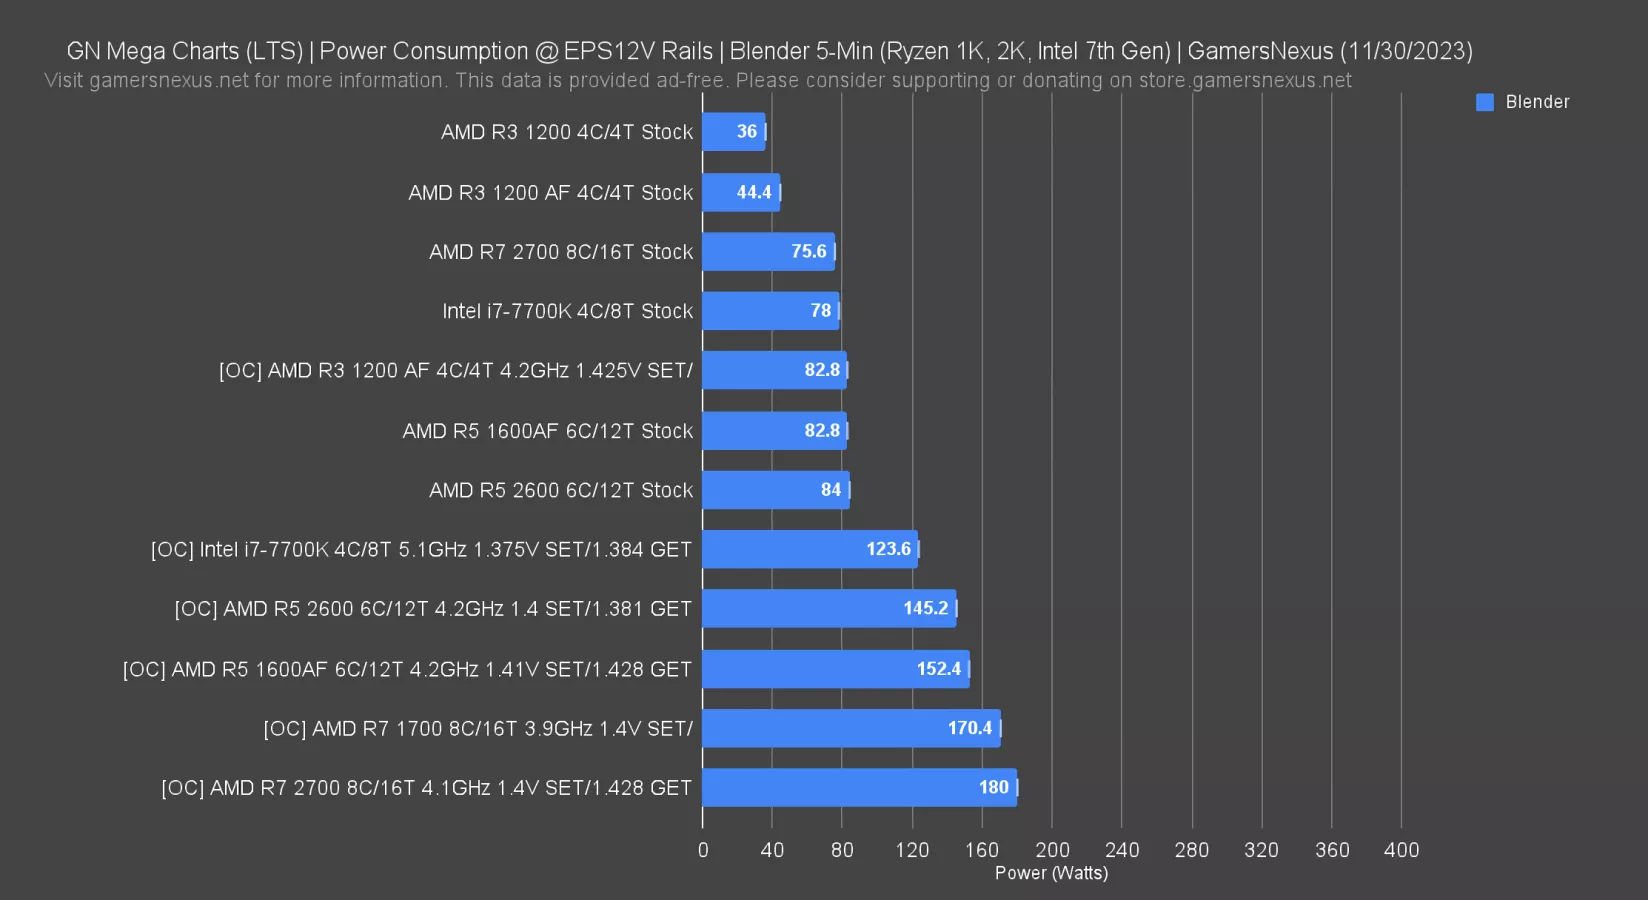
AMD Ryzen 1000, 2000, & Intel 7th Gen Power Consumption
We don't have as many power consumption numbers dating back to Ryzen 2000, 1000, or the Intel 7th Generation CPUs. We have some random/legacy results (below) that were from various revisits at points in time, but the Ryzen 1000 era and Intel 7th generation would have been when we just started collecting power numbers.

CPUs in the list above include the below, plus various overclocking tests:
| CPU | Architecture | Release Date | GN Original Review* |
| AMD Ryzen 3 1200 | Zen Summit Ridge | 2017 | AMD R3 1200 Review |
| AMD Ryzen 3 1200 AF | Zen+ Pinnacle Ridge | 2017 | AMD R3 1200 AF Review |
| AMD Ryzen 7 2700 | Zen+ Pinnacle Ridge | 2018 | AMD R7 2700 Review |
| Intel i7-7700K | Kaby Lake | 2017 | Intel i7-7700K Review |
| AMD Ryzen 5 1600 AF (2600) | Zen+ Pinnacle Ridge | 2019 | AMD R5 1600 AF CPU Review |
| AMD Ryzen 5 2600 | Zen+ Pinnacle Ridge | 2018 | AMD R5 2600 Review |
Miscellaneous, Older HEDT, & Legacy CPU Power Consumption
The next chart is for miscellaneous and legacy results. These are 'orphaned' tests: We ran them at one point or another, but they don't necessarily belong anywhere else. These results are much more variable based on platform than our newer data. That's because our inventoried platform options were more limited on some of these, like FX.
IMPORTANT: With the oldest CPUs in this table, there is a higher likelihood than typical of a result which does not necessarily match the expectations of the time. The result would be 'accurate' in the sense that the current clamp would have been accurately used, but the BIOS settings may not match whatever the "guidance" was from manufacturers at the time, as we were not receiving guidance in the pre-2015 era for AMD or Intel. In other words, we would have exercised less control over BIOS as we did not have official guidance on the expectations (since we were not part of the reviewer circuit).
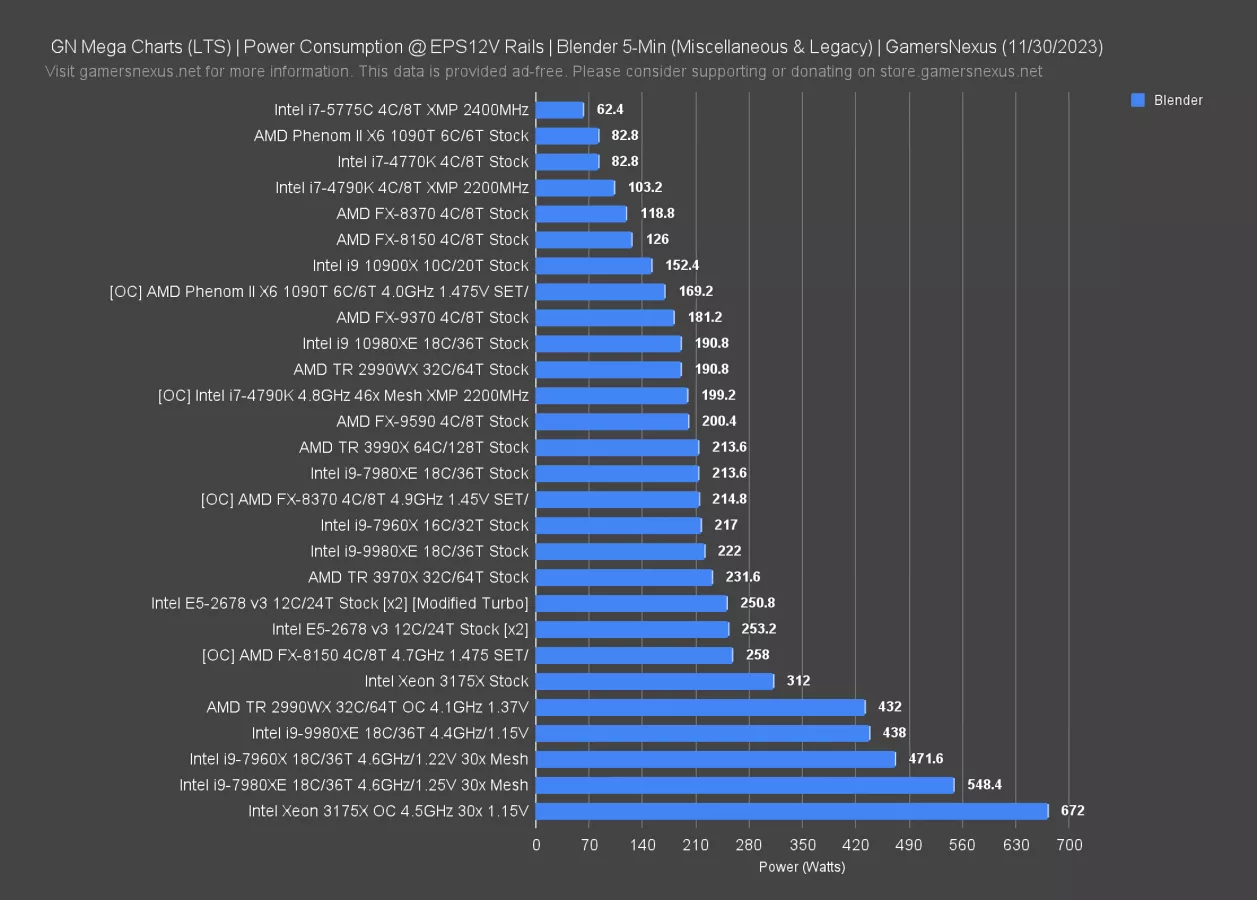
The above chart contains these CPUs:
| CPU | Architecture | Release Date | GN Original Review* |
| AMD Phenom II X6 1090T | Thuban | 2010 | 2020 Phenom II X6 1090T Revisit |
| AMD FX-8150 | Bulldozer Zambezi | 2011 | |
| Intel i7-4770K | Haswell | 2013 | |
| AMD FX-9370 | Piledriver Vishera | 2013 | |
| AMD FX-9590 | Piledriver Vishera | 2013 | |
| Intel i7-4790K | Devil's Canyon | 2014 | 2020 4790K Revisit |
| AMD FX-8370 | Piledriver Vishera | 2014 | |
| Intel i7-5775C | Broadwell | 2015 | |
| Intel E5-2678 v3 (x2) | Haswell-EP | 2015 | Dual-X99 Motherboard Build |
| Intel i9-7980XE | Skylake-X | 2017 | Intel i9-7960X & 7980XE Review |
| Intel i9-7960X | Skylake-X | 2017 | Intel i9-7960X & 7980XE Review |
| AMD Threadripper 2990WX | Zen+ Colfax | 2018 | |
| Intel i9-9980XE | Skylake-X | 2018 | Intel i9-9980XE Review |
| Intel i9-10900X | Cascade Lake-X | 2019 | Intel i9-10900X Review |
| Intel i9-10980XE | Cascade Lake-X | 2019 | Intel i9-10980XE Review |
| AMD Threadripper 3970X | Zen 2 Castle Peak | 2019 | AMD Threadripper 3970X Review |
| Intel Xeon W3175X | Skylake-W | 2019 | Intel Xeon W-3175X CPU Review |
| AMD Threadripper 3990X | Zen 2 Castle Peak | 2020 | AMD TR 3990X Review |
Update Log
The below contains an update log of changes to this page. The format is MM/DD/YYYY:
- 12/03/2023: Added table of contents feature to ease navigation
- 11/30/2023: Created page with initial dataset following Threadripper 7000 reviews