
We put the Ryzen 7 5700X3D through gaming, power, & workstation tests and analyzed its value
The Highlights
- The 5700X3D is very similar to the 5800X3D except it has a lower 4.1GHz boost clock and 3.0GHz base clock
- While the Ryzen 7 5700X3D offers a great value, it’s still limited to AM4
- The 5800X3D performs roughly 6-10% better than the 5700X3D but costs around 20% more
- Original MSRP: $250
- Release Date: January 31, 2024
Table of Contents
- AutoTOC
Intro
The year is 2024 and there’s a new AM4 CPU, continuing launches into what is probably AMD’s most successful consumer platform ever. AMD’s new $250 Ryzen 7 5700X3D follows-up the prior 5800X3D’s huge success and the limited rollout of the 5600X3D (Read our review), but the 5700X3D is a more familiar 8C/16T part. In essence, it’s a 5800X3D but a little slower in clocks.
The current CPU pricing goes like this: The R7 5700X3D is $250. The 5800X3D is $308 to $315. The 14600K is about $300 now as well, with the 14600KF at $290. A new AM5 platform would cost more, but the 7800X3D alone would run $390 or so.
We’ll benchmark the 5700X3D and focus on the comparison against the 5800X3D (watch our review). We’ve been good with recommending the 5800X3D mostly since it launched, as it’s been one of the most competitive gaming chips. For brand new builds, it has lost some viability to new platforms, but particularly for existing owners of AM4 motherboards, these X3D CPUs offer the best option for a last-chance upgrade before moving to a new socket altogether.
Editor's note: This was originally published on February 3, 2024 as a video. This content has been adapted to written format for this article and is unchanged from the original publication.
Credits
Test Lead, Host, Writing
Steve Burke
Testing
Patrick Lathan
Mike Gaglione
Video Editing
Vitalii Makhnovets
Tim Phetdara
Web Editing
Jimmy Thang
AMD R7 5700X3D Specs & Overview
The specs will help us understand where to look for performance differences.
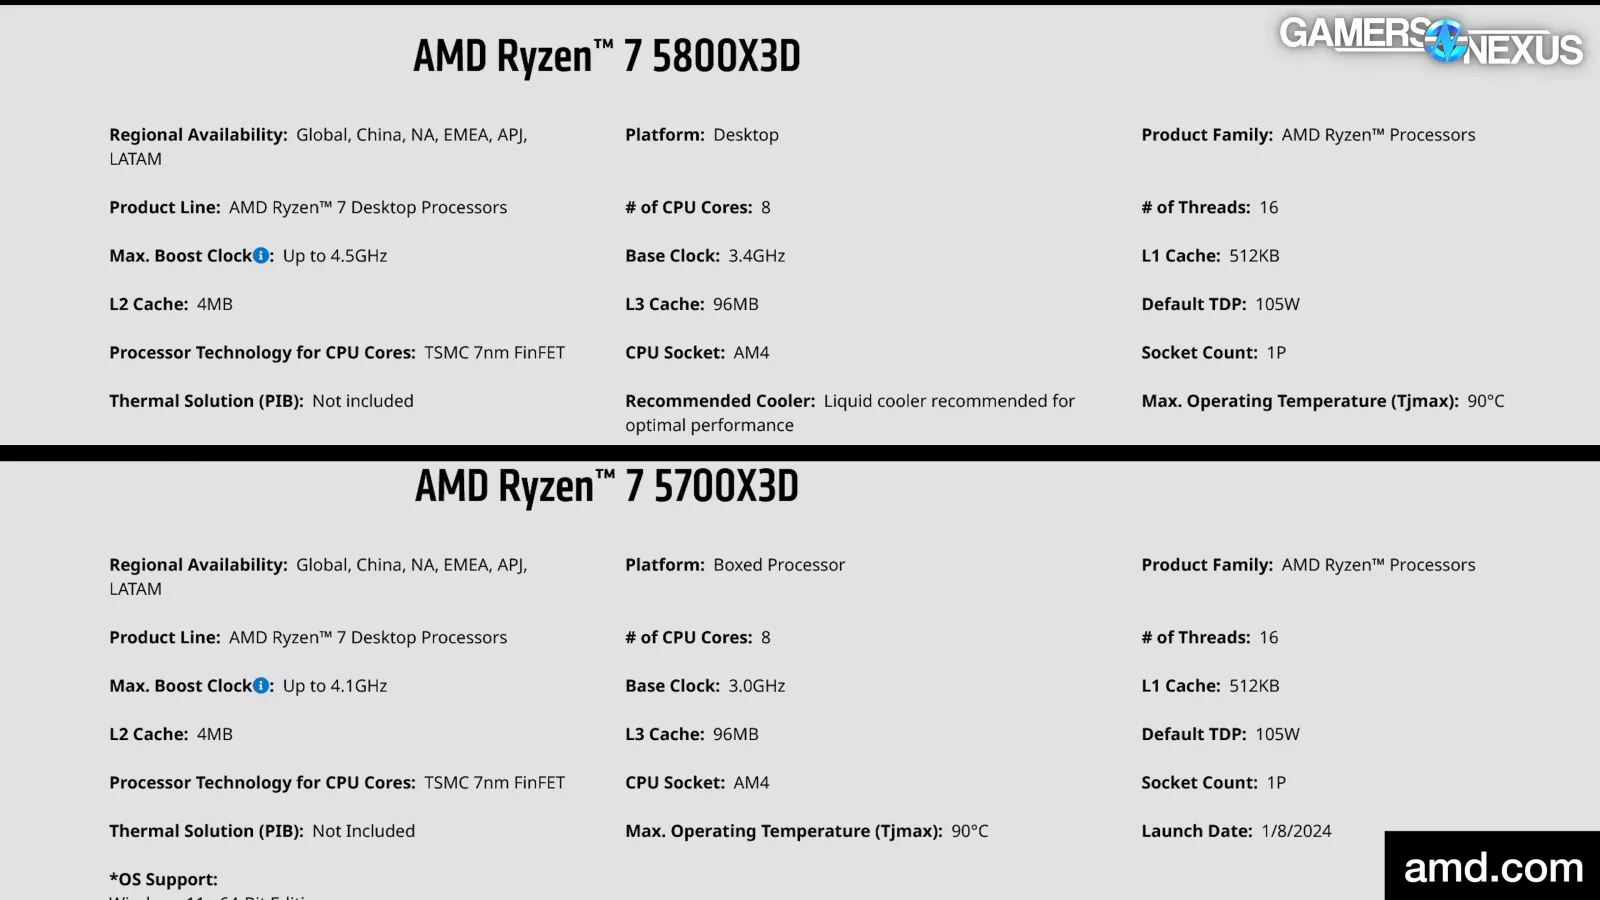
They’re both 8C/16T parts. They both have 96MB of L3 cache. TDP is 105W on both. The clock is where it’s different: The 5700X3D has a maximum 4.1GHz advertised boost clock and 3.0gHz base clock, with the 5800X3D at 4.5GHz and 3.4GHz base. This is a huge swing in frequency and is where most of the differences will manifest; however, it’s possible the equalized cache will still give the 5700X3D an advantage in some gaming scenarios.
Production results will be predictably worse on the 5700X3D as a result of the frequency reduction, but we’re mostly focusing on these parts from a gaming perspective today.
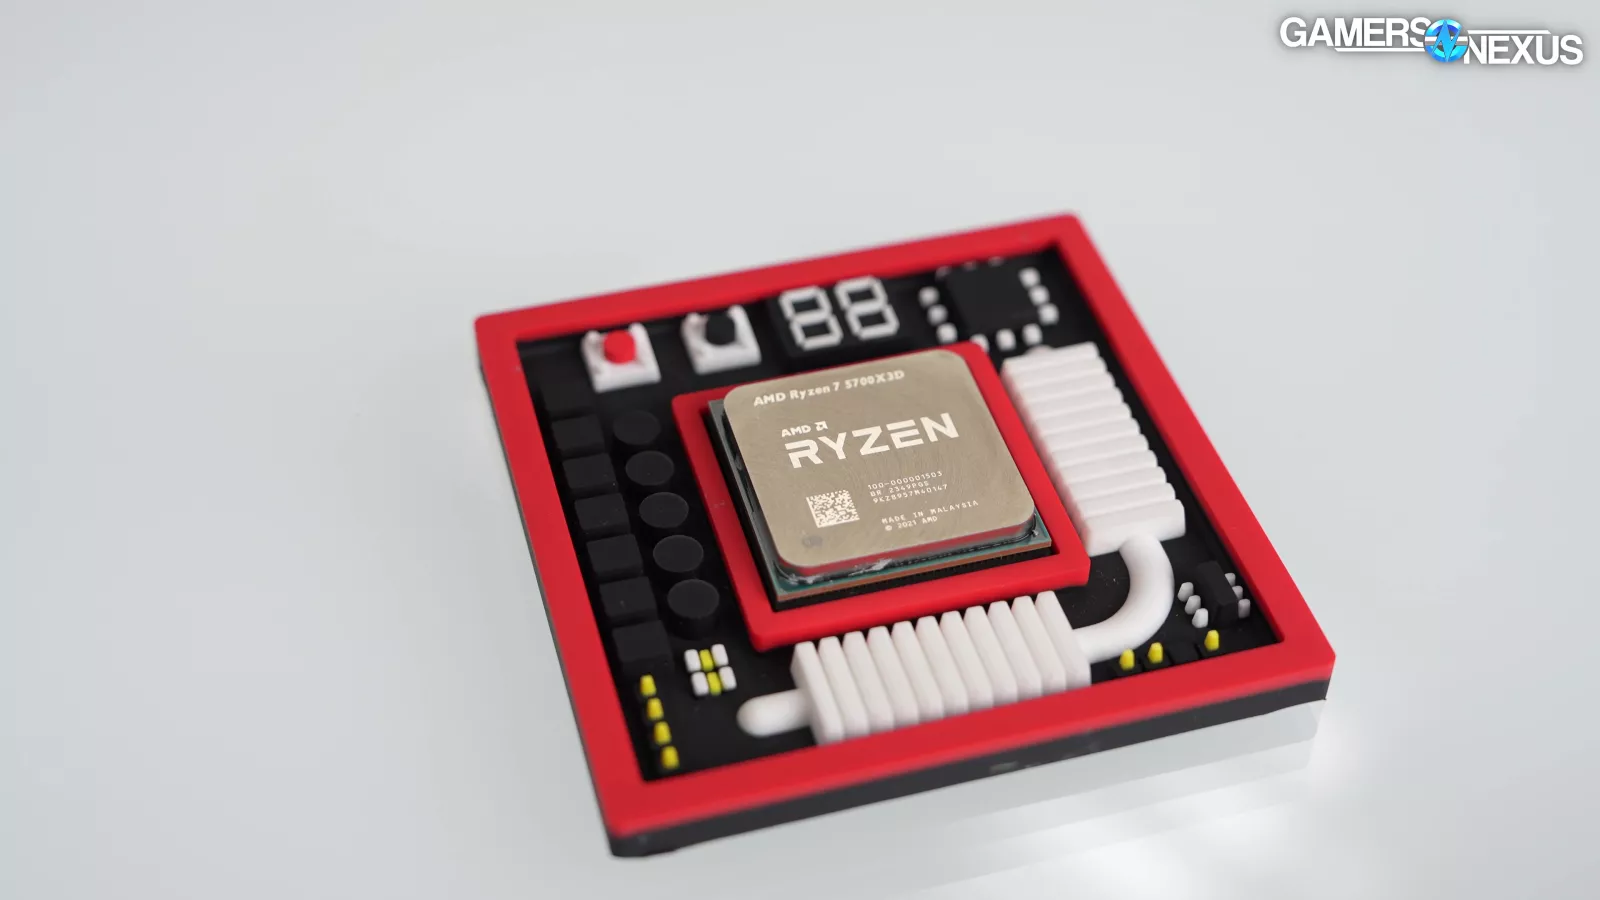
As for why these exist, we think the most likely reason just comes back to binning. It’s the same as the story we broke with the 5600X3D, just a different part. AMD can sell 5800X3Ds all day long, so they probably don’t strictly “need” a 5700X3D. It will bring some renewed enthusiasm, but it’s also possible that some percentage of these CPUs exist because the chips couldn’t hit and sustain those elevated clocks, but can hit the lower 5700X3D clocks.
Regardless, it exists, and we’re testing it.
We’ll start with summary charts to get you a rapid recap of all the data as quickly as possible, with the primary comparison against the 5800X3D since many of you are likely familiar with its positioning. New buyers are likely choosing between these two as well.
Summary Chart vs. 5800X3D
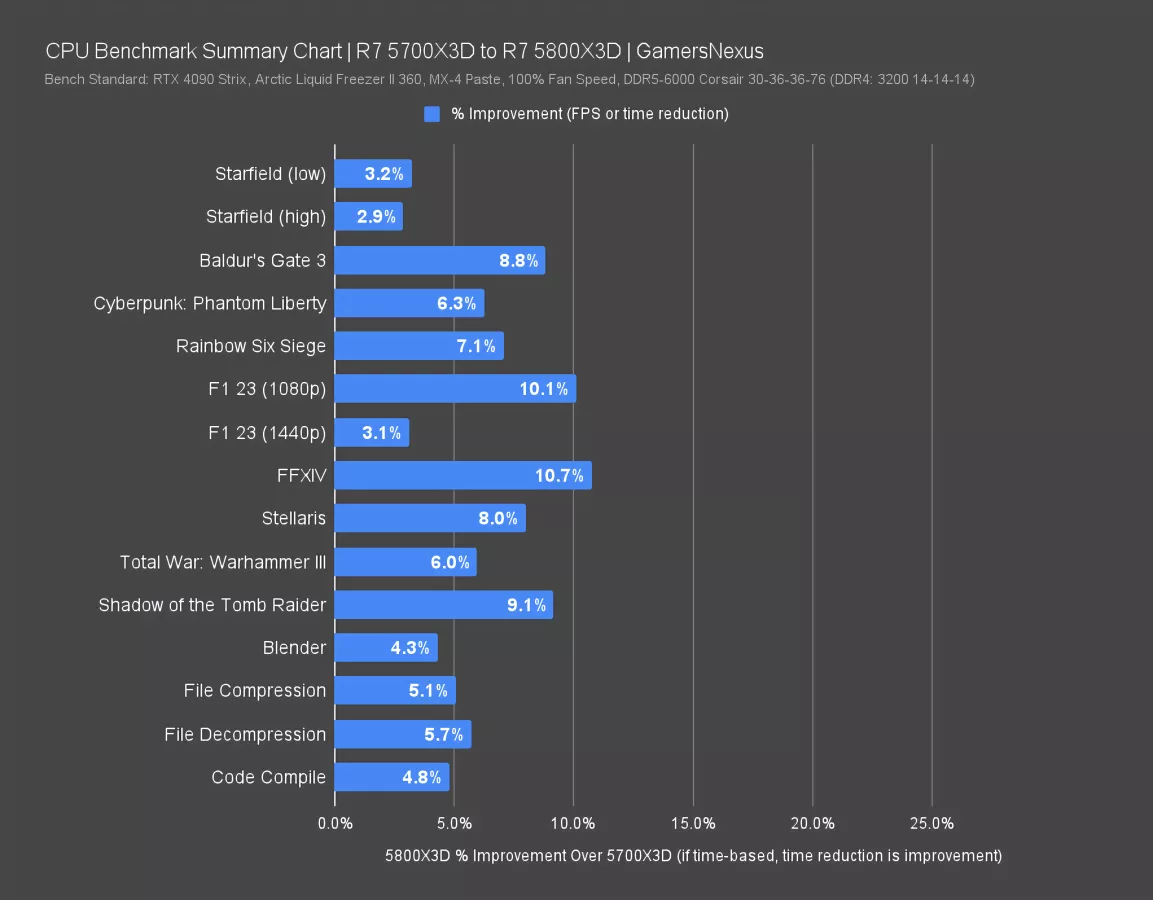
Here’s a simplified summary chart of the 5700X3D vs. the 5800X3D. This shows percent change in the direction of improvement. For time-based benchmarks, we are showing the time reduction as a percent improvement here. That’s because less time is an improvement.
Overall, in gaming especially, the change generally hovers around the 6-10% range. Call it about 6-8% on average. Some of the lower figures, like F1 at 1440p, are capped by other components. Starfield remains CPU-bound though and shows less scaling than other titles, likely due to less reliance on pure frequency. Larger gains appear in games where the frequency is more relevant, with Final Fantasy being a great example of that.
AMD R7 5700X3D Value Comparison
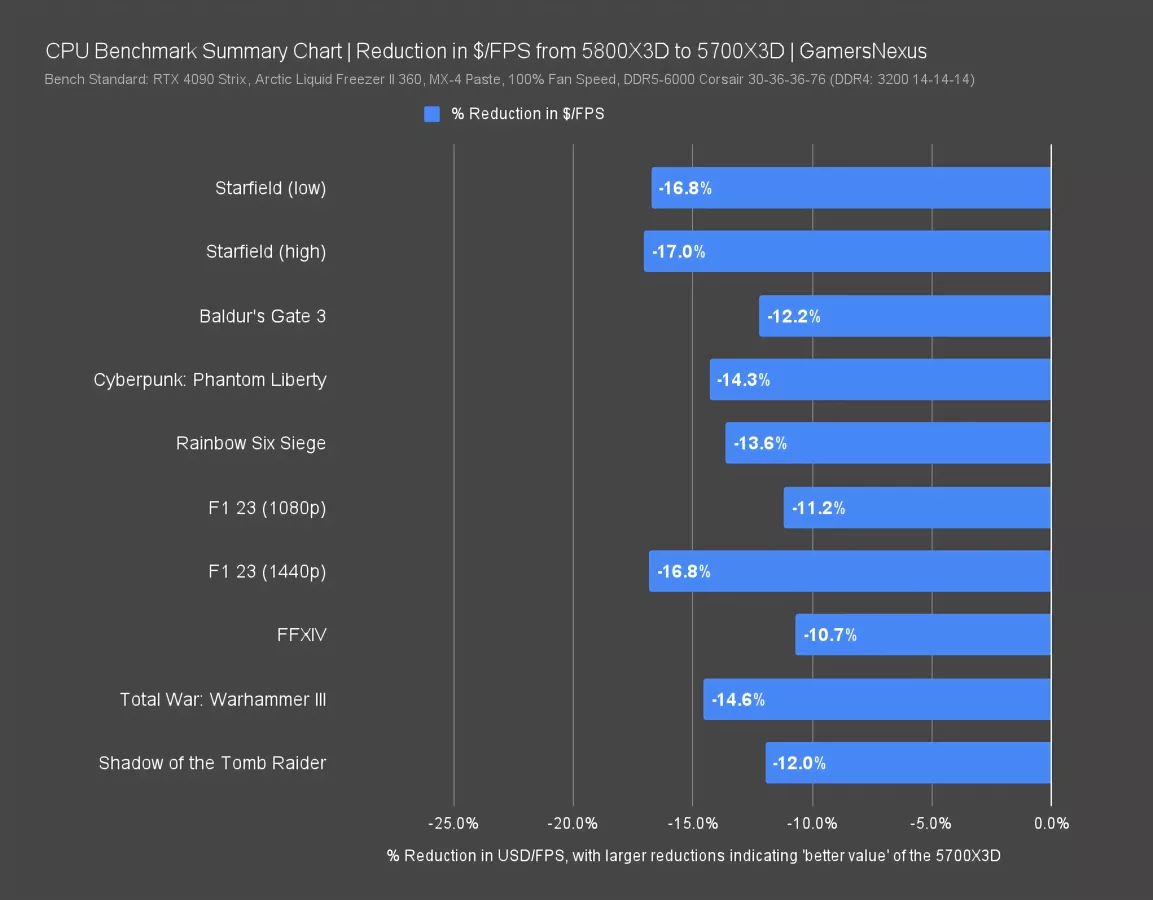
This chart is the relative value comparison. Our recent RTX 4080 Super review contained a huge discussion about this style of chart. The short version is that we have a lot of reservations about these and that there are limitations of their usefulness, plus they abstract away from the nuance, but for a head-to-head, they start to make sense.
The number towards the left is indicating a reduction in the amount of money you’re spending for the FPS you’re getting with the 5700X3D as compared to the 5800X3D. Larger reductions are better for value.
Boiling it all down, the relatively huge cost reduction of the 5700X3D, despite slightly lower performance, allows for a significant benefit in value. We’re seeing a range of 10-17% reduction in USD per FPS against the 5800X3D.
We’re still experimenting with these charts and will be changing the style constantly as we seek discovery of something we like and feel represents the full picture. We make no claims as to it being a perfect representation and in fact, don’t think it is -- but it gives you a quick snapshot. Our full performance charts will give the full picture, so let’s get into those.
Frequency Validation
All-Core Workload
We’ll quickly look at frequency validation of the two parts. Our recent 8000-series APU reviews proved why these are a necessary part of the reviews process to ensure companies’ components are running properly.
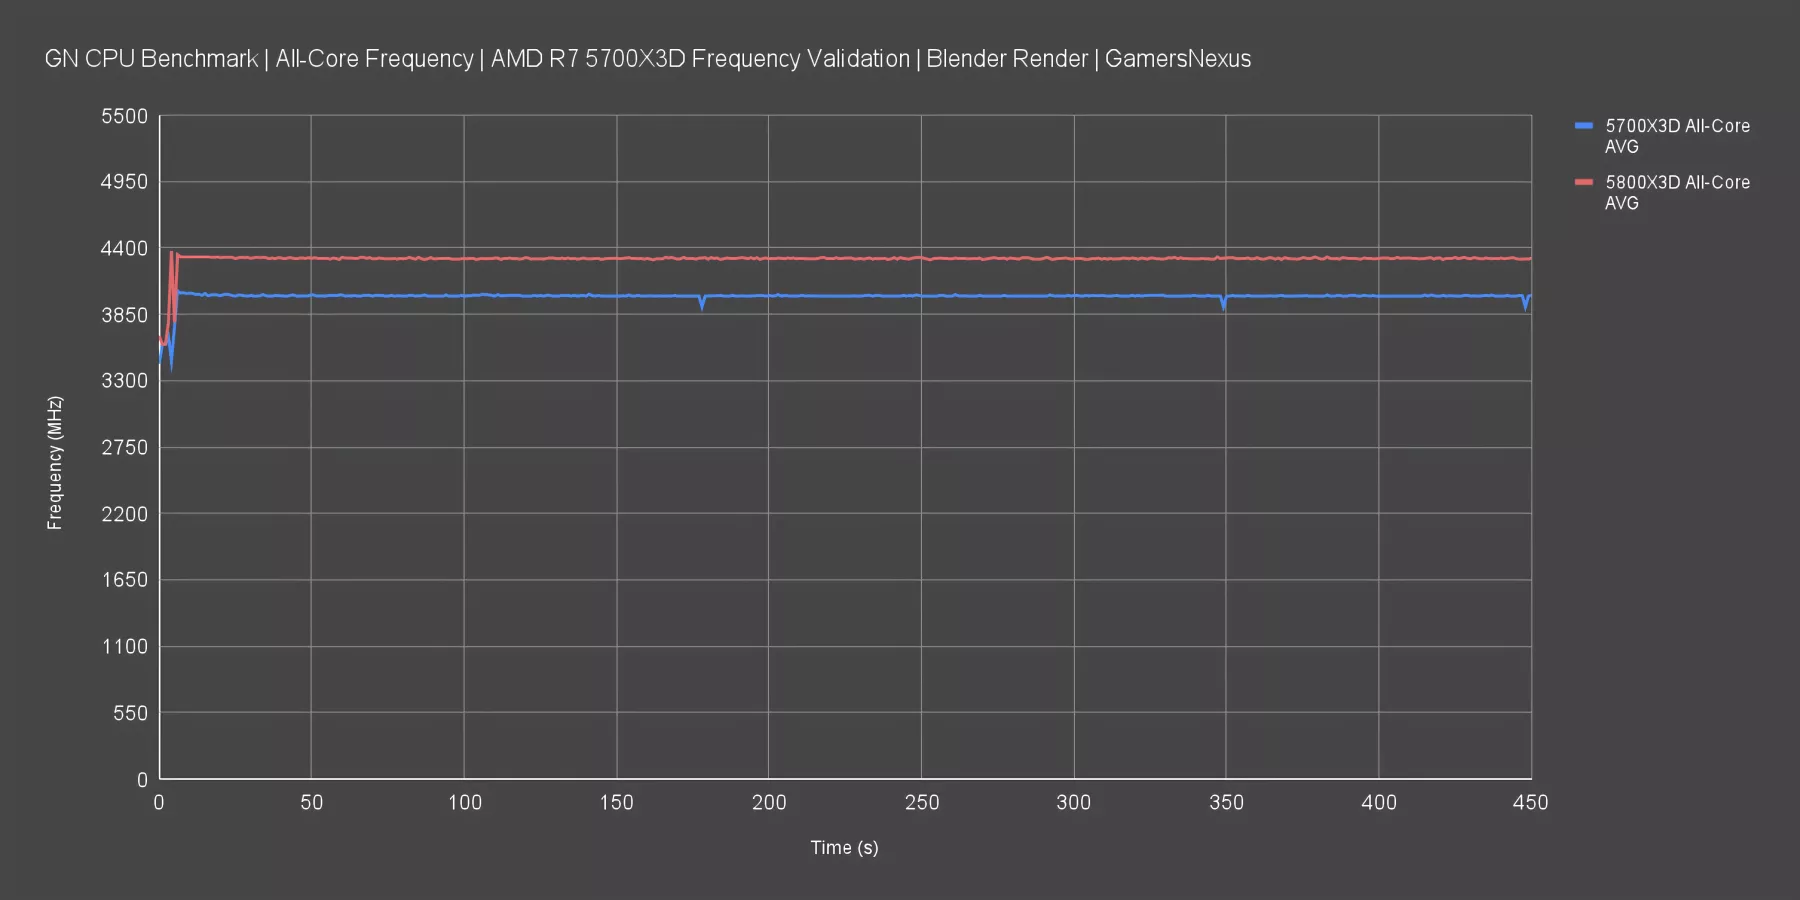
Here’s an all-core frequency chart of the 5700X3D and 5800X3D, using Blender on all threads. The 5700X3D boosts to 4GHz and holds steady for the duration of the test. It is expected behavior that these CPUs won’t hit peak boost clock in all-core workloads.
The 5800X3D ran 300MHz faster here, at 4300MHz for the test duration. That’ll be the main reason for performance differences.
Single-Threaded Workload
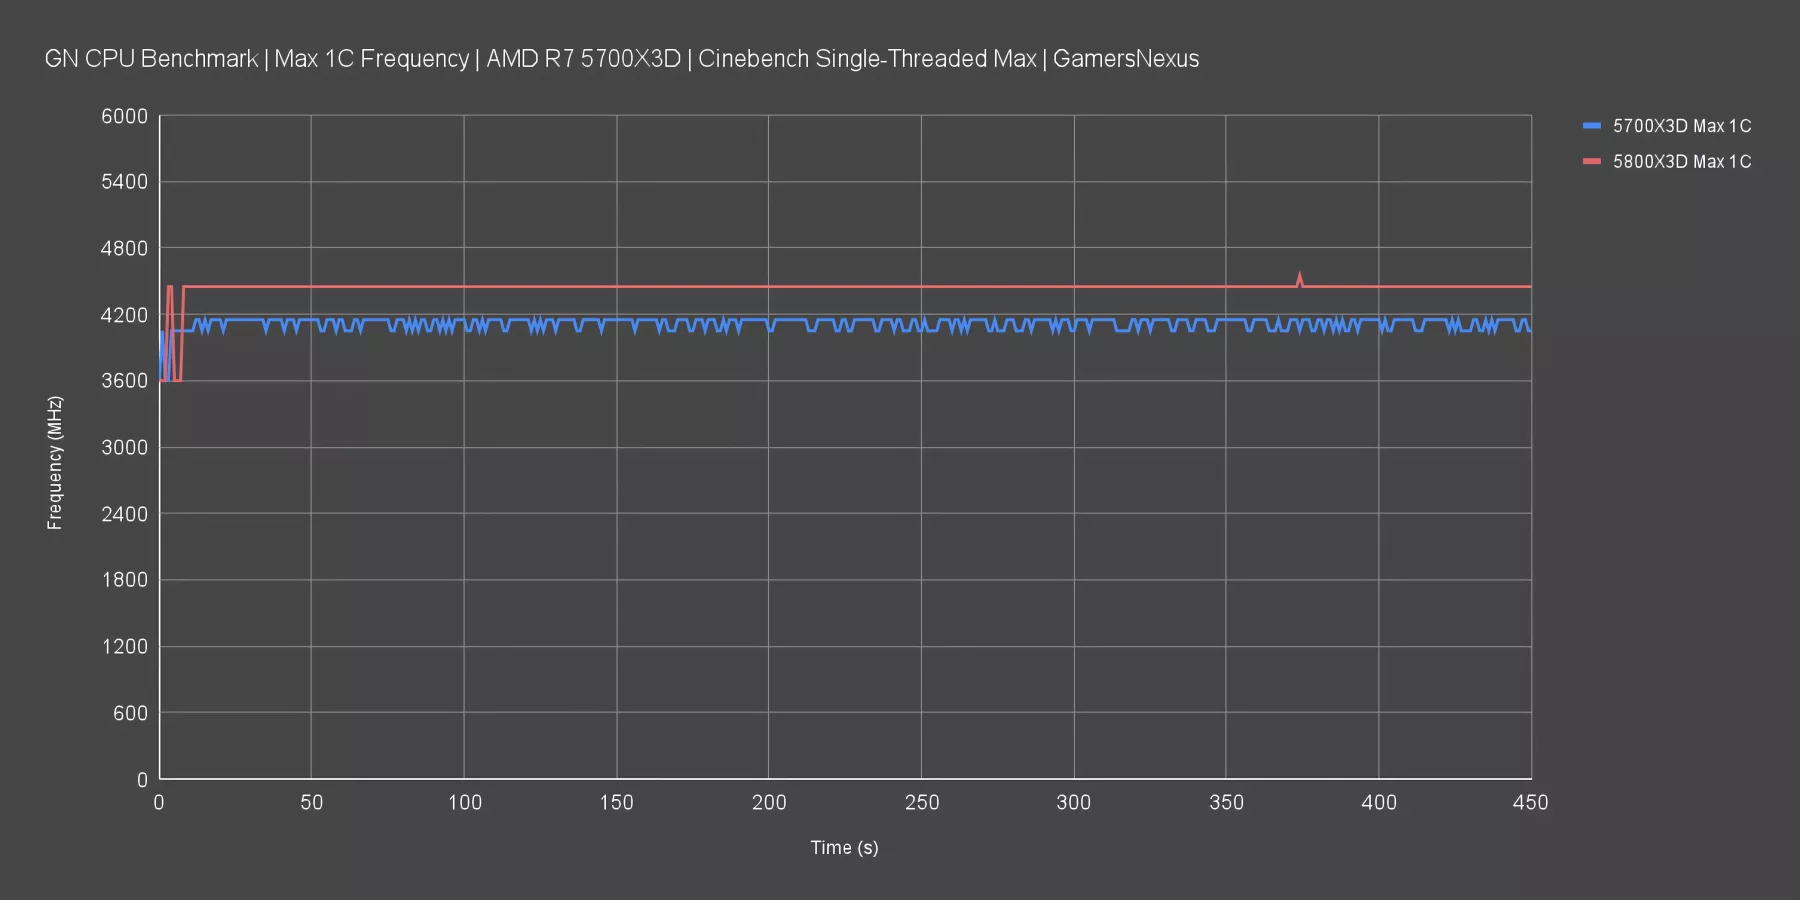
In a single-threaded workload, the maximum frequency we measured here of any given core for the 5700X3D was commonly 4150MHz. That’s about 50MHz over advertised, so that’s great to see. The 5800X3D was about 4450MHz.

AMD R7 5700X3D Game Benchmarks
Stellaris
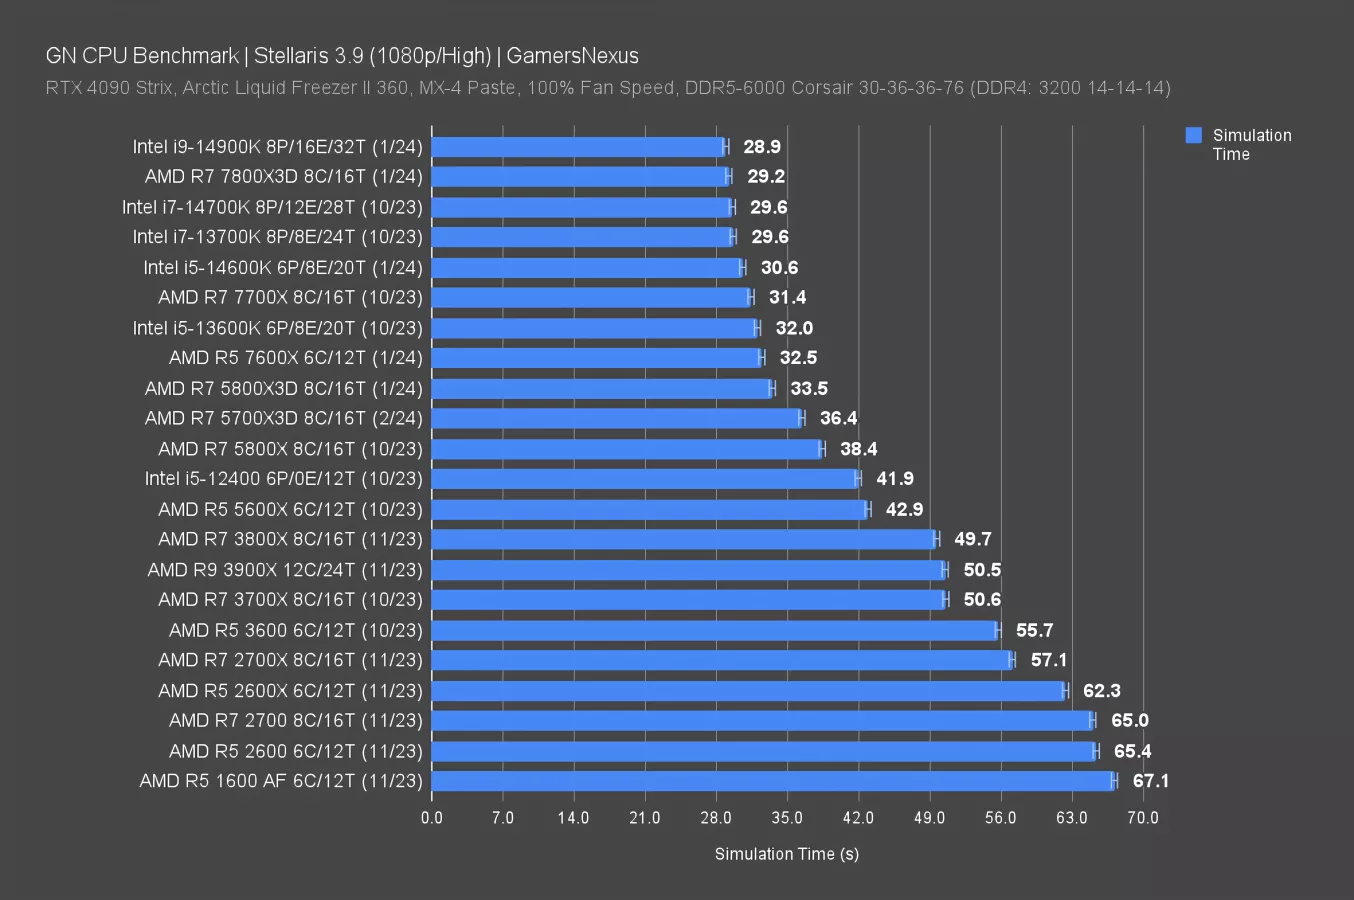
Stellaris is up now. This test looks at simulation time rather than framerate, so the difference is in real-world time and definitely feels noticeable when waiting for simulation processing. This is one of the tests that you might notice more than frame rate in a lot of situations.
The R7 5700X3D completed simulation in 36.4 seconds on average against the 5800X3D’s 33.5 seconds. The result is an 8% time reduction favoring the 5800X3D here, which aligns with the frequency advantage. This game tends to favor higher frequencies more than some other games. Considering the 20-21% price reduction against Newegg’s current $315 pricing, that’s not a bad trade-off. This is actually good value in relation to the 5800X3D, which itself has historically been good value.
If you went to AM5 instead, the 7800X3D gives perspective on the ceiling: At 29 seconds, its time reduction against the 5800X3D is 13% in this test and 20% against the 5700X3D. The 14600K completes the simulation in 16% less time than the 5700X3D. Intel’s 14600K (watch our review) can definitely compete in some of these titles but the pricing is different.
We also have some older parts present for reference.
Starfield Benchmarks
Starfield - 1080p/Low
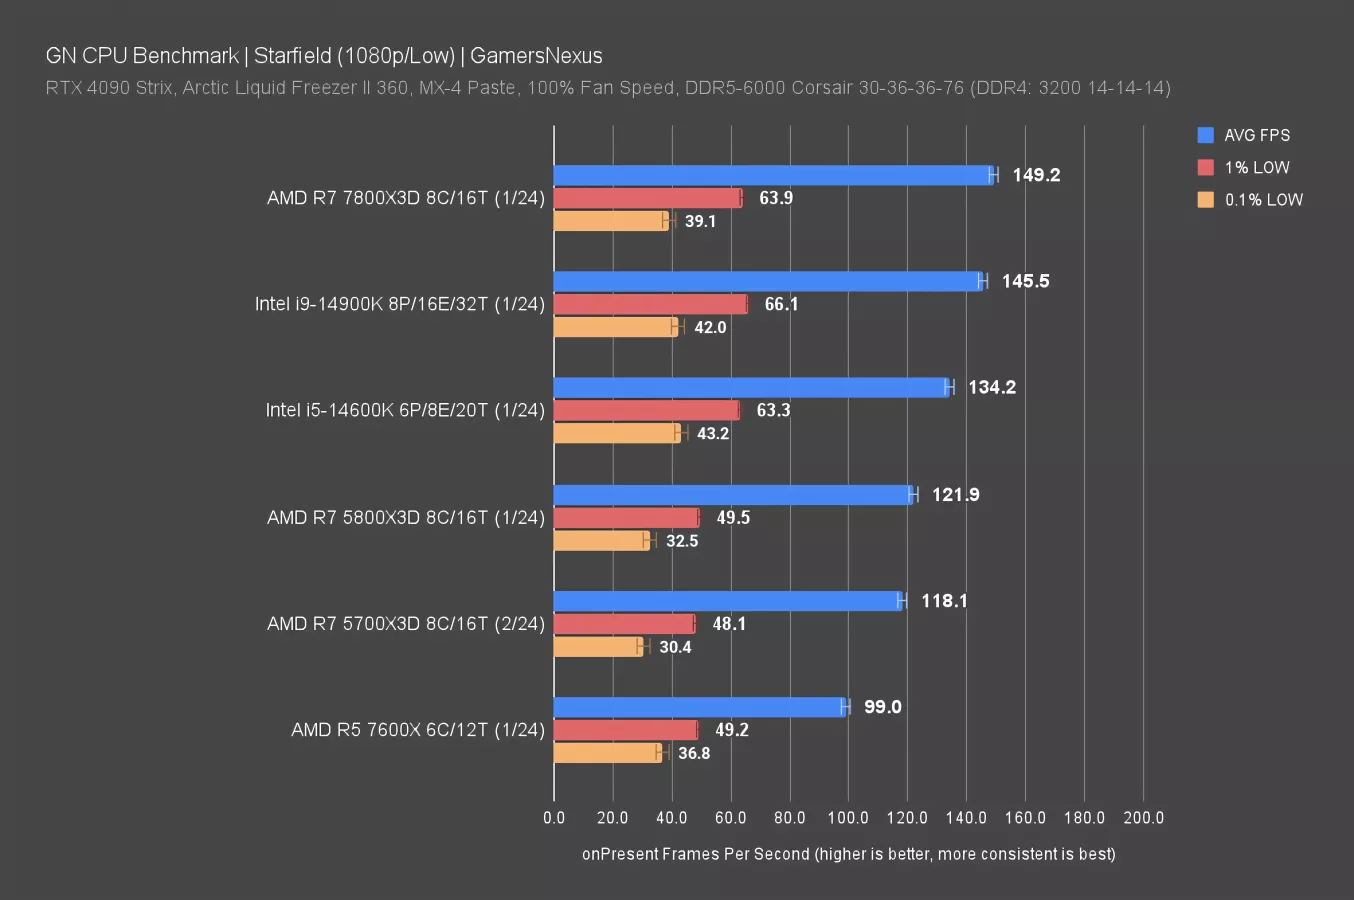
Our Starfield results are pretty barren because the game just got a massive update. Generally speaking, we saw about a 30% change in performance between the prior game version and current for our test area and approach. All data on this chart is new as a result and results are sparse, but still useful.
The 5800X3D roughly equated the 5700X3D. As evident from the 14900K and 7800X3D, there is definitely CPU scaling headroom, so we are not limited by external components on the prior generation X3D CPUs. The similarity in performance relates back to a reduction in frequency dependency in this game with its updates, and given the equivalence of core specs for the CPUs, the difference is only a 3% lead for the 5800X3D.
As for the 14600K, that CPU leads the 5700X3D by about 14%, or the 5800X3D by 11%.
Starfield - 1080p/High
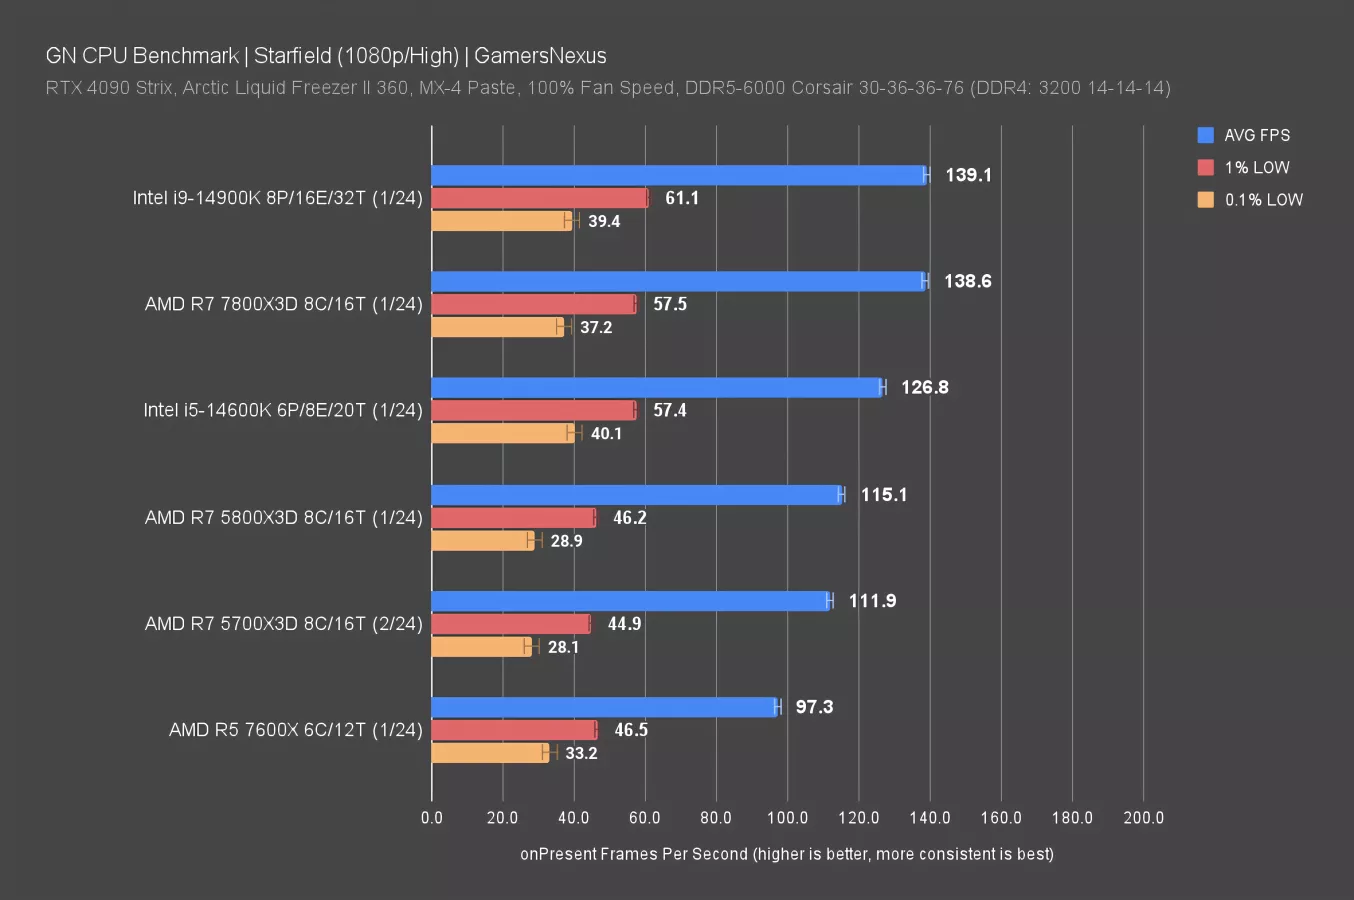
At 1080p/High, the 14900K and 7800X3D (watch our review) become constrained by GPU requirements, despite the RTX 4090. The 5800X3D is about 3% better than the 5700X3D and neither hits the GPU ceiling. The 14600K maintains its 13% lead over the new R7 5700X3D CPU.
FFXIV
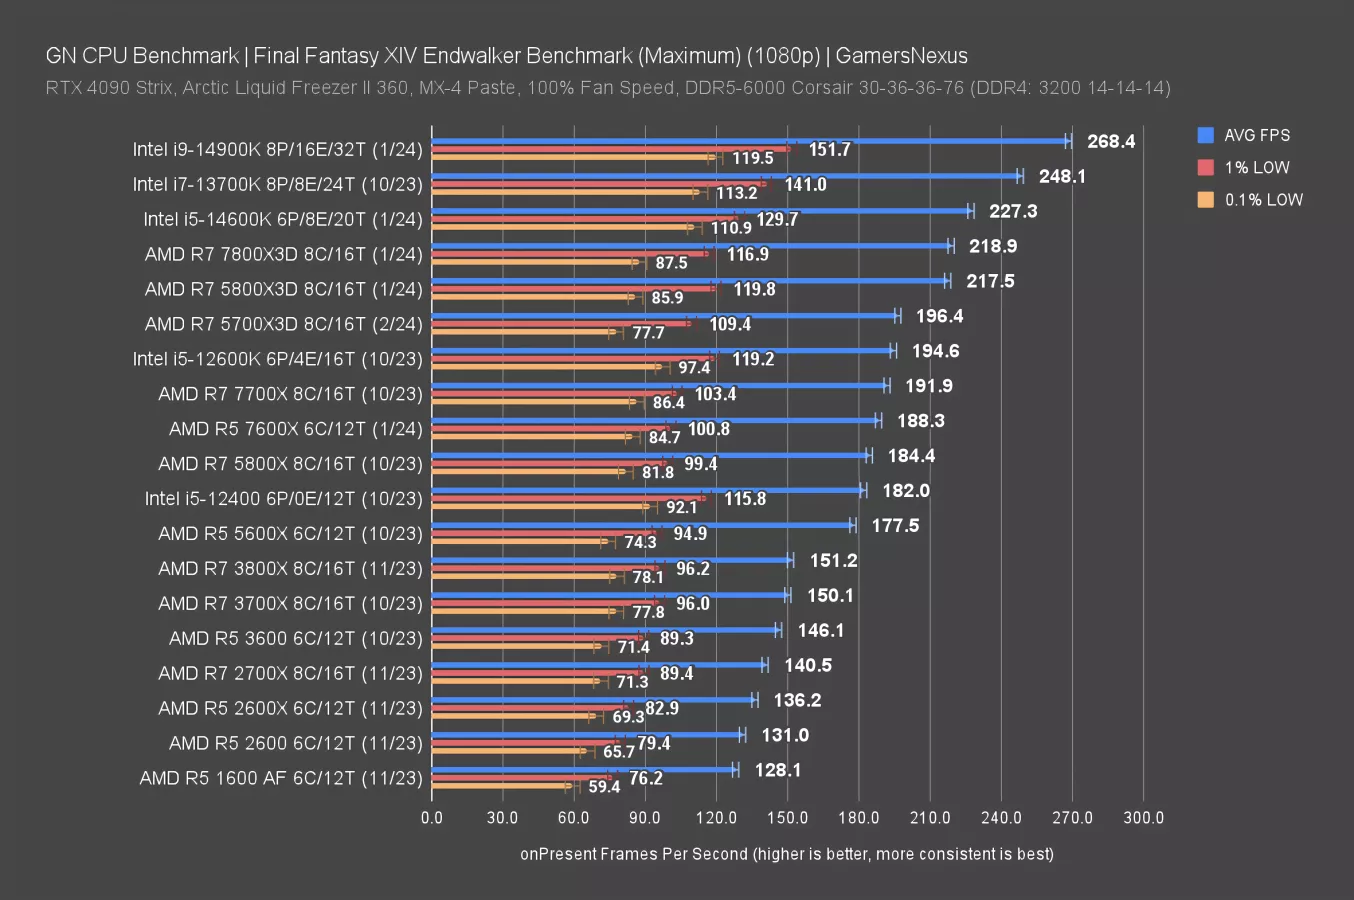
Final Fantasy 14 is up now. In Final Fantasy at 1080p, the 5800X3D ran at 218 FPS average, leading the 5700X3D by 11%. The 7800X3D gets bound-up at 219 FPS AVG due to GPU driver overhead in this particular game between Intel and AMD when handling NVIDIA GPUs.
F1 2023 Benchmarks
F1 2023 - 1080p
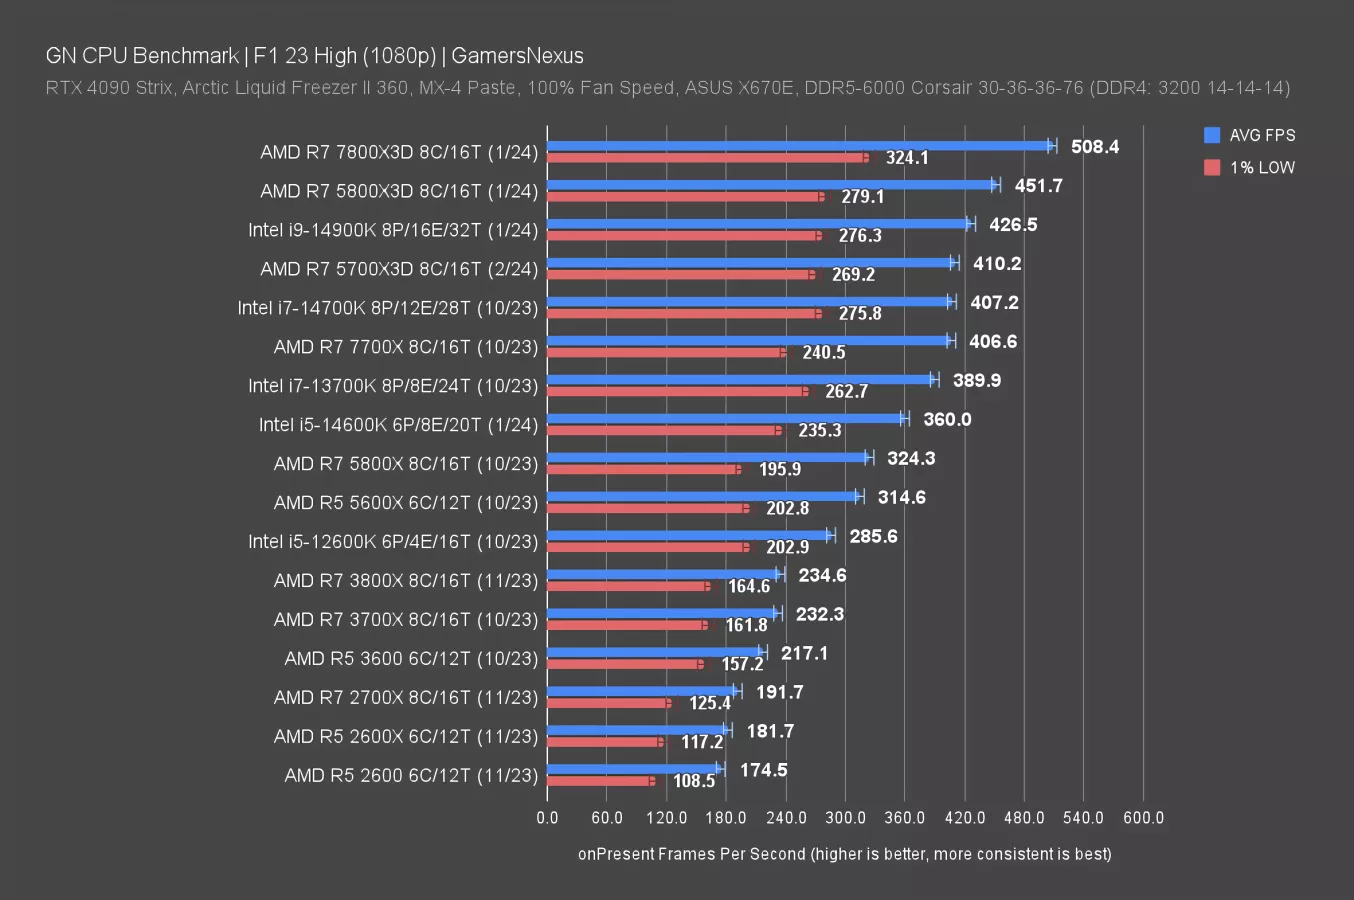
In F1 2023 at 1080p, the R7 5700X3D ran at 410 FPS AVG, establishing about a 40 FPS gap between it and the R7 5800X3D. The 5800X3D therefore leads by 10% again. The 7800X3D on AM5 leads by 24%. The 5700X3D ends up surrounded by some of Intel’s newer parts, with the 14900K (read our review) and 14700K flanking. It outperforms the 14600K meaningfully while being cheaper at time of writing, at $250 to $300.
F1 2023 - 1440p
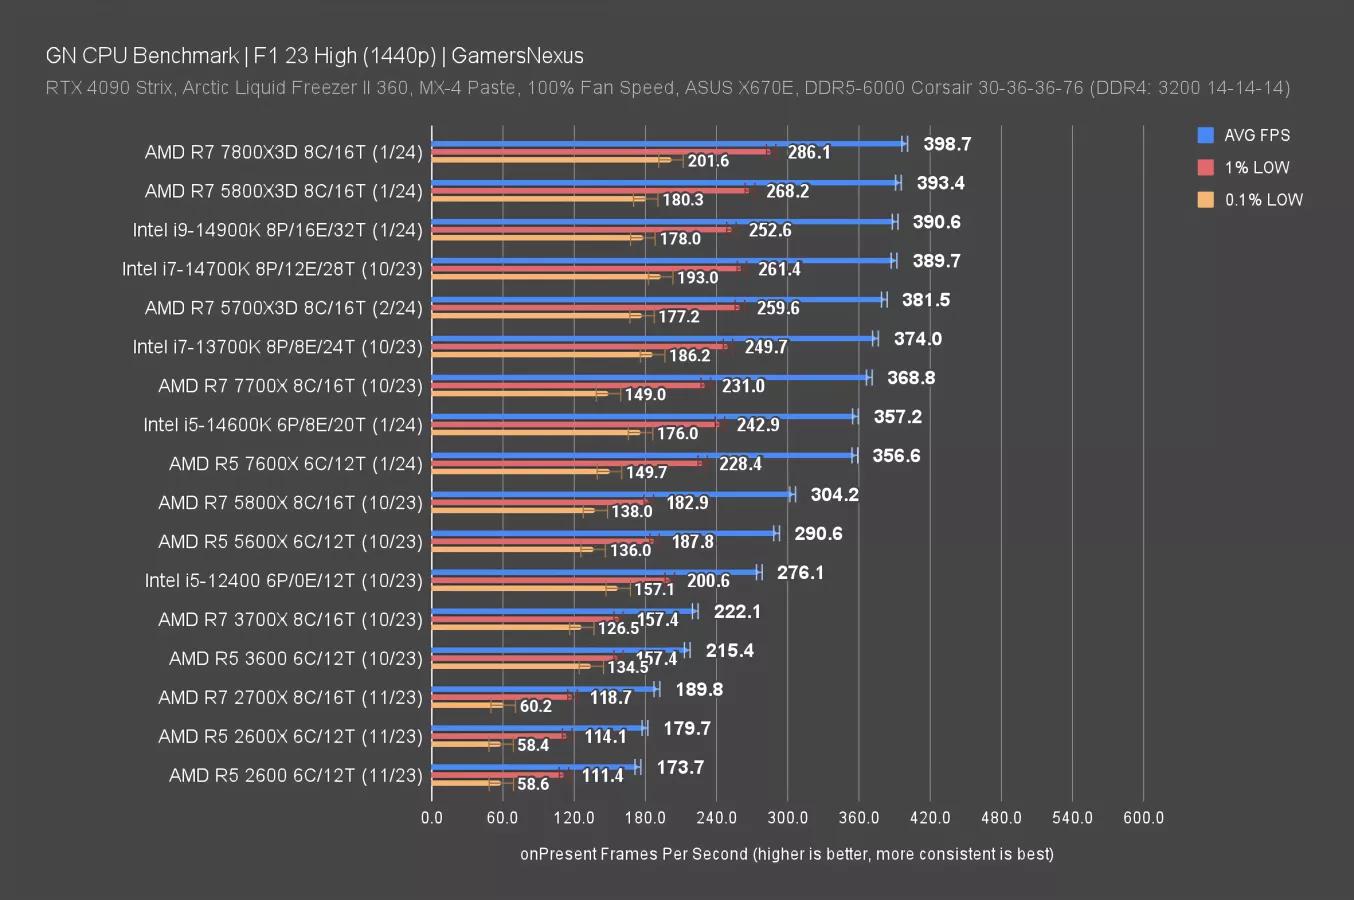
At 1440p, the top results get truncated due to the resolution increase. This is expected behavior. The 5800X3D now ties with the 7800X3D, with both being limited by other elements of the platform and by the increase in GPU workload. The 5700X3D doesn’t reach the same heights, but closes the gap to 3% as a result of external limitations. This is a good reminder that scenarios not exclusively bound on the CPU will show limited scaling between high-end CPUs.
Shadow of the Tomb Raider - 1080p
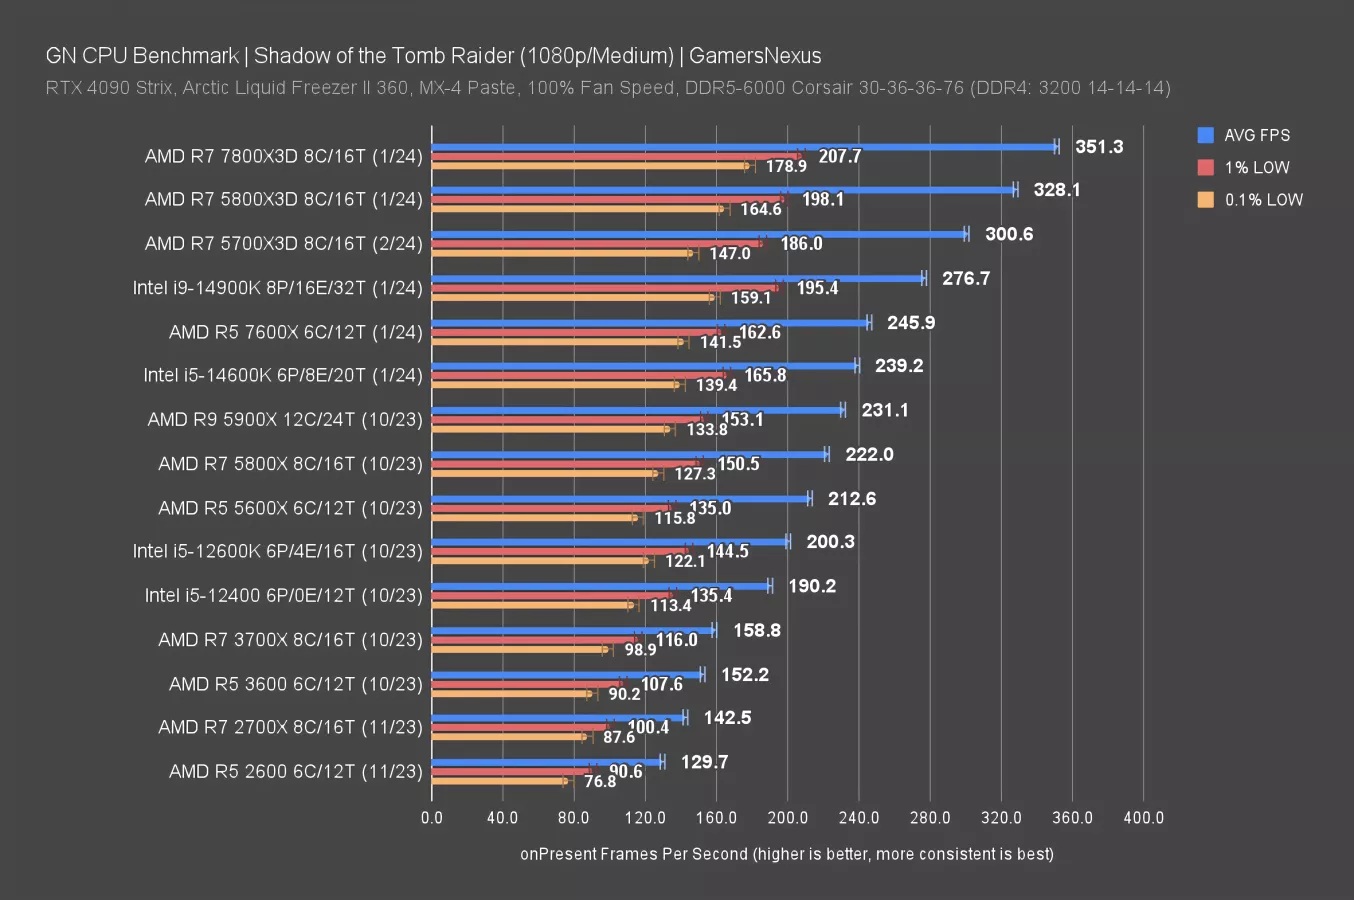
In Shadow of the Tomb Raider at 1080p, the 5700X3D landed at 301 FPS AVG, allowing the 5800X3D about a 9% lead. That’s in-line with some of the prior results. The 7800X3D leads at 350 FPS AVG, with the 14900K trailing the 5700X3D and 5800X3D CPUs. Their cache is benefiting them here.
Baldur’s Gate 3 Benchmarks
Baldur’s Gate 3 - 1080p/Medium
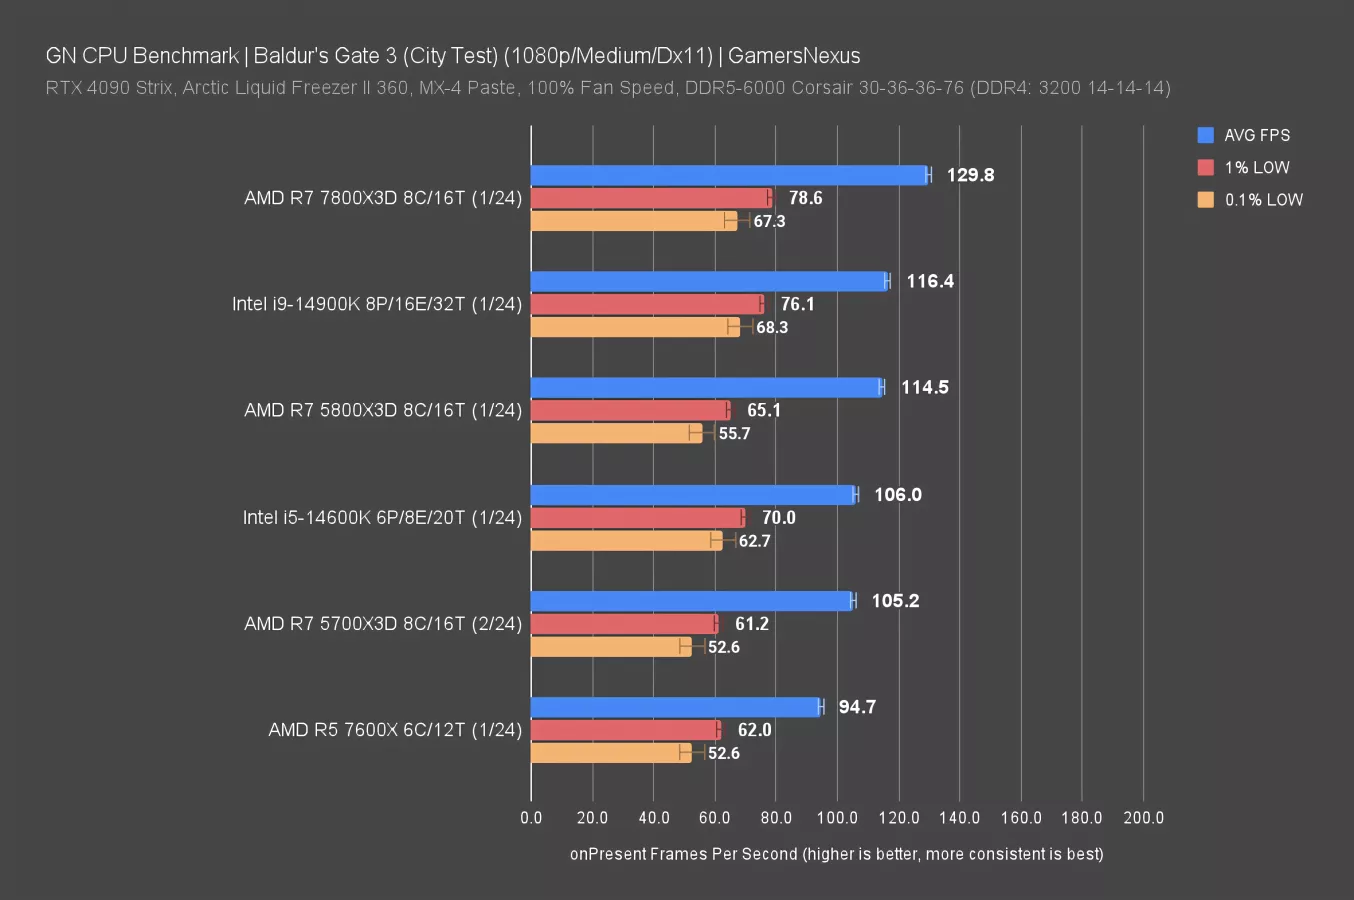
Baldur’s Gate 3 has also received multiple massive patches since our October data set. We found that CPU performance was typically around 5% different from previously at the upper-bound of the testing, or 2-3% at the lower. Because of the 5% swing in some scenarios, this chart contains only directly comparable data that has been run on the newest game version.
This data set is very limited as it was only collected this week, but contains the most interesting comparison: The 5700X3D’s 105 FPS AVG yields to the 5800X3D at 115 FPS, about a 9% lead over the new R7. That has the 5700X3D ahead of the 7600X for performance and about tied with the 14600K.
The 7800X3D leads the 5700X3D by 23% in this test, with the 14900K 11% ahead.
Baldur’s Gate 3 - 1440p/Medium
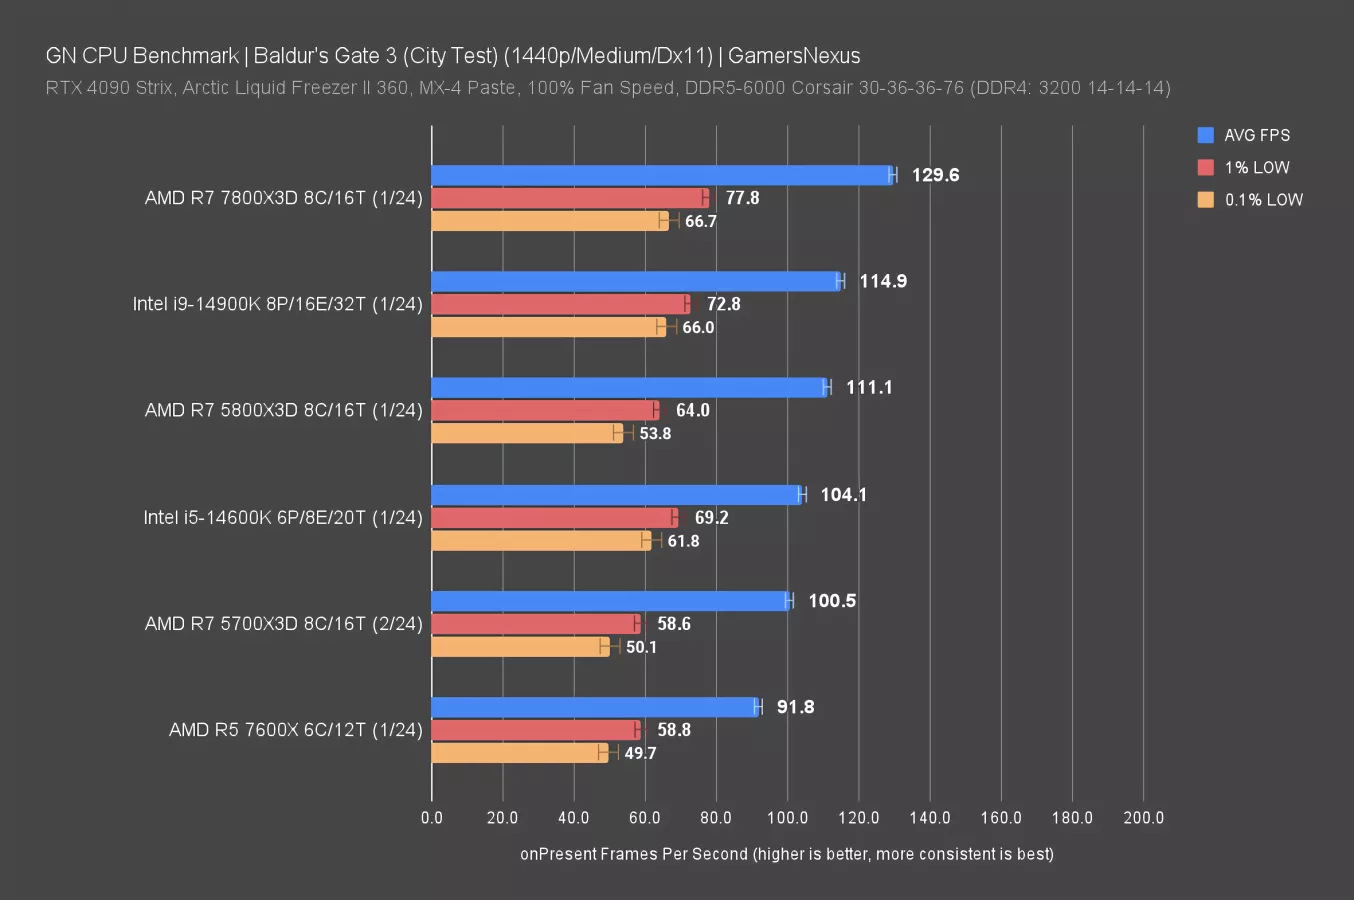
At 1440p and Medium settings, we remain bound by components other than the GPU. This is good news for CPU scaling and means that you’d still see benefit even in this particular workload. Keep in mind that our Baldur’s Gate 3 testing is in Act III and in a densely populated market area of the city, which increases simulation load on the CPU.
The 7800X3D’s 130 FPS leads this chart, with the 5800X3D at 111, which leads the 5700X3D by about 11%. The hierarchy remains the same as before.
Rainbow Six Siege - 1080p
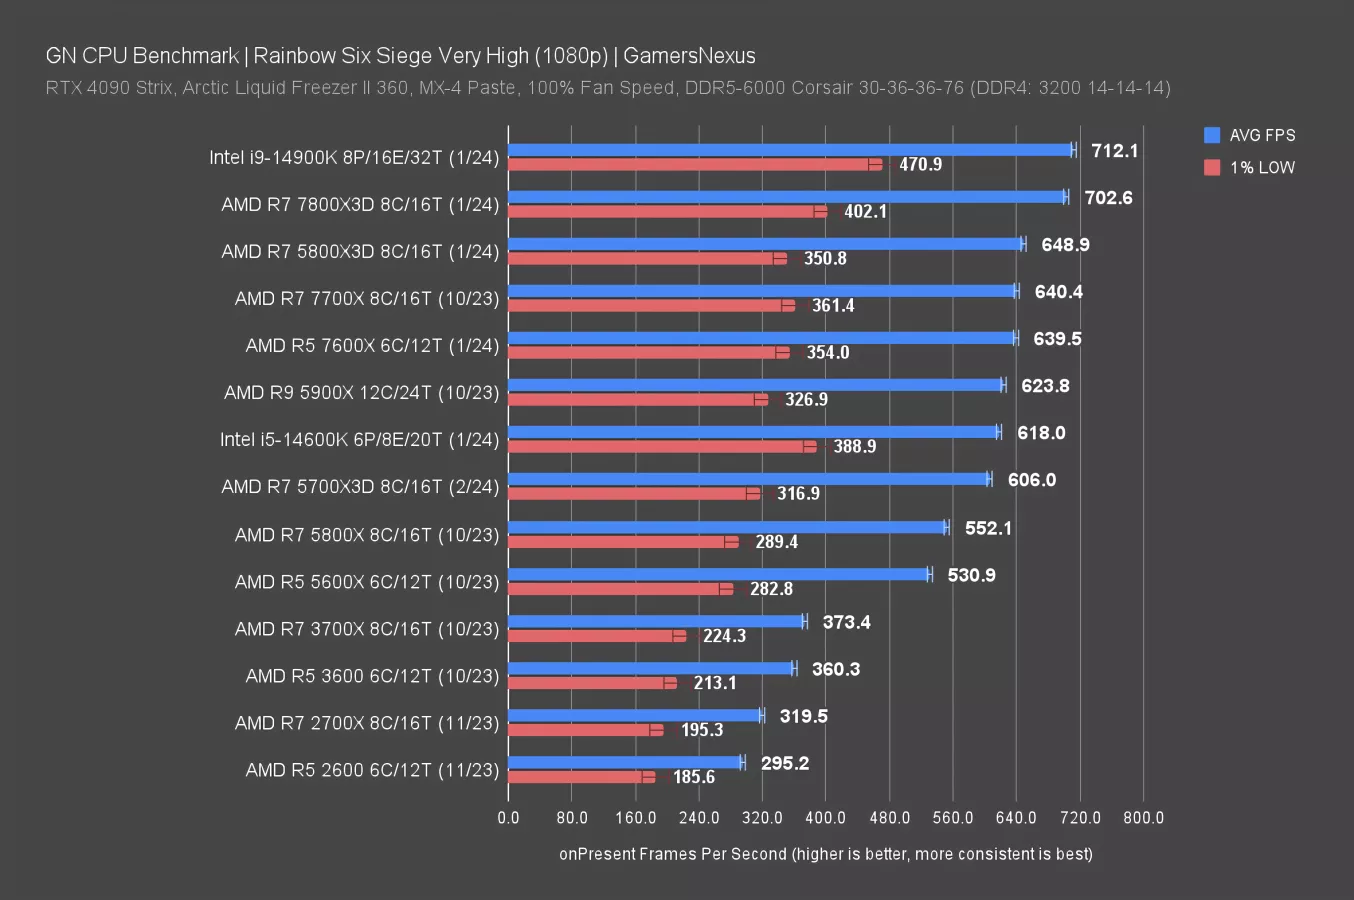
Rainbow Six Siege validated as similar on our AMD Ryzen passes, but had changed outside of our acceptable tolerances for some Intel CPUs following recent patches and updates since October. We’re removing old Intel data as a result, so Intel is in limited supply for this chart.
In Rainbow Six Siege at 1080p, the 5700X3D held at 606 FPS AVG, with the 5800X3D 7% ahead at 649 FPS AVG. The 5700X3D ends up below the 7600X in this one and just behind the freshly retested 14600K (but not noticeably for any human).
Production Benchmarks
We’ll quickly look at a few production benchmarks. This section will be kept short since it doesn’t change as much.
Blender
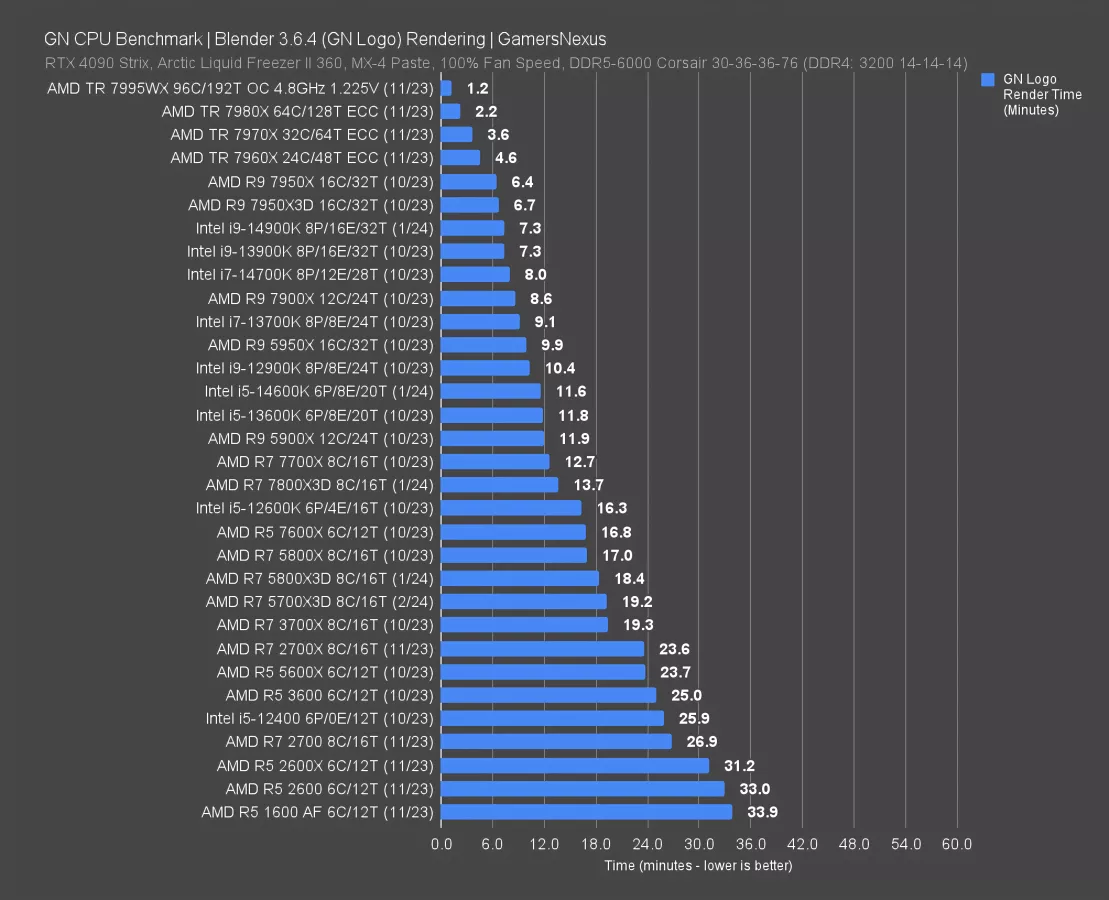
In Blender, the 5700X3D completed our frame render in 19 minutes, meaning the 5800X3D reduces time to render by 4%. X3D CPUs in general don’t provide additional value in this test, and in fact, typically perform slightly worse than the non-X3D counterparts as the frequency is more useful in this benchmark. You can see that in the 5800X result vs. the 5800X3D and in the 7700X vs. the 7800X3D.
7-Zip File Compression
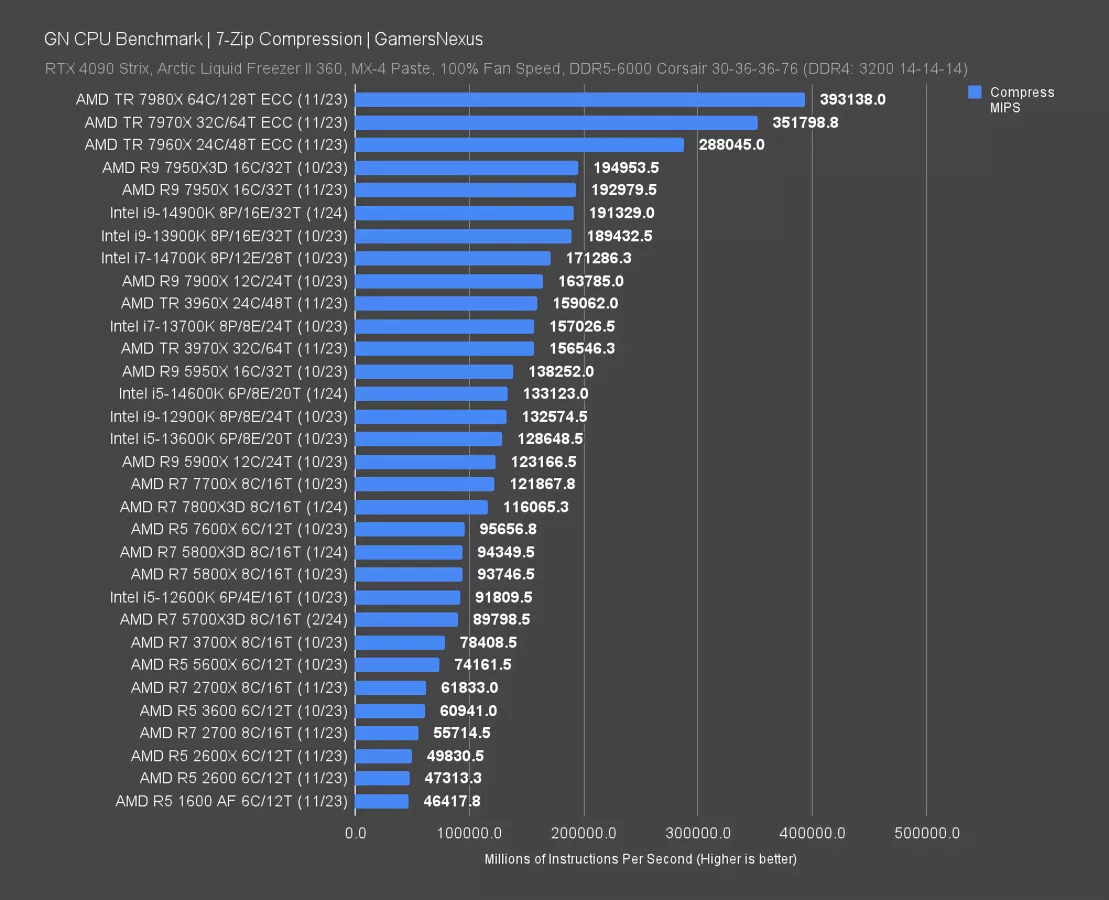
7-Zip file compression is measured in millions of instructions per second. The 5700X3D completed 90K MIPS, with the 5800X3D about 5% ahead of this result. The gap here is smaller than what we saw in most of the gaming tests earlier and is within a range where, functionally speaking, most people can think of the 5800X3D and 5700X3D as the same performance in file compression work.
7-Zip File Decompression
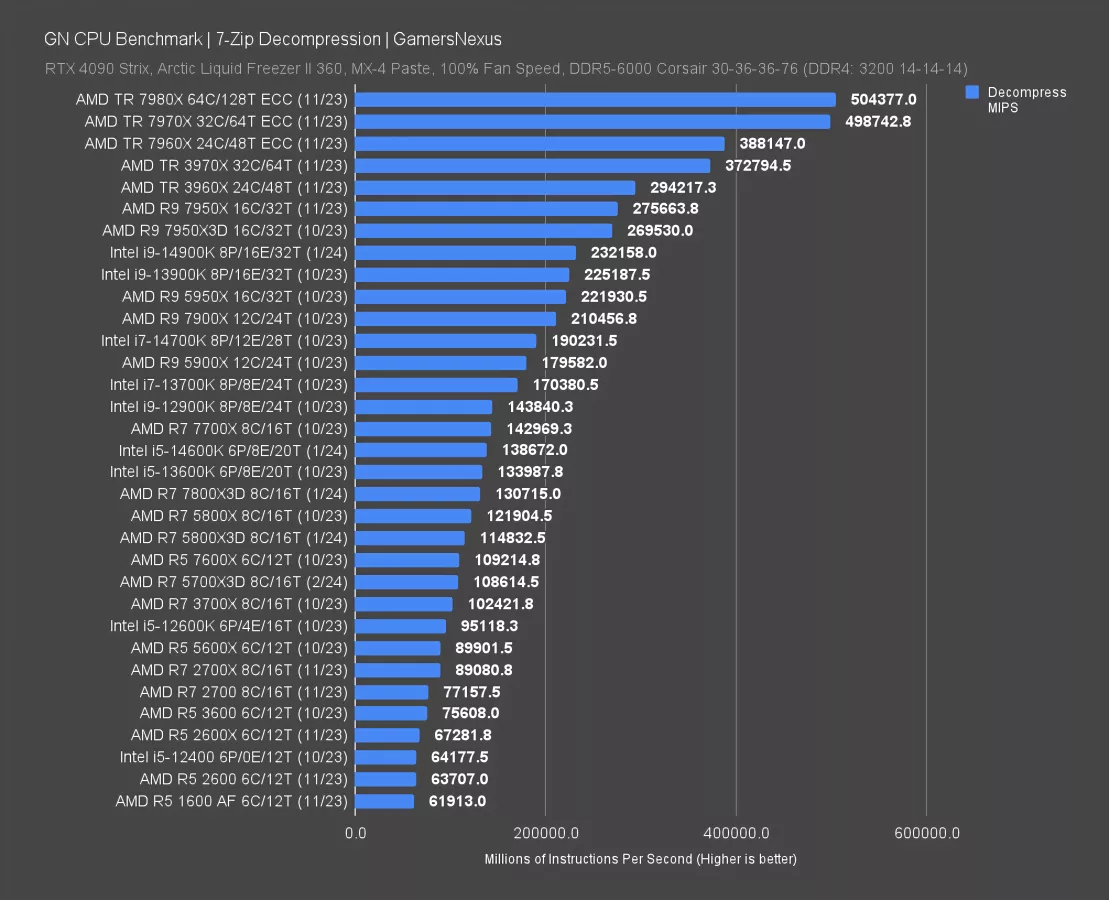
In file decompression benchmarking, the 5700X3D completed 109K MIPS, giving the 5800X3D a lead of 5.7%. The 7800X3D pulls 20% ahead here, with the 7700X further still and benefited from the frequency change. The 5800X non-3D also leads its X3D counterpart.
Chromium
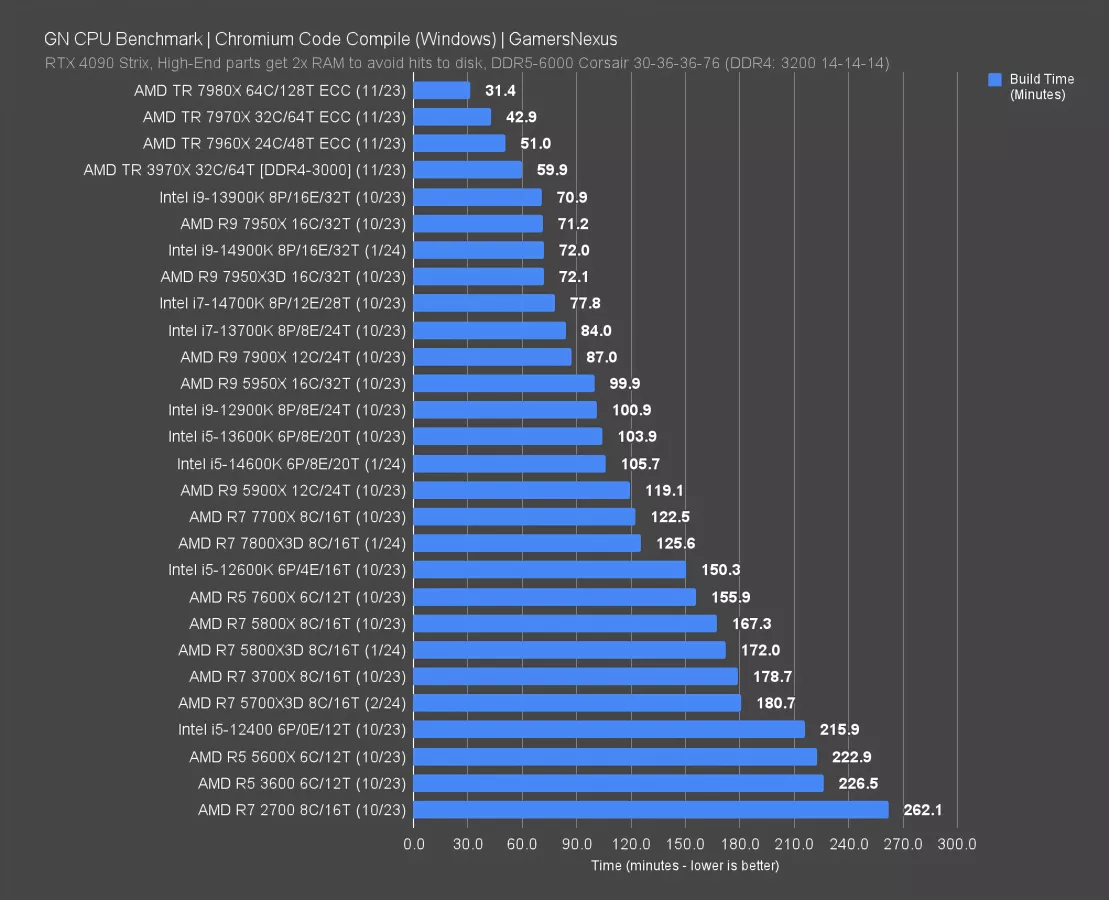
Finally, in Chromium code compile, the 5700X3D required 181 minutes to complete the compile. The 5800X3D used about 5% less time, at 172 minutes. The 14600K leads both of these massively, with a 106-minute result and 41% time reduction from the 5700X3D’s result.
AMD R7 5700X3D Conclusion
It’s a 5800X3D, but a little slower. In gaming, commonly we’re seeing about a 6-10% swing and the price difference is much larger.
Generally speaking, value is good. The 5800X3D’s value has also been good, particularly if you already own AM4. Buyers of brand new machines really should be carefully weighing sticking with more modern hardware for better upgradeability, especially now that the 7800X3D prices have stabilized. But definitely for owners of existing AM4 builds, the 5800X3D and 5700X3D are both good value options to get one last push on the CPU-side.
But for these two parts, you’re looking at around a 20% increase in price -- from $250 to $300 or so -- and a 6-10% increase in performance by buying the 5800X3D instead.
If this truly is going to be the last hurrah for an AM4 build and you want to stretch it as long as CPU-ly possible, then the 5800X3D does get the most traction to keep you going another couple years. The 5700X3D is just there for anyone on a stricter budget.
What is less clear is whether it’d make any sense to build a brand new AM4 machine with all new parts. With used, it makes more sense. But for all new, remember that you are going to inevitably be marooned on the platform. There’s some value in a new platform for new builds for that reason. This is clearly a good upgrade option, though.
Intel’s 14600K has also stabilized in price over the past couple months, but we don’t consider it a direct alternative to the 5800X3D. The 7000 series might be a closer alternative, just because you can’t install a 14600K in an AM4 board, and we think that's probably the primary user of these new AM4 parts in 2024.
Ultimately, we’re just happy to see a platform get supported for 8 years now, or about 7 of Ryzen CPUs. That’s great for reducing e-waste and helping keep PCs affordable in an era of expensive GPUs.
Our conclusion is pretty straightforward. We still think the 5800X3D makes sense. It is not invalidated entirely by the 5700X3D, which does take a good chunk out of the potential sales for people who are really sensitive to that extra $50 to $65 but we think the 5800XD mostly still makes sense as an option if you are really just trying to get one last drop in to squeeze everything out of that motherboard. With that price gap, however, the 5700X3D is a better value strictly in the sense that it's a lot cheaper and the performance gap is really not that wide.