
We benchmark over a dozen CPUs in Starfield while exploring potential GPU and RAM bottlenecks
The Highlights
- There is some core scaling between six core and eight core CPUs in Starfield
- Older/less performant CPUs like the R7 2700, 3700X, and 12400 can limit the game’s performance
- Starfield is a clock-bound game that can benefit from CPU overclocking
- Release Date: September 5, 2023

Today we’re benchmarking CPUs in Starfield. This content became a lot more interesting than just a CPU benchmark. As a matter of fact, the CPU benchmarks were done in one really long day, but we added a lot more time to start exploring GPU Busy, which is the new frame time metric that we were talking about with Intel engineer Tom Peterson recently.
In terms of CPUs, we’re going to be looking at a bunch of SKUs, everything from the AMD Ryzen 2000 series up to modern CPUs like the 7800X3D. On the Intel side, we’re looking at the company’s 12th and 13th generation processors. We also spent some overclocking time using the 13900K just to try and see how much clock scaling there is in addition to CPU core count.
There’s a lot of real cool stuff coming your way. GPU Busy, in particular, will be a lot of fun to go through because it’s a new type of metric that we can learn from.
Credits
Test Lead, Host, Writing
Steve Burke
Testing
Patrick Lathan
Testing
Jeremy Clayton
Video Production
Vitalii Makhnovets
Writing, Web Editing
Jimmy Thang
Starfield CPU Overview
Our key focus will be on CPU benchmarking and that entails building a CPU bottleneck. In order to do so, we use a high-end GPU and high-end memory. Throughout this process, we also tested some memory bandwidth situations with the ultimate goal being to try and isolate as much load as possible onto the CPU.
It’s worth noting that at the time of this write-up, the game is only a few days old and it’s not officially launched yet, we expect there’s going to be a major patch at some point in the near future.
We've seen efforts to explain why the 7900 XTX performs nearly the same as a 4090 in Starfield, including theories about poor NVIDIA driver optimization based on low GPU utilization and low power usage (percent TDP). We're not testing those theories in this video: this piece is about CPUs, and the 4090 is still one of the best choices for benching CPUs.
Some of the community discussion has centered around GPU-Z showing “100%” utilization for the GPU despite having lowered “TDP” reported in GPU-Z. We’ve also seen some discussion around low Windows task manager GPU utilization despite being seemingly GPU-bound, e.g. at 4K/High but showing 30% task manager GPU load on NVIDIA (or something). We won’t get into this today, but task manager uses a simple method for reporting this utilization. There may be one part of the core, like graphics_1, at 100%, but task manager will represent the total GPU utilization in summary as a much lower number.
Likewise, it’s possible for a GPU to be 100% loaded on one specific component and not pull full power.
Regardless, we did a lot of utilization testing and ultimately determined that, for purposes of a CPU benchmark, we were in fact largely CPU-bound except possibly at the very top-end (like 5.9GHz on a 13900K). The game’s behavior is objective and testable even if it isn’t fully “optimized,” and the numbers are what the numbers are.
GPU Busy
Now we get into some super exciting new data. We’ve never previously produced charts like what we’re showing today and we’re really excited to do it. We’re using the latest update to PresentMon, an open source tool, to illustrate the GPU/CPU load split in Starfield.
A massive disclaimer here: This is a brand new type of data presentation for the reviews industry. As such, because we’re trying something new with data we didn’t have before, it’s very likely that these charts and our understanding of them will change with time.
As we get into this: We verified that using the command line version of this tool has no impact on performance metrics, but there are some specific conditions that need to be configured to minimize impact. We did that configuration.
GPU Busy Ratio
We’ll start with the ratio chart first, then go to the roots. This is a little backwards but, from an educational standpoint, we think it’ll make it easier to absorb the objectives of this data. One very important thing: THERE IS NO “BEST” in this chart. It depends how you want to interpret it. If you want your GPU to be fully utilized, then a 1.0 result would be the “best,” but your CPU will be underutilized. You’re always going to have a bottleneck somewhere. But it’s just about balancing the component expense to try and maximize each part without leaving a lot on the table. There’s a lot more going on within the frames that we can’t see yet either.
Utilization
Now, there’s one large important thing here: GPU Busy can still show as high, or as GPU-bound, even if the GPU isn’t actually bound. Remember that while we walk through these charts. That’s going to be really important, because the GPU actually isn’t being fully utilized by Starfield. We’ll come back to that.
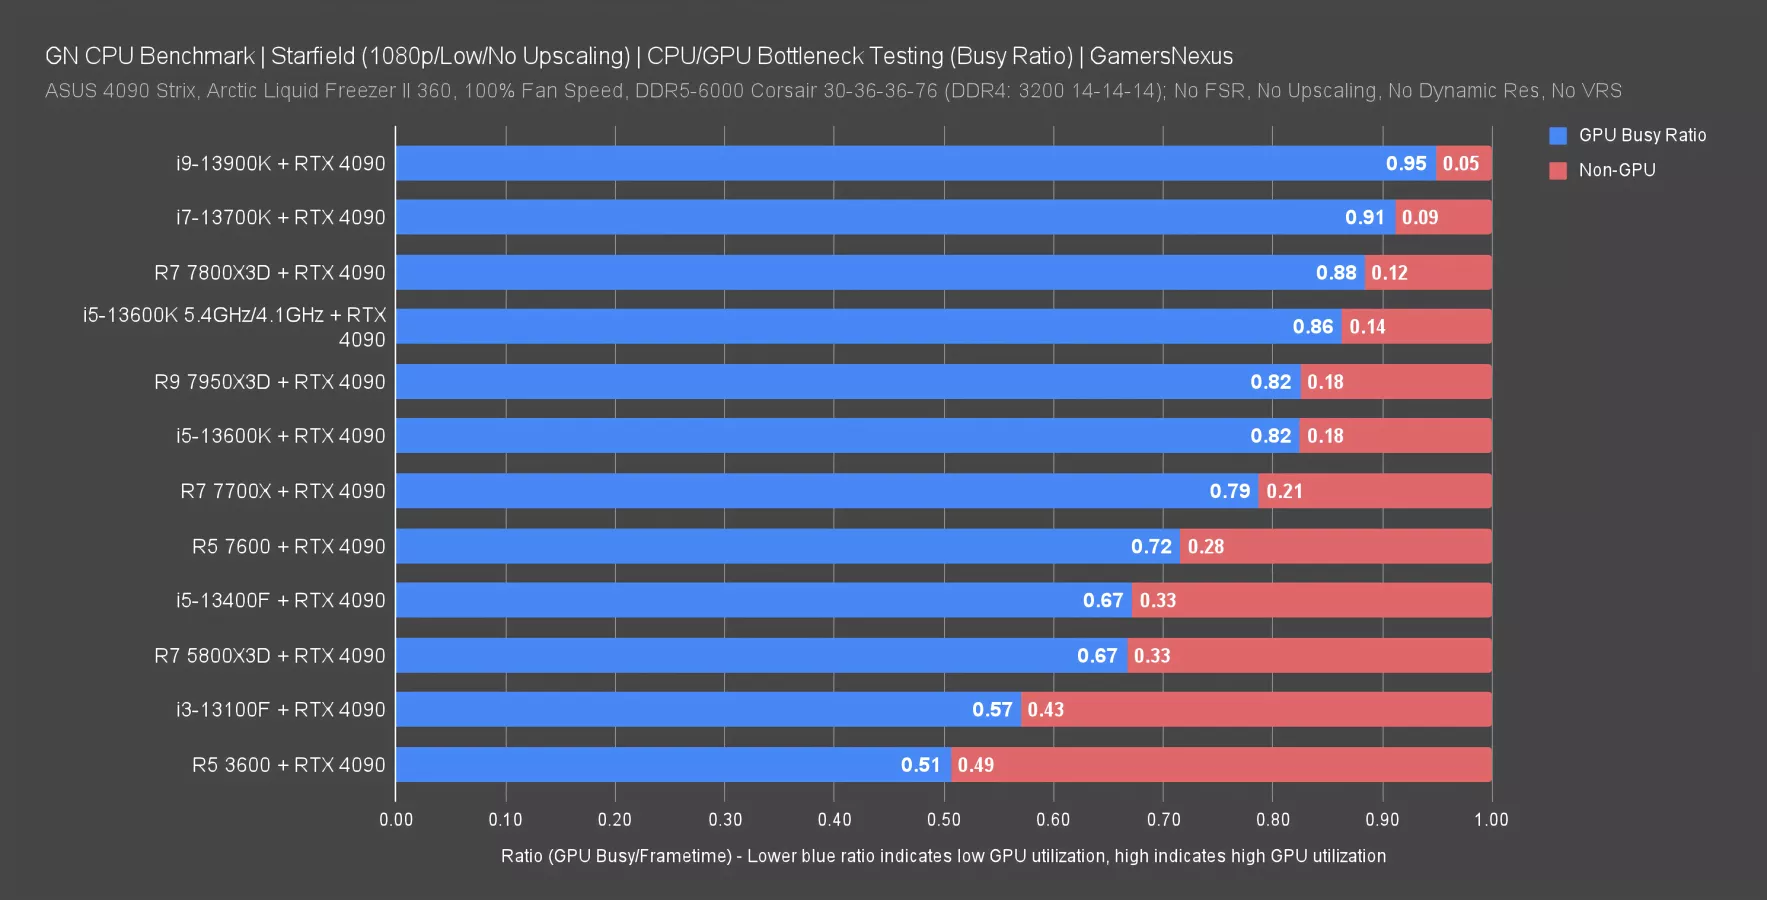
This chart shows the ratio of total frametime against GPU busy time. The maximum value is 1.0. In this chart, the closer the blue bar is to 1.0, the more GPU utilization we’re seeing. The red bar indicates non-GPU work per frame rendered, whereas the blue bar represents GPU occupancy or busy time per frame rendered. A shorter blue bar means less GPU utilization as a result of the CPU being overloaded, which tells us that there’s an imbalance in the resources for the game.
So, for the 13100F, we can see a 0.57 ratio of average GPU Busy divided by average frametime. What this chart tells us is that our 1080p/low benchmarking will bind every component heavily on the CPU up until about the 13700K and 13900K, where we’re beginning to occasionally bounce off of a GPU bind. That means these parts are close to their maximum scaling in the CPUs before we get limited methodologically in our ability to demonstrate a meaningful difference.
GPU Busy Frametimes
Let’s look at the raw data. This will set the groundwork for future use of this, so you’re seeing the development of a new paradigm for us. We’re excited for it because we’re not sure where it’s going yet, but we can see the foundation for something useful.
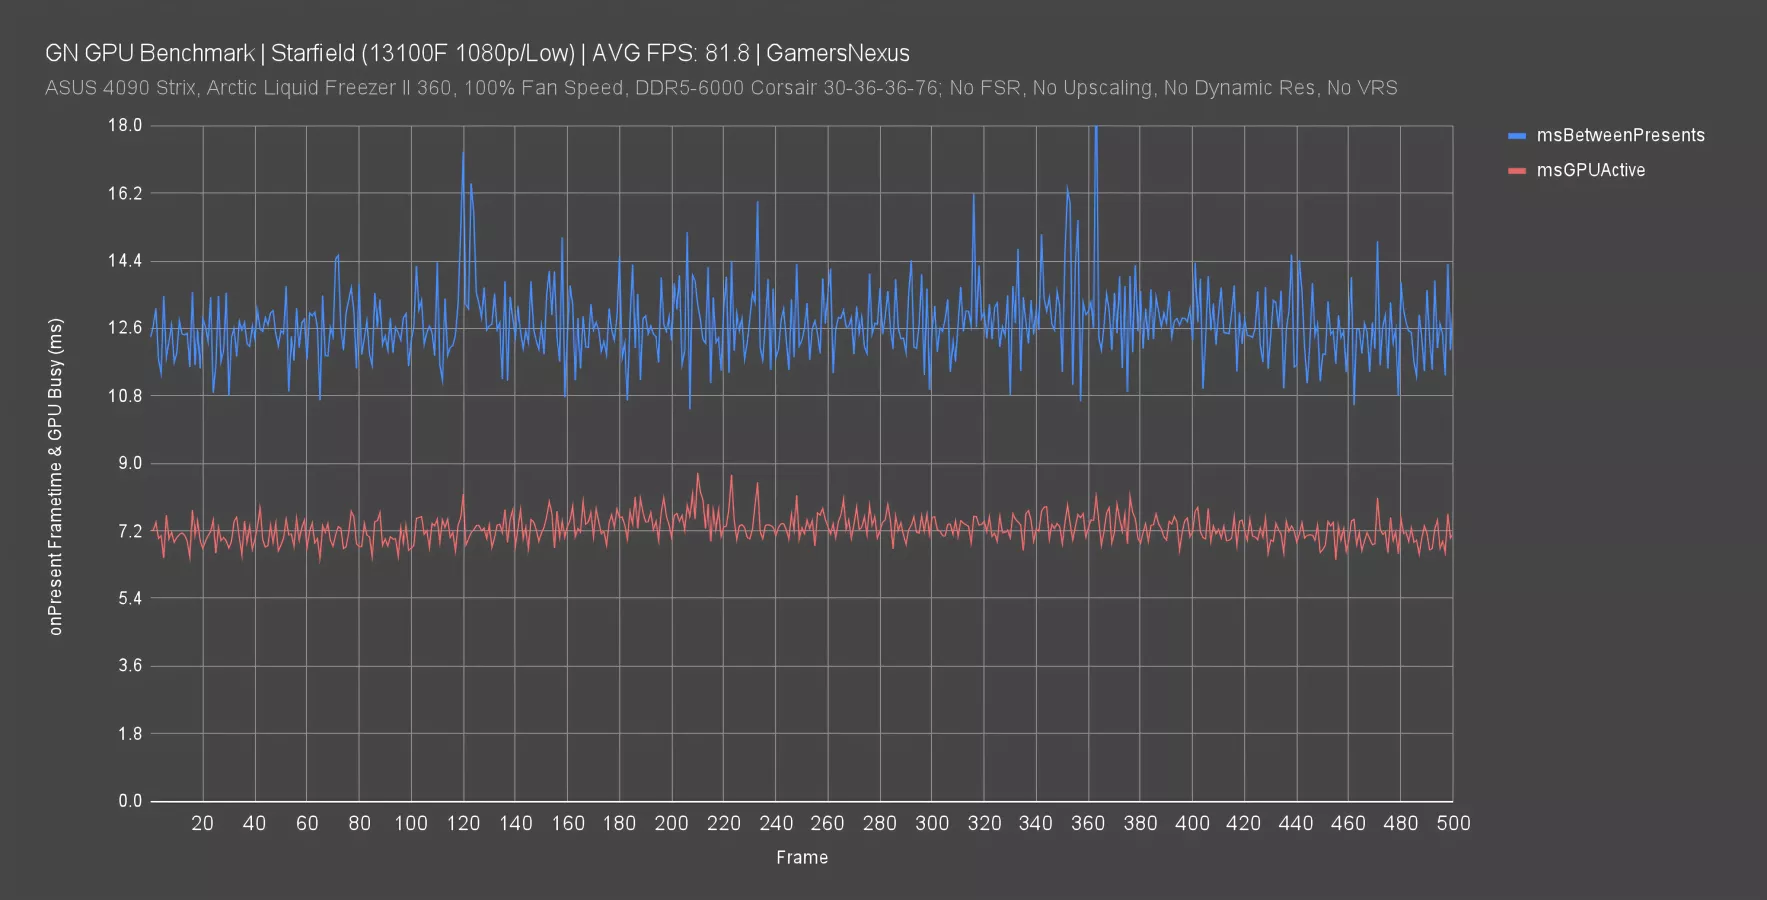
This first chart is for the 13100F at 1080p/low. This is just a snapshot of 500 frames from the test -- we have a lot more, but limited the X axis to make it easier to read. The average FPS for the entire set of 4 passes came out to 81.8 out of a maximum on this GPU of about 145. The distance between the red and blue lines indicates that, in this chart at least, we’re CPU-bound. The GPU is not fully occupied during the creation of these frames and has time that it’s waiting on the CPU.
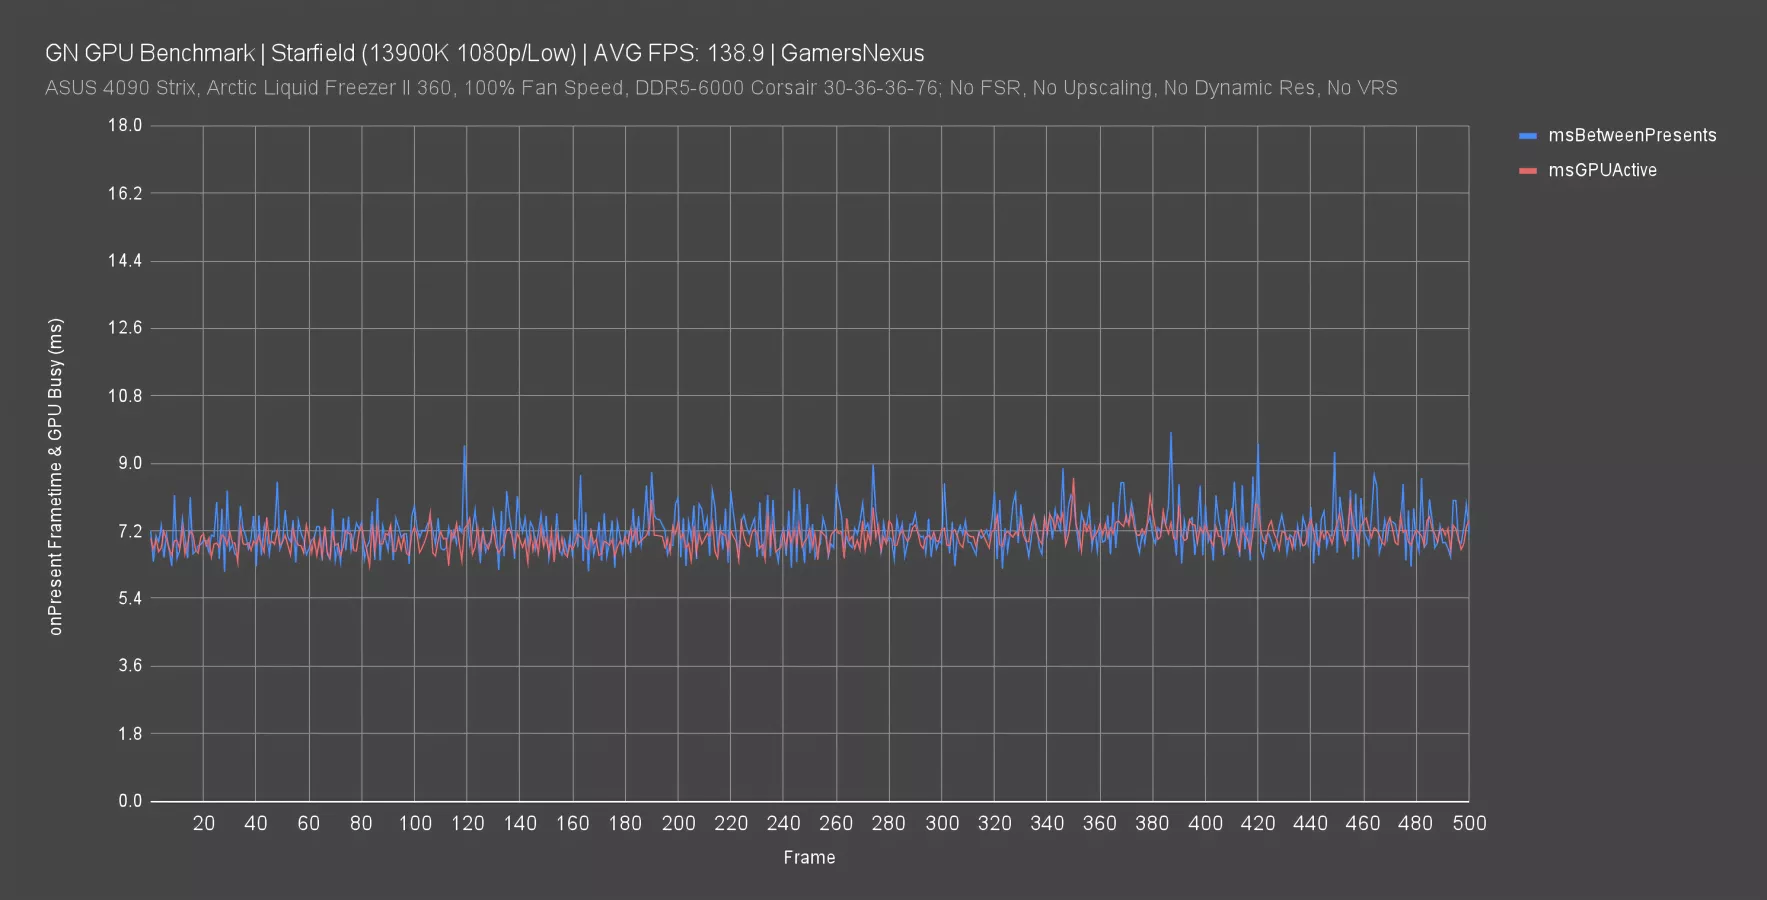
Let’s go to the opposite viewpoint: Here’s the 13900K at 1080p/low. We’re using a much higher-end CPU. The lines are almost on top of each other, aligning with our 0.95 ratio earlier. This indicates that our GPU utilization is much higher than with the 13100F -- which makes sense, seeing as it’s a 4090. The overlap tells us that we may not be able to see a fully decoupled framerate out of the 13900K at 1080p/low because we are still at least occasionally hitting a GPU bind.
The cool part about this is that it helps us frame our writing around the data: We can now more confidently indicate to you all whether we’re actually GPU-bound or whether we’re just capped on the CPU. In this case, we’re approaching and sometimes hitting a GPU bind, which means (of course) that the 13900K might be able to stretch a little further and distance itself from the rest of the pack slightly more if only it had a GPU that doesn’t exist or was on ridiculously low settings.
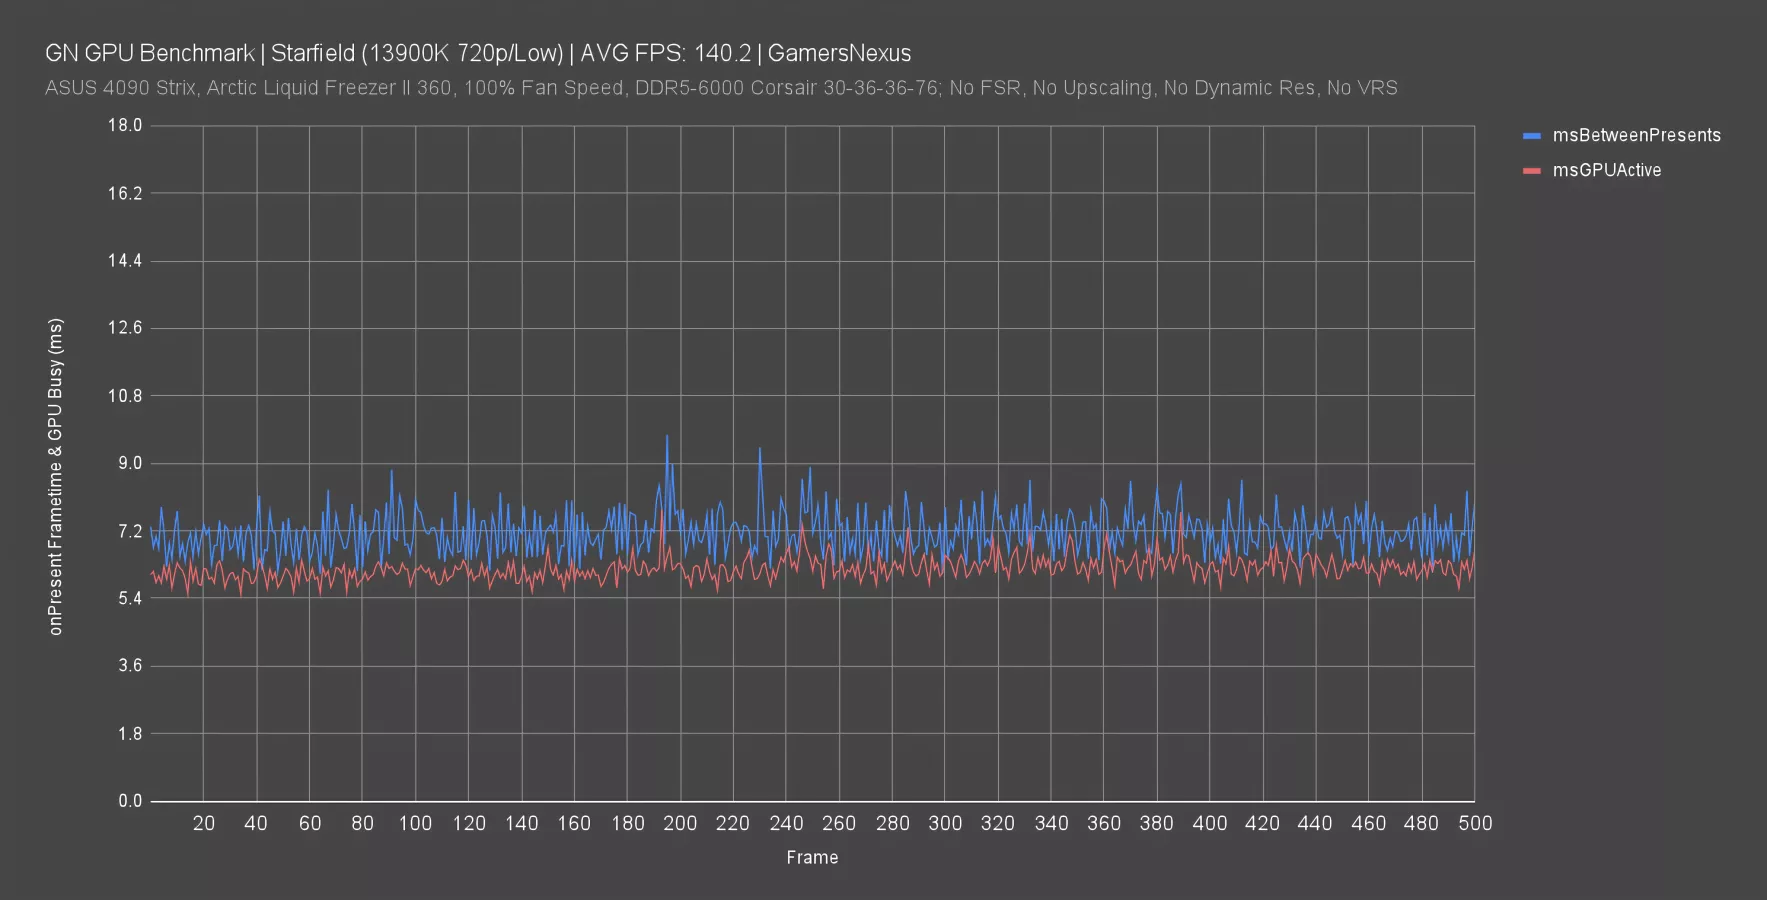
And now for those settings: Here, the 13900K at 720p/low -- which we recognize is a completely stupid combination of things, but is useful as an academic exercise -- is now establishing a gap between the GPU Busy and Frametime lines. This reinforces our earlier newfound understanding: The lower the ratio, the lower the GPU utilization. The higher the ratio (or closer to 1:1), the higher the GPU utilization.
Let’s look at one last one.
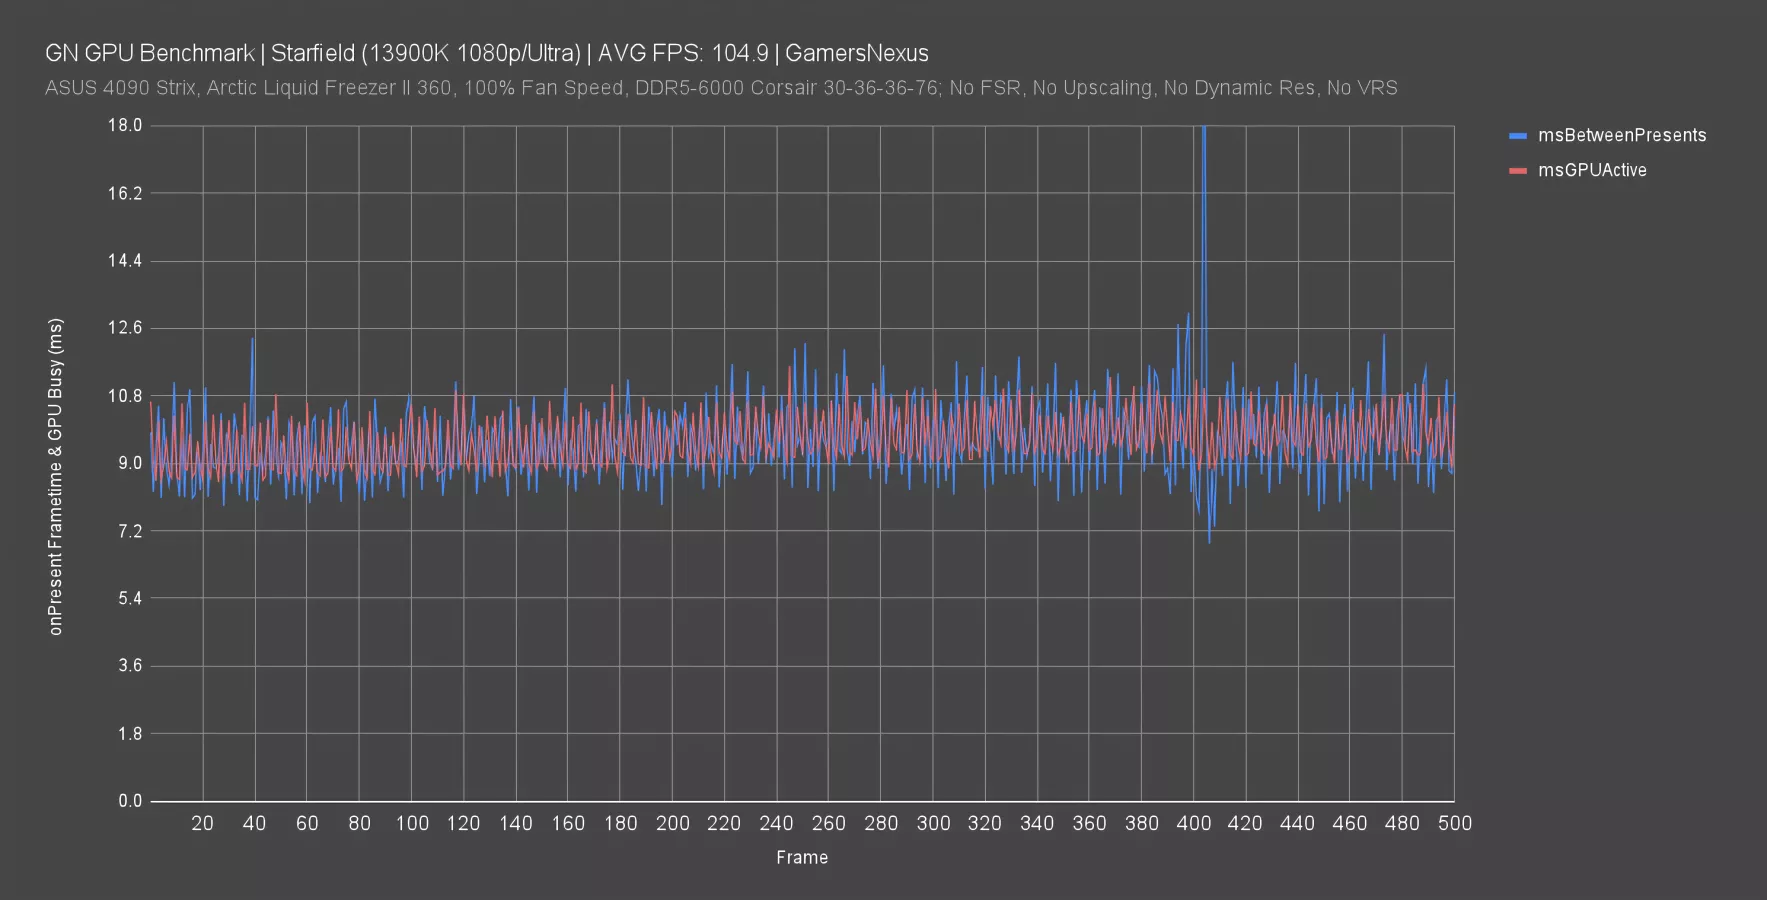
This is the 13900K at 1080p/ultra, so we’re definitely GPU-bound. Here, the lines are effectively right on top of each other. The ratio for this result was 0.99. It is effectively fully GPU-bound.
This stuff is crazy cool and we’re really excited about it. It’s a paradigm shift in the making for component benchmarking, and the industry is only just now at the front edge of figuring out how that shift manifests. We’re excited to see where the reviewer community goes with it, and on our side, we’re already planning to integrate it with most of our content going forward. Make sure you watch our engineering interview with Tom Petersen to learn more about the render pipeline.
As for what all this tells us: This game becomes very GPU-heavy (and rapidly) as settings increase. There’s not much of a middleground transition. It tends to be either GPU-heavy or CPU-heavy at the extremes of the settings.
Coming back to the utilization thing we talked about: We saw when the game was GPU-bound vs bound by other components. But the GPU utilization is suspect.
Starfield RAM Tests
Buildzoid shared a theory after seeing CPU tests from another outlet that there may be a utilization issue in regards to RAM, so we dove into that.
For our tests today, we’re not memory-limited on our CPU benchmarks. We did see some other numbers online that used very low-end memory, and in that case, they are memory bound. We think it was PC Games Hardware that used DDR5-4400 in their charts, which would be a limitation. Buildzoid is absolutely right about that. That’s still valid information, but it does restrict the scaling on the CPUs alone to more complexly include memory as part of the limitations and become more of a memory benchmark. What that test taught us is that memory can impact Starfield in large ways, so we wanted to make sure ours wouldn’t for a CPU comparison.
We didn’t spend much time on memory and only used a few different kits to rapidly see if there’s any meaningful change with our test setup. All we care about is eliminating as much of the memory and GPU bottlenecks as possible to focus on the CPU to see scaling. We also talked with Buildzoid about some of these theories -- we’ll come back to that after this chart.
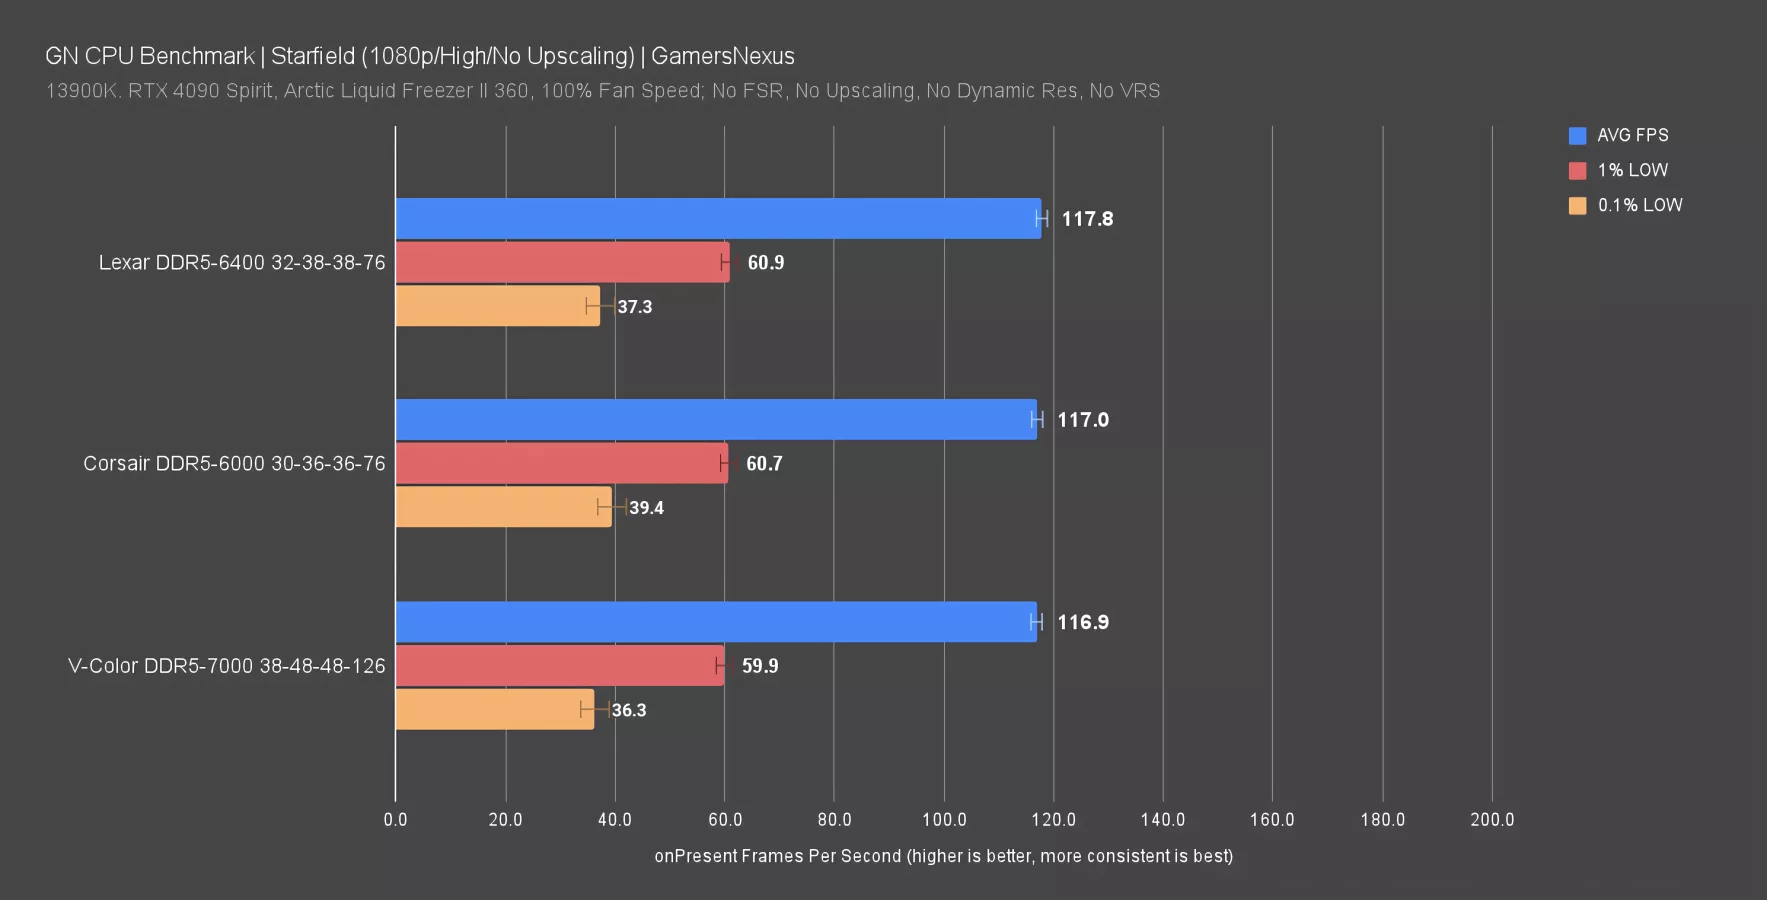
First, here’s the chart at 1080p/high with a 13900K. Here, you can see we are completely bound on non-memory components -- that’ll turn-out to be the GPU, as you’ll see later. Memory did not affect our results outside of run-to-run variance here.
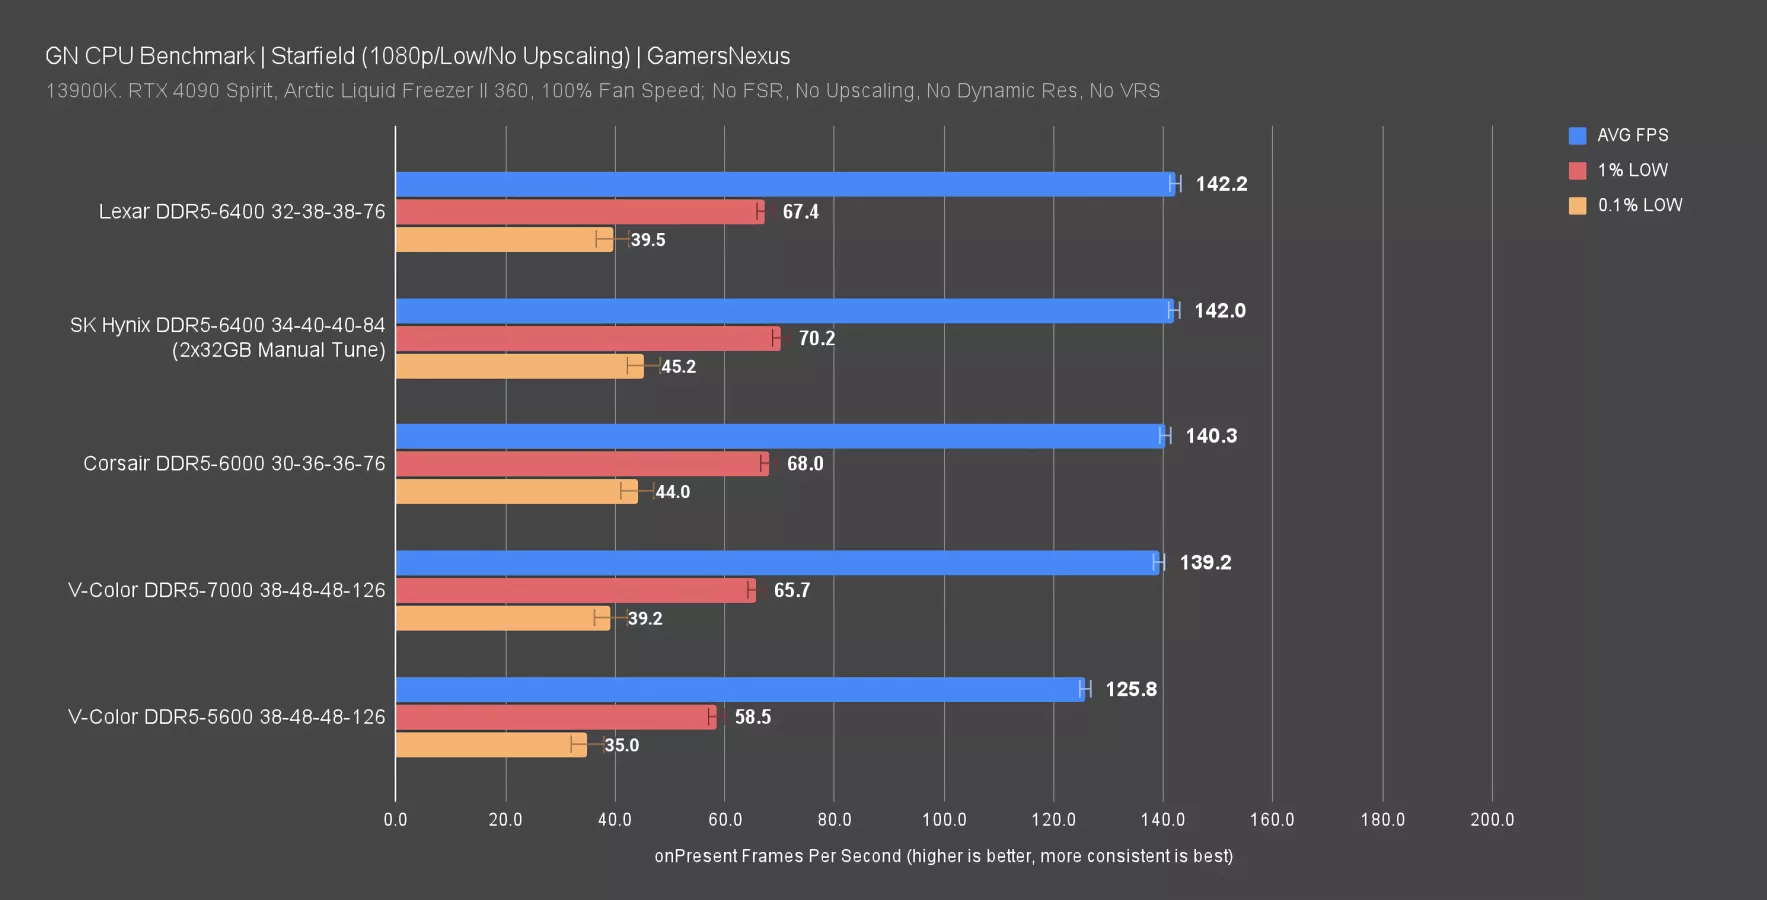
Here’s our 1080p/low chart. We didn’t do any tuning here. Our standard kit is the DDR5-6000 Corsair kit at 30-36-36-76, which we use in all our CPU reviews and tests. As you can see, it was within run-to-run variance of the DDR5-6400 kit at 32-38-38-76. We also have a custom V-Color kit that the company gave to us when we visited previously. As far as we’re aware, it doesn’t have an existing SKU on the market. At DDR5-7000 and 38-48-48-126, we were within error of our prior two kits. We had one more test at DDR5-5600 -- this is worse than our standard Corsair kit. After seeing no change in the prior tests, we decided to leave the looser timings and drop the frequency to see what happened. Here, we did get movement -- and a lot of it -- but what really matters is that, for our testing, we do not appear to be memory-bound.
As for the SK Hynix kit, for that, Jeremy on the team manually configured it at DDR5-6400 and 34-40-40-84. This is a dual-rank kit, so we used it just in case. Ultimately, although technically higher in framerate, it fell within our usual run-to-run variance.
If you were to run DDR5-4400 or some other slow speed, you’d probably get bound-up on a higher-end i9 CPU. This test isn’t definitive and it wasn’t our main goal to do a memory test with Starfield. All that mattered to us was determining if our standard memory kit was meaningfully limiting us from showing CPU scaling, and that answer is “no.”
We spent a couple hours working with Buildzoid on the next ideas. Although memory can still be a factor in our testing, we began looking elsewhere. He suggested a few tests:
- Disable hyper-threading
- Disable E-cores
- And overclock the 13900K CPU to 5.9GHz
We tried each of these independently and combined with help from Buildzoid to dial-in the overclock settings for rapid testing. Here’s what we came up with. This testing was done with our SK Hynix kit, which is different from what we’re using later in the charts. This testing is also done with 50% scaling against 1080p with FSR2, which is an abominably low resolution and some of the worst visuals we’ve seen in a video game -- BUT it’s intentional. We wanted to ensure we were not GPU-limited.
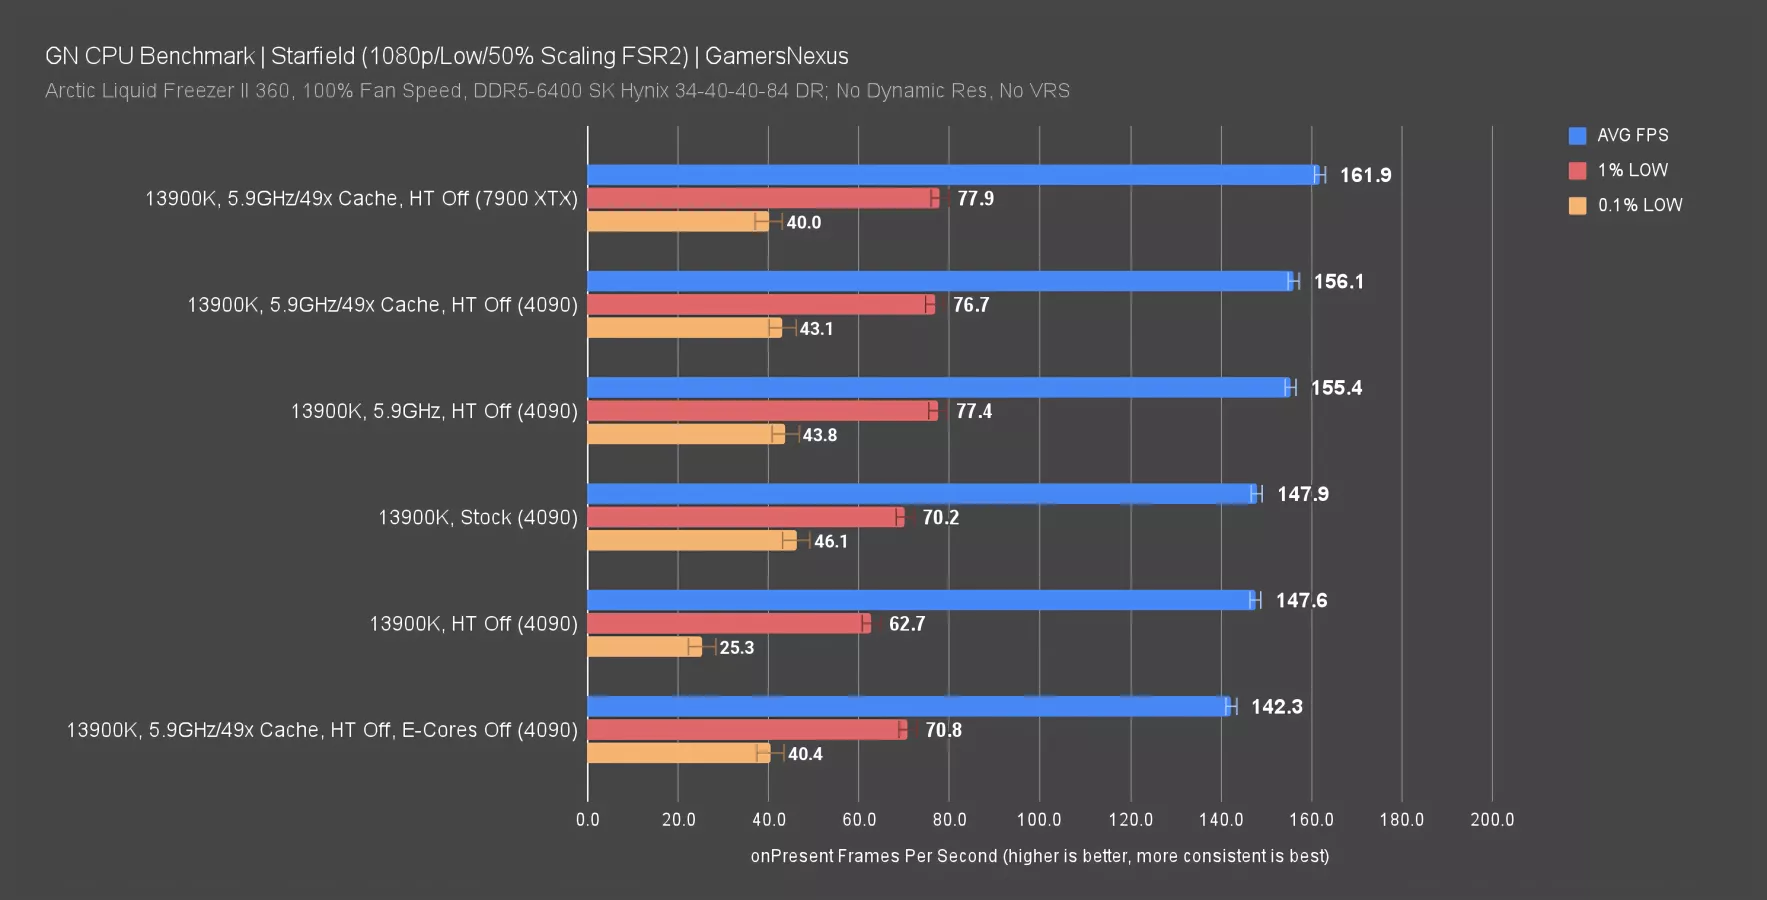
Our baseline result with these settings was 147.9FPS AVG. Disabling hyper-threading hurt the 0.1% lows, but did not affect the average framerate. Overclocking to 5.9GHz with HT off boosted us to 155.4FPS AVG, an increase over stock of 5.1%. It appears we’re clock-bound. Adding a cache overclock to 49x boosted us to 156.1FPS AVG, mostly error of the prior result but possibly an improvement. Disabling E-cores hurt the performance to below stock, even in spite of the overclock -- although it’s possible that E-cores off with hyperthreading on produces a better result.
We also ran these numbers with an RX 7900 XTX, yielding about the same maximum improvement over the 4090 as we saw in our tests earlier -- about 3.7%. But the improvement over baseline indicates that we were CPU clock-limited and overclocking helped here.
One thing we learned is that we were definitely clock-bound at the upper-end of our results, not GPU-bound. Now it’s time to get into the CPU benchmarks we’ve been promising.
Starfield CPU Benchmarks
Remember that these are accurate as tested regardless of the game or the driver’s issues right now. These still give you insight as to how it performs. We expect this will change as they patch things, so if you’re reading this in the future, you may want to check if we or others have newer data.
For this testing, we’re using 1080p/low as the extreme to show full scaling, then 1080p/high to produce a more realistic use case. You could estimate that medium would be in between.
1080p/Low
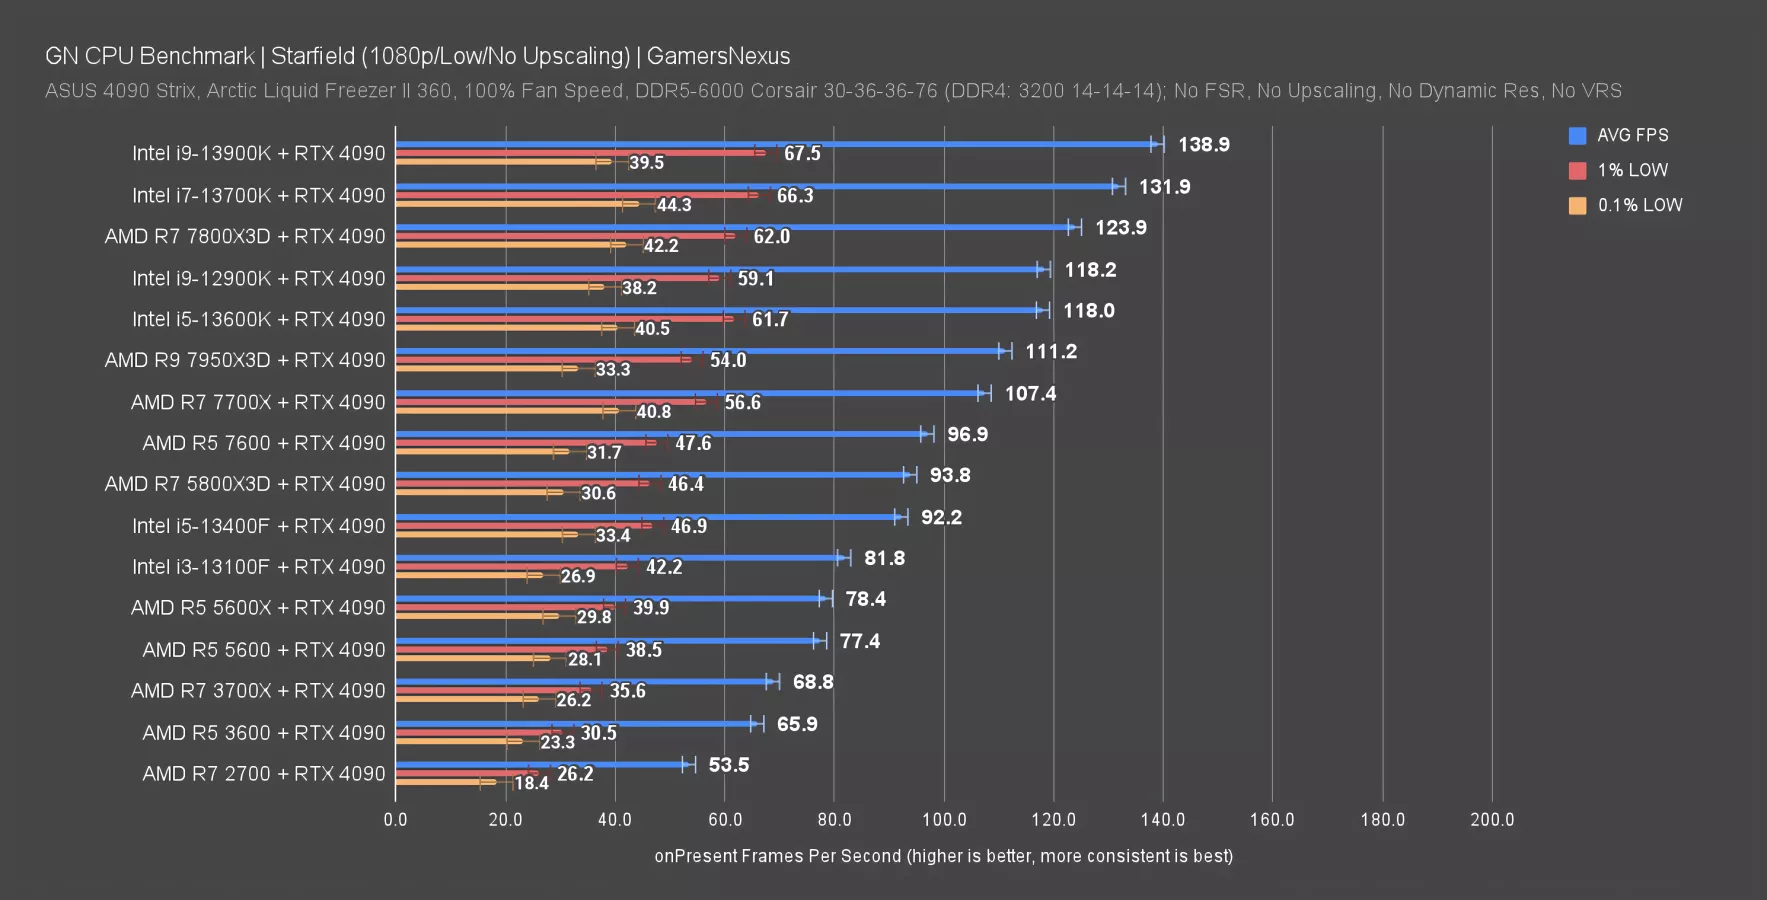
Here’s the chart where we get the most scaling, but at the least realistic settings -- and that’s fine. We’re starting with the pure scaling. That helps people on older hardware have a better idea for limitations. And most of this hardware is going to be bound by the CPU, not other components -- especially the older stuff. Anything with DDR4 is on our prior CPU test methodology kit that we’ve previously shown to be a strong performer.
At 1080p/low, we’re starting to become limited at the 13900K level, with the 13700K occasionally hitting that limit. This would be boosted with an overclock, as we saw earlier. The R7 2700 establishes the floor, at 54 FPS AVG with these settings. To bring attention to a few other older mainstays, users of the R5 3600, R7 3700X, and more modern R5 5600 and 5600X have plenty to gain if running on lower settings or overpowered on the GPU.
X3D CPUs don’t appear to offer as much of an advantage as we’ve seen in other games, with the 7800X3D capping out at 124FPS AVG, leading the 7700X by 15%. The 7950X3D struggles with its usual oddities, despite using the core parking behaviors and the specialized OS setup that we detailed in our review. It’s OK, but not scaling for the price.
For some other comparisons, the R7 5800X3D leads the R5 5600X by 20%. The 13600K leads the 7700X by about 10%, with the 13900K leading the 13600K by about 18% until we start becoming bound on other parts.
Let’s move to more realistic but GPU-limited settings.
1080p/High
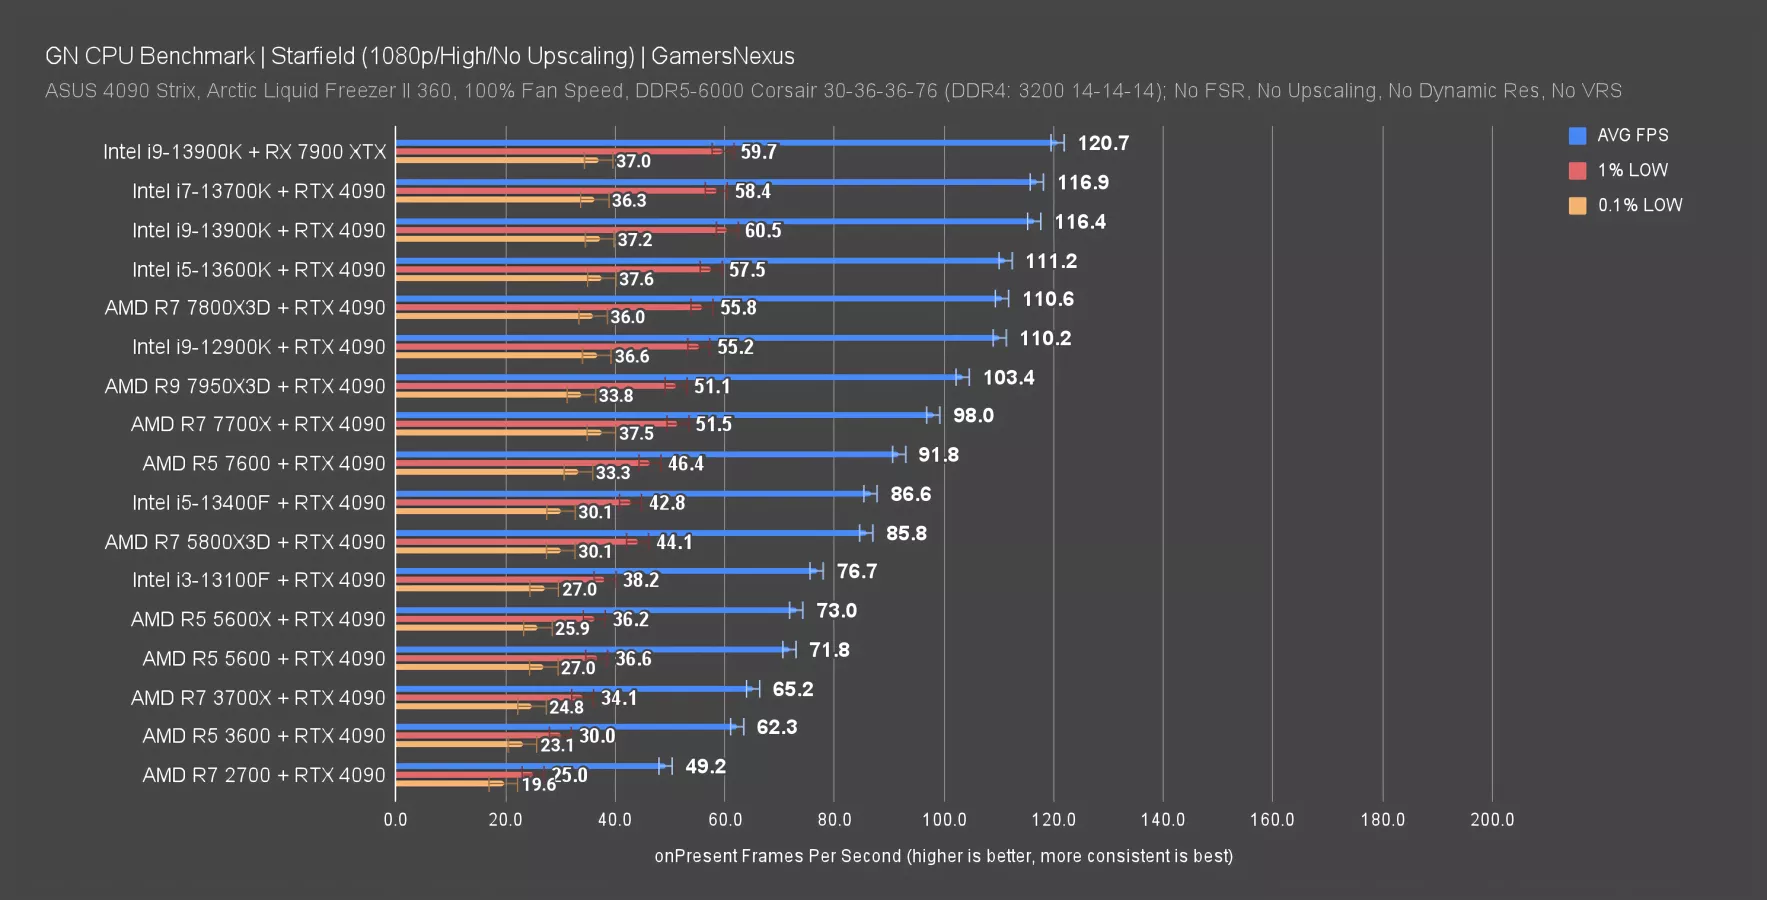
At 1080p/high, we’ve lost about 22FPS AVG off the 13900K’s ceiling and we’ve truncated the 13700K in the process. There’s also a 13900K with a 7900 XTX on here, where we gained about 3.7%. But we used the 4090 for our tests because this is our standard CPU review GPU, and given the general proximity, we still get most of the scaling here while being able to remain consistent for our future CPU test suite.
The 13600K and down have lost some framerate from the average, but overall, we were CPU-bound before and we remain CPU-bound now for those CPUs.
Compared to other modern titles, we’re definitely running at a relatively low framerate for 1080p and no ray tracing. This game is heavy and there probably is a lot of room for optimization both at the driver level and the game or engine levels -- especially since the engine remains a Frankensteined Bethesda monster.
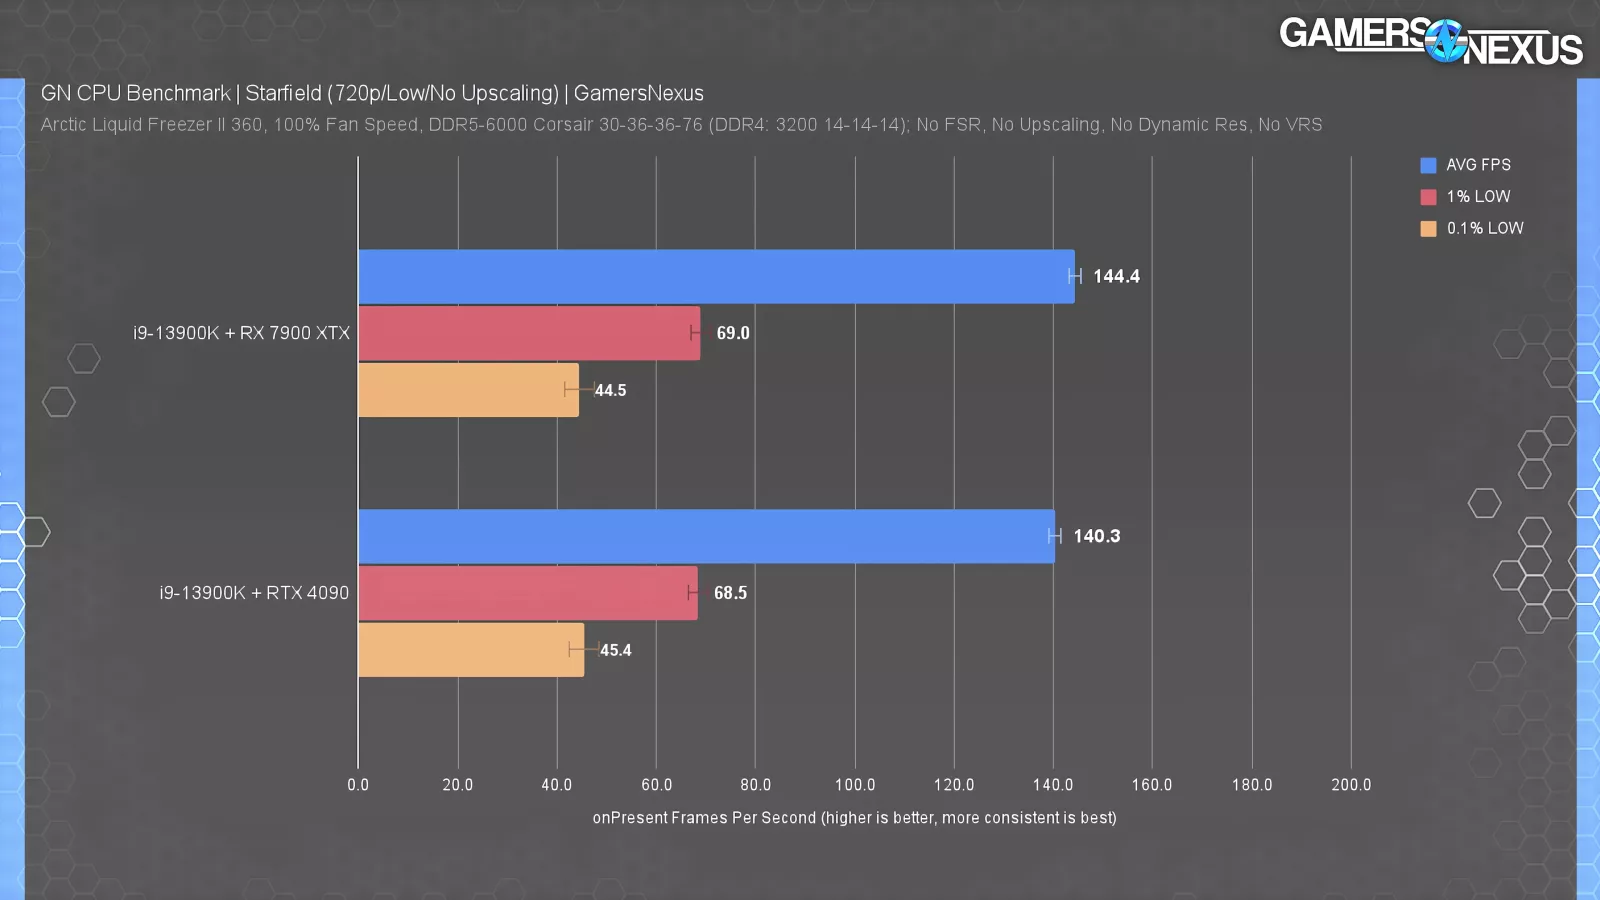
When we did a quick validation test at the beginning of this work, we saw that the 7900 XTX and 4090 were within about 3-4% of each other even at a ridiculous 720p/low. This represents to us that, for purposes of selecting a GPU for a CPU-bound specific set of tests, either is fine. 720p/low is an incredibly low GPU load, obviously, and yet we were at the same framerate. By traditional understanding, this would tell us that the GPUs cannot differentiate themselves because the CPU is dictating the performance ceiling -- that’s useful here, since this is a CPU benchmark. We ultimately stuck with the 4090 because that’s what we use in our standardized CPU reviews.
Starfield CPU Conclusions

Wrapping things up, we learned that at the very top end, you can definitely be clock-bound, which indicates that there are benefits to overclocking.
Starfield, in general, is very GPU heavy. At higher settings like 1440p and above or if you’re using high to ultra settings, you will more likely be GPU bound, but in situations where you are more CPU limited, say if you’re using an R7 2700, 3700X, 12400, 13400, or something like a 13100F, you have some options. In cases where you have an unlocked CPU like the older Ryzen stuff especially, we think if you haven’t yet, it’s a good time to explore overclocking because you can actually get some clock scaling benefit here.
For people considering new purchases, there are a couple of takeaways. We saw on modern architectures that there’s some core count scaling between six core and eight core CPUs. It’s not huge but it exists so there’s some benefit there, particularly on AMD. On Intel, using a 13700K or 13900K, you’re more likely to start bouncing off of a GPU limit because you’re realistically not going to be playing at 1080p low settings, since we imagine you’ll try to push the graphics a little bit more on your system; otherwise your rig would be wildly imbalanced in terms of components. If you intend to play at something like 1080p high or 1440p with reasonable settings, then the 13700K and 13900K will be very similar to each other. The 13600K is also pretty close to them as well in those more graphics-intensive scenarios.