We put a commenter's claim of Intel efficiency to the test -- and the claim didn't hold up.
The Highlights
- We ran Intel and AMD CPUs through efficiency calculations for gaming, power-normalized efficiency tests, FPS-normalized efficiency tests, and more
- AMD outperformed Intel's CPUs in terms of performance per watt almost entirely across the board
- Power constraining the 14700K to around 91W, Intel’s CPU was able to outperform the 7800X3D in Blender, but not Photoshop
Table of Contents
- AutoTOC

“Saying that the 14700K is less efficient is LUDICROUS, unless you are specifically talking about gaming. Im betting a paycheck put both at the same wattage - the 14700K is going to beat the crap out of the 7800X3D in every single workload - it will be both faster and more efficient.” – Greg, a commenter of ours.
That was the tweet we got after we gave the 7800X3D our Best Overall CPU for the year.
Greg here brings up a great point, if a bit defensive, and we’re curious what the results are.
The goal is the scientific approach: We don’t care who wins or loses here. We just want to see what the results are. Today’s tests include gaming power consumption without constraints, efficiency calculations for gaming (not just Blender), power-normalized efficiency tests in some cases, and FPS-normalized efficiency tests with unconstrained power.
Editor's note: This content was originally published as a video on December 19, 2023. It has been adapted into an article unchanged from its original video publication and had its date shifted to populate the front of the website.
Credits
Host, Writing
Steve Burke
Testing
Mike Gaglione
Camera, Video Editing
Vitalii Makhnovets
Camera, Video Editing
Tim Phetdara
Web Editing
Jimmy Thang
Overview, Challenges, & Test Plan
It’s a lot of small one-offs bulked into primarily stock configuration testing. We’ve long said that our biggest weakness in our power testing is a lack of non-all-core workloads, specifically gaming workloads, and so we’re finally resolving that today by using a special PMD interposer from Elmor Labs, which is really cool as a means to look closer at what's happening for power consumption when gaming or working.

Here’s the plan:
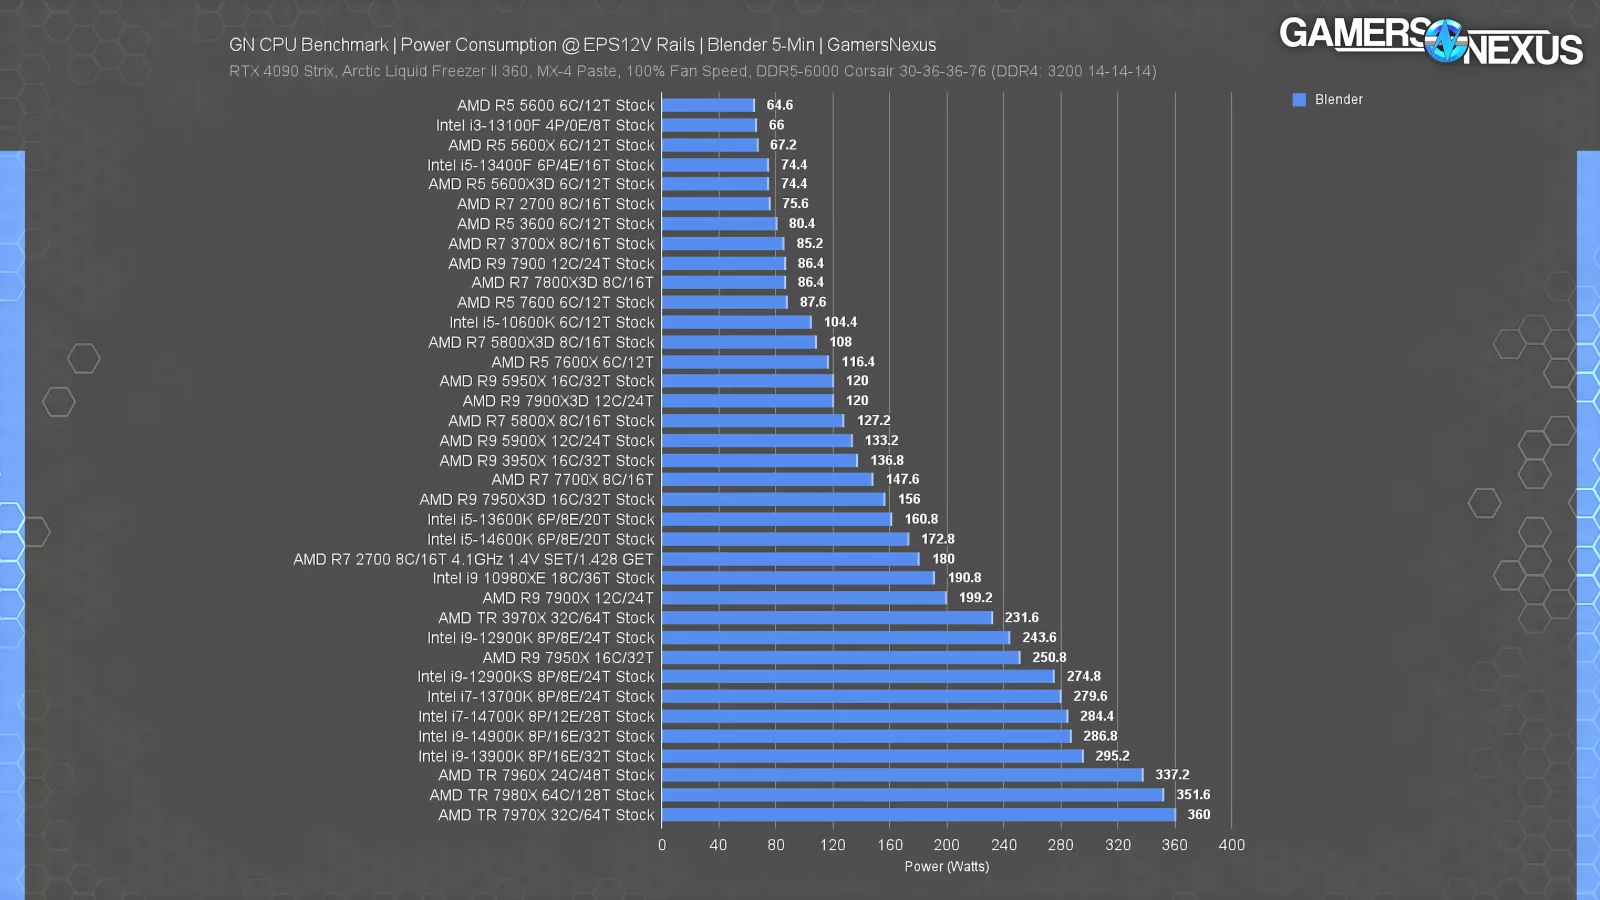
Currently, we produce power consumption charts that look like this:
and power efficiency charts that look like this:
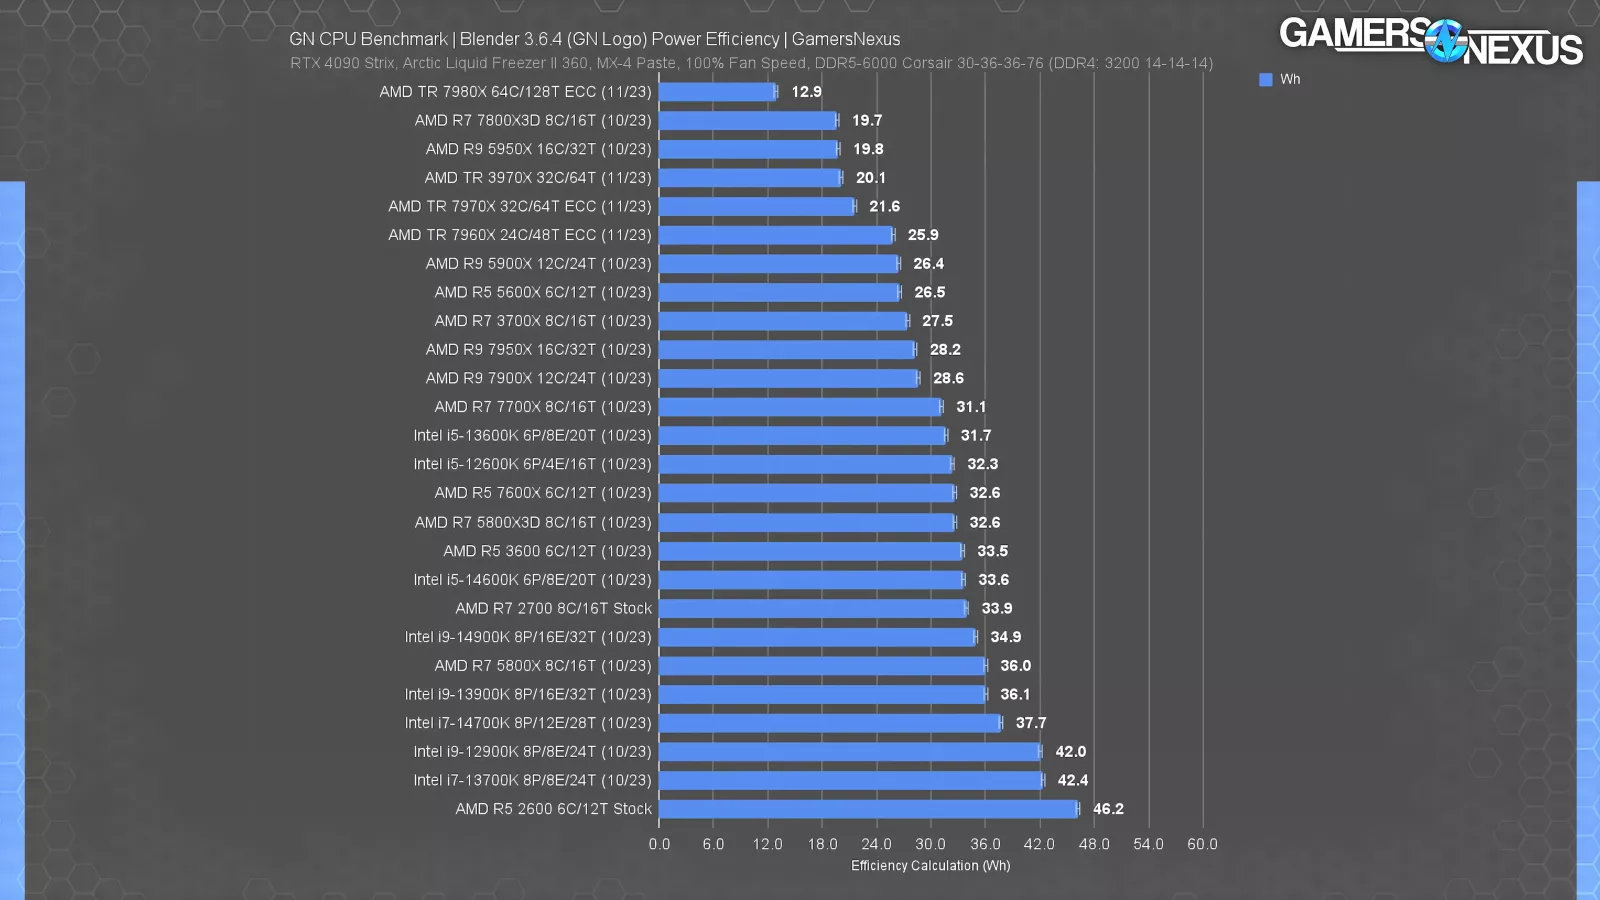
Those give us a baseline, but we’ve long had a big weakness in our testing -- and that’s power consumption in gaming workloads, which tend to be lower (but aren’t always). There are a couple reasons for that gap: First, games are extremely variable, so to even pick a game to be our representative, we need to test a lot of them. Secondly, we needed to develop a repeatable methodology that was more reliable since games can fluctuate heavily even on the same CPU and in the same test, whereas something like Blender will be relatively flat once it starts.
We’ve solved those things, so now we can look at power efficiency and consumption.
Efficiency Metrics
Today’s tests will involve a few different metrics of efficiency:
First, we’ll focus on frames per second per watt (or effectively, frames per joule). This will be done both unrestrained, or “out of box,” and with a few one-off tests that control for FPS or power. In instances where we control for FPS, we’re fixing it to 60 or 144. That produces a fixed unit of work.
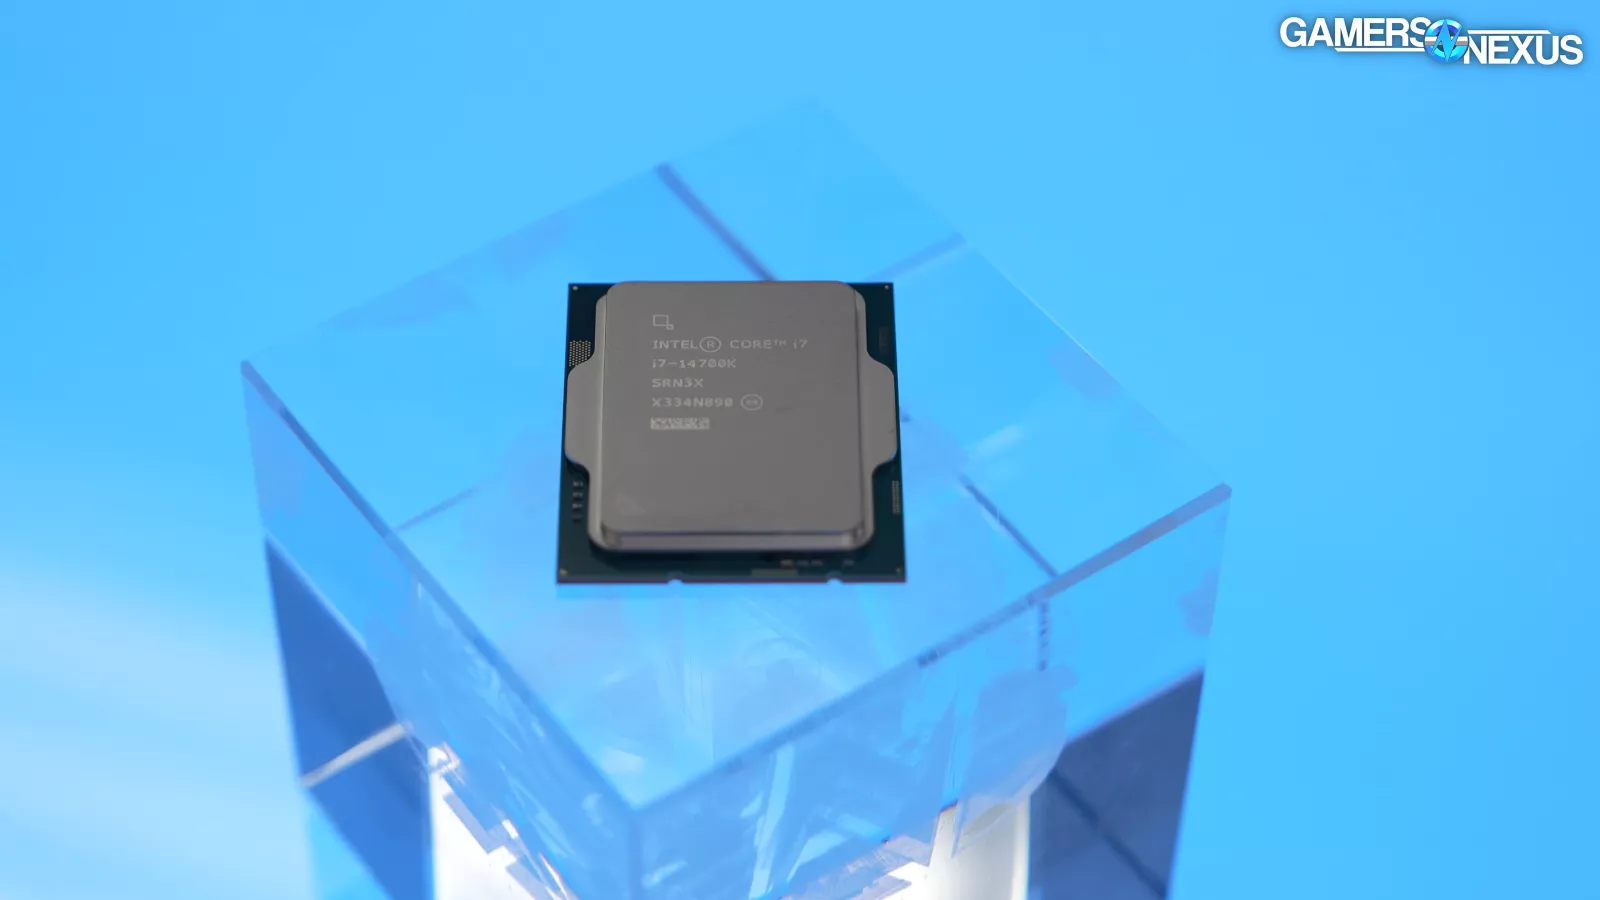
We’ll also provide a Wh chart for Blender, but now with an entry of the 14700K (review here) power-controlled. This increases its render time, but increases its efficiency.
Additionally, we’ll provide a MIPS/W chart for 7-Zip, or millions of instructions per second per Watt -- or again, millions of instructions per joule, basically.
And finally, we’ll be looking at some numbers for the maximum 10-point and 30-point non-consecutive spikes during the entire measurement pass, which includes game and benchmark loading stages. We noticed that loading the game often resulted in higher temporary power consumption than playing it, so we want to provide that as well.
There are a lot of ways this testing could be done, but our main interest is in the out-of-box performance since that’s how CPUs will actually be used in most cases. Almost no one is restricting their 14700K or 14900K to 90W, and if you’re writing a comment right now saying “but I do!” just know that this is a limited use case. So our focus is on stock performance, but just as an academic exercise, we have a couple of those tests.
Let’s get into it.
CPU Gaming Power Efficiency Benchmarks
F1 2023 Tests

F1 2023 FPS Per Watt
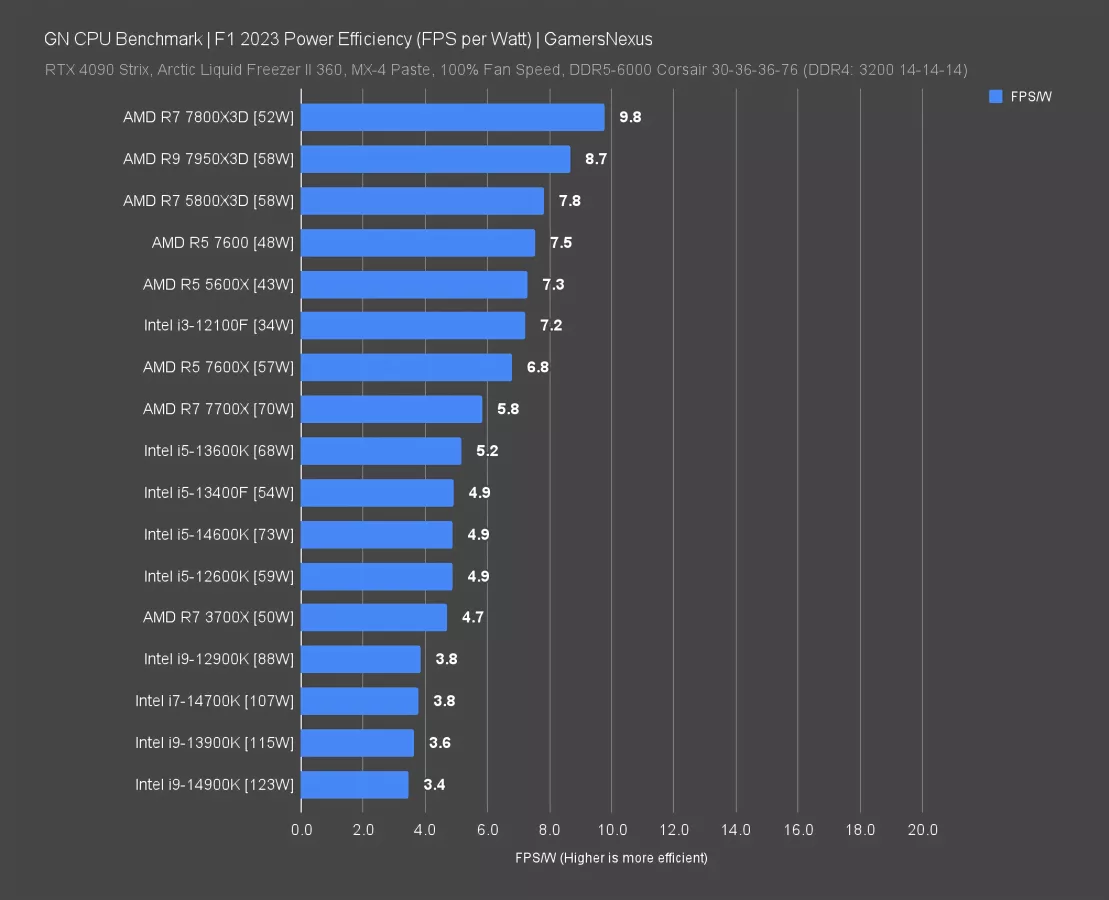
Let’s start with something easy as a reference point. This is F1 2023, which runs in the hundreds of frames per second. The chart shows AVG FPS/watt, with higher meaning better efficiency. The average power consumption is next to the CPU name, rounded to the closest whole number.
The 7800X3D (review here) is unbelievably power efficient here, producing almost 10 frames per second on average per watt of power consumed at the interposer. The total EPS12V power was 52W for the 7800X3D while it spewed about 511FPS on average. The 7950X3D is close by, with the 5800X3D also posting incredibly strong results at almost 8FPS/W. In fact, AMD dominates almost the entire top half of the results, with only Intel’s i3-12100F -- a CPU which we’ve awarded Best Sub-$100 CPU twice now -- ranking alongside AMD’s 5000 and 7000 series choices. The 12100F at 34W was able to run at about 246FPS AVG.
Intel’s best performer, the 14900K, was the least efficient on this chart. Its framerate was 422FPS AVG while its power consumption was about 123W on average. That’s lower than in a 100% workload, but still less efficient than AMD’s competition.
Now, we figured some people might suggest that this isn’t fair because it’s a completely realistic and valid out-of-box scenario, so we also ran this iso FPS -- or with the FPS locked to 144. This is important for a few reasons: First, it makes sure we are neither fully CPU nor GPU bound, but instead are limited by the game engine. Secondly, it forces a like-for-like unit of work as a rate (144 FPS) for direct comparison. Our CPUs are now producing the same work for different power.
F1 2023 Power Efficiency (Locked) FPS Per Watt
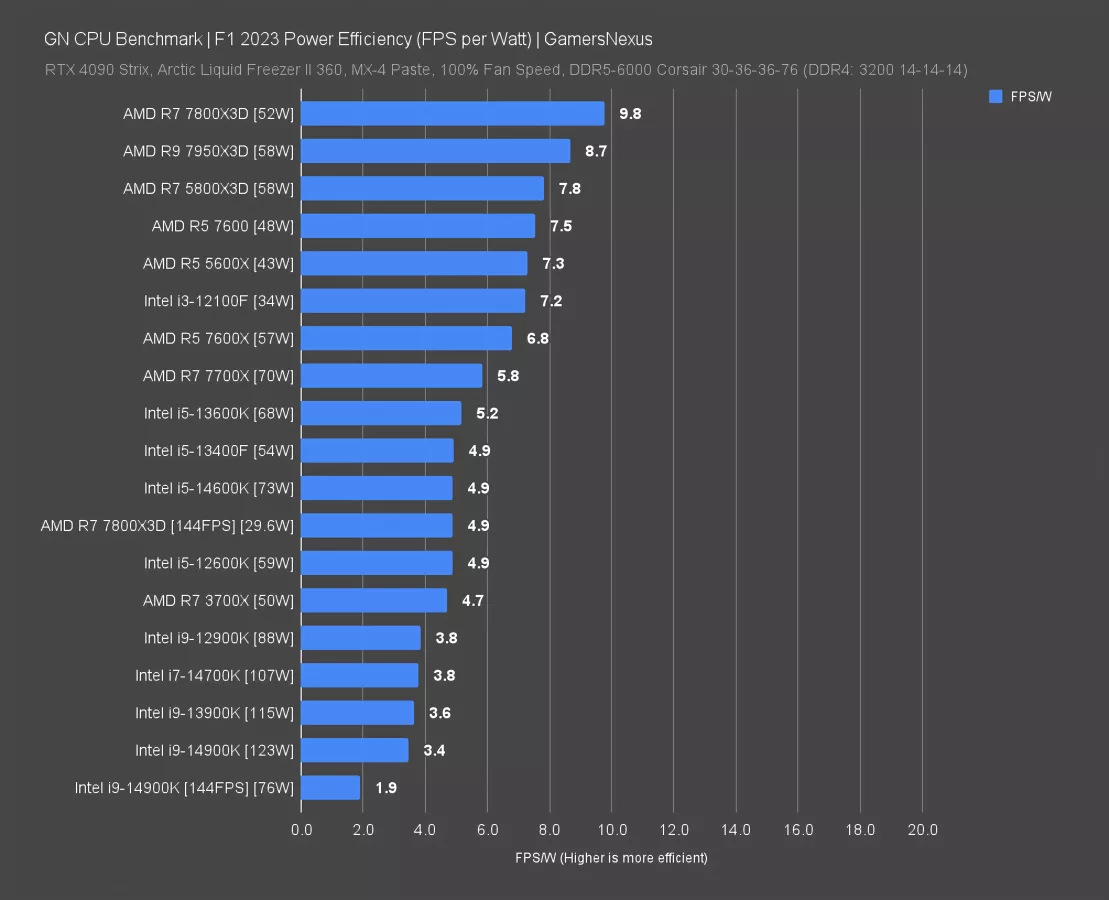
Here it is. It’s the same chart, but with two new entries: The 14900K and 7800X3D both have equalized FPS entries. Both CPUs become less efficient than they were natively. The 7800X3D is now pulling 30W and the Intel CPU is pulling 76W. In terms of FPS/W, that means AMD maintains a significant advantage over Intel’s position.
There’s no more argument that we might be hitting a GPU bind on the better-performing part now. This is also now the same kind of metric as when we measure a single frame rendered in Blender for efficiency: It’s a fixed unit of work.
Part of why AMD’s rating deranked a little bit is because the floor for its IO die is relatively fixed, so we’re approaching power consumption where the baseline required just to sustain operation of the chip is uncuttable, even though core power is reducing. The only thing left to look at would be a power limit on Intel -- we’ll do that soon.
This next one is really interesting.
Cyberpunk: Phantom Liberty
Cyberpunk: Phantom Liberty CPU Power Efficiency Benchmarks
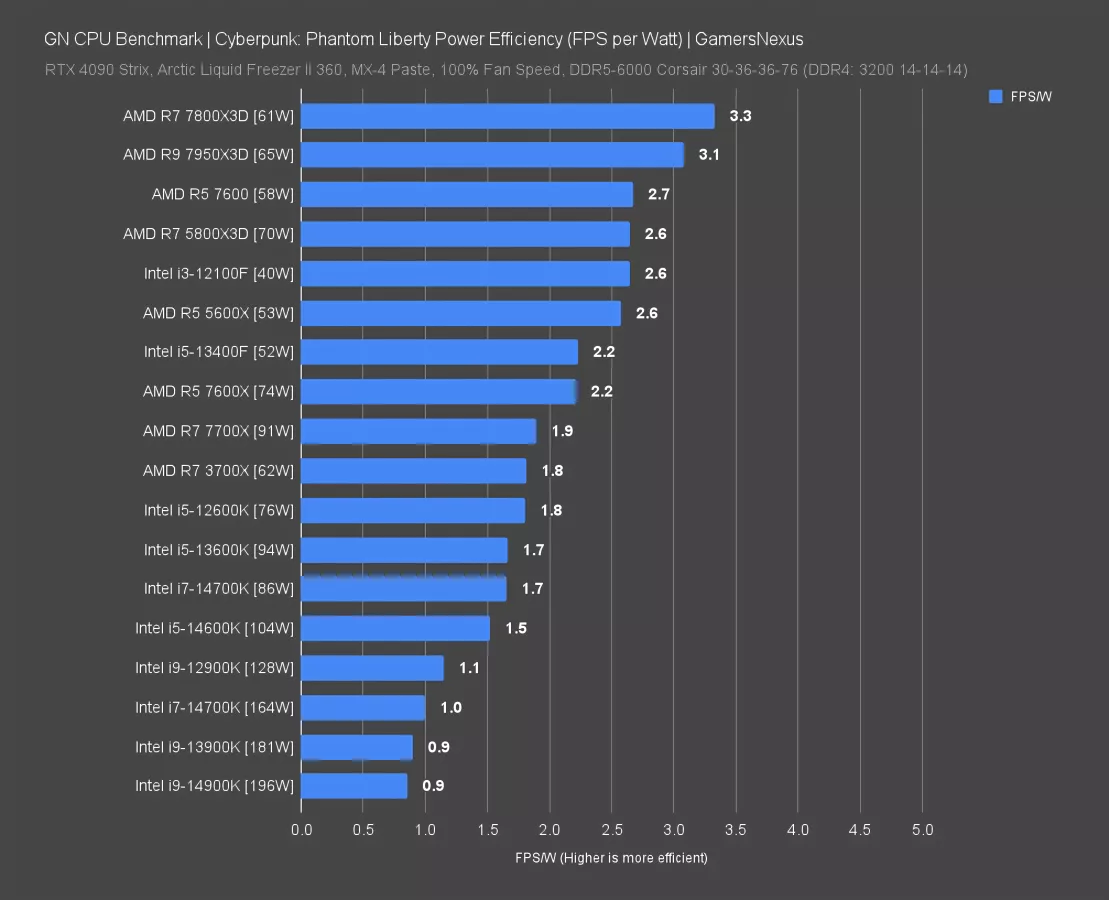
In Cyberpunk: Phantom Liberty, we observed power consumption was much closer to what we saw in Blender. That’s because the CPU load is so heavy in this one. The 14900K was around 200W, so it’s much higher than in F1.
Because of our commenter who asserted that power-locking the 14700K would make it more efficient in all workloads than the AMD parts, we decided to do that in this one. The 14700K at 164W, unlimited, yielded about 1 FPS per Watt. It was nearly 1-to-1. The 86W-limited 14700K ran at 1.7FPS/W, a significant uplift. The raw FPS trade-off was about 22FPS reduced with that change. Intel is definitely way past the efficient part of the V-F curve, but we already knew that.
Unfortunately for Greg and his bet paycheck, the 14700K remains in the lower half of this chart. It is neither faster nor more efficient. Even the 7700X, which is functionally at power parity with the 14700K with its 91W draw and, helping the tweeter out, yielded a 1.9 FPS/W result -- and that’s worse than the 7800X3D. The 7700X is directly comparable in power, and it’s not even AMD’s best gaming part.
The 7800X3D and 7950X3D both broke 3FPS/W in this game, producing phenomenally efficient performance. The 7600 was up there as well, about tied with the 5800X3D and i3-12100F. The i5-13400F also broke into this category.
Cyberpunk: Phantom Liberty Power Efficiency - 14900K / 1440p/Ultra
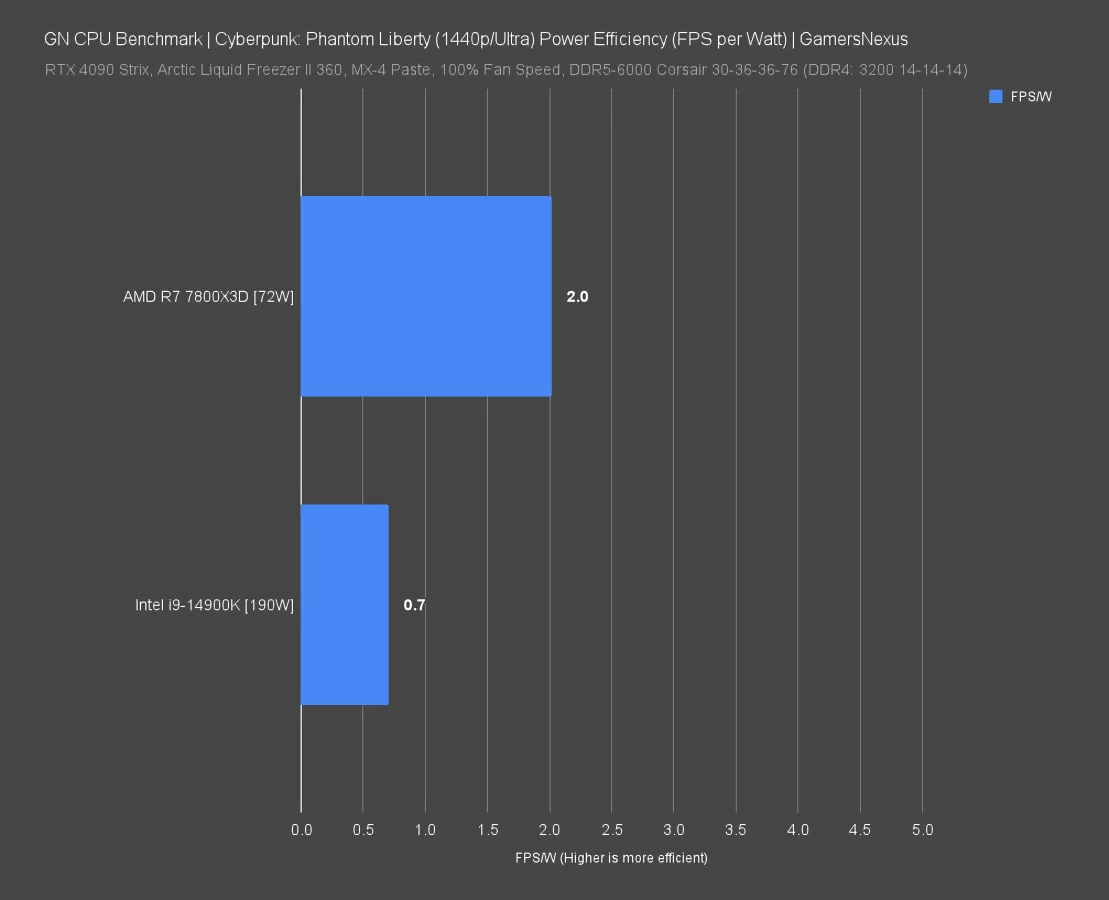
We wanted to be sure we had a heavier GPU load for some additional testing, so we ran Phantom Liberty at 1440p/Ultra. This dropped framerate of both CPUs tested significantly as the GPU began limiting us, which was intentional.
Here, the 14900K still pulled 190W, with the 7800X3D at 72W. The 7800X3D remained the more efficient of the CPUs. Framerate overall has come down, not only because of the CPU, and so it is natural that the FPS/W figure dropped. That’s normal with a settings quality increase and you can’t directly compare these numbers to the prior chart unless you’re comparing graphics efficiency cost, but comparing the two CPUs to each other does show that the hierarchy remains the same.

Starfield CPU Comparison
Starfield - FPS Baseline
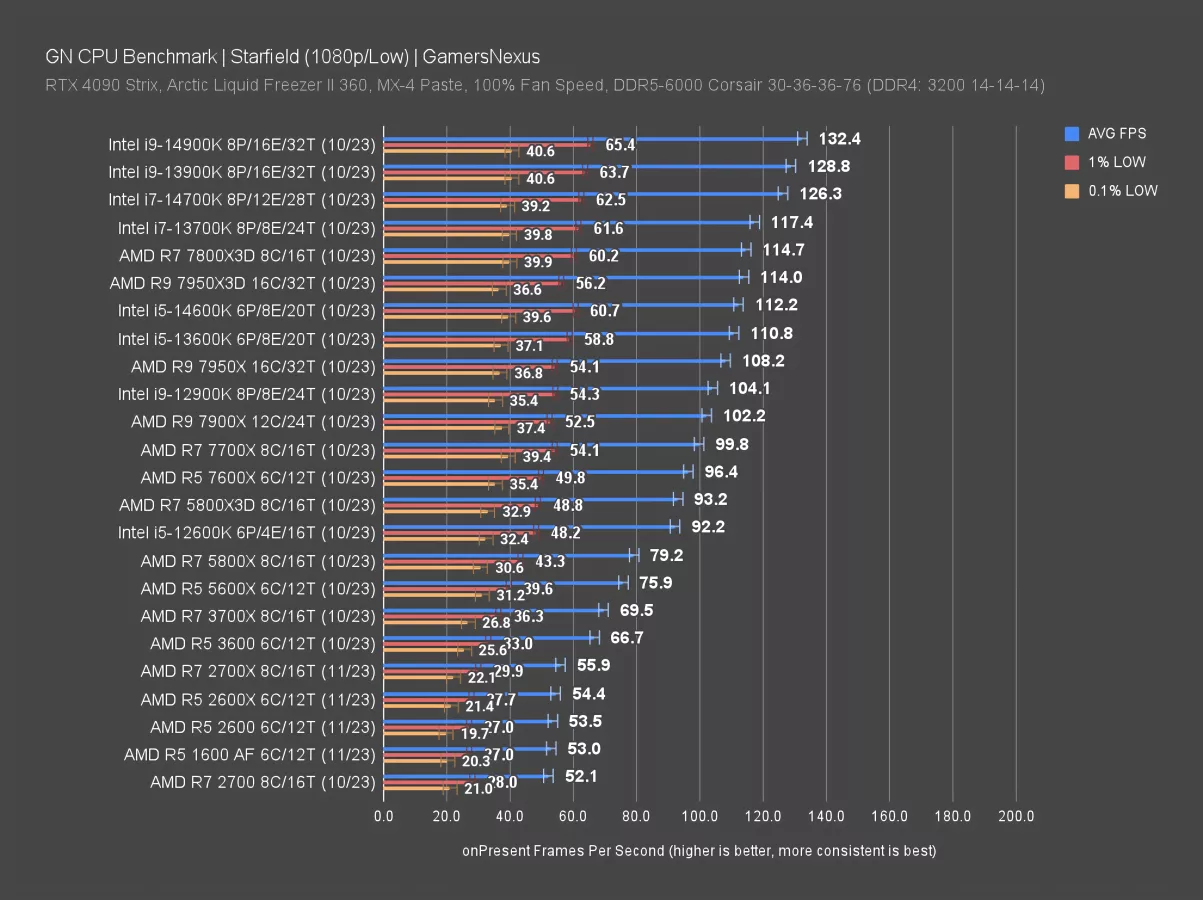
Starfield is an interesting one because Intel leads this chart in framerate, as opposed to AMD’s X3D CPUs. You can see that here: The 14900K ran at about 132FPS AVG, with the 7800X3D at around 115FPS AVG. That should bias the math in Intel’s favor, depending on its power consumption, as it tips the framerate higher to potentially yield a better calculation. Note that this test was conducted before the recent massive patch, but all the data was done on the same game version and so is directly comparable.
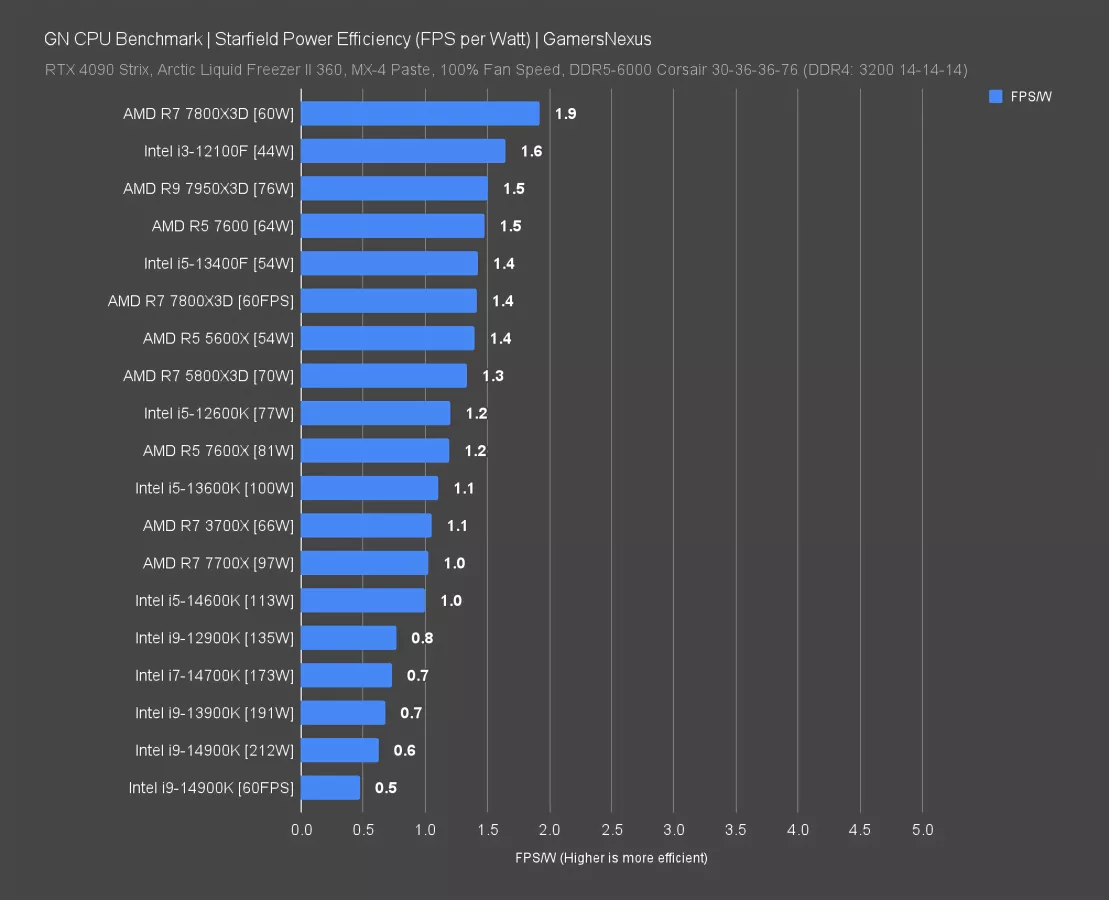
Starfield Power Efficiency (FPS Per Watt)
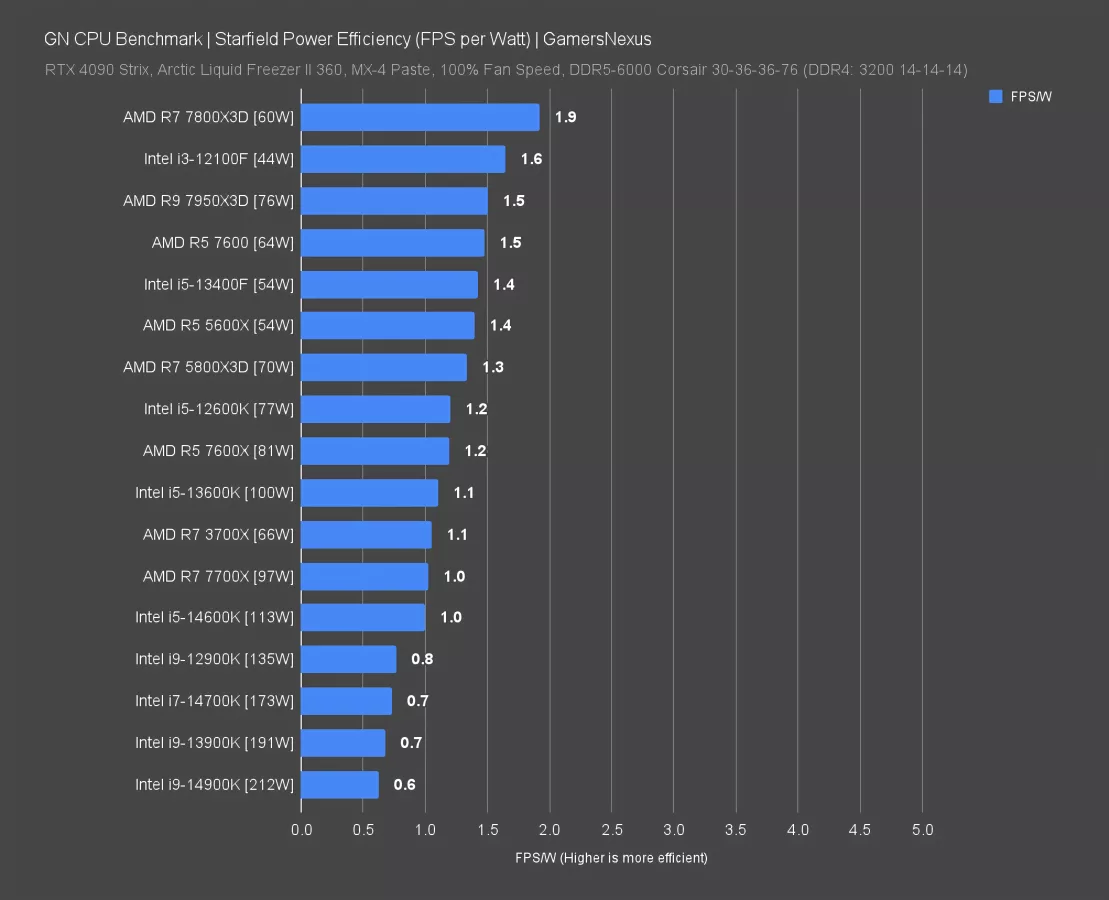
And... nope. That didn’t help. AMD, despite running generally lower framerate in Starfield than Intel, is still miles ahead for efficiency. The 7800X3D crushes it comparatively, with a 1.9FPS/W result. The i3-12100F does excellently here though, so it’s the true benefactor of the favorable Intel performance in this game. The 13400F also makes an appearance alongside AMD’s R5 5600X and R5 7600, so it too is doing well overall and gives hope for Intel’s efficiency.
But it’s the high-end K-SKU CPUs that suffer. The 14900K gets 0.6 frames per watt. We had it at about 212W against the 132FPS AVG. We’ll check on how much of that is a result of the GPU work in a moment, as it’s feasible that a CPU still has to work hard to keep up with a GPU.
As for AMD’s worst performer here, it’s the 7700X. It’s just at a less efficient part of the volt-frequency curve.
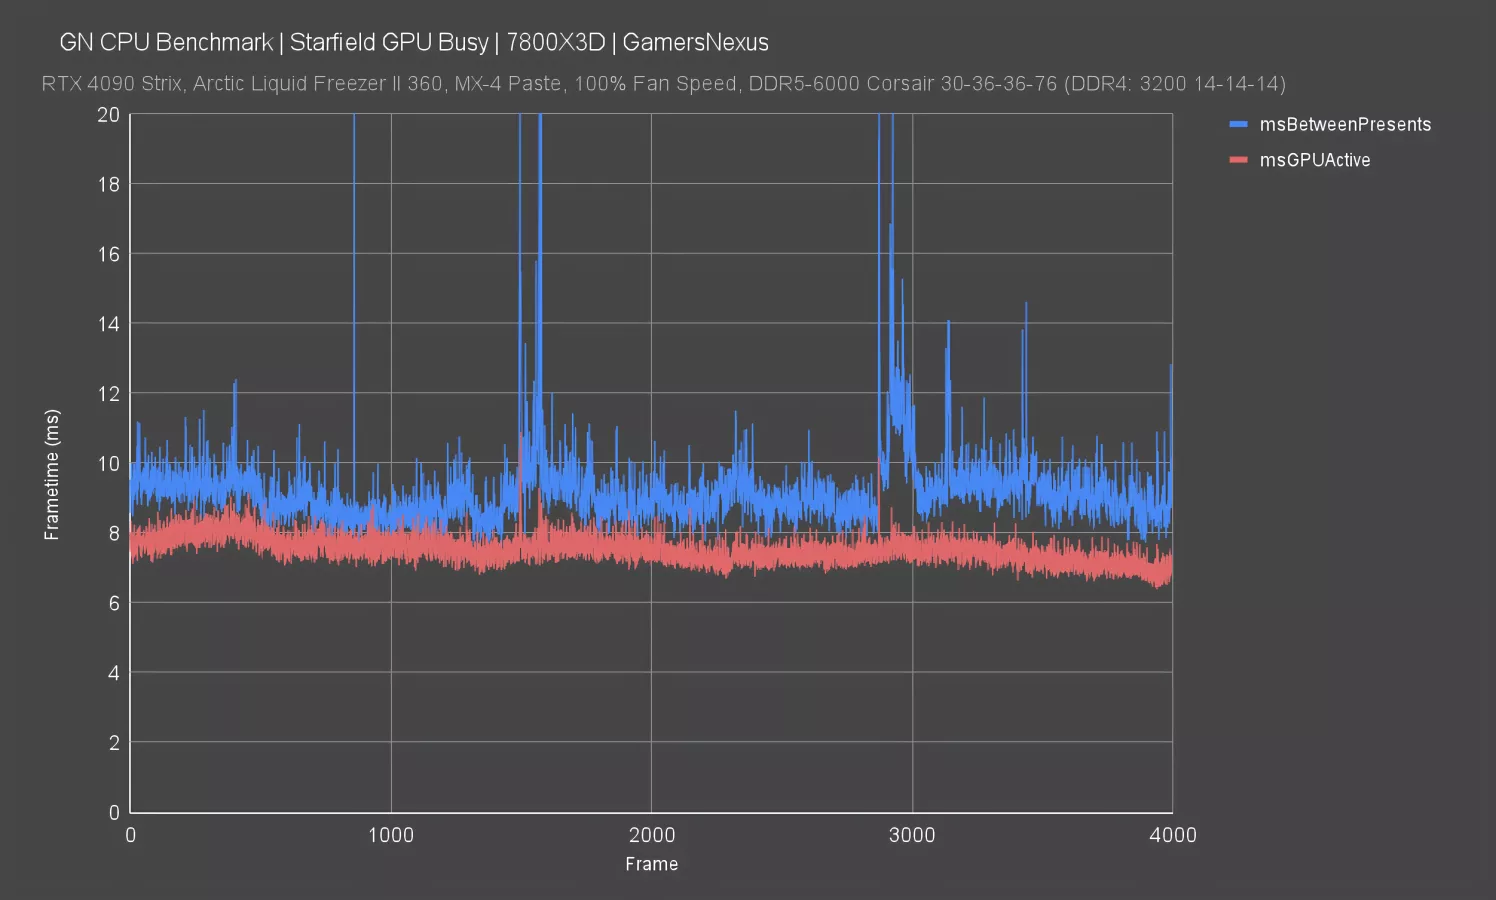
Starfield - GPU Busy
Let’s look at how busy that 14900K was with GPU scheduling. For this chart, we’re looking at GPU Busy, the new metric we’ve been talking about a lot lately. We have a couple videos talking about this in more detail (see here, here, and here), but the basics are that we’re showing you the total frametime from one of the test passes as mapped against the GPU Busy, or GPU Active, time synchronized. The closer they are to parity, the more loaded the GPU is.
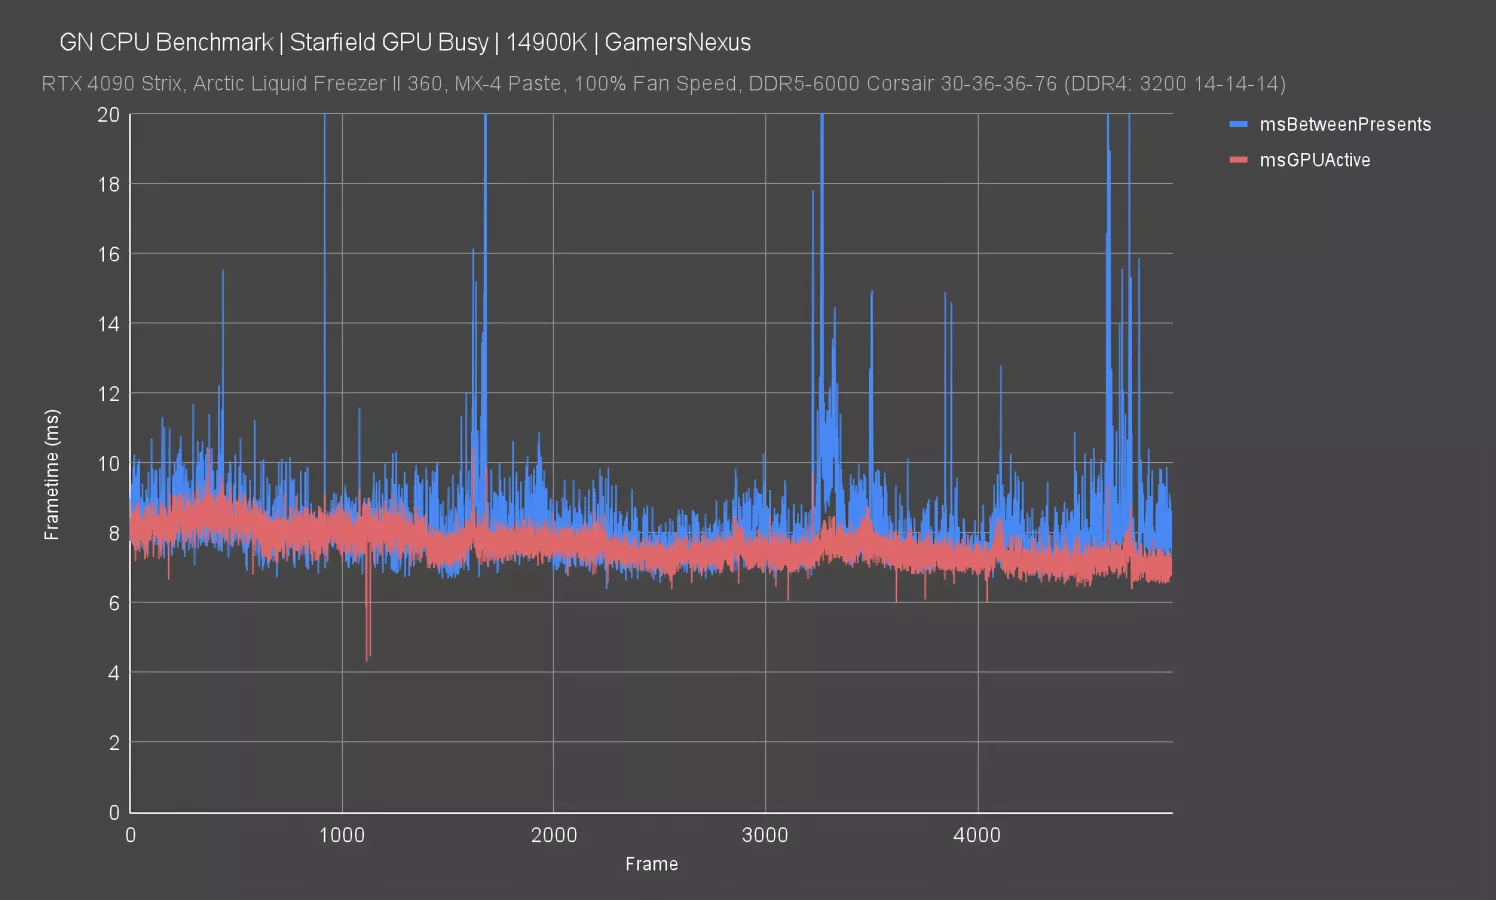
In this one, we can see that Intel is GPU-bound. The GPU is busy almost the entire duration of the frame creation process. That doesn’t mean the CPU is sleeping though -- and clearly it wasn’t, with that power draw -- and so the CPU remains busy and in a power state where it blasts power regardless. That could be because it’s busy tasking the GPU, but AMD in the same GPU-bound state in F1 did not produce this behavior. It could also be that the Windows telemetry that Intel is relying on is encouraging it to continue blasting power.
Here’s a look at AMD’s GPU busy in the same chart. It wasn’t as bound-up for Starfield, although in F1, it was hitting a similar GPU bind despite the lack of this power characteristic.
We can control for this, though. We’ll run the test again, but this time with the 7800X3D and 14900K both restricted to 60FPS.
Starfield Power Efficiency - 60FPS Entry
In this one, the 7800X3D falls from 1.9FPS/W to 1.4, with its new FPS of 60 and its new power of 42.5W. The Intel 14900K scored 0.5FPS/W here, a reduction even from its already bad 0.6 result. That has it at 127W against a 60FPS AVG. To produce the same work and same experience in-game, Intel is drawing about 85W MORE total EPS12V power. We’ve now tested iso FPS and iso power for two different sets of CPUs.
FPS matching produces the same unit of work, so what this tells us is that whether Intel is GPU-bound, CPU-bound, or artificially engine restricted, it is less efficient in these titles.
Baldur’s Gate 3
Baldur’s Gate 3 Power Efficiency (FPS Per Watt)
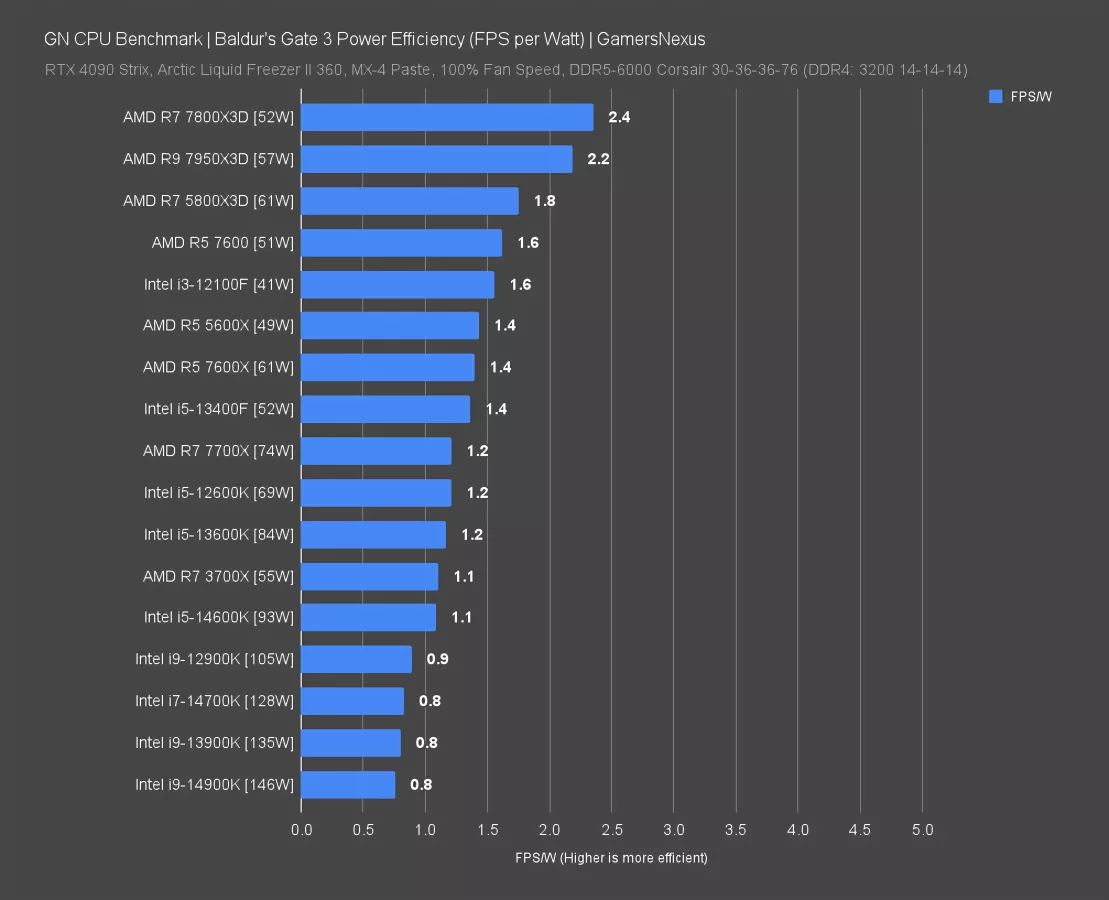
Baldur’s Gate 3 is up next. This one is interesting because it’s much lower power consumption on everything overall. The 7800X3D and 7950X3D were the highest FPS in this game, followed by the 14900K.
Here again, the efficiency advantage goes toward the X3D CPUs -- and that includes the 5800X3D, which isn’t anywhere near a GPU limit. The 14900K also wasn’t at its GPU limit, with the GPU Busy time well below our total frametime, and yet it remains the least efficient on this chart at 146W. The 13900K is alongside it and at 135W. Intel’s most efficient point on the curve is hit with the 12100F, at 41W and a 1.6FPS/W result. The 13400F is next in line for Intel.
Photoshop, 7-Zip, & "Work" Efficiency
Blender Power Efficiency
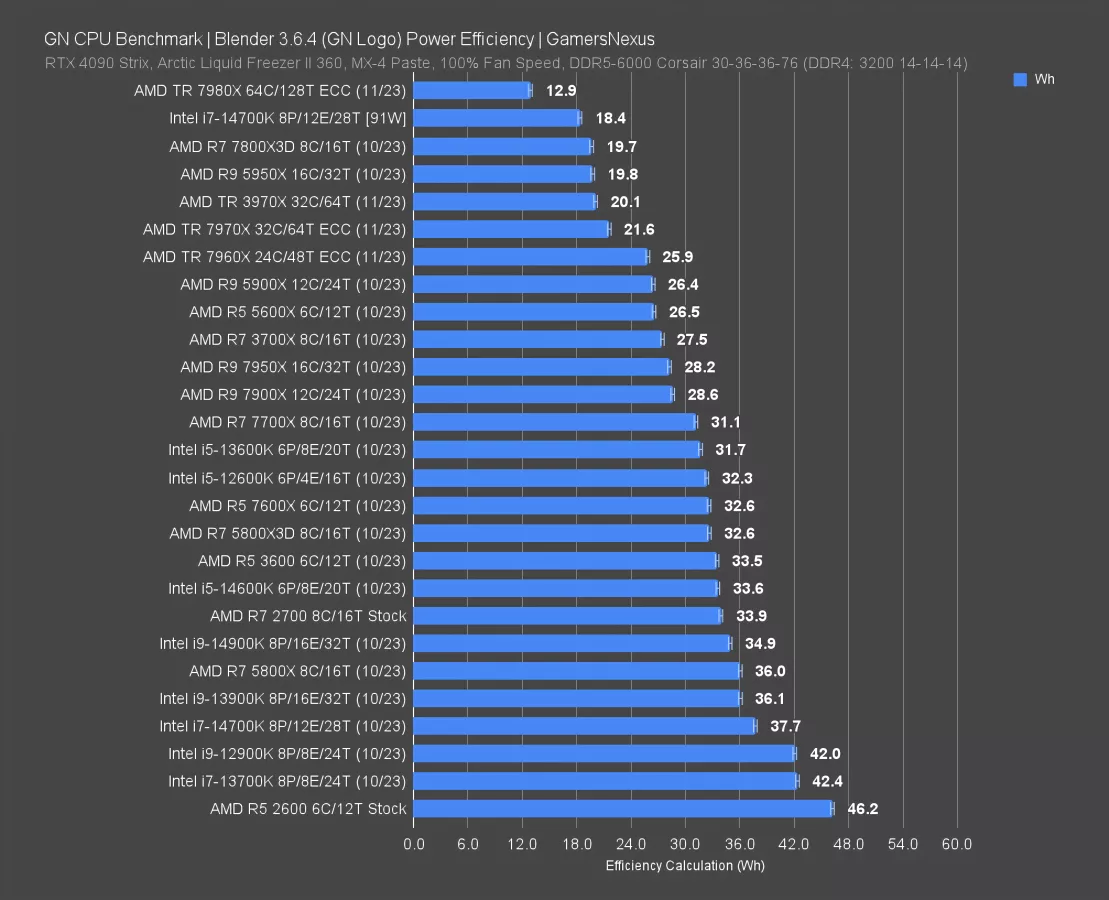
Blender is up now. You all already know this chart, so we’ll keep it short. We ran the 14700K at 86W limiter, which had it at about 91W, and the 14700K finally outperforms the 7800X3D. All we had to do was run it in a configuration most users won’t use. It produced a 12.1-minute render, a massive worsening from the baseline 14700K’s 8-minute render. This definitely slowed the CPU down, but it became more efficient.
7-Zip Power Efficiency
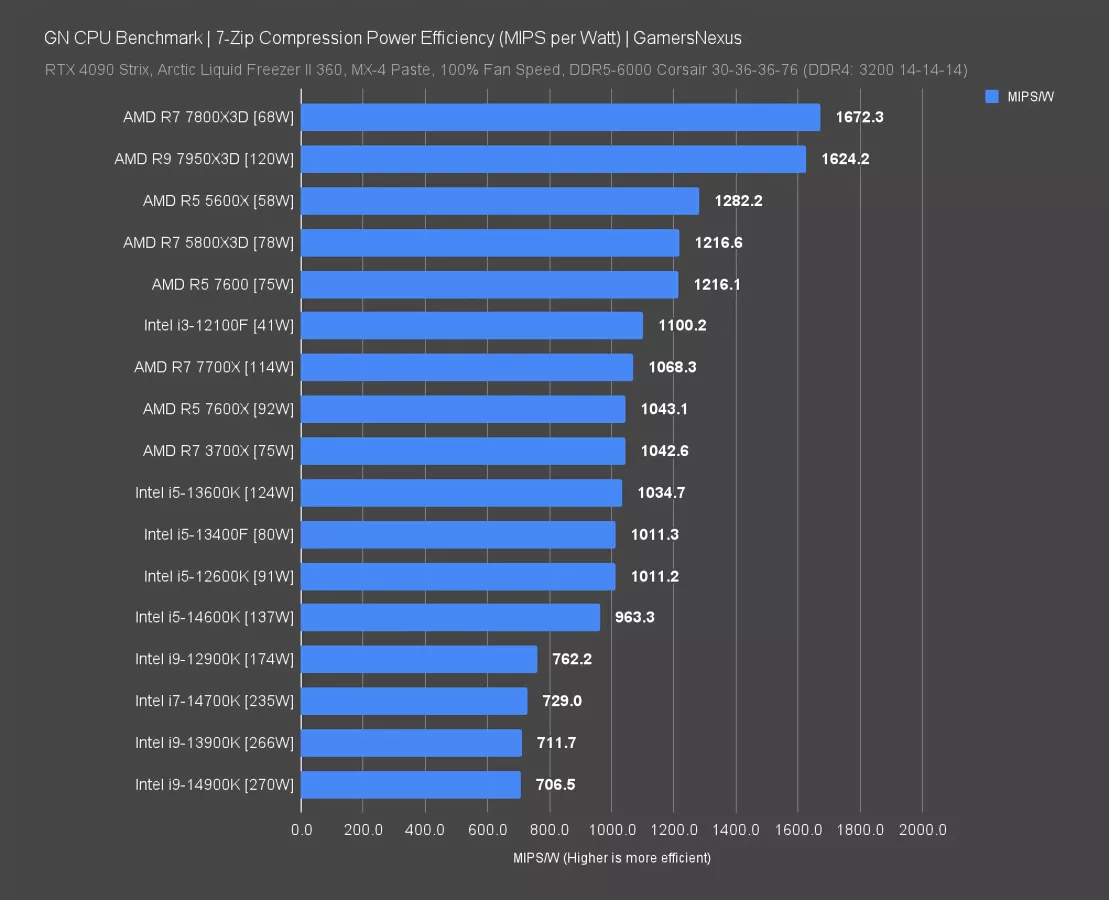
For 7-Zip, we’re looking at the compression performance against power consumption, represented as MIPS per Watt, or millions of instructions per second per watt.
The 7800X3D leads this chart, despite middling performance for the actual compression rate. The 7950X3D follows it. Both of these are generally good bins with low vcore requirements, making them overall efficient here. The 5800X3D is next in order, then the 7600, then the 12100F. Intel’s 14900K performs the worst, at 707 MIPS/W, with the 13900K and 14700K close behind. All 3 of these CPUs are in excess of 200W, with the 14900K approaching the 290-300W figure we saw in Blender when stock.
Photoshop Power Efficiency
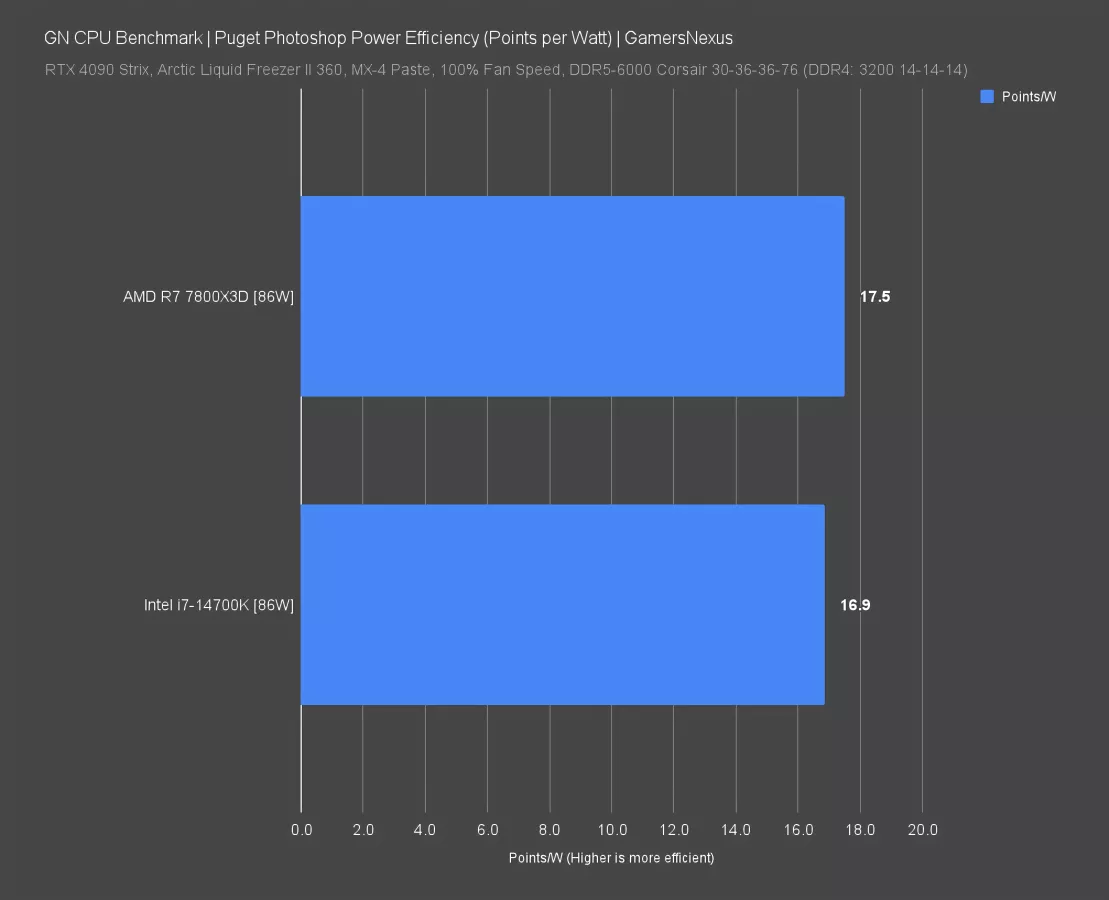
Now for Photoshop. In this one, we only reran the 7800X3D and 14700K for new numbers, but with the 14700K restricted to the same power budget as the 7800X3D. Here, the 7800X3D outperformed the 14700K in overall score, which allowed it to outperform the 14700K in efficiency. Points/W directly correlates to Watt-hours as this is largely a time-based test.
10-pt / 30-pt High Averages
Let’s look at some 10- and 30-point averages. This section pulls the highest 10 seconds and 30 seconds of each test suite to look for spikes. These measure non-consecutive seconds, so it’s primarily averaging out spikes. This doesn’t go deep enough to look at transients.
This also includes the time between and loading the tests, which can spike higher than the time in the game itself (and often does).
Cyberpunk: Phantom Liberty Spikes
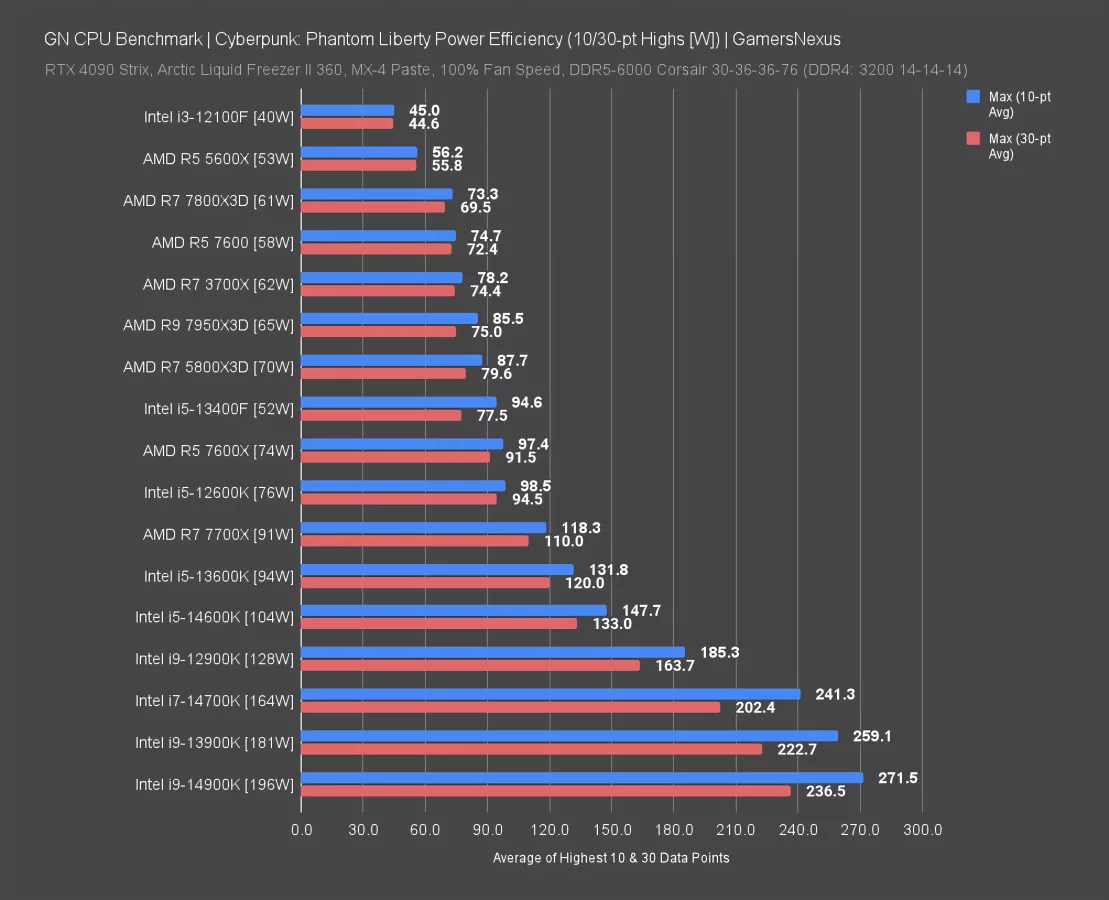
In Phantom Liberty, the 7800X3D’s highest points were 70-73W, running relatively tightly together. The average of 61 is also nearby. The 14900K establishes a much wider gulf with its results: Despite an average during the actual workload of 196W, the load before and after the test loading interval pushed to 272W and 237W for those average peaks.
The 14700K was around 202-241W, also higher than the average. This goes to show that it’s not only an all-core Blender load that’ll push a CPU towards its upper bound, but also every day work like loading applications, changing levels, or pulling assets for a save game.
The 12100F was the lowest overall power draw, which isn’t surprising -- it’s a good CPU for its price class and isn’t that power hungry.
Starfield Power Spikes
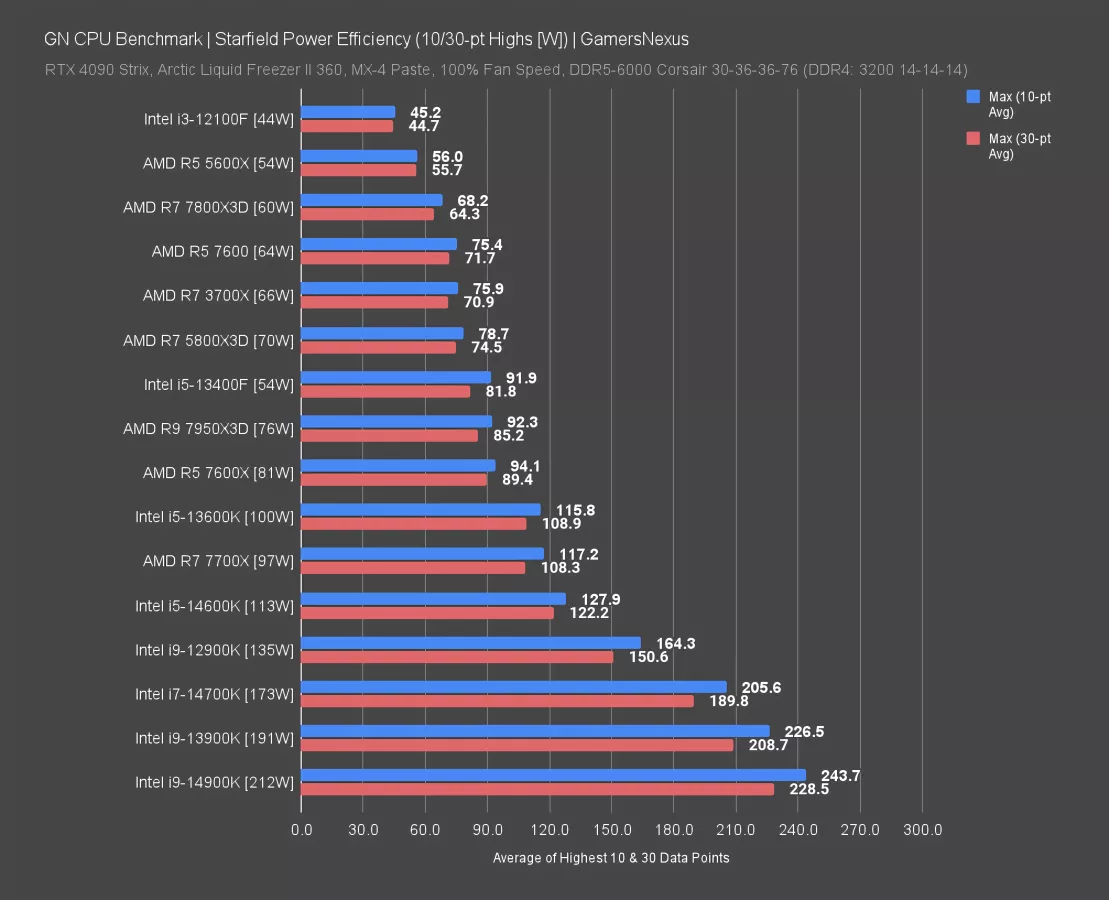
In Starfield, the average peaks were about 68W for the 7800X3D, 79W for the 5800X3D, 206W for the 14700K, and 244W for the 14900K. So again, it’s not as high as the average during actual gameplay (which is shown next to each CPU name), but it’s high during those intermediary periods when we’re loading or preparing the game and benchmarks.
Baldur’s Gate 3 Power Spikes
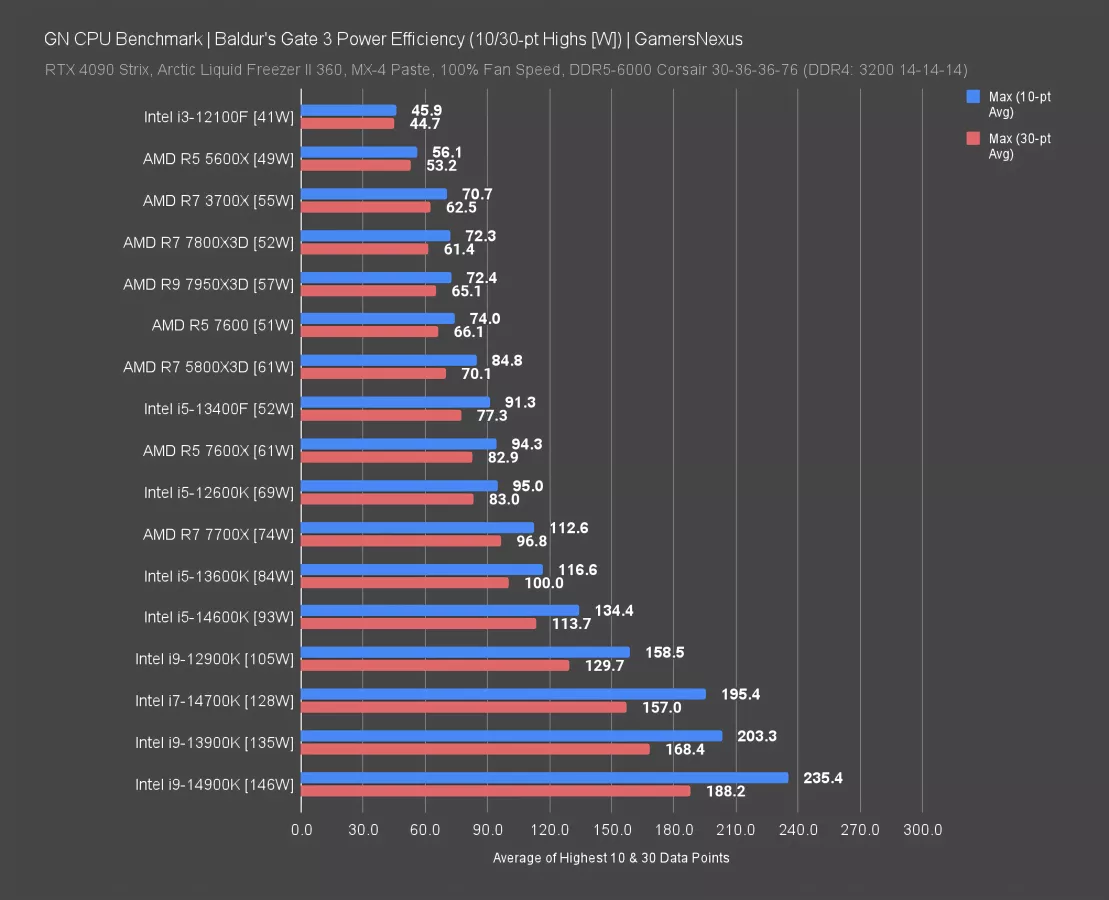
In Baldur’s Gate 3, which was overall a middling game for in-game power consumption despite generally high focus on the CPU, we still saw high spikes in the Intel i7 and i9 categories. The 7800X3D was also a significant percentage higher than the average at 72W. The 14900K was around 235W to its 146W average in-game load power draw.
7-Zip Power Efficiency
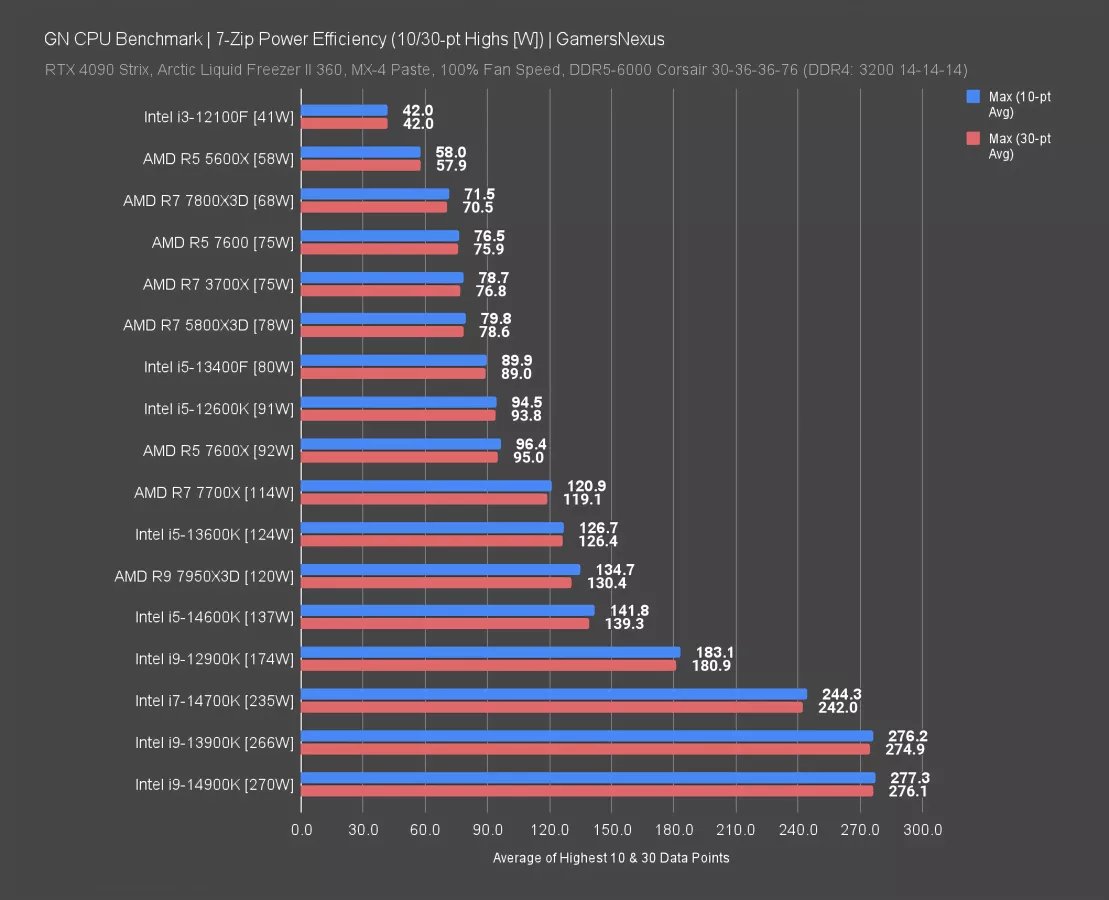
Out of curiosity, we also did this for 7-Zip. We already know Blender is mostly stuck at the max power draw.
Here, the 12100F shows us just how it looks when you’re already close to the max: 41W average against 42W 10- and 30-point non-consecutive highs.
The 14900K was only 7W over its average with this measurement. The 7800X3D was also a couple watts over its average.
Energy Cost
This final section is just to put it all into perspective. Ultimately, how much the efficiency matters is up to you. On a scale of a single person, especially at our electricity cost here of $0.10/kWh, the difference in total energy cost is basically a rounding error. But for people in more expensive areas, or if you ignore cost and just look at global energy consumption impact multiplied across millions of users, it starts to matter more.
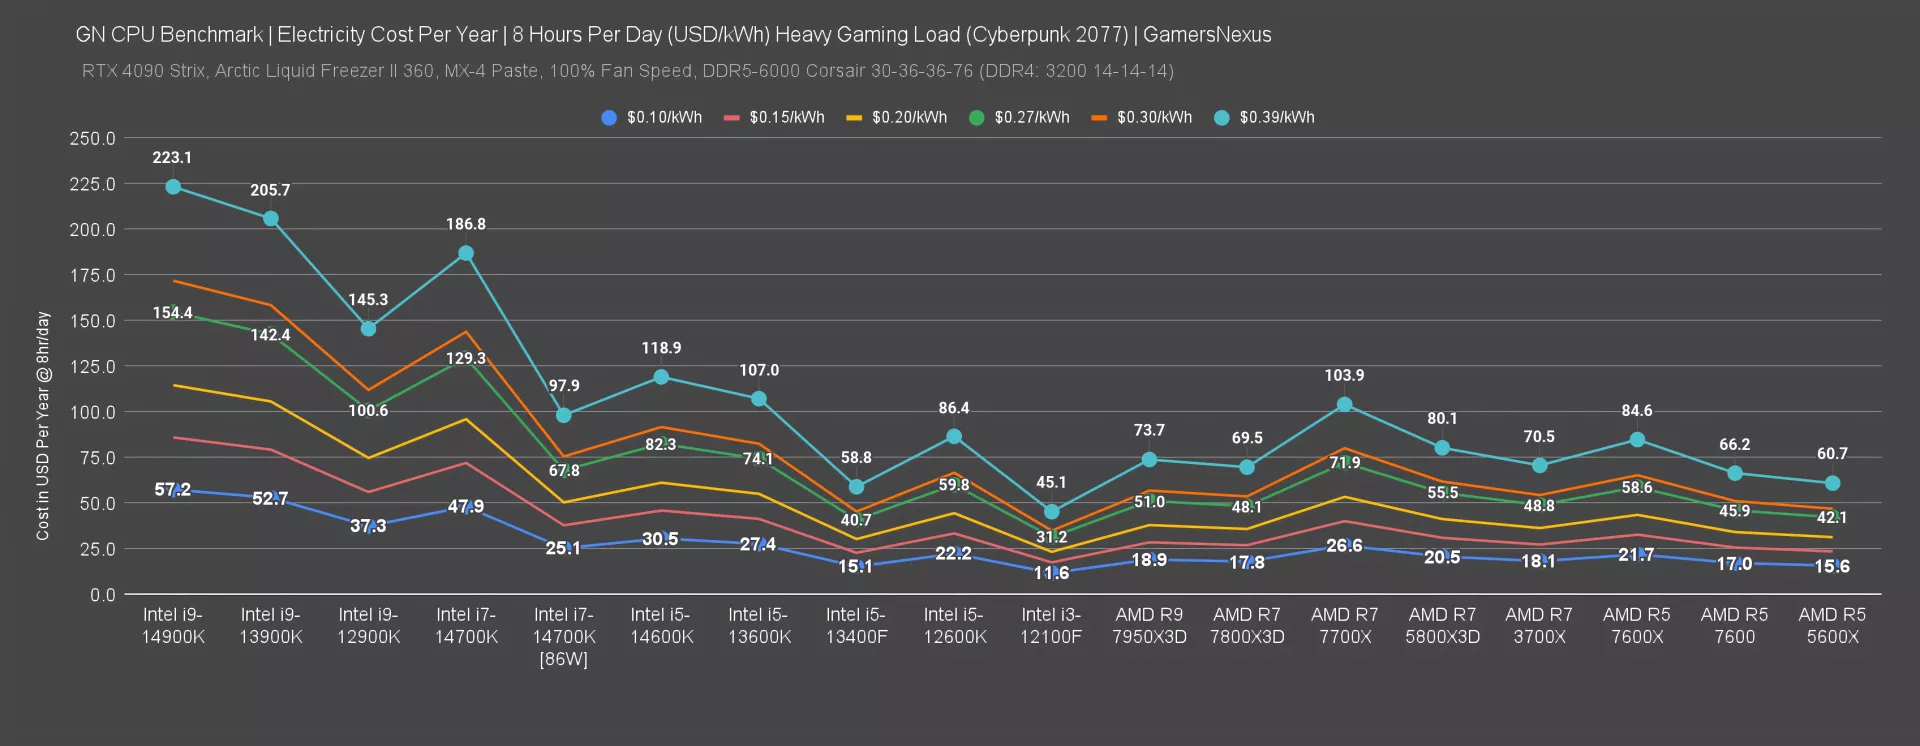
This chart looks at the total cost per year in US dollars, calculated using our total shut-in gaming assumption of 8 hours per day with the heaviest game in our test (Cyberpunk). We used 6 rates that we found across a few online services that aggregate average costs in populous areas.
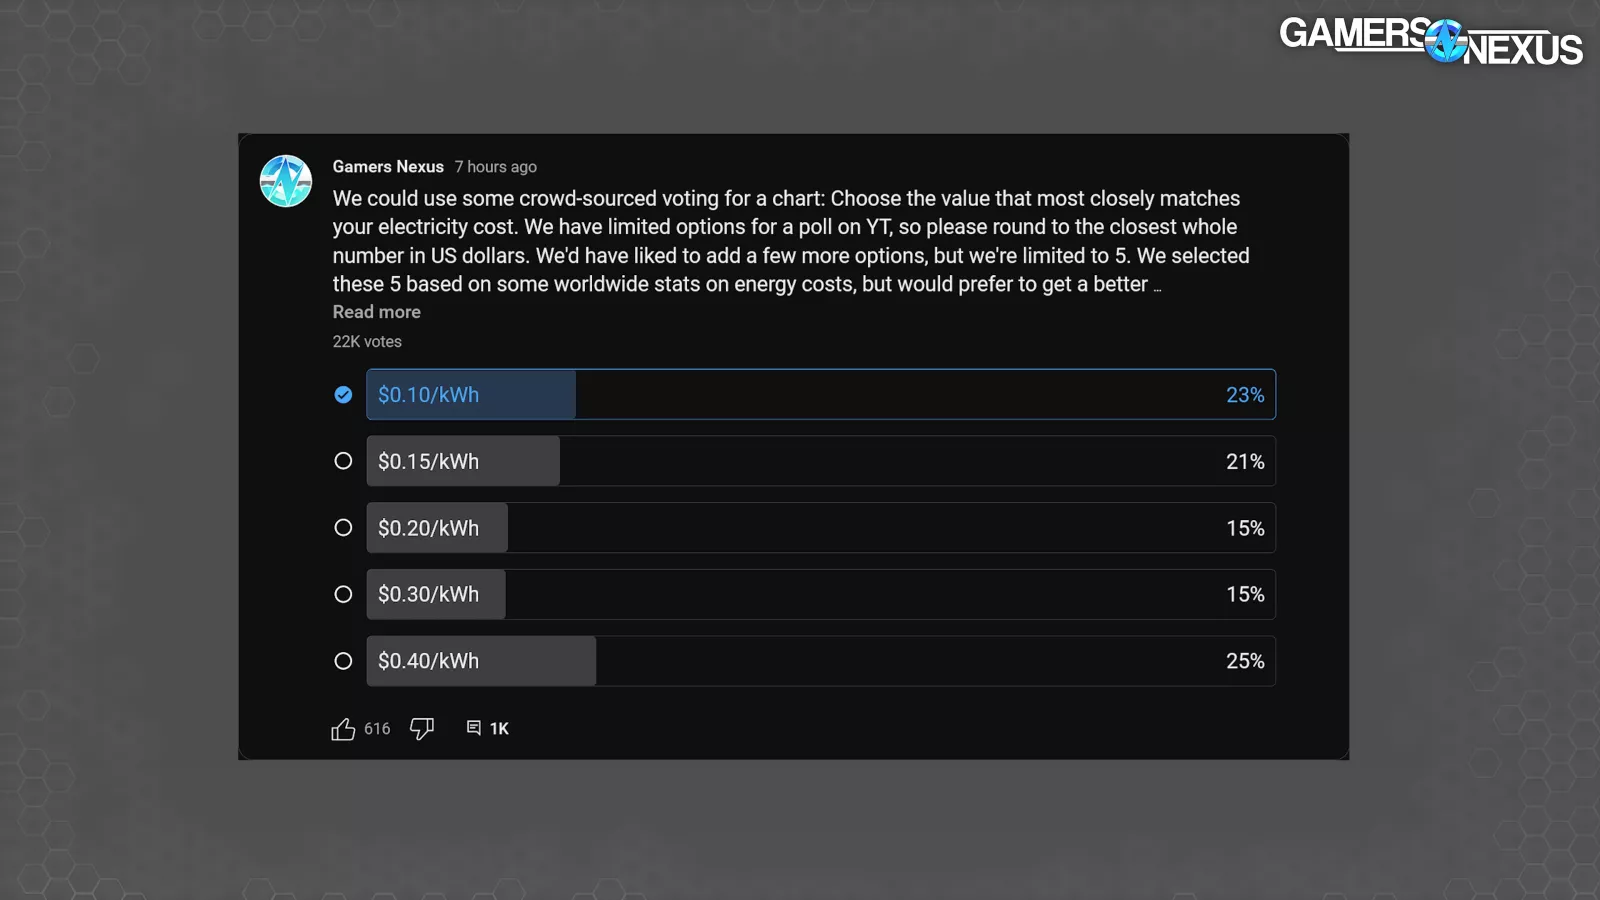
In our recent YouTube community post, some of you told us that you pay $0.45/kWh or more, like in Germany, so obviously the numbers can keep going up. Likewise, anyone with a variable rate should just assume the most likely time to be gaming.
Starting at the extreme of $0.39/kWh, at 8 hours of heavy gaming load per day for 365 days, you’d be at a total cost of $70 for the 7800X3D’s power consumption, or $223 for the 14900K. This is maybe an instance where it could start to matter. Likewise, the 14700K at stock vs. 86W locked is approaching a $100 difference at $0.39/kWh.
Where we live, we’re spoiled by cheap electricity from local nuclear plants. At $0.10/kWh, the annual difference at 8 hours a day would be $30 between the 14700K and 7800X3D. If you assume a more normal utilization of 2 hours per day, that’d be closer to $7.50 per year energy cost difference. The more expensive your electricity and the more you game, the more this might be relevant to you.
We can’t fit every cost on the chart, but you can pull up a kilowatt hour cost calculator and run the numbers on your own. Remember that this is the heaviest gaming load we tested.
CPU Power Comparison Conclusion

In a lot of these scenarios, without any controls, AMD is not only producing better gaming performance in raw framerate, but at a lower power consumption. Since these two are directly related in a formula, that gives AMD an efficiency advantage in games. Even when we lock the power or the FPS, generally speaking, AMD appears to hold an advantage in gaming.
Now, critically, Blender shows the 14700K as gaining an edge when power constrained as opposed to the 7800X3D -- although it also has a performance edge here. But that’s not true in every production benchmark: In Photoshop, AMD pulled ahead.
Unfortunately for Greg, that paycheck's going to have to go because “every single workload” was the qualifying statement there and it was not better in every single workload. Sorry, Greg. You can keep the money or give it to Cat Angels.

Ultimately, we can create as many abstractions and calculations as we want, but it’s tough to argue that Intel is operating overall at a less efficient point in its V-F curve. The CPUs are blasting power to maintain frequency, which is what helps Intel hold a competitive position in gaming right now. Yes, we can modify the Vcore or reduce the power target, but at some point, it’s not fair to do that unless we also start undervolting AMD. It just becomes an arms race. Out of the box, generally speaking, AMD holds an advantage in efficiency. Even only tuning Intel, AMD is still overall competitively positioned or often winning.
This testing was extremely educational though and we think there are a lot more metrics we can derive from it. Likewise, we think this might be something we can begin including long-term in our reviews process. It won’t be this many games, but we’ll probably pick one or two long-term representative titles and use them for these charts in reviews.
We’ll also soon be updating our GN Mega Charts page for power consumption to include some of these metrics, as gaming consumption was one of the main requests (and we think it’s a completely valid and good one) to add to that page. We can look at idle next -- Intel should hold an advantage there since AMD’s IOD has a high baseline, but we’ll need to test that.