Our initial AMD Radeon VII liquid cooling mod was modified after the coverage went live. We ended up switching to a Thermaltake Floe 360 radiator (with different fans) due to uneven contact and manufacturing defects in the Alphacool GPX coldplate. Going with the Asetek cooler worked much better, dropping our thermals significantly and allowing increased overclocking and stock boosting headroom. The new drivers (19.2.3) also fixed most of the overclocking defects we originally found, making it possible to actually progress with this mod.
As an important foreword, note that overclocking with AMD’s drivers must be validated with performance at every step of the way. Configured frequencies are not the same as actual frequencies, so you might type “2030MHz” for core and get, for instance, 1950-2000MHz out. For this reason, and because frequency regularly misreports (e.g. “16000MHz”), it is critical that any overclock be validated with performance. Without validation, some “overclocks” can actually be bringing performance below stock while appearing to be boosted in frequency. This is very important for overclocking Radeon VII properly.
Part 1: Building the Original Version of the Radeon VII Liquid Mod
Final Results
The article continues below the video embed.
Test Methodology
Testing methodology has completely changed from our last GPU reviews, which were probably for the GTX 1070 Ti series cards. Most notably, we have overhauled the host test bench and had updated with new games. Our games selection is a careful one: Time is finite, and having analyzed our previous testing methodologies, we identified shortcomings where we were ultimately wasting time by testing too many games that didn’t provide meaningfully different data from our other tested titles. In order to better optimize our time available and test “smarter” (rather than “more,” which was one of our previous goals), we have selected games based upon the following criteria:
- Game Engine: Most games run on the same group of popular engines. By choosing one game from each major engine (e.g. Unreal Engine), we can ensure that we are representing a wide sweep of games that just use the built-in engine-level optimizations
- API: We have chosen a select group of DirectX 11 and DirectX 12 API integrations, as these are the most prevalent at this time. We will include more Vulkan API testing as more games ship with Vulkan
- Popularity: Is it something people actually play?
- Longevity: Regardless of popularity, how long can we reasonably expect that a game will go without updates? Updating games can hurt comparative data from past tests, which impacts our ability to cross-compare new data and old, as old data may no longer be comparable post-patch
Game graphics settings are defined in their respective charts.
We are also testing most games at all three popular resolutions – at least, we are for the high-end. This includes 4K, 1440p, and 1080p, which allows us to determine GPU scalability across multiple monitor types. More importantly, this allows us to start pinpointing the reason for performance uplift, rather than just saying there is performance uplift. If we know that performance boosts harder at 4K than 1080p, we might be able to call this indicative of a ROPs advantage, for instance. Understanding why performance behaves the way it does is critical for future expansion of our own knowledge, and thus prepares our content for smarter analysis in the future.
For the test bench proper, we are now using the following components:
GPU Test Bench (Sponsored by Corsair)
Component | Courtesy of | |
CPU | GamersNexus | |
GPU | This is what we’re testing! | Often the company that makes the card, but sometimes us (see article) |
Motherboard | ASUS | |
RAM | Corsair | |
PSU | Corsair | |
Cooler | NZXT | |
SSD | Plextor 256-M7VC | GamersNexus |
Power Consumption
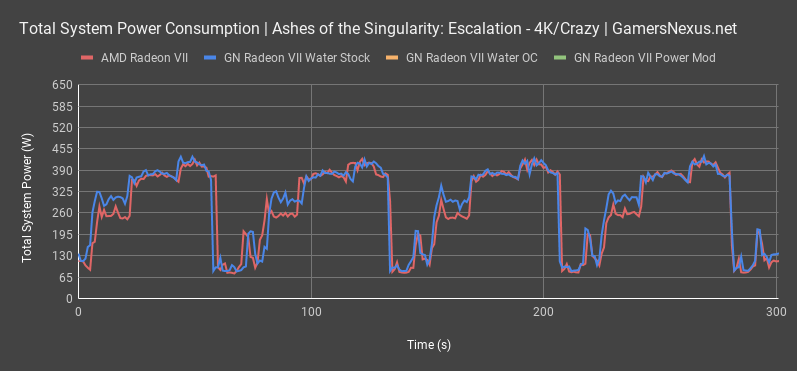
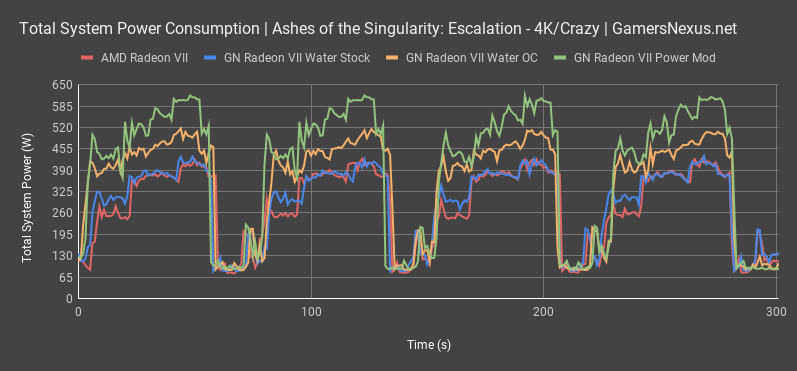
We’ll get to gaming benchmarks posthaste, but power consumption is too fun to put off any longer. Let’s start with plotting total system power consumption of the Radeon VII stock card, unmodified in any way. For our Ashes of the Singularity 4K benchmark, total system power consumption of the stock card is at about 420-430W peak, with the average closer to 390W to 400W. Remember, that’s total system power consumption, but we control the system carefully to ensure only the GPU causes power fluctuations.
Next is to plot the water cooling mod, but still with stock settings. This line would potentially reveal any power drop from reducing power leakage, something we’ve seen in previous liquid cooling mods. In this instance, unfortunately, there’s no meaningful change in power consumption. We don’t get the drop we sometimes get from power leakage reduction. Our next line plot is the overclocked water cooled card, which doesn’t use any powerplay table mods and only overclocks using the normal WattMan procedure. Our settings were technically 2030MHz core and 1200MHz memory, but the actual operating frequency is much lower than this due to misreporting by WattMan. Realistically, we’re more in the highly variable range of 1950MHz to 2000MHz. The result of this configuration is a total system power consumption peaking at 520W and averaging at about 455 to 460W.
The last line is the most impressive: For this one, we’re running a 100% power target and pushing card draw toward the 500W marker. Total system power consumption maxes-out at about 620W, an increase of around 200W over the stock Radeon VII test we first plotted. Performance doesn’t scale linearly with this, naturally, but that doesn’t matter for what we’re doing today. We’re just trying to see how far we can reasonably get Radeon VII, and it starts with this 620W peak total system consumption.
TimeSpy Extreme
We’ll start with TimeSpy Extreme, just because it’s a synthetic workload that heavily loads the GPU and memory independently, so we can get a fuller understanding of the maximum theoretical performance difference. These differences don’t necessarily scale to actual gameplay, but they are typically good indicators just of whether the overclock is even working; remember, with Vega, the biggest challenge is that WattMan might look like it’s accepting frequency overclocks, but the actual stability is worse and performance can decay as a result.
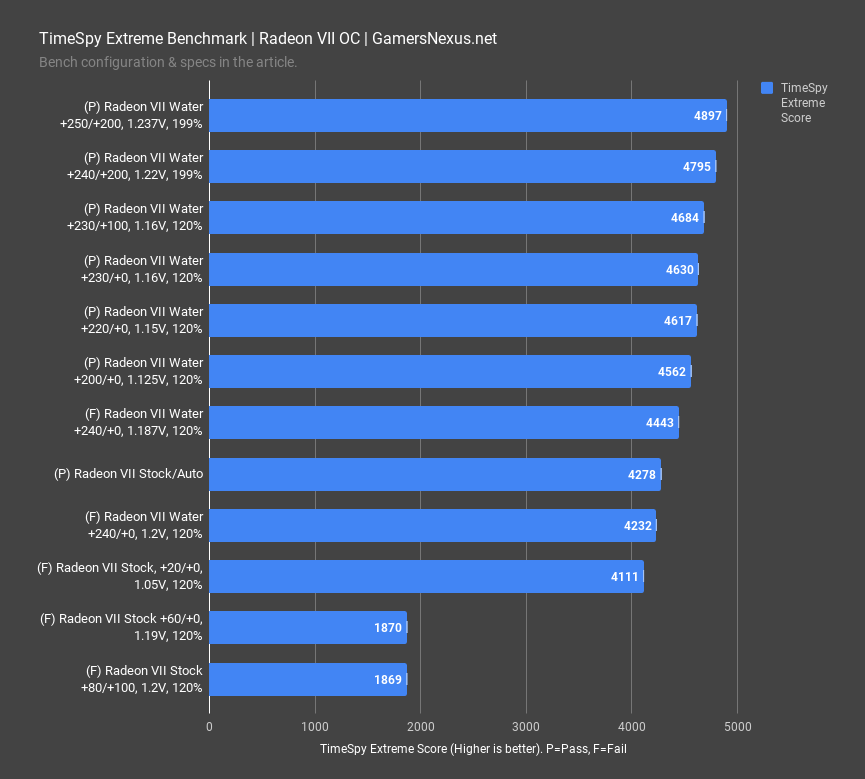
With TimeSpy Extreme, we placed a baseline score of 4278 points under complete auto, full stock cooler conditions. Our overclocking tests with the first driver revision also failed, often causing performance regressions even with small overclocks – you can see that in some of our results that place in the 1800 to 1900 territory; not that these have been resolved with the newest driver, which is why we’re revisiting today.
For the first overclock attempt with the new drivers, we scored 4562 points by operating with a 200MHz offset on our liquid cooled mod, using just a 120% power target and 1.125 GPU voltage. With the clocks set to a 220MHz offset and 1.162V, still using a 1000MHz stock memory frequency and 120% power target, we scored 4617 points. This is an increase over stock of about 8%, which gives you an idea for the upper limits of our liquid cooled Radeon VII before using powerplay table registry mods.
The final result was 4897 points, sparing everyone the slow increases in between, where we set the frequency to a 250MHz offset, voltage to 1.237V – which is over the stock spec and uses powerplay mods – and power target to 100% offset, or 200% total power. The memory was 1200MHz. This result is 15% over the stock performance.
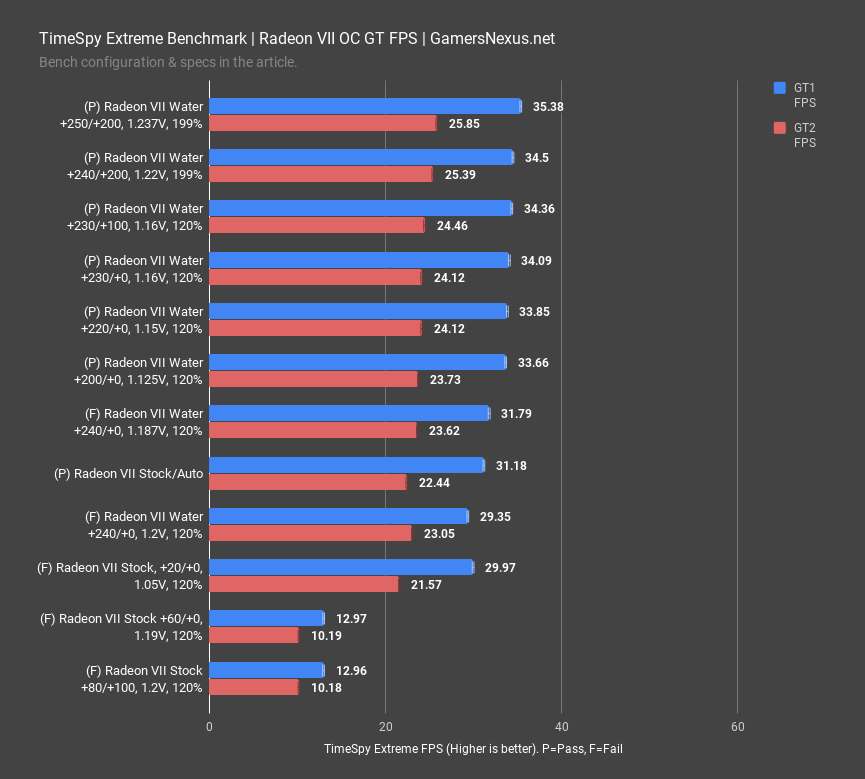
Moving to another TimeSpy chart, we can look at the individualized GT1 and GT2 scores, which helps us better visualize the specific areas of performance uplift. GT2 traditionally gets the biggest gains from memory overclocking, whereas GT1 gains from core overclocks as it better supports the specific workload.
The final overclock allowed for GT scores of 25.85 for GT2 and 35.38 for GT1, measured in FPS, and showing individual gains of 13.5% over the stock 31.18FPS for GT1 and 15.2% for GT2. Although the delta isn’t massive, it is common that we see AMD’s GT2 performance drag more of the weight as memory frequencies increase. AMD needs that memory bandwidth on its higher end GPUs.
Apex Legends
Before plotting thermals and talking about our overclock stepping and challenges in overclocking, it’d be good to get some gaming results presented for those most curious about performance gains and linearity of the overclock.
First up is Apex Legends, which has already demonstrated an uncommon performance advantage for Radeon VII versus the RTX 2080 competitor. We’re starting here because it’s sort of a best-case scenario for Radeon VII, so keep in mind that these won’t extrapolate to all other games.
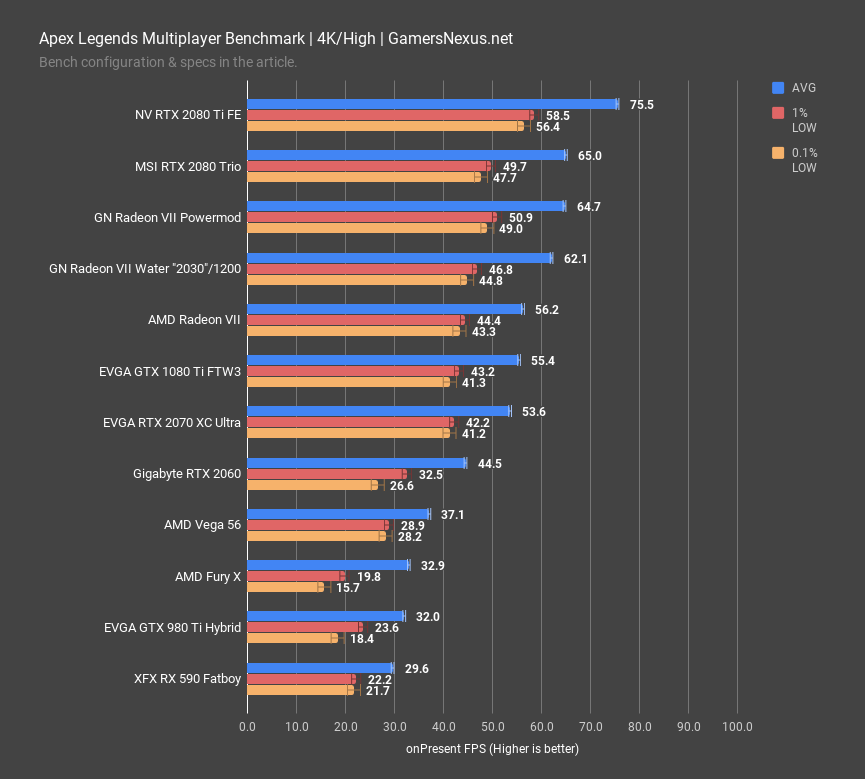
At 4K and with all settings configured to high, using our river village benchmark with relatively high GPU load, the stock Radeon VII card placed at 56FPS AVG with lows at 43FPS and 44FPS. Performance was overall good, functionally tying with the GTX 1080 Ti; there was no meaningful difference between the 1080 Ti and the Radeon VII cards. The RTX 2080 Trio stretched its compute-targeted legs with a 65FPS AVG, leading stock Radeon VII by about 16%.
With a base overclock and a water cooling mod, noting again that the “2030MHz” you see here is just the setting, not the operating frequency, we see a framerate of 62FPS AVG. That’s an uplift of 10.5% over stock Radeon VII performance, and encroaches on stock RTX 2080 territory. Granted, you could overclock the 2080 as well and power would be lower, but this is closing-in in an impressive way.
The Radeon VII powerplay tables mod puts it at 65FPS AVG, giving us a disappointing improvement over the overclocked average performance of 4.2%. In plain terms, in more straight-forward and non-stat-mathy terms, that’s just 2-3FPS – it’s an invisible improvement, in other words, although an improvement nonetheless. The end result is that we tie with the RTX 2080 Trio, which isn’t a bad result, just not as big of an improvement as we’d expect for the power increase.
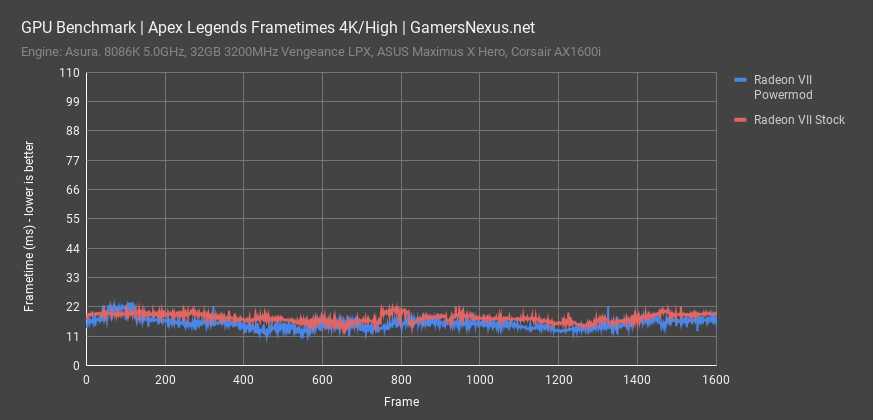
Let’s show a frametime performance plot to better illustrate the frame-to-frame interval differences. In this test, lower frametimes are better, but more consistent are better than lower. Testing is repeated in the same area and test variance is under 1FPS AVG per run, so this is very consistent and accurate as a test pattern.
The Radeon VII stock card ends up averaging closer to 19-20ms per frame, with the frame-to-frame interval deviation never greater than +/-2ms, on average. This is excellent consistency despite slower-than-60FPS framerate. The power mod and liquid cooling get our frametimes down to about 14-17ms on average, depending. Frame-to-frame interval variance does not meaningfully widen, so our overclock is considered stable for this testing.
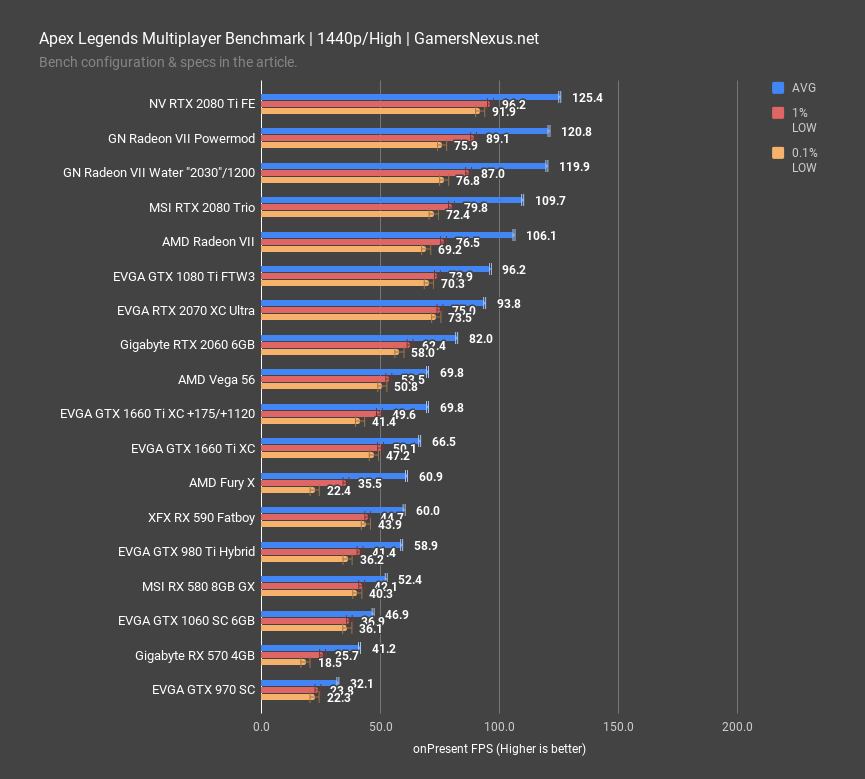
At 1440p for Apex Legends, the Radeon VII stock card ran a baseline framerate of 106FPS AVG, which was significantly outdone by the overclocked variant’s 120FPS AVG. Just like last time, we see about a 13% increase in performance over baseline with the water-cooled OC test, and also like last time, we see very little difference with the powerplay mod. Unfortunately, with this test, the difference was within test variance. There was zero benefit from increased power consumption to the core. We believe this to be a limitation of core frequency, as opposed to the 4K results where we are more memory bandwidth limited as a result of the higher resolution. The differences don’t come out as strongly with a more core-limited scenario; at least, that’s our hypothesis for this one. TimeSpy Extreme’s earlier GT2 results reinforce this belief.
The end result is that the Radeon VII overclock ends up leading the RTX 2080 by about 14%, and is nearly tying the RTX 2080 Ti. Again, you cannot extrapolate this across all games. Unfortunately, some people will see this and tell everyone that Radeon VII is almost as good as the stock 2080 Ti, but that is true only in this instance. We just want to make sure everyone keeps their expectations within check of reality.
Sniper 4
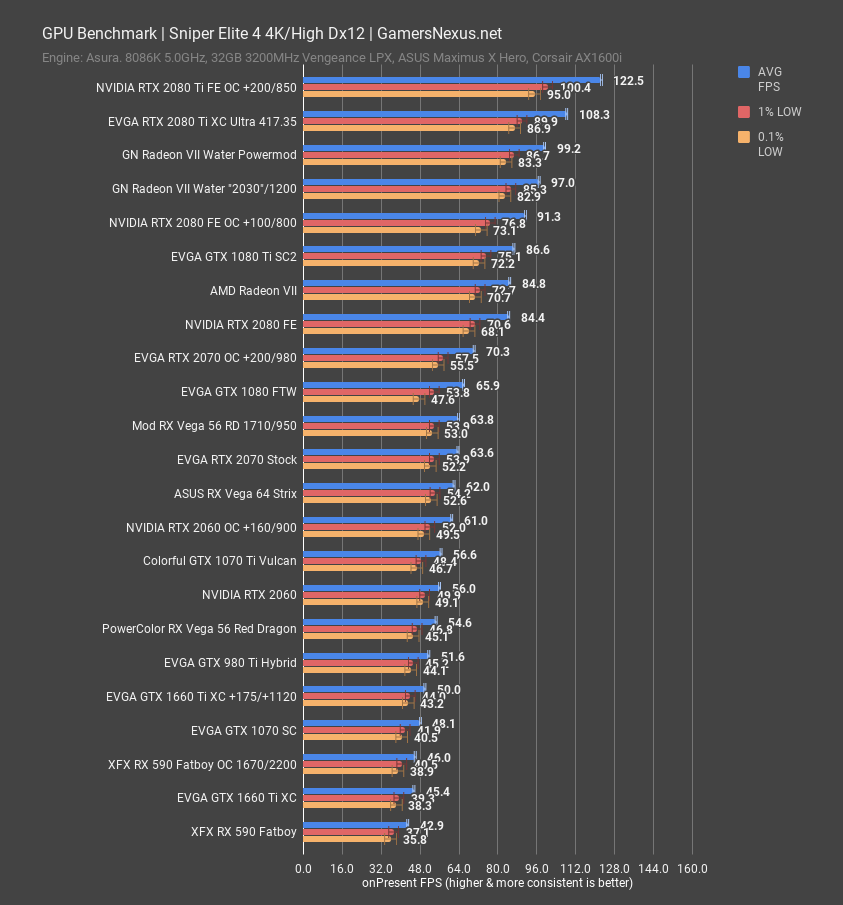
Sniper Elite 4 with High settings and Dx12 gave us stock Radeon VII performance of about 85FPS AVG, with lows well-spaced behind. This positions Radeon VII as about tied with the RTX 2080 FE and just behind the GTX 1080 Ti. Overclocking and water cooling gave a significant uplift to 97FPS AVG, or 14.4% increased in performance, allowing the Radeon VII to outpace the stock 1080 Ti and 2080 FE, though overclocked results obviously reshuffle things again. The powermod only gives us another couple percent increase in performance, disappointingly, so the real story is in the uplift from cooling and a more basic overclock. Either way, the power mod does start to approach 2080 Ti stock performance, but doesn’t quite make it there and is still led by the stock 2080 Ti by about 9%.
GTA V
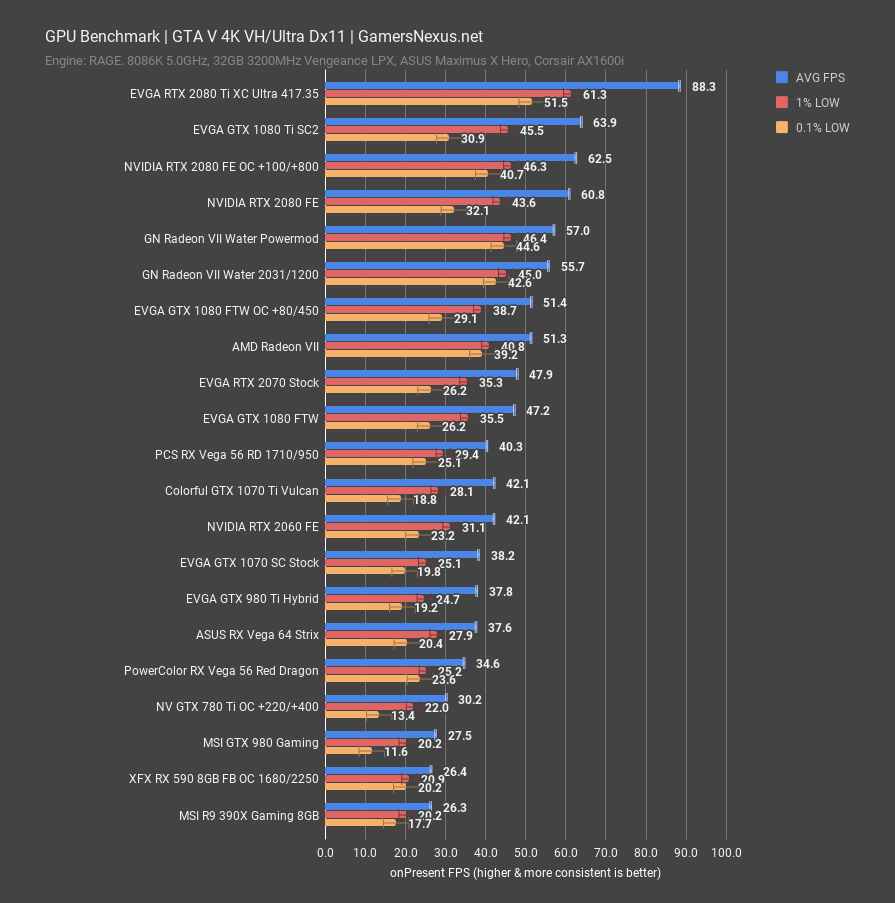
We looked at more compute-intensive games with Apex, although using Dx11, and Sniper, using Dx12, so now it’s time to balance with a more traditionally developed game. GTA V at 4K and very high/ultra settings positions the Radeon VII at 51FPS AVG, with lows at 41 and 39FPS. This ranked it as just ahead of the 2070, only about 7%, while still being $200 more expensive than our tested 2070. The water cooling mod and an overclock improved Radeon VII performance to 56FPS AVG, an increase of about 9%, allowing it to get closer to the 61FPS of the stock RTX 2080 on our charts. Overclocking the 2080 didn’t get it much in this game, either, and only created a few percent gap versus the stock 2080.
The powerplay tables mod allowed Radeon VII to get to 57FPS AVG, showing an improvement consistent with the previous results at about 2-3% uplift. The net change is 11% versus the stock Radeon VII, with performance just under the RTX 2080 FE when the VII is pushed to our powerplay mod limits. It’s a very far distance from the stock 2080 Ti, which leads the Radeon VII powerplay mod by 55%. That’s a pretty hard counter to our previous two charts.
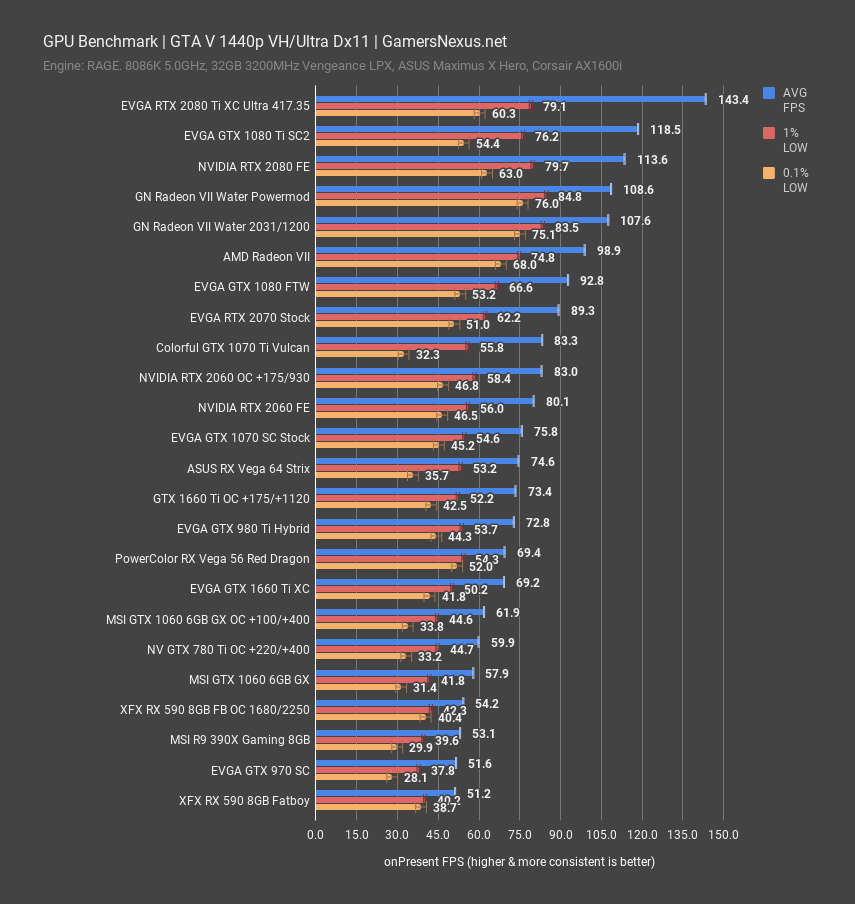
At 1440p, GTA V shows the stock Radeon VII at 99FPS AVG, leading the GTX 1080 FTW by about 6.6%. The overclocked and water-cooled Radeon VII places at 107.6FPS AVG, improving over stock performance by 9% again, with the powerplay mod showing similarly poor gains as seen in the Apex Legends 1440p benchmark. We think that most of the performance gains may be, once again, more resultant of the memory increase than the flimsy and unpredictable core increases.
F1 2018
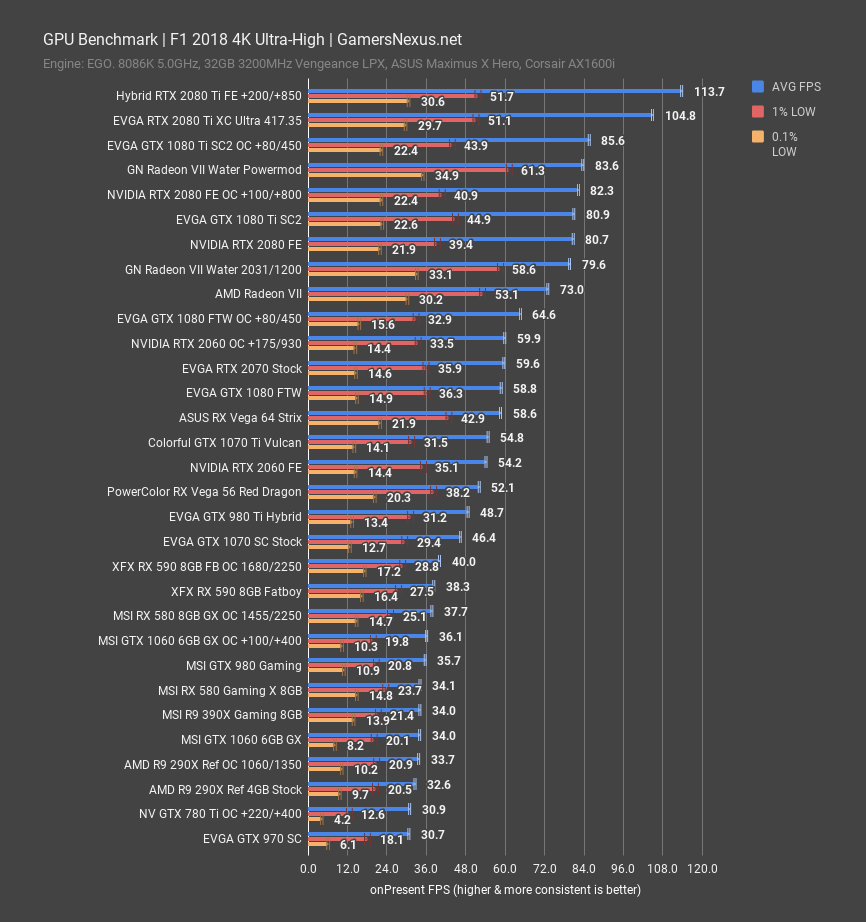
For F1 2018 at 4K, the Radeon VII card performs at 73FPS AVG when stock versus the 2080’s 81FPS AVG, although we previously illustrated that the Radeon VII does seem to post stronger frametime performance in this particular title. Overclocking and water cooling the Radeon VII gets it up to 79.6FPS AVG, posting an increase of 9% again, with the powerplay mod putting it to 84FPS AVG and improving an additional 5% over the previous overclock. The net gain versus stock is 14.5%, landing it close to an overclocked 1080 Ti, but not quite passing it in average framerate – although the low frametime performance is superior, as we discussed in our previous review.
Far Cry 5
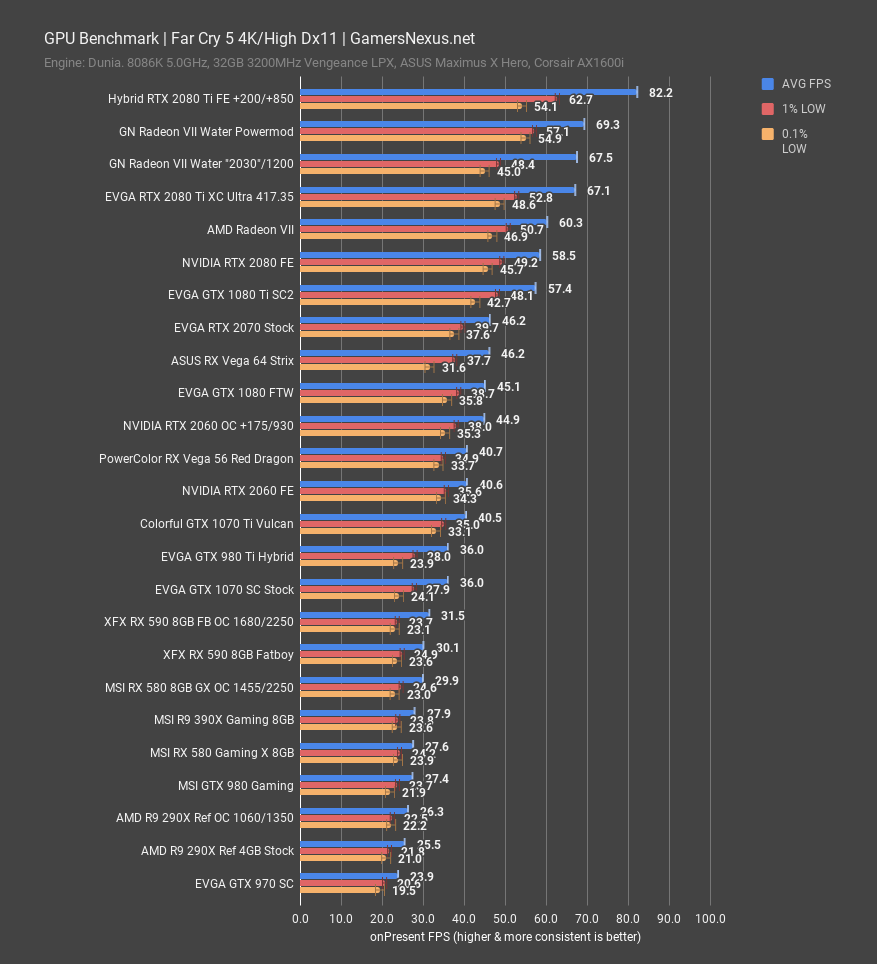
Far Cry 5 is the last one. At 4K, the Radeon VII stock card ran at 60FPS AVG, with the water-cooled overclock at 67.5FPS AVG, which is functionally tied with the 2080 Ti tested back on 417.35. We have not looked back at Far Cry 5 on the 2080 Ti since 417.35, but so far, the two are about equal with the overclock and water cooling on Radeon VII. Adding the power mod only gives us a couple percentage points of improvement, hitting 69FPS AVG and improving 15% over baseline stock, and adding water and an overclock to the 2080 Ti gets it to 82FPS AVG, leading the more power hungry Radeon VII by 18.6%. This is without any BIOS flashes.
Thermals
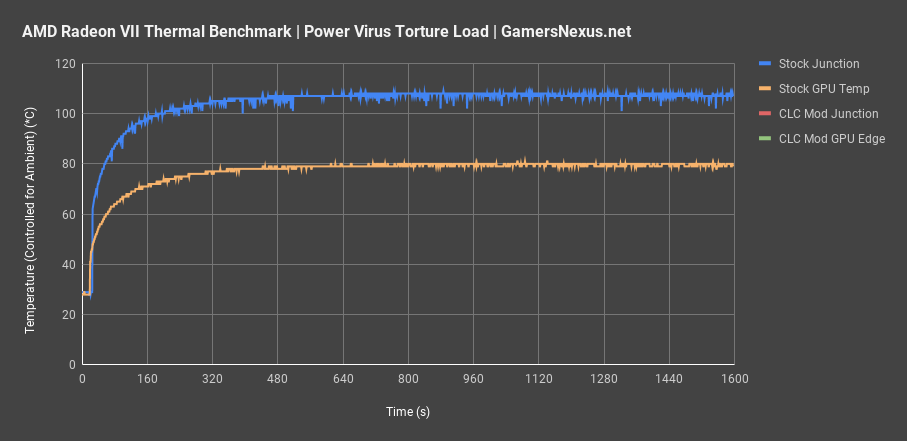
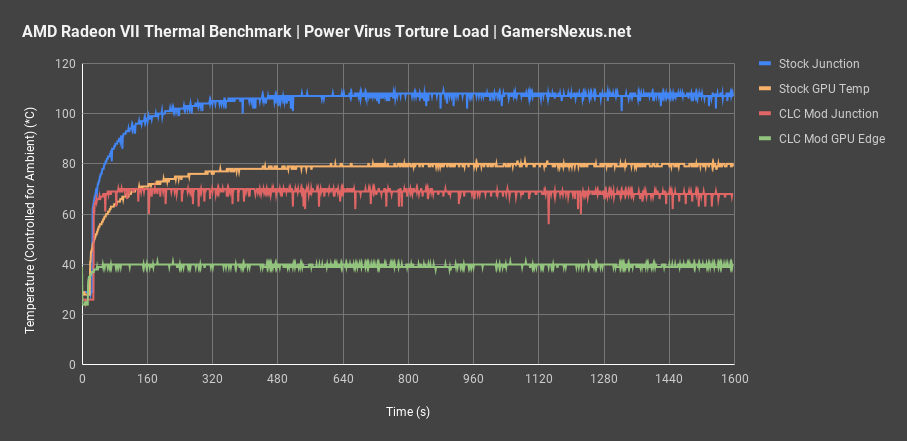
In our original baseline thermal testing, ignoring VRM thermals for a moment, we placed the full stock Radeon VII and its Hitachi graphite pad at a junction temperature of 108 degrees Celsius under load. As a reminder, junction temperature is the hottest of the 64 thermal sensors across the package, whereas GPU temperature is the edge temperature – literally the temperature at a cooler edge of the GPU – and is less useful. Radeon VII clocks based on junction, and its TjMax is 110 when stock. GPU edge temperature was about 80 degrees when stock.
Our water cooled mod under the same stock clock and voltage conditions ran a junction temperature approximately 39 degrees cooler than the stock temperatures, at about 68 to 70 degrees Celsius junction. The GPU edge temperature ended up about 40 degrees below stock as well, unsurprisingly, at about 40 degrees Celsius. Note that ambient temperature was controlled at 22 degrees Celsius for both tests and was logged every second with a thermocouple reader.
Frequency
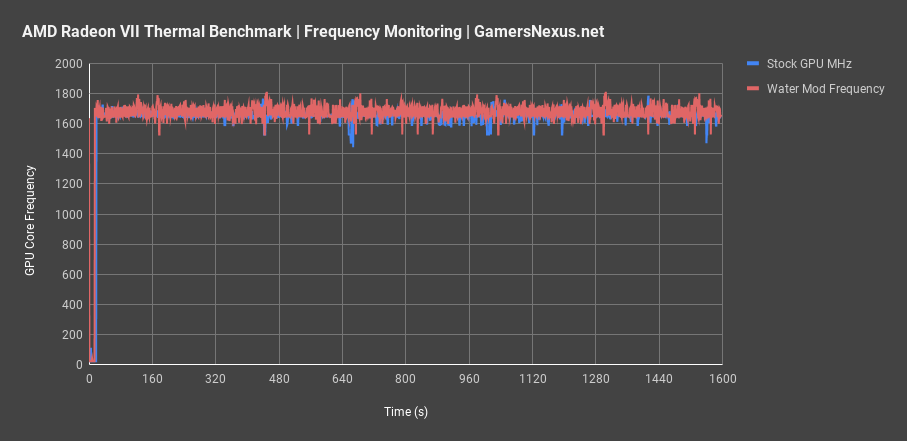
Moving on to frequency over time for this same test case, we see that, critically, performance is actually up versus the stock air-cooled card, and this is without any overclock settings applied. That means that boosting is utilizing the extra thermal headroom, which may also explain why we didn’t see reduced power consumption from leakage earlier – if it’s boosting clocks and voltages to meet the thermal headroom until hitting a power target, power consumption would remain the same. Our average frequency for the water cooled mod is about 1720 to 1750MHz, with some spikes to 1800MHz. The stock card averages closer to 1650MHz, allowing us a 70MHz to 100MHz average increase just from liquid cooling. That’s a very good result and is essentially a pre-overclock. Still, the water mod is more variable in frequency likely due to power limits, but it averages a higher result.
VRM Thermals
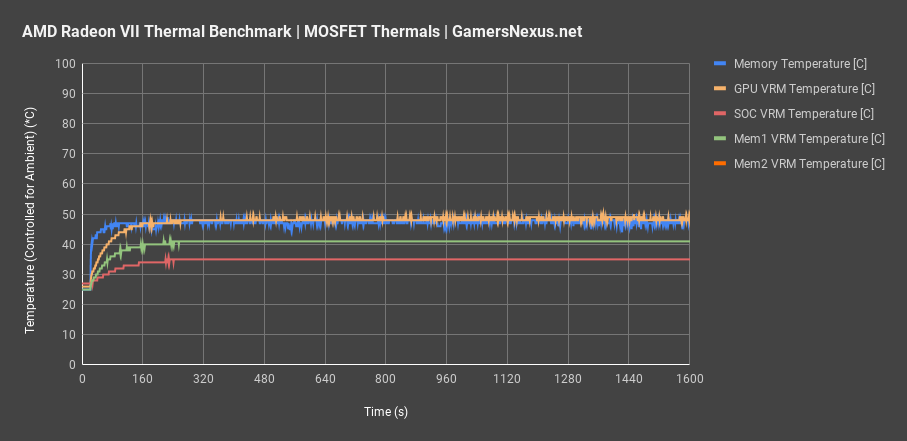
Finally, the newest GPU-Z rendition has given us software monitoring of the sensors inside of the power componentry on Radeon VII. Buildzoid’s video on our channel talks about these parts in more depth, but we can show the thermals of our mod here. Just to prove that you don’t need a baseplate on the VRM, and we validated this with hardware K-type thermocouples, the hottest component was a GPU VRM MOSFET, which plotted at about 50 degrees Celsius. That’s not over ambient or anything, that’s just straight 50C in a 22C ambient environment, so our delta is about 30 degrees. That’s damn good, particularly considering we have no baseplate and just positioned a Noctua fan to blow over the VRMs. We could even run this passively without the Noctua fan, although that wouldn’t be advisable for actual overclocking. Either way, Radeon VII’s VRM is efficient enough that it doesn’t run too hot. The GPU memory temperature plotted at about 47-48 degrees Celsius. We’ll just complicate the chart and throw the rest of the measurements up there. The memory VRM and SOC VRM temperatures ended up in the range of 35 to 44 degrees Celsius, ensuring that this card ran well within spec and better than stock even without a direct contact heatsink on the VRMs.
Conclusion: Radeon VII Water Cooling & Overclocking
Overclocking Radeon VII actually works now, sort of, and is far better than the initial driver release. Driver revision 19.2.3 (used for this testing) is far more usable for overclocking, although liquid cooling was ultimately required to enable us to uplift our frequencies to the levels we hit. It wouldn’t have been possible with the stock cooler, especially once we started applying powerplay registry mods to increase power to the card to ~500W. Our first liquid cooling solution, the Alphacool GPX block, was unfortunately uneven in its coldplate smoothness, and so we switched it to a modified Asetek mounting bracket and Thermaltake Floe 360 CLC, using some random fans (2x Gentle Typhoon and 1x Corsair Maglev) for cooling. This significantly lowered thermals from stock, as illustrated in our above charts, and allowed overclocking to much higher levels. Even stock performance improved, a result of more thermal headroom for boosting and reduced power leakage, freeing-up power for actually boosting the core. Note that we also tried pushing voltage up toward 1.3V, but did not see further scaling with the current mods installed.
We didn’t plot a thermal chart for the final overclock and powerplay mod, but junction temperature ended up pegged at 99 degrees Celsius. This is still below stock TjMax of 110 degrees, and well under the overclocking TjMax of 120 degrees. There’s a bit more room, but ultimately, we’d need to chill the radiator to leverage cold scale and further increase our clocks. Alternatively, some more experience (on our end) working with the overclocking software could help, as it does seem to still possess some strange bugs. One is that voltage won’t update without frequency also first updating, at which point that frequency can then be reverted. As we learn to deal with these particular quirks more competently, we can probably drive the clocks higher. The power offset mods also seem to stop working at some point. We can get the card to pull down more power, validated with clamps and software, but it seems to hit a fall-off point where power ceases its increase, despite further registry modifications to the power target limits. We’ll have to dig into this more later.
Finally, we did do some basic undervolting, but stopped at around ~0.94v. We’ll need to do more validation on this later as well.
As for whether we’d recommend going this route, the answer is mixed: We would recommend liquid cooling (particularly if you can get a cleaner solution than ours) and would recommend more powerful coolers, as there is some cold scale uplift even if only on the order of a ~20-degree reduction from stock. The VRMs ran perfectly fine without direct contact heatsinks, but a case with higher ambient, like 40 degrees, would make it worthwhile to add a fan directly over the FETs. This is negated if using a fuller coverage block or a proper “hybrid” approach, of course, but our fan+CLC approach worked very well for open air use. We wouldn’t recommend powerplay mods for anything beyond enthusiast tweaking or some overclocking fun, as we are uncertain of the long-term effects of such high power throughput. It’s possible that the core burns out sooner, so we’d advise caution for 24/7 use if intending to use some of these mods.
For now, though, we’re preparing to leave for Taiwan and China, and so any further tuning on Radeon VII must wait until we return.
Editorial, Testing: Steve Burke
Video: Josh Svoboda, Andrew Coleman
