We compare the PCIe generation differences using the RTX 5090 across PCIe 5.0 x16, PCIe 4.0 x16, and PCIe 3.0 x16
The Highlights
- For our setup, we used our AMD Ryzen 7 9800X3D CPU test bench coupled with an RTX 5090
- The maximal difference between PCIe gen 5 vs gen 3 was roughly 1-4%
- Overall, we did not find a significant difference in performance between PCIe gen 3 vs gen 5
Table of Contents
- AutoTOC

Intro
Out of respect for your time: The answer is 1 to 4%. It’s 1-4% different between PCIe Gen5 and PCIe Gen3 x16 on the RTX 5090. Gen4 x16 and Gen5 x16 are about equal to each other, with some instances of Gen3 x16 (which is comparable to Gen4 x8 in bandwidth) yielding about a 4% advantage to Gen5 x16.
So that’s the bottom-line up front and save you the time, but we’ll also make this story simple while hopefully giving some background on PCIe.
Editor's note: This was originally published on January 28, 2025 as a video. This content has been adapted to written format for this article and is unchanged from the original publication.
Credits
Test Lead, Host, Writing
Steve Burke
Testing
Mike Gaglione
Jeremy Clayton
Video Editing
Tim Phetdara
Writing, Web Editing
Jimmy Thang
These stories are always really fun experiments and some of the simplest we do. Today, we’re testing PCIe generation impact on the RTX 5090 (read our review). We love doing these stories because they allow us to look at the future of the interface and protocol to try and see where it might start limiting high-end devices. Historically, we’ve seen about a 1-3% swing from the newest generation to the prior one when at the front-edge of a new PCIe generation. The RTX 5090 is unique for being the first super high-end consumer video card with PCIe Gen5 support natively, so we’ll test scaling from Gen3, Gen4, and Gen5.
In most scenarios, anyone spending $2,000 on a GPU won’t be running PCIe Gen3 -- but it’s still an interesting test, and PCIe Gen3 x16 would be comparable in maximum theoretical bandwidth to PCIe Gen4 x8, so it still helps there.
This should be a quick and fun look at PCIe scaling.
Overview & Differences
We don’t want to judge you if you’re a super gamer who would be hindered by a 1-4% loss, but most people aren’t going to notice.
Because the content is so simple and you have the answer already, we’re going to do some explainer basics for anyone brushing up on how it all works.
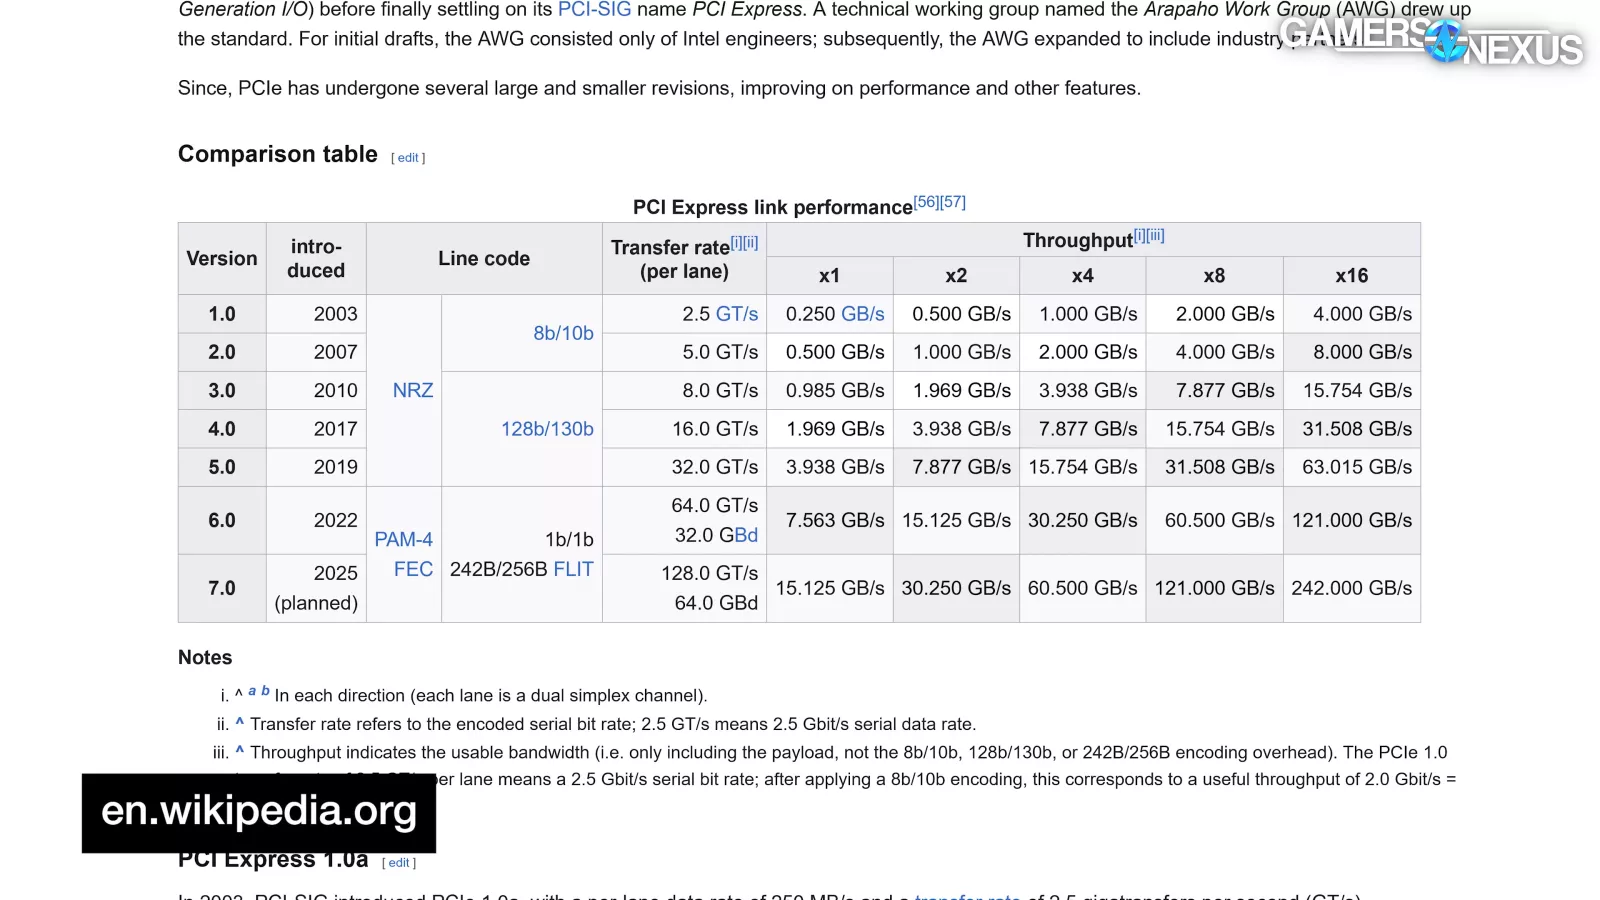
Here’s a chart showing the maximum theoretical bandwidth of different PCIe generations. Wikipedia has always been great for this. The PCIe generation technically goes up to a planned Gen7 this year, but currently, the highest-end supported on consumer motherboards is PCIe Gen5.
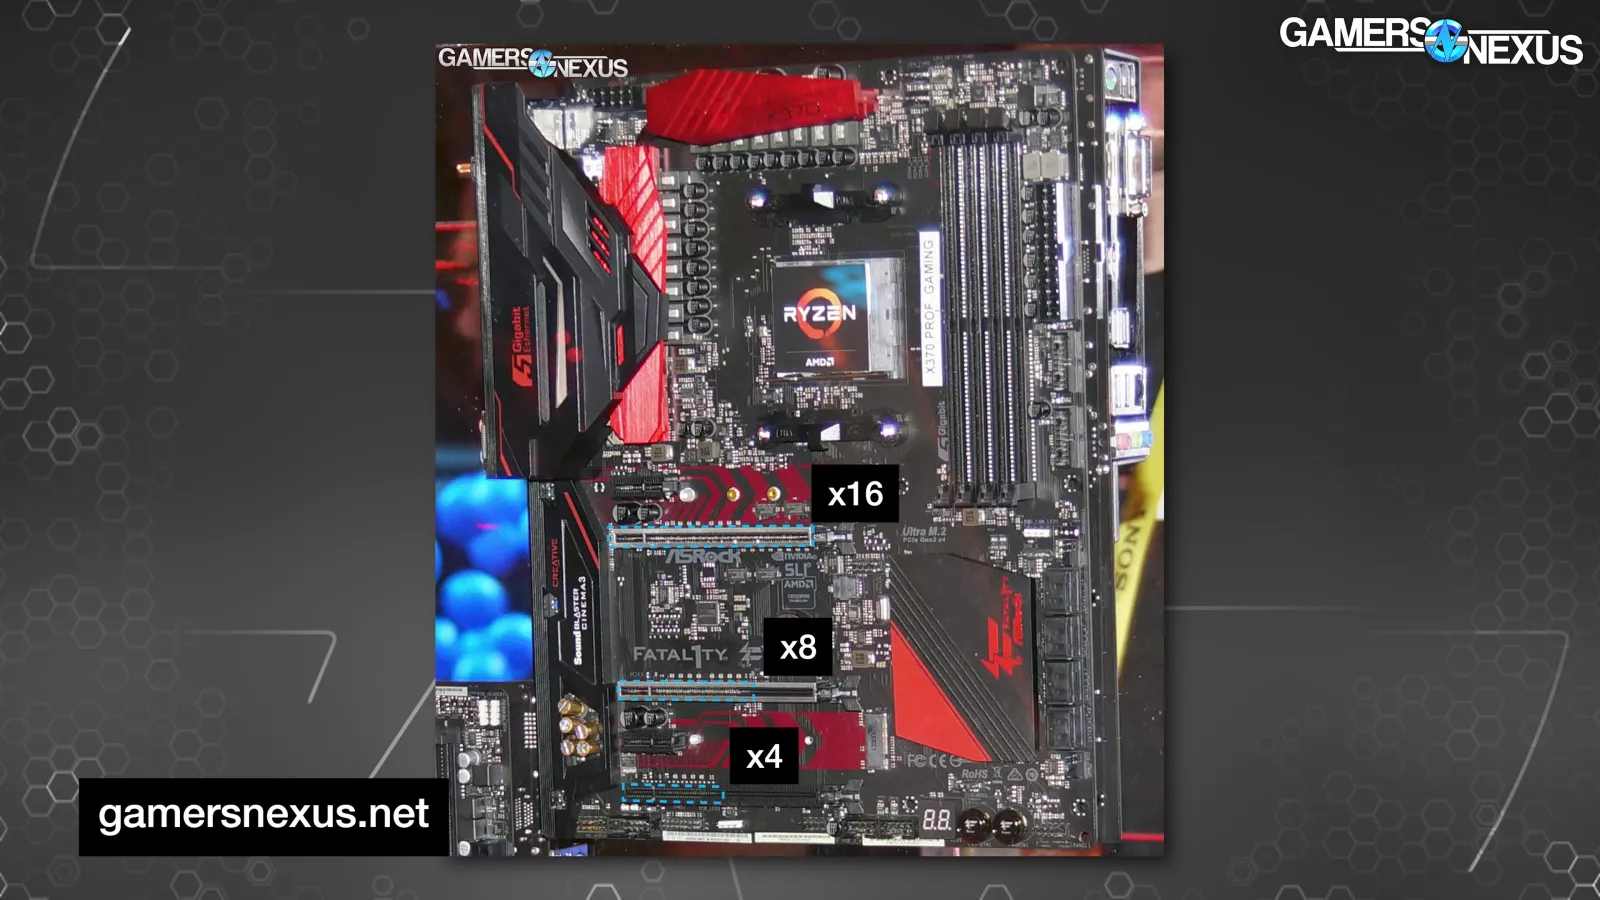
Each PCIe slot has a certain amount of electrical lanes and a certain physical slot size. Although some slots look like they are full x16 length, they may be x8 wiring. In almost every modern motherboard relevant to our audience though, the first PCIe slot will be fully wired for 16 lanes.
PCIe Gen5 on transfers 32 GT/s per lane, which means x16 is about 63 GB/s and x8 is 31.5GB/s. If we shift the highlights right one column and up one row, you’ll see that PCIe Gen4’s x8 speed is the same as PCIe Gen5’s x4 speed and that PCIe Gen4’s x16 speed is the same as PCIe Gen5’s x8 speed for the maximum theoretical bandwidth. This pattern of doubling continues all the way up, so PCIe Gen3 x16 is the same as PCIe Gen4 x8 in maximum theoretical bandwidth.
That simplifies things for us, because that means testing PCIe Gen3 x16 will achieve effectively the same thing as testing PCIe Gen4 x8, so we can cut our testing in half since the speed mostly just doubles generationally.
Another thing to be aware of is that interfaces and protocols often are not the limiter, but the device. Unless you’re buying the newest device on an outgoing interface, like SATA or AGP at some point, the device will typically be incapable of saturating the link it’s connected to.
Explaining Support
PCIe support needs to match on 3 devices in order to utilize the maximum supported generation on any one link in the chain.
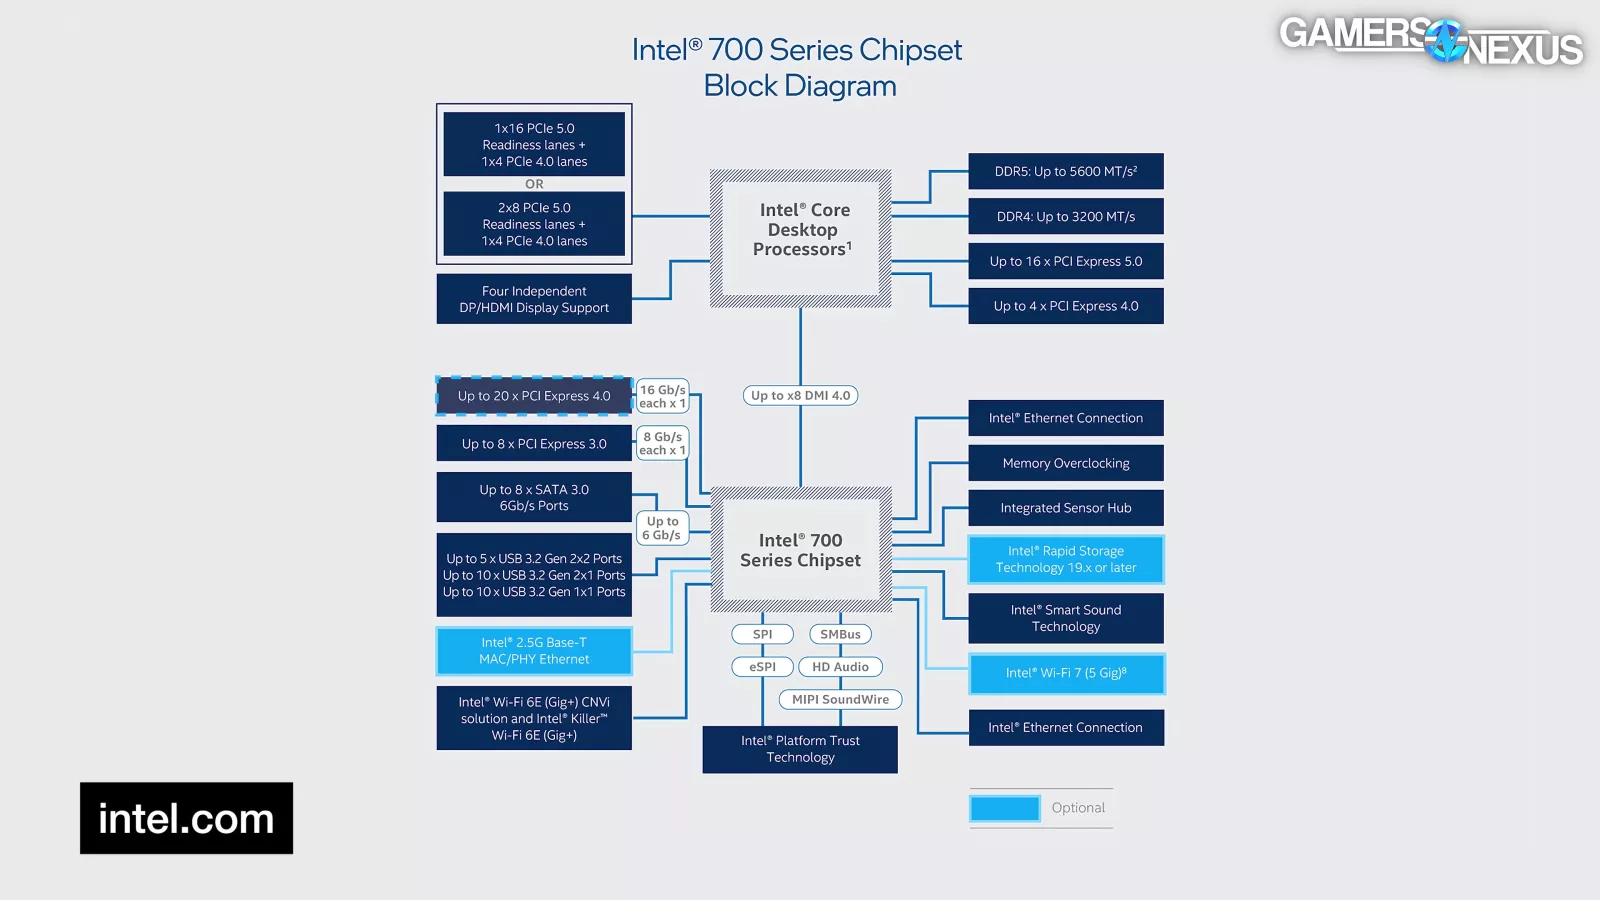
For PCIe Gen5 support on the RTX 5090 to be actually utilized, you’d need the motherboard, GPU, and CPU to all support the same maximum PCIe generation. In this block diagram above of a CPU, you can see that there are at least 16 PEG lanes, or PCIe Graphics lanes, available to the motherboard for use with the GPU.
These lanes peel straight off of the CPU and don’t go through the chipset first and are often assigned to the top PCIe slot.
That slot then needs to actually be a PCIe Gen5 slot, in this example. Finally, the GPU itself needs to be PCIe Gen5.
All of these things can work together without being the same generation. You can use a Gen3 motherboard with a Gen5 card or a Gen5 motherboard with a Gen3 card. They will still work through the interface, but the maximum theoretical bandwidth will cap at the slowest speed of any device linked in the chain.
While we’re on the subject, a common misconception is that a full-length PCIe slot is automatically going to be a x16 slot. First, a lot of PCIe slots are not electrically wired for x16. You can see this by looking into the slot for the pins. If you see half populated, it’s x8. If you see even fewer, it’s x4, but full-length possibly just to be capable of accepting a full-physical length card.
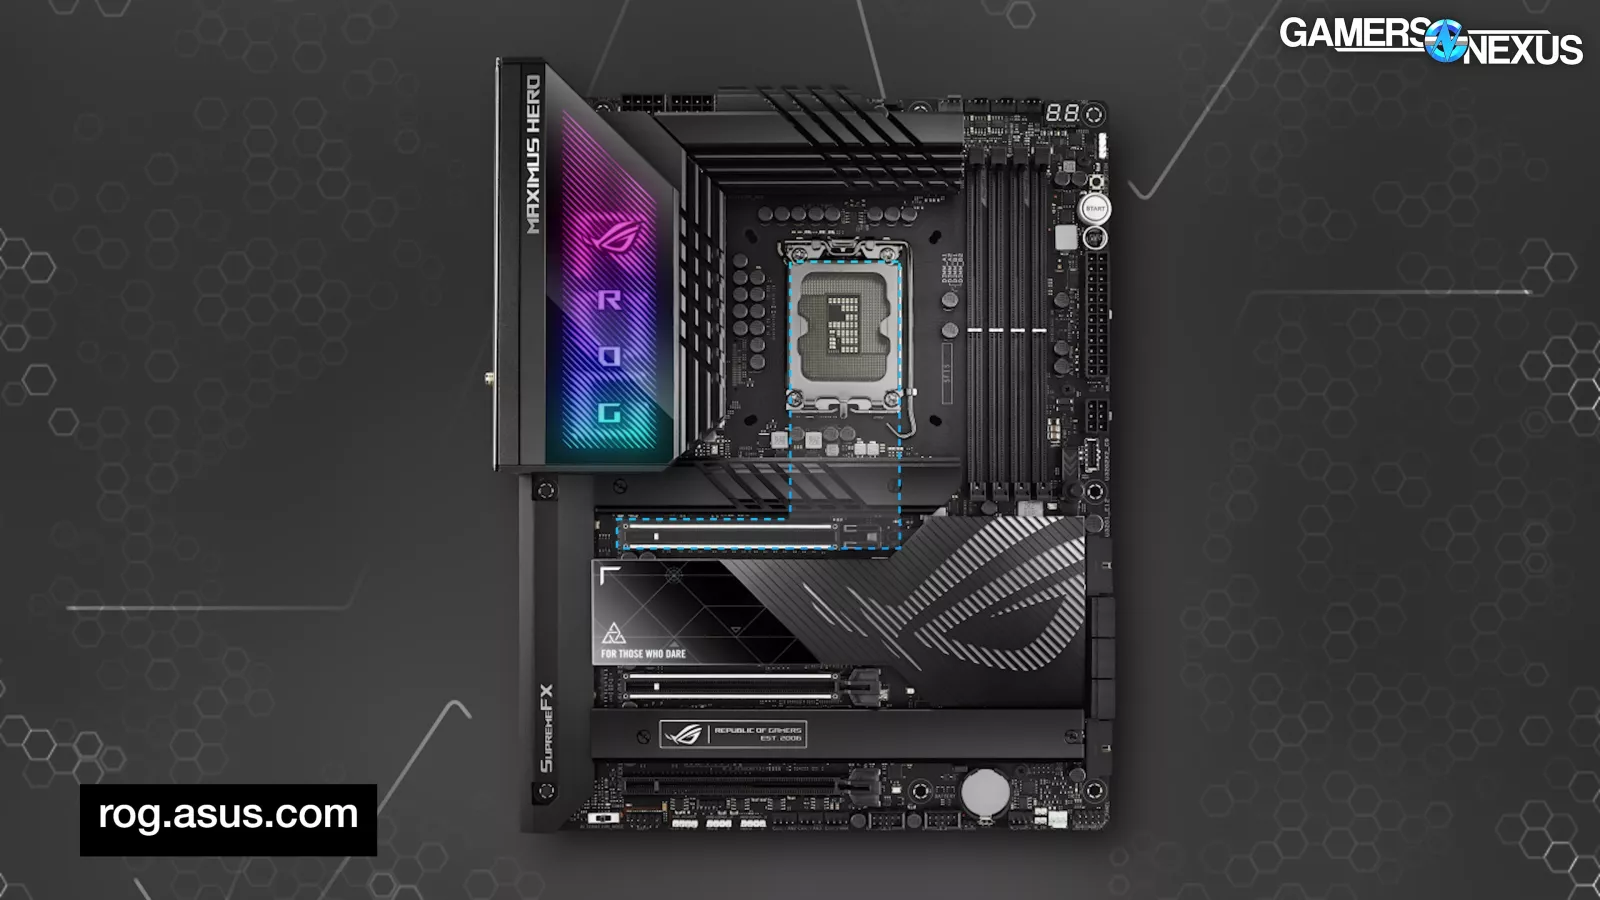
Likewise, PCIe slots wired from the chipset rather than the CPU may run on an older PCIe generation and will also have to jump through a link to the CPU. You can check your motherboard manual for how they wire these slots.
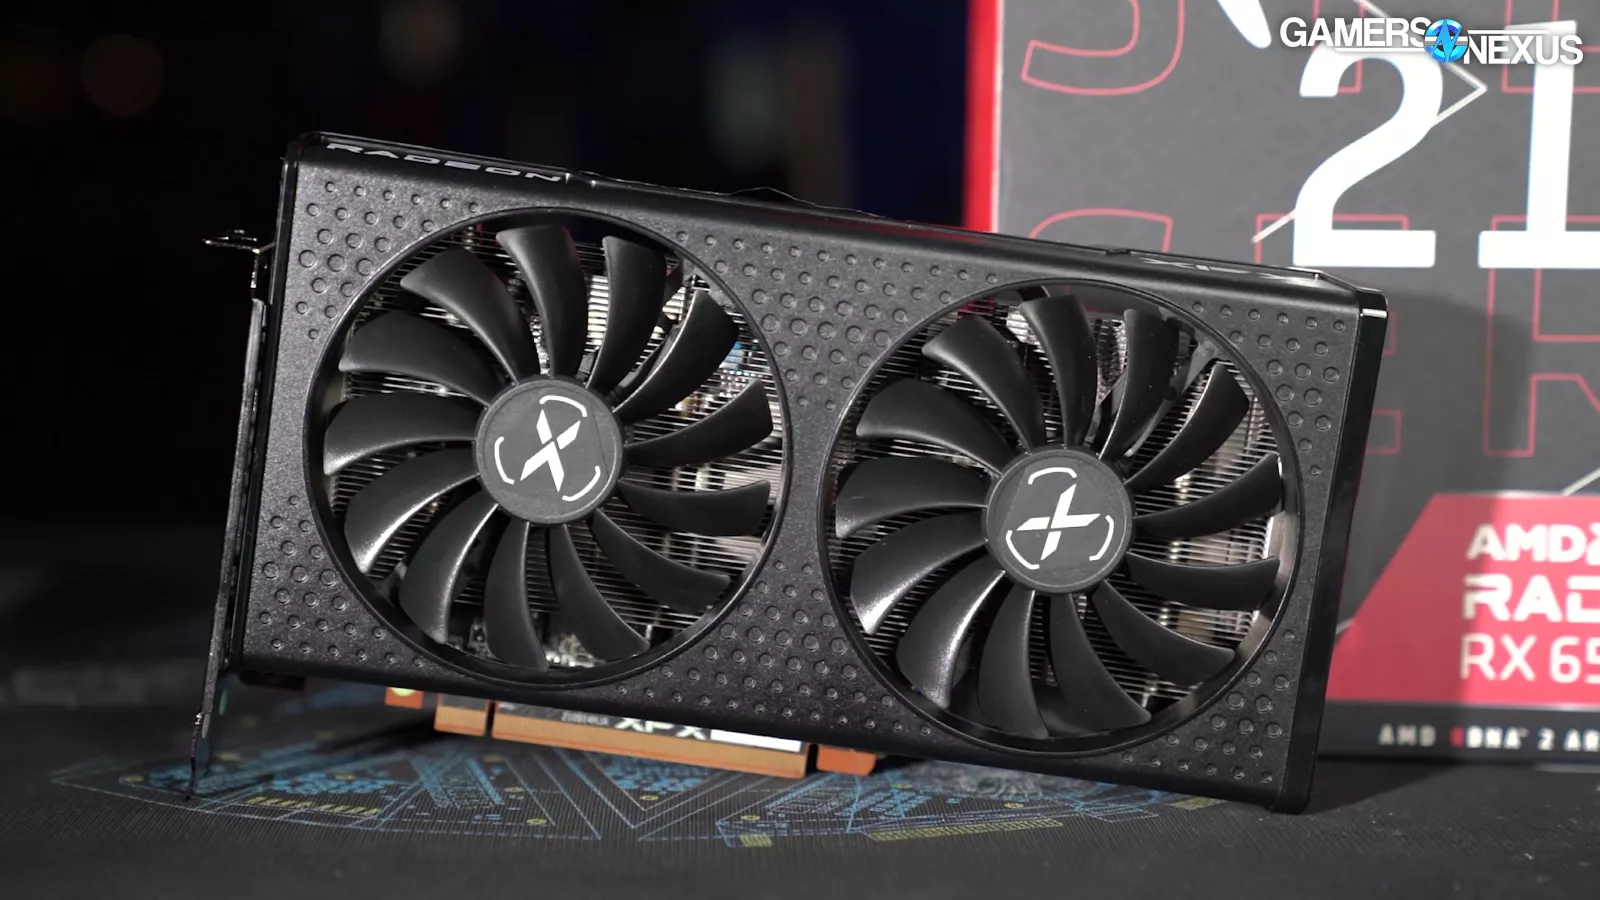
And as a final note: Some GPUs only run on x8. This can be problematic for users of older generation motherboards, because suddenly a PCIe Gen4 x8 card will suffer on PCIe Gen3. The RX 6500 XT (watch our review) is even worse: It’s Gen4 x4, so socketing it into a Gen3 slot will significantly hamper it.
This isn’t a problem on the 5090 since it’s fully wired for x16, but worth bringing up.
Testing
OK, enough explanation. A few things on testing: We ran some of our most consistent benchmarks, but ultimately, they all show the same thing so we’re keeping the total count of charts low and simple.
One thing we aren’t testing is machine learning or so-called “AI” performance, so we can’t speak to how the behavior might change there. It’s possible there would be an impact. We’re focusing on the gaming impact today.
If you want to see what test platform we are using, our game settings, and more of our methodological information for GPU benchmarking, you can visit our living test bench document for all of that.
Let’s get to the benchmarks.
Dying Light 2 - 4K

Dying Light 2 at 4K showed a maximum difference of 1 FPS AVG between results. If anything, we’re excited about the remarkable consistency as it gives us some confidence in this game’s low run-to-run variance with this test pattern. The PCIe Gen3 x16 result appears to slightly lose performance. We’re looking at about a 1% difference. Lows are not meaningfully affected, especially given their wider deviation, but it does appear there is a similar reduction.
Dying Light 2 - 1440p

At 1440p, the Gen5 result was at 216.1 FPS AVG, with Gen4 at 215.5 and Gen3 at 215.4. These are functionally the same. There might be a slight difference here, but not one anyone would ever notice in gaming...unless, you’re a super gamer.
Black Myth - 4K

In Black Myth: Wukong at 4K, the Gen5 result held 85.5 FPS AVG, Gen4 held 84.7, and Gen3 held 83.1. That is a progression, but not a meaningful one. The 84.7 to 85.5 results are within reasonable run-to-run variance of +/- 1 FPS. The Gen3 result allows the Gen5 result a 2.9% advantage, which does appear to be a real change, but not one to worry about. Lows are not outside of usual here.
Black Myth - 1440p

At 1440p, the range was 124.8 to 129.9. This is the widest range yet at 4%, some of which will be variance. The lows scale mostly in-line with the average. This is one of the more interesting results, and even then, you’re going to be far more limited by whatever CPU is still on Gen3 than the PCIe generation itself. This would also be comparable to a Gen4 x8 result by theoretical bandwidth.
Black Myth - 1080p

1080p was pretty interesting. The range was 153.3 to 159.8. The Gen5 result was again about 4.2% ahead of the Gen3 result and 1.7% ahead of the Gen4 result. These are real differences and the Gen3 result is noteworthy, but when 4% is an exciting change, you know there’s not much to talk about.
RT: Black Myth - 4K

Because Black Myth: Wukong was so interesting, here’s the ray tracing results for the same. The 4K result has the Gen4 and Gen5 entries identical. The Gen3 test is behind by about 2 FPS AVG, which again seems repeatable and real, but not particularly interesting. That’s about 2.6%.
RT: Black Myth - 1080p

At 1080p with ray tracing, Black Myth runs at 158 FPS AVG for the Gen5 result and 151 for the Gen3 result, establishing a 4.2% improvement to the Gen5 option. This aligns with the non-RT results.
Resident Evil 4 - 4K

Resident Evil 4 at 4K rasterized has Gen5 at 206.7 FPS AVG, Gen4 identical, and Gen3 at 204.2 FPS AVG. The improvement from Gen3 to Gen5 is 1.2%.
Resident Evil 4 - 1440p

At 1440p, the range was 344 to 349 FPS AVG. Lows are again incredibly consistent between Gen4 and Gen5 results, which is encouraging to see from a methodological standpoint. On a technicality, Gen4 is 0.3 FPS AVG ahead of Gen5, but this is within error and variance. There’s no difference. The Gen3 result is slower, with Gen4 and Gen5 about 1-1.4% faster.
Resident Evil 4 - 1080p

At 1080p, the 5090 Gen4 and Gen5 results are again within variance of each other. Gen4 is 3% faster than Gen3 here.
F1 24 - 4K

Let’s look at one more, but we have enough here to come to a conclusion.
In F1 24 at 4K, the Gen5 5090 result ran at 291 FPS AVG and was basically tied with the Gen4 result. The Gen3 result ran at 285 FPS AVG, so the fastest entry leads Gen3 by 2%.
Conclusion

As we said at the start, this one is really simple. 1-4% is the difference we observed between PCIe Gen5 vs PCIe Gen 3. We ran this test in 16 scenarios mixing rasterization and ray tracing for different games, including 3 resolutions for each. The tests matched our RTX 5090 review test suite.
This is the same we’ve seen every generation, which is between a 1-3% difference. Where it would really matter if there’s some 6500 XT type of card where the manufacturer x4 or x8 instead of a 16 wired card. That’s where the generation would really start to potentially matter.
Not many people are going to be slotting in a $2,000 card into a really old motherboard, but even if you did, the Gen 3 x16 results don’t look like a huge deal, where you’d maybe start to lose 2-4% performance maximally from what we’ve seen.