We benchmark the RTX 4070 Ti Super across rasterized, ray-tracing, and GPU power efficiency tests against numerous GPUs
The Highlights
- Compared to the RTX 4070 Ti, the 4070 Ti Super increases memory bandwidth from 192-bit to 256-bit and gains 4GB of VRAM
- The performance delta between the RTX 4070 Ti Super and the 4070 Ti diminishes at lower resolutions
- The 4070 Ti Super has a roughly 10-11% uplift compared to the 4070 Ti at 4K but is also a little more expensive
- Original MSRP: $800
- Release Date: January 24, 2024
Table of Contents
- AutoTOC

Intro
We’ve got a lot of cool benchmarks in our RTX 4070 Ti Super review. We’re adding GPU power efficiency testing where we’ll go over FPS per watt, marking the debut of this testing (for us) for GPUs, which isn’t anywhere near final but will soon help reveal more of power characteristics that are often overlooked for video card reviews -- and we've been guilty of that. We’re also adding Cyberpunk 2077 ray tracing benchmarks back in, alongside a couple dozen cards benchmarked through the gaming comparisons today.
To provide an overview, we’re reviewing NVIDIA’s RTX 4070 Ti Super in this article, but there’s also the $600 RTX 4070 Super, which we recently reviewed. That card will sit alongside the original 4070, which has dropped about $50. There’s also the 4070 Ti. That’s 4 4070 cards, which makes things confusing. NVIDIA is helping to streamline things a bit by getting rid of the 4070 Ti moving forward. This isn’t to mention the new 4080 Super (find our review here), which is what many commenters seem to be most excited about due to its $1,000 price, which is $200 less than what the original 4080 launched at.
Editor's note: This was originally published on January 23, 2024. This content has been adapted to written format for this article and is unchanged from the original publication.
Credits
Test Lead, Host, Writing
Steve Burke
Testing
Patrick Lathan
Testing
Mike Gaglione
Video Editing
Vitalii Makhnovets
Web Editing
Jimmy Thang
RTX 4070 Ti Super Overview
The 4070 Ti Super is sandwiched between the 4080 Super and 4070 Super and comes out to be a solid “meh.” Some interesting findings out of the gate: the 4070 Ti Super skews higher compared to the 4070 Ti (original review here) in 4K because of its memory subsystem change. The 4070 Ti Super has increased memory capacity, moving up from the 4070 Ti’s 12GB to 16GB, and changes its memory bandwidth from 192-bit to 256-bit.
GPU Reviews Test Bench
You can find additional test methodology notes in our Test Benches Living Document.
| Part | Component | Provided By |
| CPU | Intel Core i7-12700KF Overclocked (4.9GHz P-Cores, 3.9GHz E-Cores) | Bought by GN |
| Motherboard | MSI Z690 Unify | MSI |
| RAM | DDR5-6000 G.Skill Trident Z (manually tightened timings) | G.Skill |
| Cooler | Arctic Liquid Freezer II 360 @ 100% Fan Speed | Bought by GN |
| PSU | EVGA 1600W T2 Supernova Corsair AX1600i | EVGA Corsair |
| OS | Windows 11 | Bought by GN |
RTX 4070 Ti Super, 4070 Ti, 4080 Super Specs
| 4080 Super | 4080 | 4070 Ti Super | 4070 Ti | 4070 Super | 4070 | |
| GPU | AD103 | AD103 | AD103 | AD104 | AD104 | AD104 |
| Cores | 10240 | 9728 | 8448 | 7680 | 7168 | 5888 |
| Tensor Cores | 320 | 304 | 264 | 240 | 224 | 184 |
| RT Cores | 80 | 76 | 66 | 60 | 56 | 46 |
| Memory Size & Type | 16GB GDDR6X | 16GB GDDR6X | 16GB GDDR6X | 12GB GDDR6X | 12GB GDDR6X | 12GB GDDR6X |
| Bus Width | 256-bit | 256-bit | 256-bit | 192-bit | 192-bit | 192-bit |
| Memory Bandwidth | 736 GB/s | 716 GB/s | 672 GB/s | 504 GB/s | 504 GB/s | 504 GB/s |
| Base/Boost (Advertised) | 2.29/2.55GHz | 2.2/2.5GHz | 2.3/2.6GHz | 2.3/2.6GHz | 1.98/2.48GHz | 1.9/2.48GHz |
| ROPs | 112 | 112 | 96 | 80 | 80 | 64 |
| TMUs | 320 | 304 | 264 | 240 | 224 | 184 |
| TDP | 320W | 320W | 285W | 285W | 220W | 200W |
| Launch MSRP | $1,000 | $1,200 | $800 | $800 | $600 | $600 |
| Announce Date | January 8, 2024 | September 20, 2022 | January 8, 2024 | January 3, 2023 | January 8, 2024 | April 12, 2023 |
| Release Date | January 31, 2024 | November 16, 2022 | January 24, 2024 | January 5, 2023 | January 17, 2024 | April 13, 2023 |
RTX 4070 Ti Super Power Efficiency Benchmarks
Power efficiency testing was something we debuted in our CPU Efficiency & Power Consumption story, which looked primarily at FPS per watt. In keeping with that, we’ll be looking at FPS per watt here as well.
FPS per watt with GPUs produces mostly sub 1.0 numbers, and that’s because power consumption is typically higher than the typical frame rate is in terms of pure numerical value. You might ask, “Why not do watts per FPS to get a nice positive number then?” Our only real answer to that is consistency. We’re going with FPS per watt because we already used it in our CPU story, which people seemed to like. FPS per watt also allows us to go for “bigger number better.”
Power Efficiency: Starfield - 4K
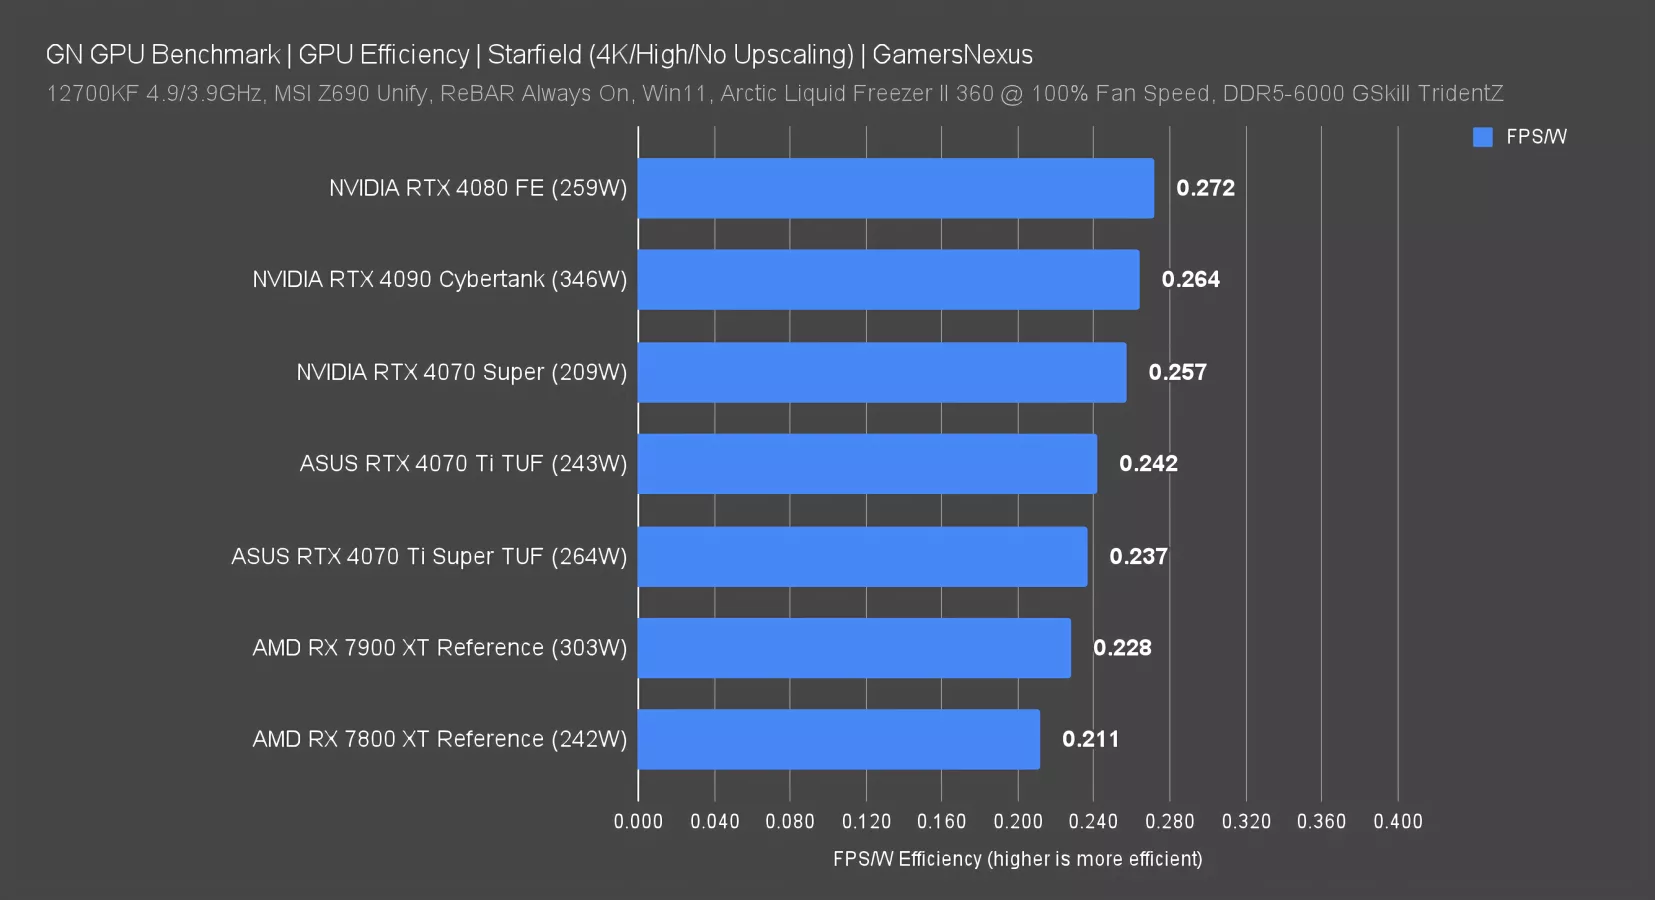
Starfield at 4K starts us off for efficiency. In this one, the most efficient card in the test was the RTX 4080, at 0.27FPS/W. Or if you want to look at it another way, about 3.7W per FPS. Or another way still, 0.27 frames per joule.
The 4070 Ti Super is about equal with the original 4070 Ti, the latter of which technically has a 2.1% improvement in efficiency here.
Compared to the 7900 XT, the 4070 Ti Super is about 4% more efficient in FPS/W.
Efficiency: Starfield - 1440p
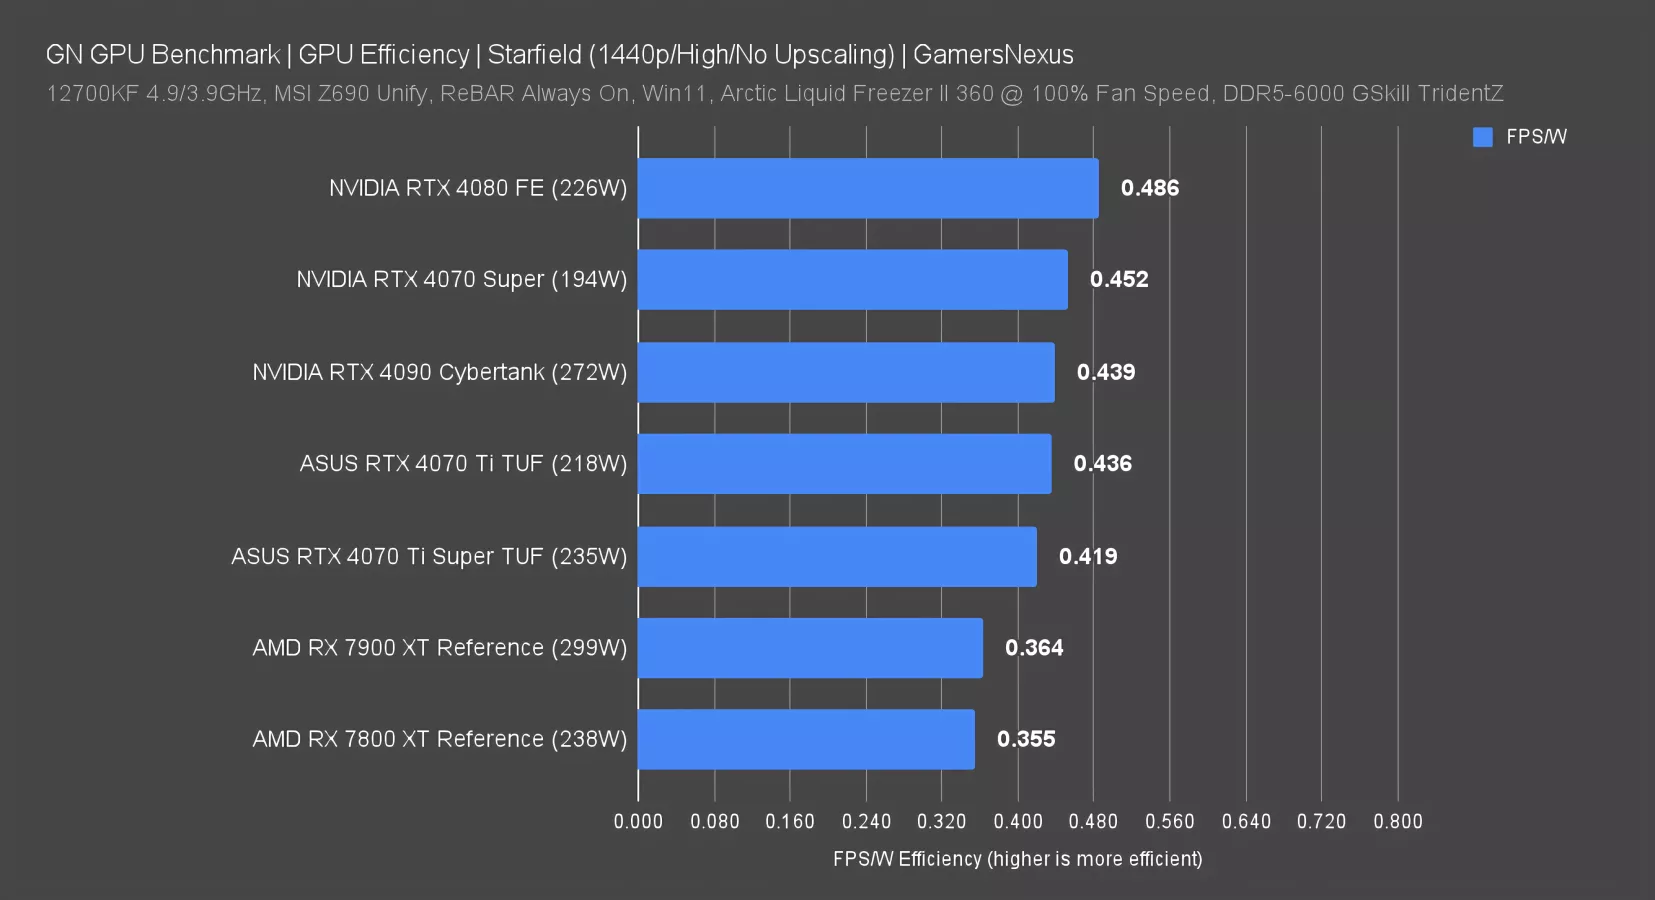
At 1440p, the 4090 slips down the ranks a bit more as it approaches a CPU bind. This reveals interesting data that shows that, although the CPU may start limiting performance, that doesn’t necessarily make the GPU more efficient. It’s similar to the IO die baseline power requirement buffer we saw for AMD CPUs.
Anyway, the 4070 Ti Super again allows the 4070 Ti a lead in efficiency, this time by about 4.1%. The 4070 Ti Super’s lead over the 7900 XT is a relatively large 15% here, showing that AMD is trading power for performance.
Efficiency: Starfield - 1080p
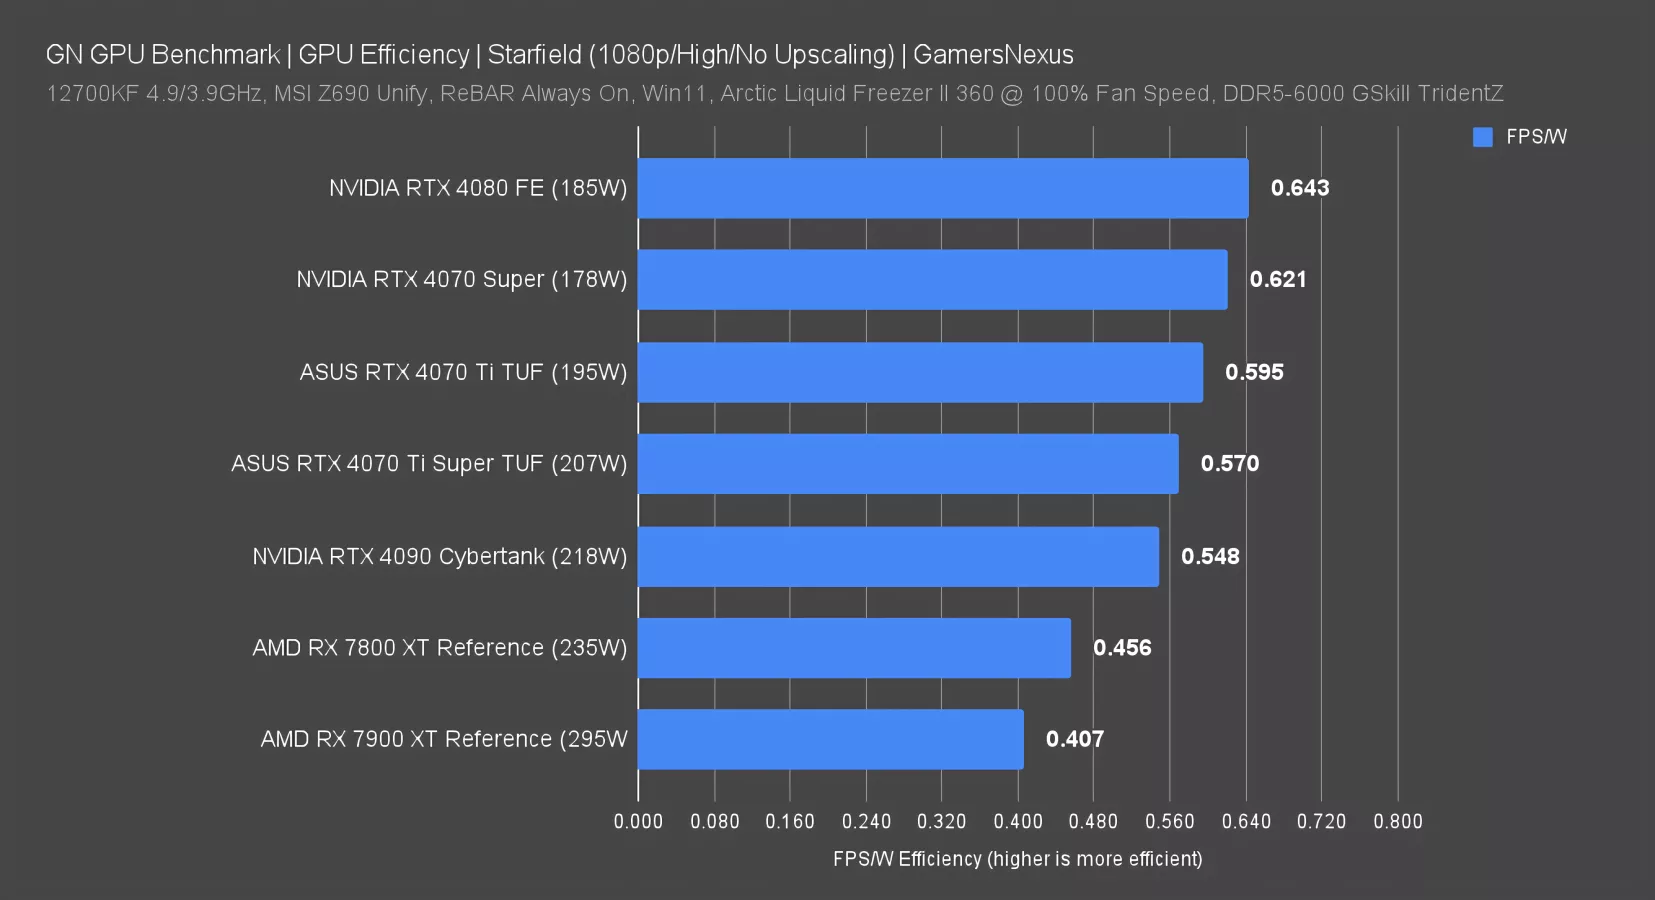
At 1080p, the 4080 (original review here) remains the most efficient, while the 4090 continues to slip down the ranks: Its baseline power requirement to maintain operation with its default card settings is reducing its efficiency as it gets increasingly tangled-up by other components. This is really interesting data and implies that the entire system will in fact be less efficient as CPU load increases, as we saw in our previous CPU efficiency test.
The 4070 Ti Super produced 0.57 FPS/W here, that has the 4070 Ti original card 4.4% more efficient, or the 4070 Ti Super as 25% more efficient than the 7800 XT. The RX 7900 XT (recent revisit here) is also becoming limited, causing a further gulf.
Power Efficiency: Resident Evil 4 - 4K
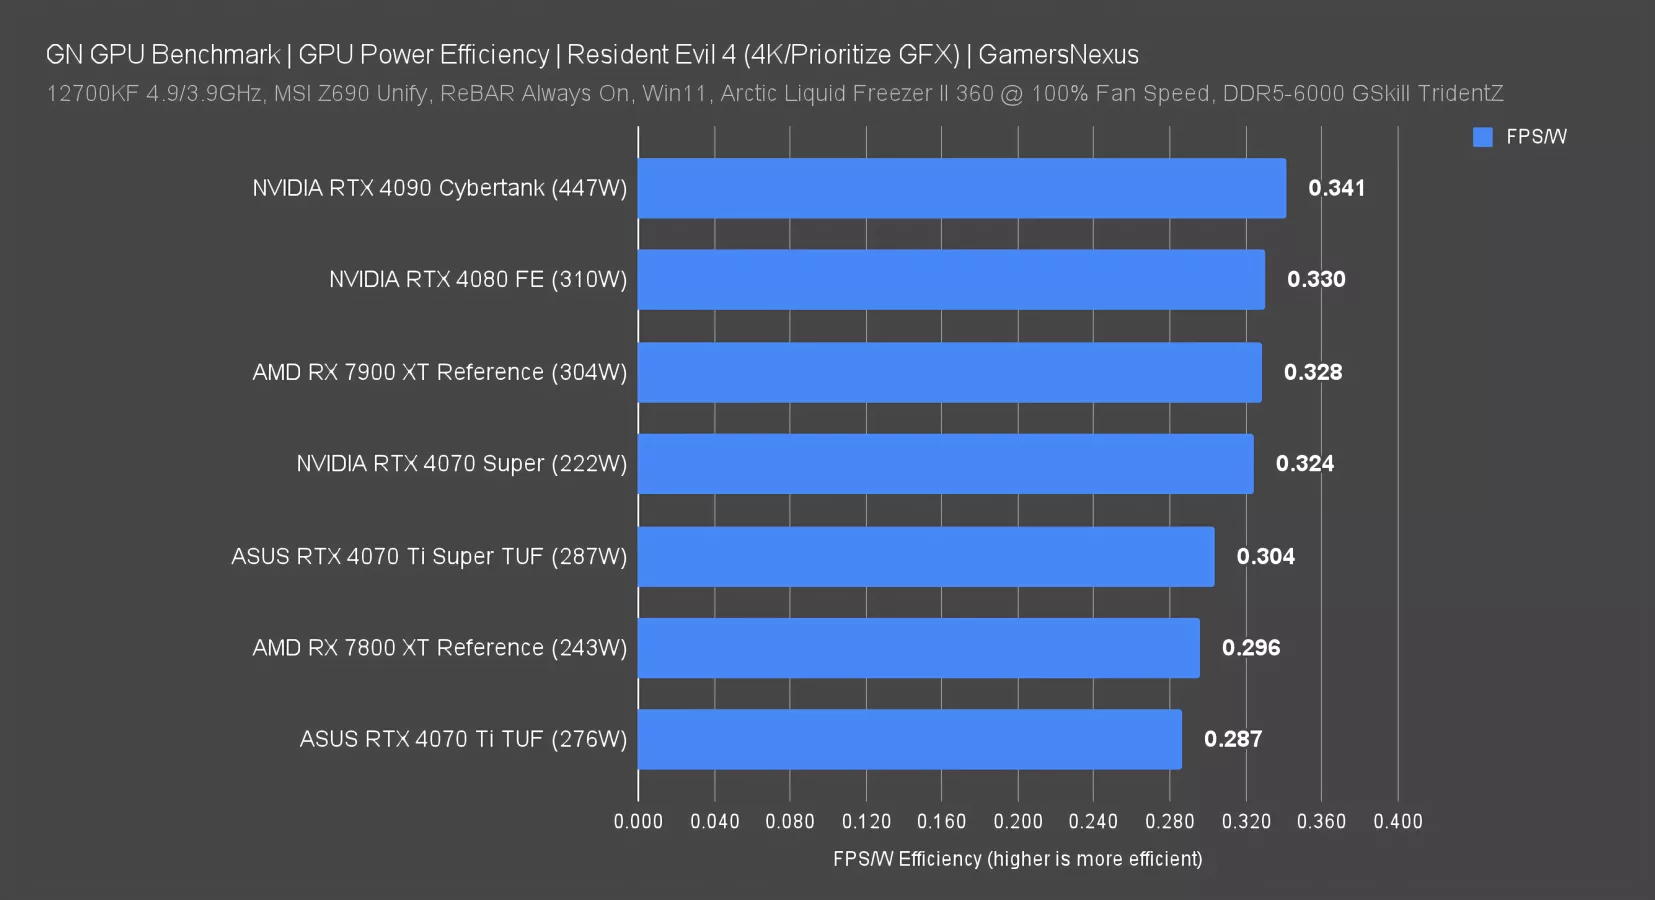
In Resident Evil 4 at 4K, without RT, we found the 4070 Ti to be the least efficient card, with the 4070 Ti Super improving by 6%. It could be the case that the uplift in this title comes from the memory subsystem change as opposed to frequency.
The 7900 XT is significantly more efficient here due to overall higher performance than previously, allowing it to roughly tie the RTX 4080. The 7800 XT sits between the Ti Super and the original Ti.
Power Efficiency: RE4 - 1440p
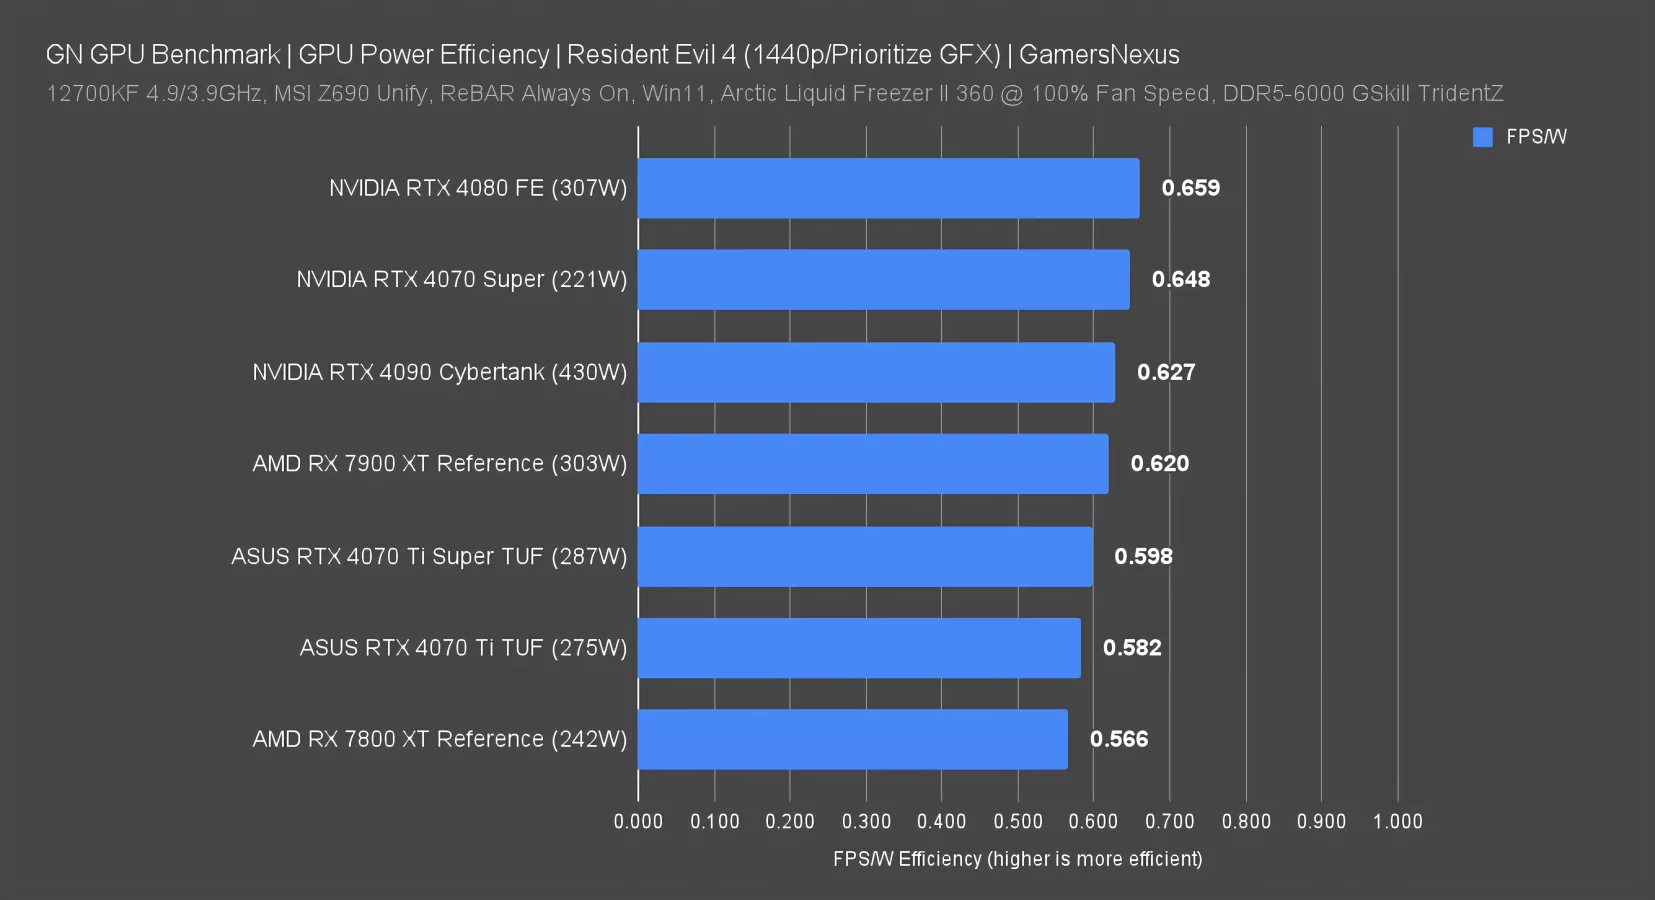
At 1440p, the 4070 Ti Super still leads the 4070 Ti, now by 2.7%, with the 7900 XT still relatively high up the chart. The 4070 Super ends up striking the strongest balance overall in this one.
Power Efficiency: RE4 - 1080p
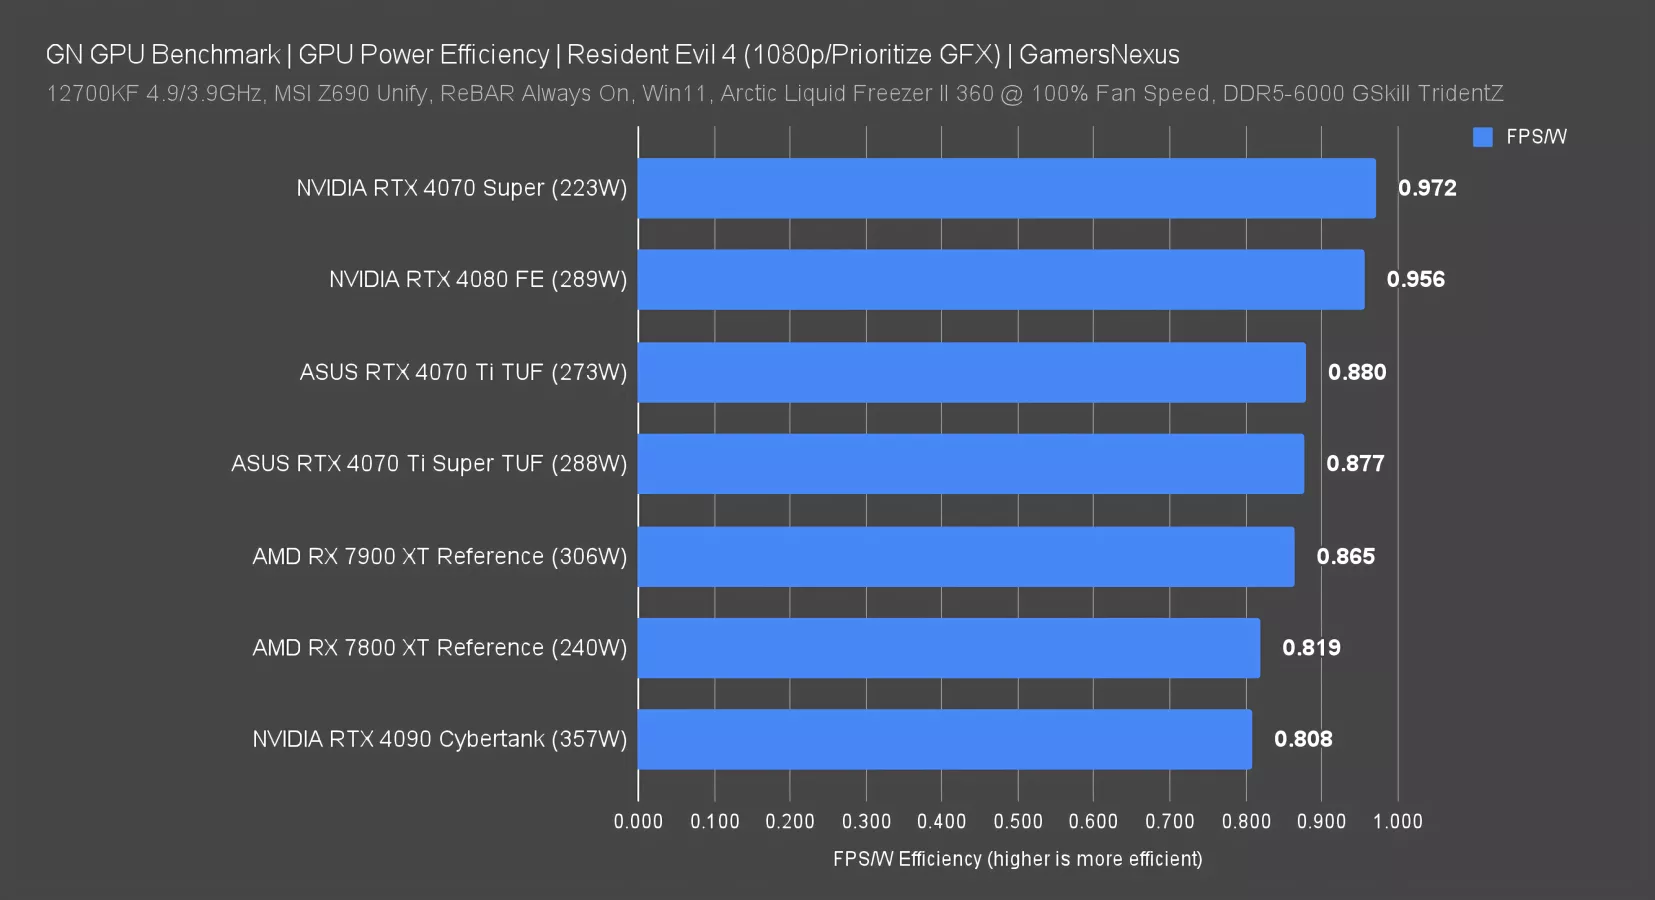
At 1080p, the 4080 and 7900 XT still have some scaling headroom for framerate. The RTX 4090’s overall comparative efficiency has fallen, but it still pulls 357W and remains relatively heavily loaded despite being limited on total CPU scaling. The 4070 Ti Super is roughly tied with the 4070 Ti at this resolution, so its lead shrank with each resolution decrease. The 7900 XT allows the 4070 Ti Super a lead of 1.4%, so they’re also about tied. The 4070 Super strikes the best balance so far.
Power Efficiency: Rainbow Six Siege - 4K
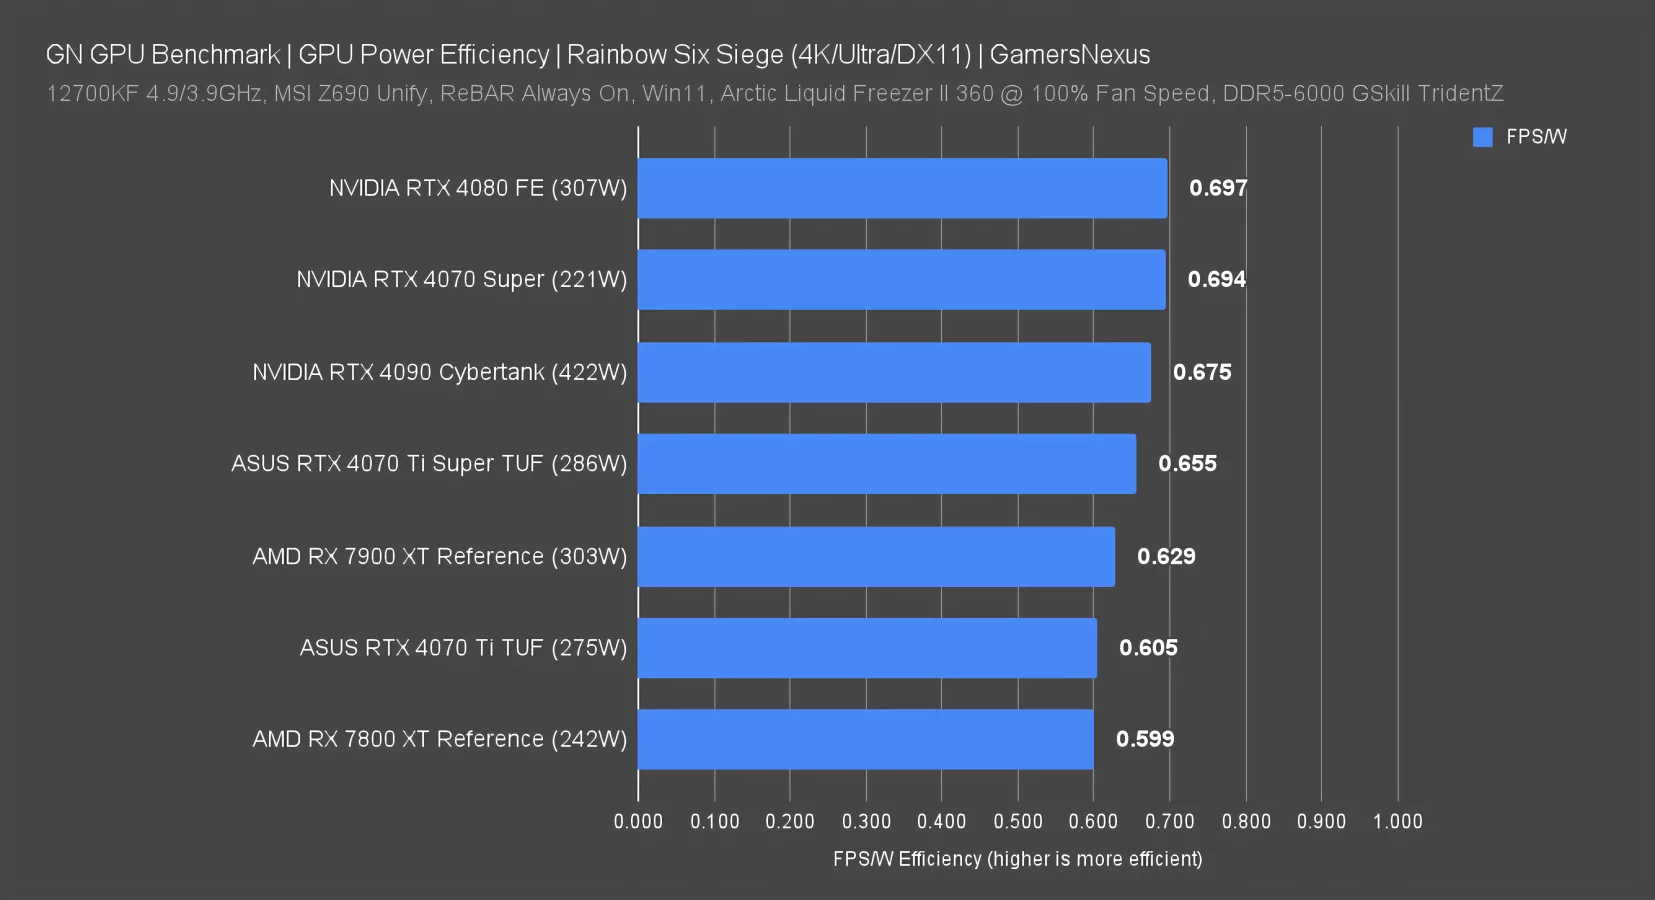
In Rainbow Six Siege at 4K, the RTX 4080 remains the most efficient of the group, followed by the 4070 Super -- which is now establishing a trend -- and then the RTX 4090. The 4090 is slightly lower on the efficiency curve for volt-frequency tuning to maximize performance. The 4070 Ti Super leads the 4070 Ti by 8.3% in this title, a result of a higher AVG FPS increase than we’ve seen in some other games. The 7900 XT ends up between the two Ti-class cards.
Power Efficiency - 10 & 30-pt Highs
Now we’re going to quickly look at some 10-point and 30-point non-consecutive highs from the entire test run, including loading screens.
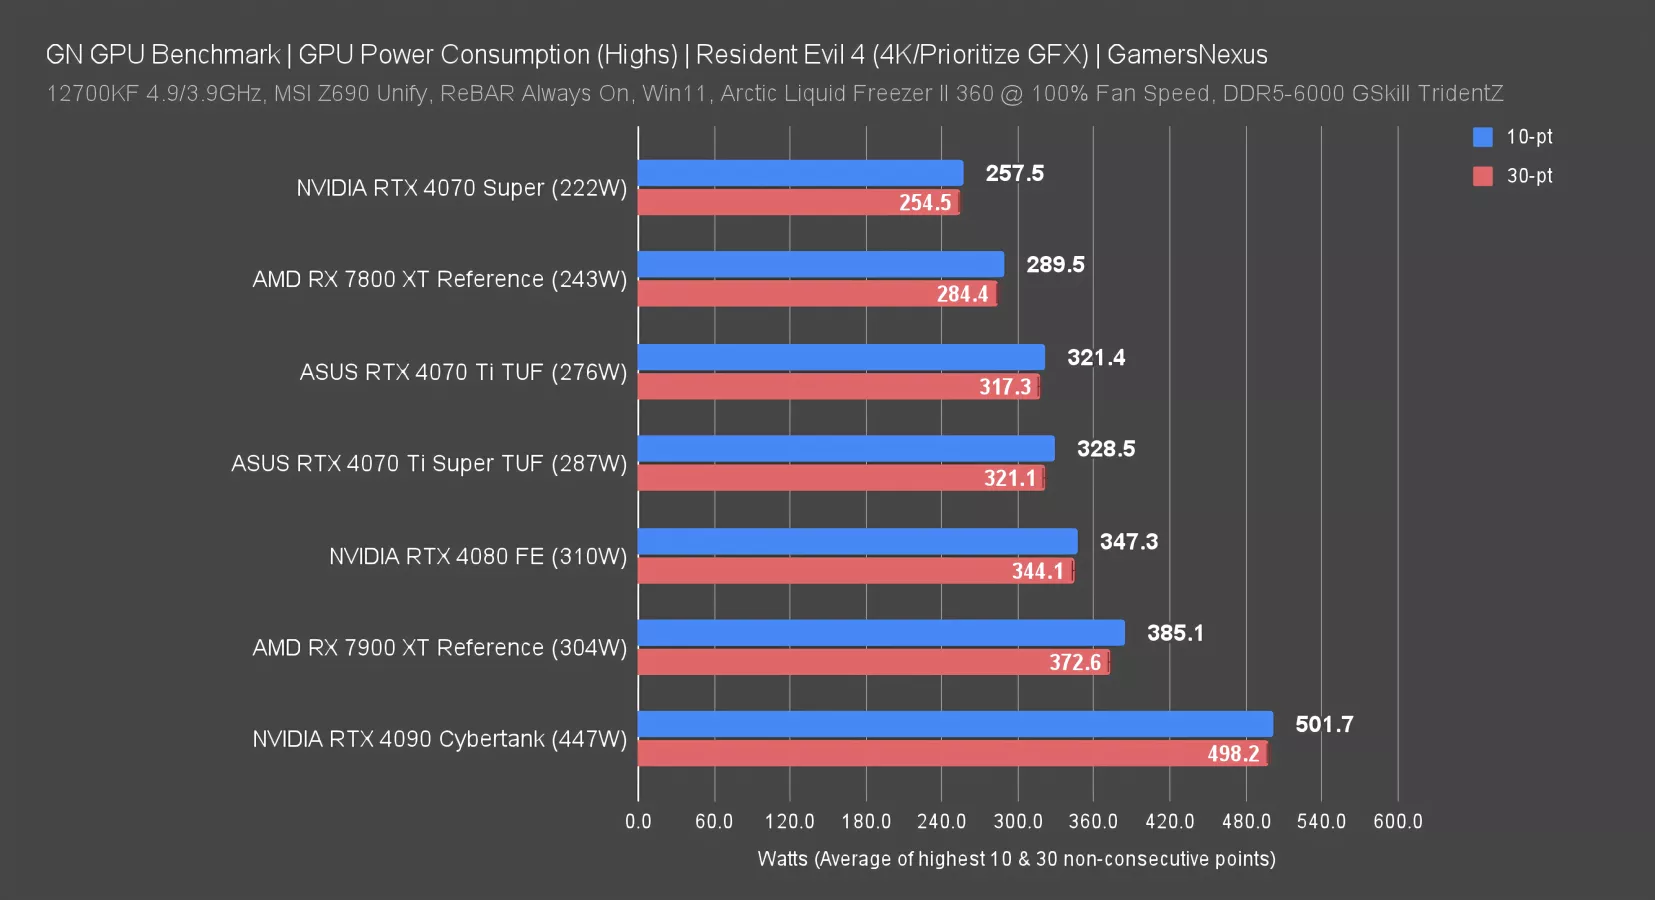
In this chart, we’re looking at just Watts. The RTX 4090 pulled 502W for its average of the highest 10 points of data, with 498W for the highest 30 points averaged. This won’t capture the smallest transients, which will spike higher, but that’s something we’ve looked at separately in the past.
The RX 7900 XT pulled 385W as its 10-point high, with the 4070 Ti Super at 330W to the Ti’s 321W.
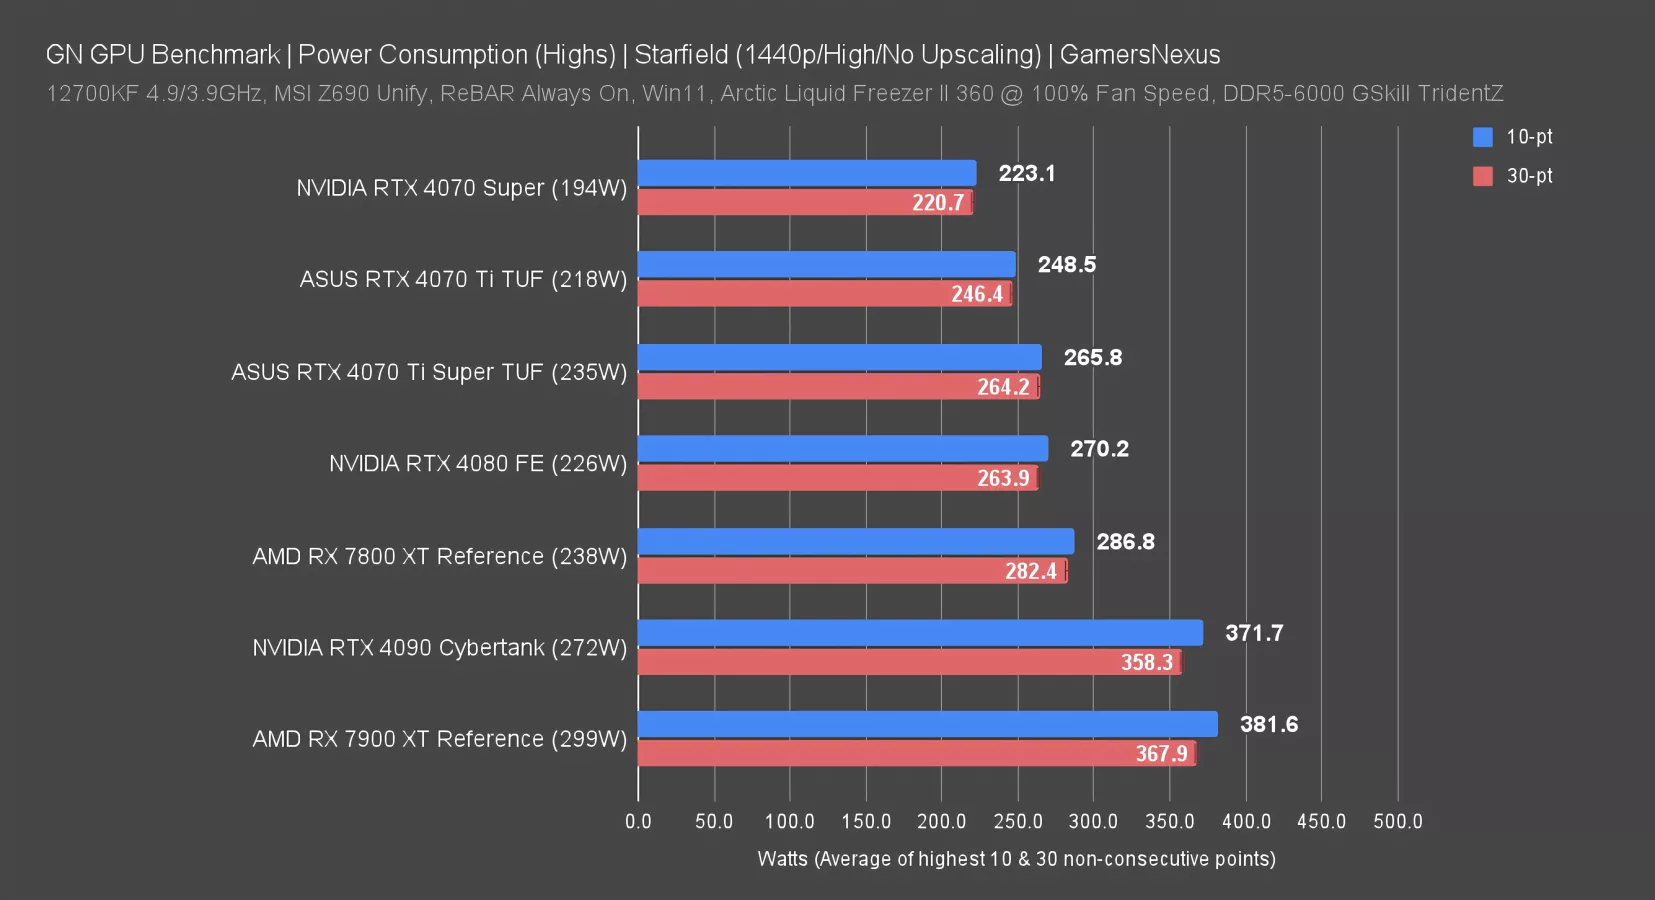
In Starfield at 1440p, that drops to 382W on the 7900 XT, 372W on the 4090 -- which is becoming CPU-constrained -- and 266W on the 4070 Ti Super. The 4080 shows why it was relatively power efficient here.
Summary Charts

That’s the foundation of our efficiency testing. We’re really excited about this and plan to add a ton more to it. We did this in just the past week alongside adding ray-traced Cyberpunk and starting our Alan Wake 2 methodology development, so there’s a ton going on here. But of all that, we think the GPU power efficiency testing is the most promising and has the most room for improvement. It was by no means final -- we’re open to changing all of it.
We’ll start the game benchmarks with some quick summary charts.
RTX 4070 Ti Super vs. 4070 Ti
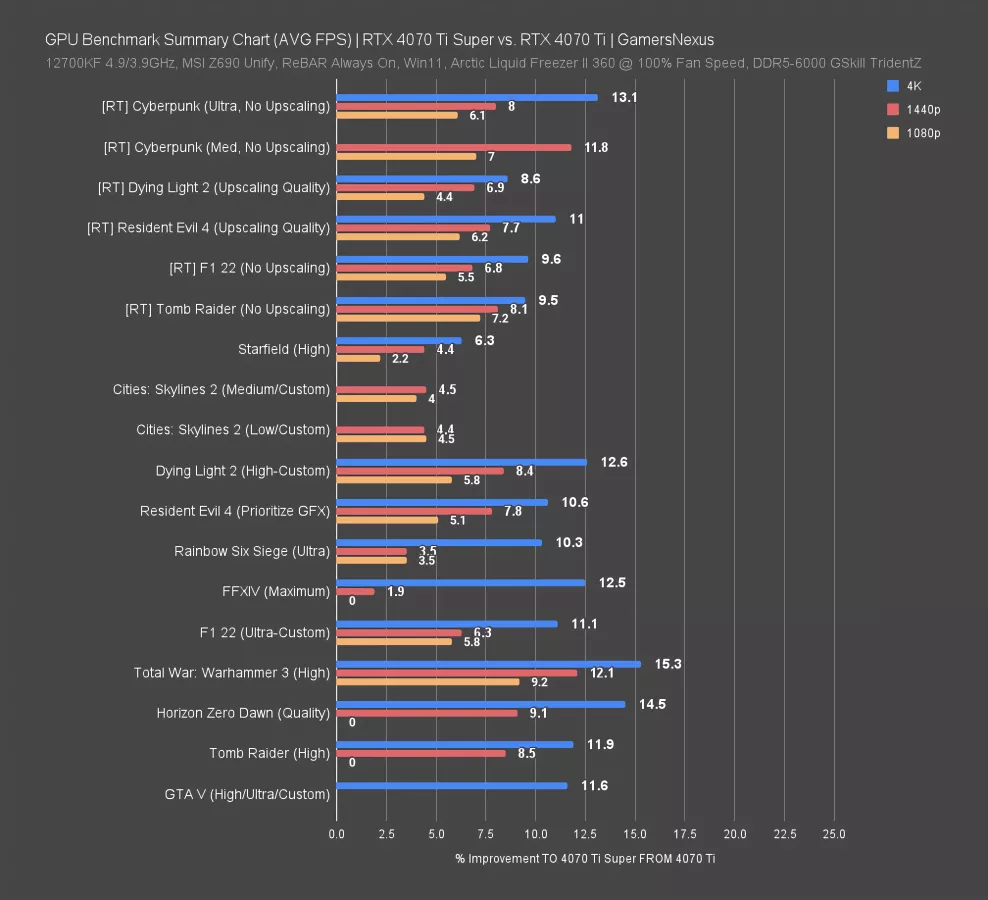
Here’s a summary chart of the 4070 Ti Super vs. the RTX 4070 Ti. The bars indicate percent improvement by moving TO the 4070 Ti Super FROM the 4070 Ti.
In general, we’re seeing about a 10-11% uplift at 4K. Our testing tends to be at highly intensive settings to minimize CPU load, so especially when at 4K, this makes sense with the memory subsystem and framebuffer improvements. Two of the older games here -- Horizon Zero Dawn and Total War: Warhammer 3 -- posted gains higher than we saw elsewhere.
At 1440p, we saw about a 7% average uplift in the 4070 Ti Super vs. the 4070 Ti. That’s not particularly exciting and reduces from the 4K gains because the memory just isn’t as impactful.
At 1080p, we typically saw from 2% to 6% gains, with a few break-outs higher. Generally speaking, it’s around a 5% uplift at 1080p.
RTX 4070 Ti Frequency
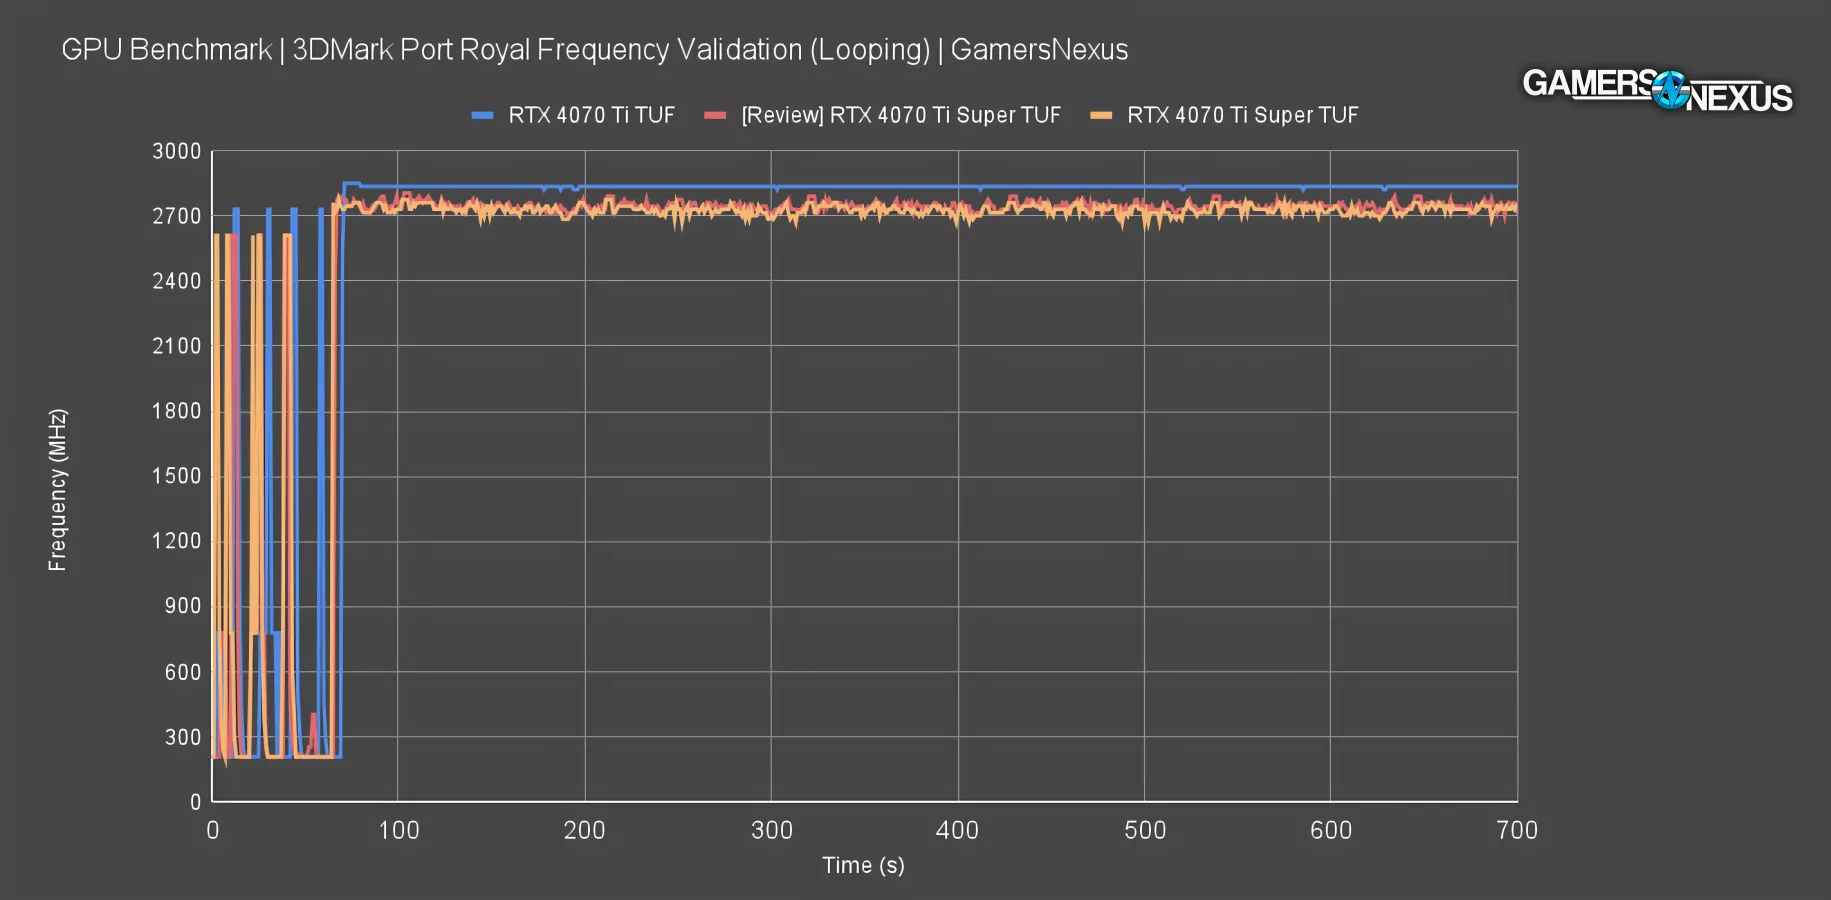
We have two identical 4070 Ti Super cards, so to help validate these, we tested both for frequency in Port Royal. The brief test established an average frequency of 2746MHz for the unit we used for our review, with the more recently tested unit that wasn’t used in the review at 2725MHz on average. This is about a 20MHz delta. That’s within manufacturing variance, but the silicon quality on the unit we chose at random appears to be a little higher than the secondary model that we used for future latency testing.
(RT) RTX 4070 Ti Super vs. RX 7900 XT
Now for the RX 7900 XT vs. the RTX 4070 Ti. We broke this into RT and non-RT, as the scale slides opposing directions and we’d prefer to do as much of that math in a single direction (percent improvement) as possible, just to keep it clean. That said, even when it is negative, because the numbers are so tight, it’s typically within 0.5% whether you calculate in the direction of improvement or loss.
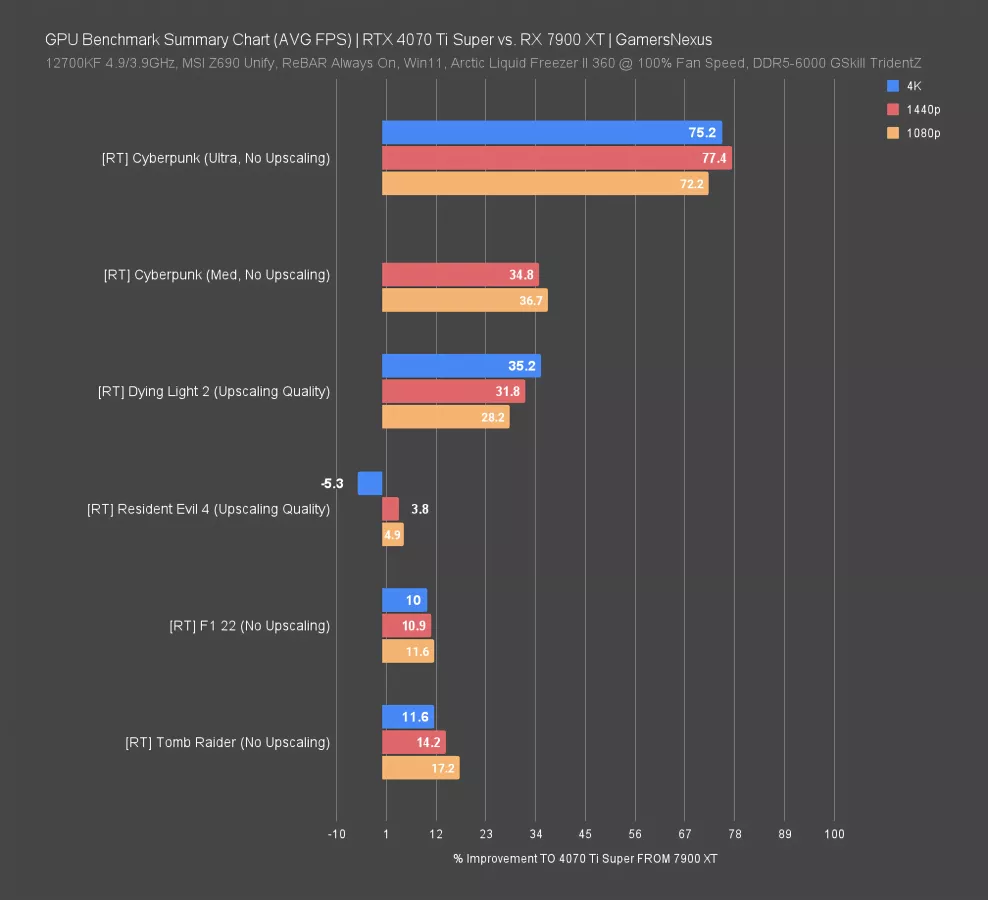
Regardless, the RT performance strongly benefits the RTX 4070 Ti Super. We noticed that Cyberpunk scales more heavily in favor of NVIDIA as all graphics settings increase. With customized ultra settings and without upscaling, we found the 4070 Ti Super was typically in the 70+% range for its lead over the 7900 XT.
With Cyberpunk using medium settings instead, we saw halved gains down at 35% for the 4070 Ti Super over the 7900 XT. As RT workload amplifies, the favor for NVIDIA likewise seems to disproportionately amplify.
In less intensive scenarios, the lead is below 20%. There’s one 4K upscaled result favoring the 7900 XT in Resident Evil 4, which progressively moves toward NVIDIA favor as resolution decreases.
(Non-RT) RTX 4070 Ti Super vs. RX 7900 XT
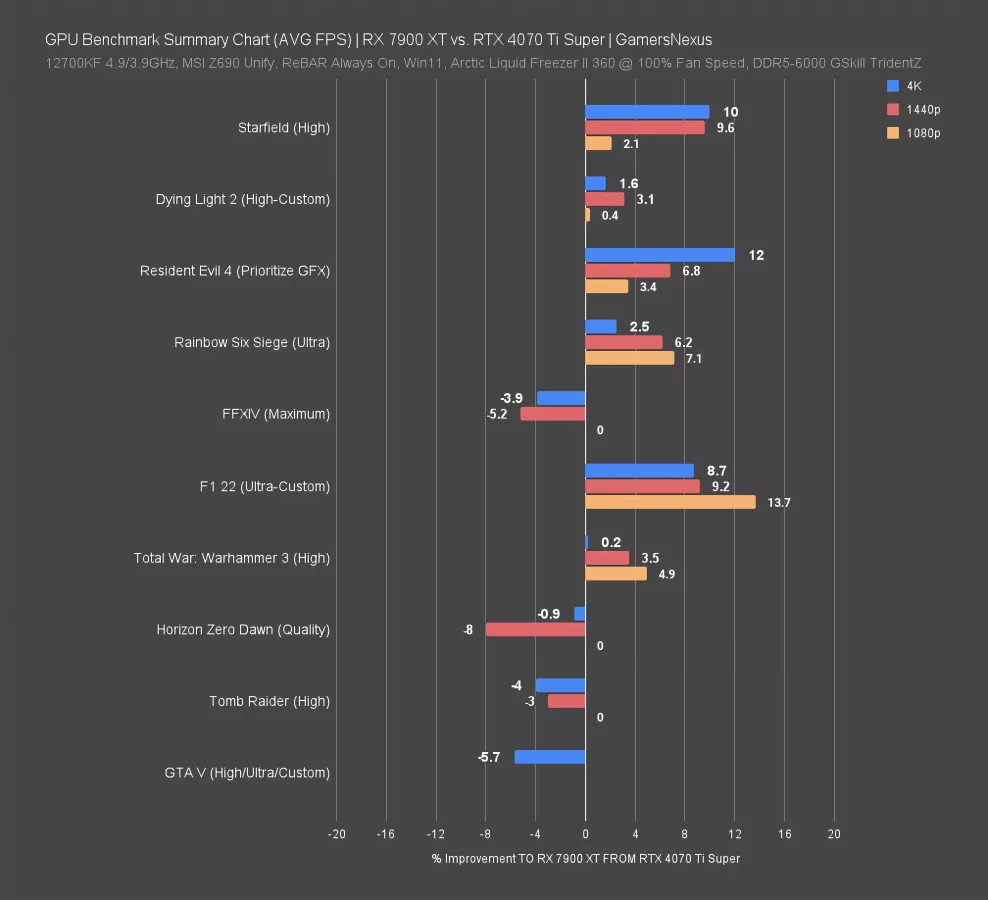
In non-RT workloads, switching the chart to show TO the 7900 XT FROM the 4070 Ti Super, we see the 7900 XT starts pulling ahead on average. Depending on resolution, it’s anywhere from equal to 14% ahead, with losses toward the bottom of the chart.
RTX 4070 Ti Super Game Benchmarks
Time to move into the specific game benchmark charts. We have a lot of cards on here. Depending on which chart you look at, we go back to the 2070, the 1080 Ti, 3060 variants, and more. Let’s get into those charts.
Starfield
4K Benchmarks
Starfield is up next, another of our 2023 titles with 2024 patches to test.
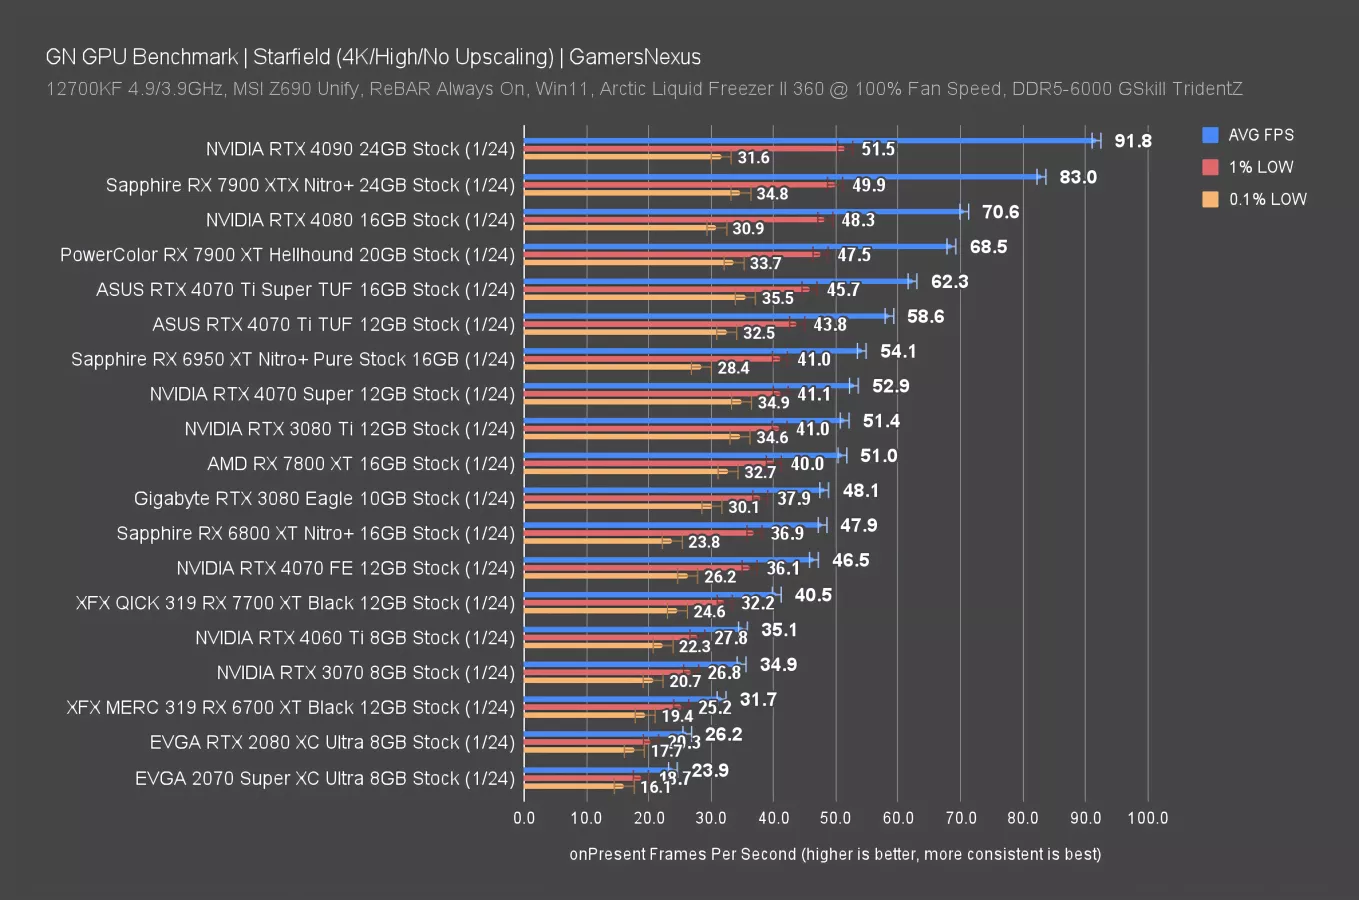
At 4K, the RTX 4070 Ti Super landed at 62FPS AVG, with lows proportional and well-timed. That has it ahead of the 4070 Ti by a relatively uneventful 6.3%. The lead over the 4070 Super is 18%, and compared to some cards you might upgrade from, it’s ordered as follows: 79% over the RTX 3070 and 161% over the RTX 2070.
The RX 7900 XT leads the 4070 Ti Super by 10%, so AMD is still leveraging its advantage in this particular game and has a wider lead than it does in some others. And just for reference, the 4090 leads the 4070 Ti Super by 47% here, at 92FPS AVG.
1440p Benchmarks
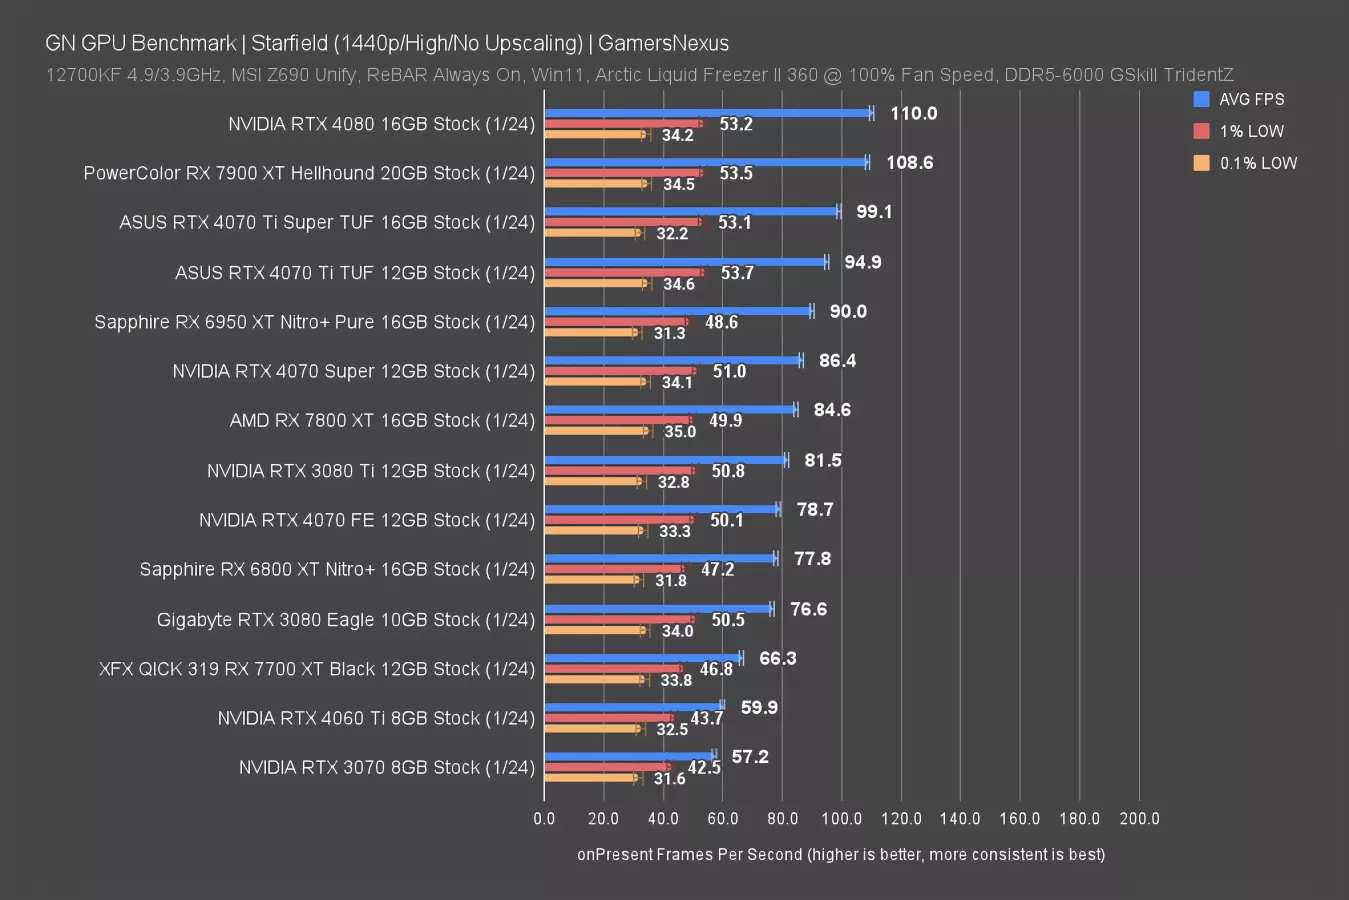
At 1440p, the 4070 Ti Super still has full scaling in this benchmark. Its lead over the non-Super variant’s 95FPS AVG is just 4.4% now, down from the already low 6% at 4K. The Ti Super now only leads the 4070 Super by 14.7%, even less exciting than before.
Resident Evil 4
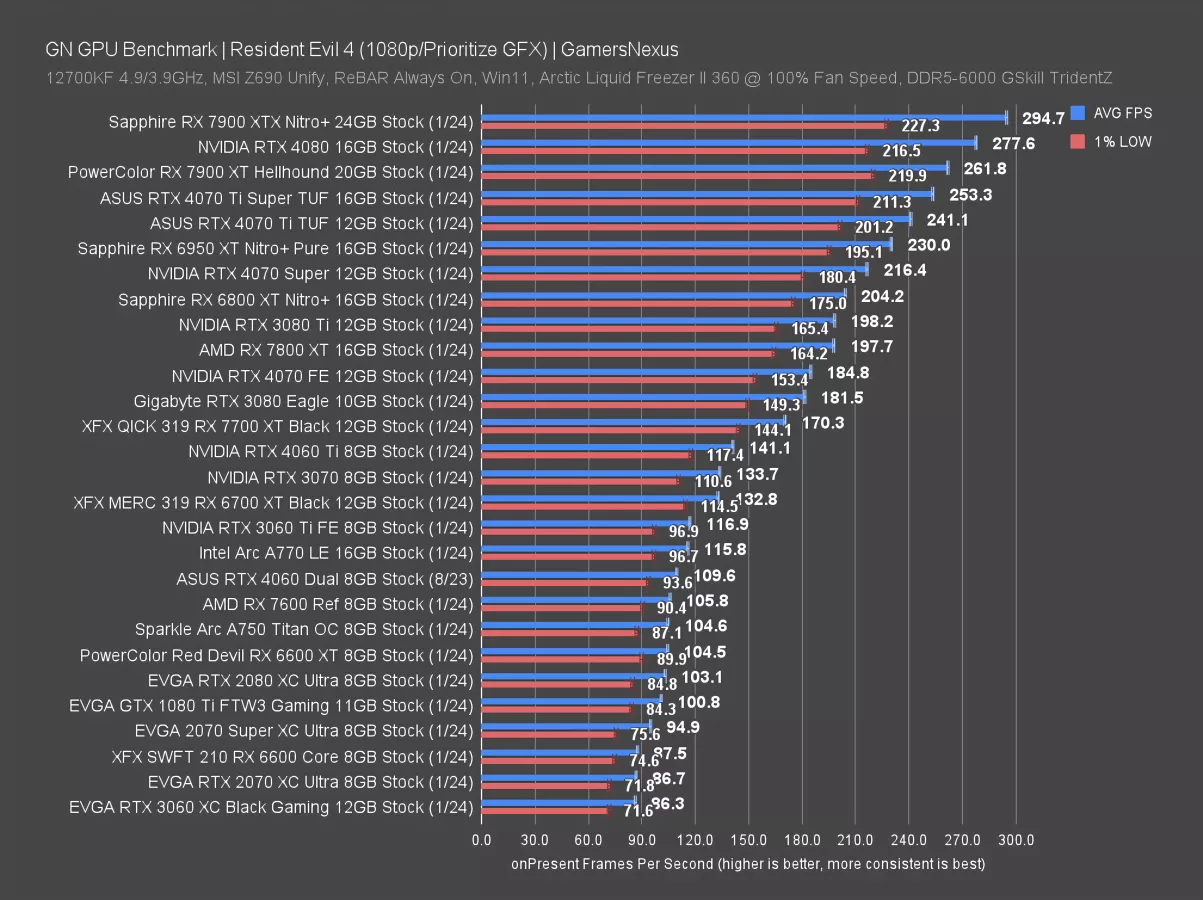
4K Benchmarks
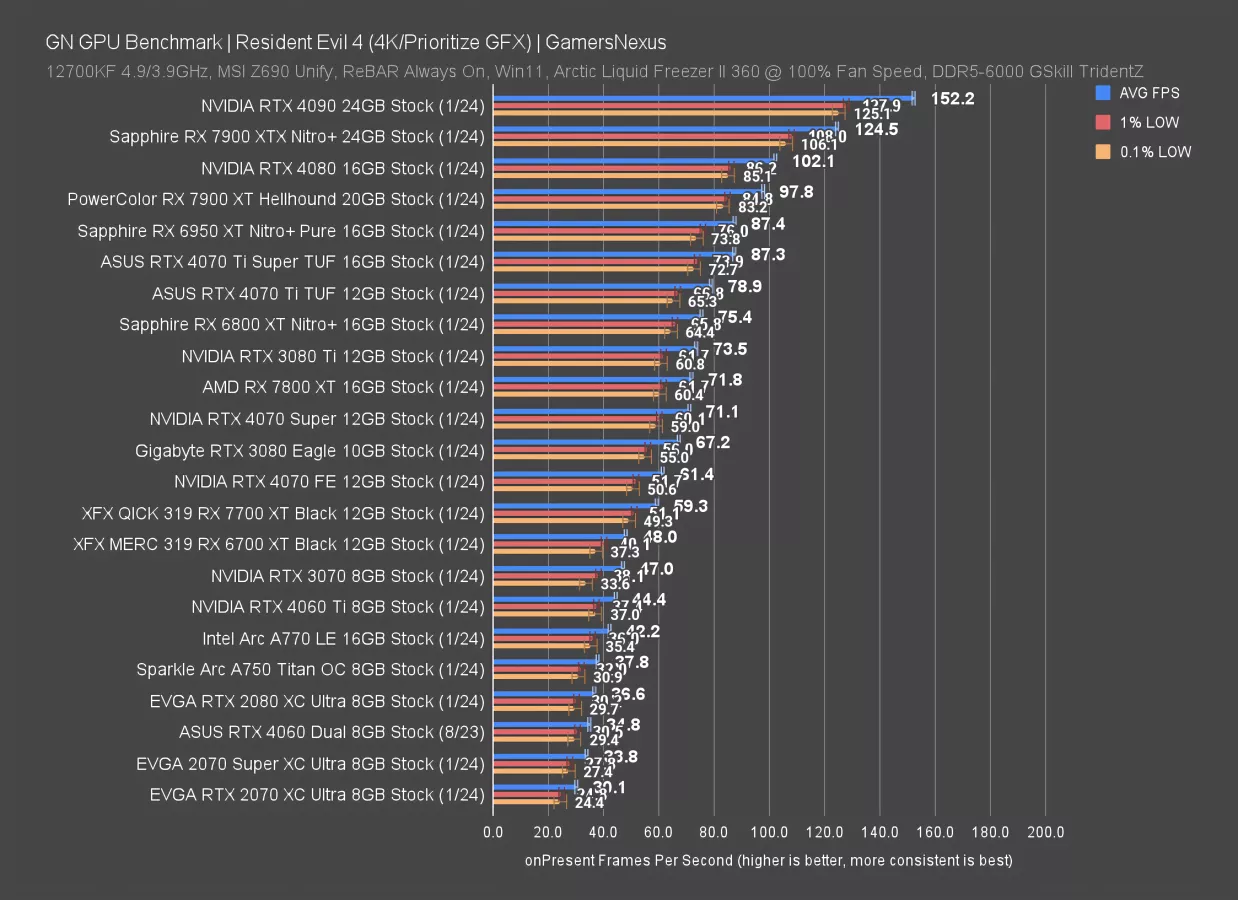
Resident Evil 4 is another 2023 game that we’ve added recently. In this one, tested at 4K and rasterized first, the 4070 Ti Super ran at 87FPS AVG and led the 4070 Ti by 10.6%, with the 7900 XT leading the Ti Super by 12%. The 4080 is just ahead of that.
Looking down the stack, the 6800 XT remains one of the most powerful and viable options at the $500 mark -- assuming it’s still there when this goes up -- in certain games. On the NVIDIA side, the Ti Super leads the new RTX 4070 sans-Ti Super, at 71 FPS, by 23%. Over possible upgrade pathways, the lead over the 3070, 2070 non-Super, and 2080 is significant, respectively at 86%, 190%, and 139%.
1440p Benchmarks
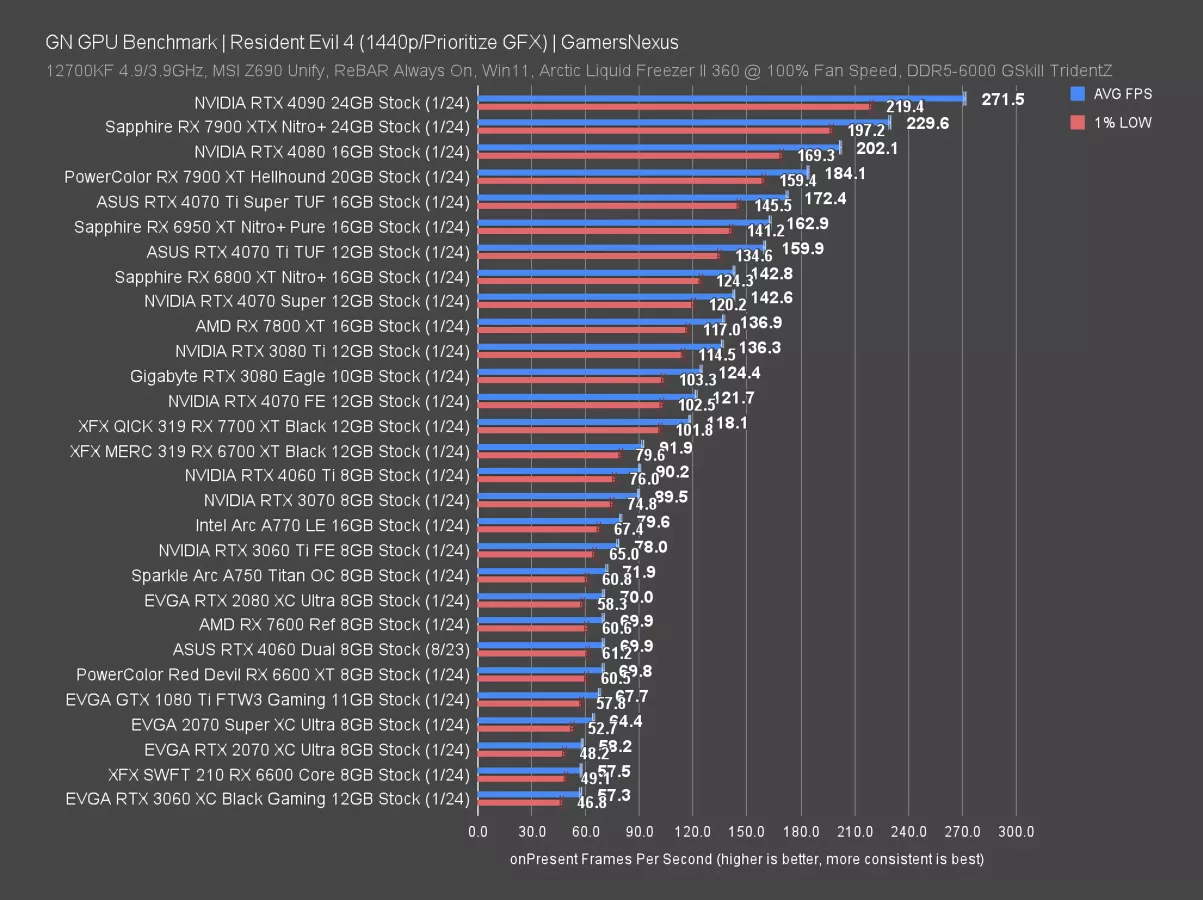
Scaling is clean at 1440p. Lows are proportional, so since the 0.1% lows don’t indicate anything noteworthy here, we’ve removed them to instead accommodate more GPUs on this chart. That’s the trade-off.
The 4070 Ti Super’s 172FPS AVG has it 7.8% ahead of the 4070 Ti, reduced from the 10.6% result at 4K. Scaling tightens as resolution falls.
The 4070 Ti Super is still bested by the 7900 XT, this time by 6.8%. This chart added a bunch of mid-range cards from ages past, so for some potential pathways: The RX 6600 at 58 FPS AVG, the 6600 XT at 70 FPS AVG, the 3060 XC at 57 FPS, and the 3060 Ti at 78 FPS would see an improvement, respectively, of 200%, 147%, 201%, and 121%.
1080p Benchmarks
At 1080p, the 4070 Ti Super is still scaling with the CPU. It’s at 253FPS AVG, leading the 4070 Ti by 5.1%, predictably less than at 1440p and 4K. The 7900 XT’s lead also reduces here, down to 3.4%.
Dying Light 2
4K Benchmarks
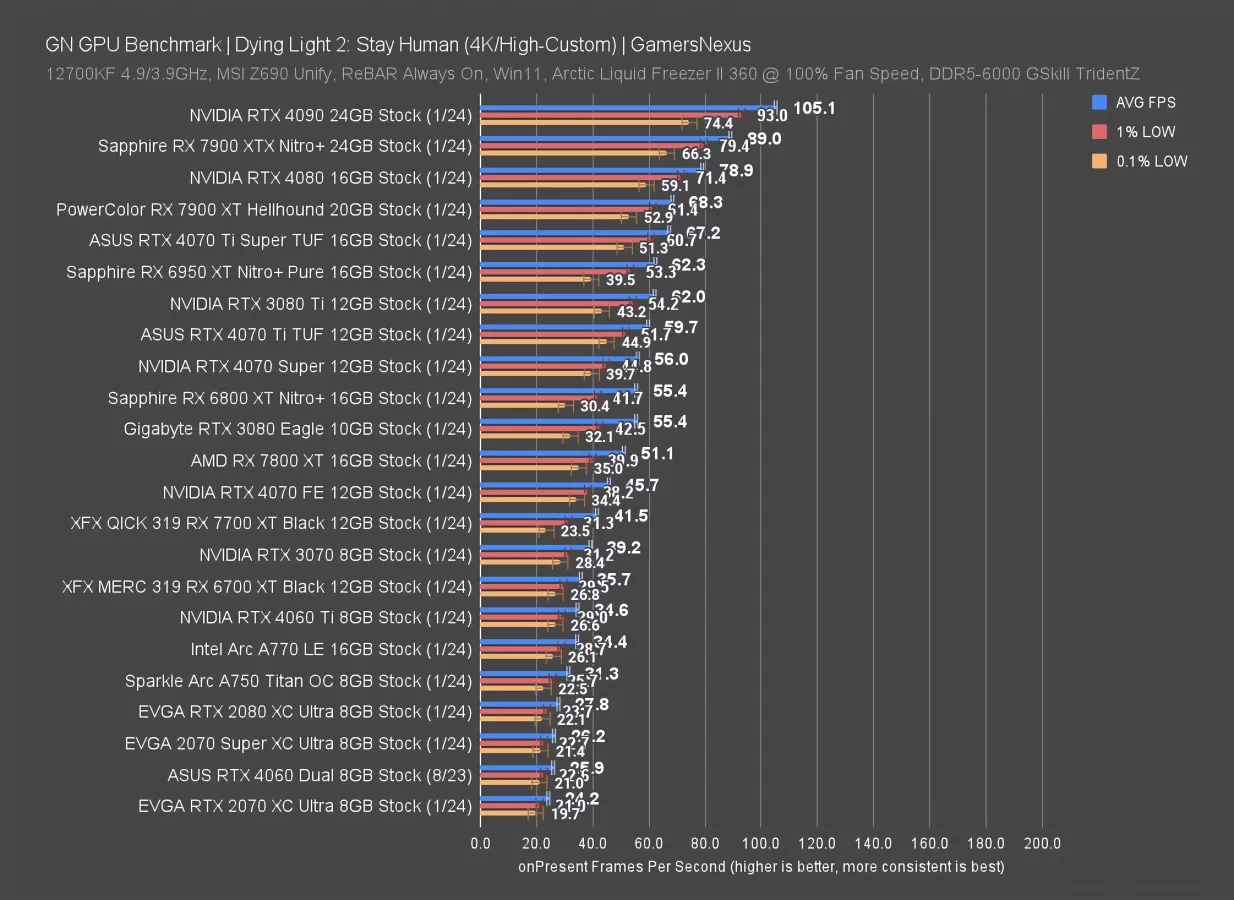
Dying Light 2 is a 2022 game. Tested at 4K first, the 4070 Ti Super leads the 4070 Ti by 12.6%, better than we saw in the last game. The 7900 XT is about equal with the 4070 Ti Super and can’t be told apart at a functional level.
Owners of the 2070 non-Super would see massive gains under these test conditions, at about 178% -- a lot of that is from the intensive 4K load that the 2070 is struggling with. The 2080 would likewise get multiples of uplift. Alternatives to the 4070 Ti Super might include the RX 7900 XT at equivalent performance or the 4070 Super at reduced performance, which achieves 83% of the performance of the Ti Super. The RX 6800 XT would be another option here and is one that has aged relatively well with its price drops.
1440p Benchmarks
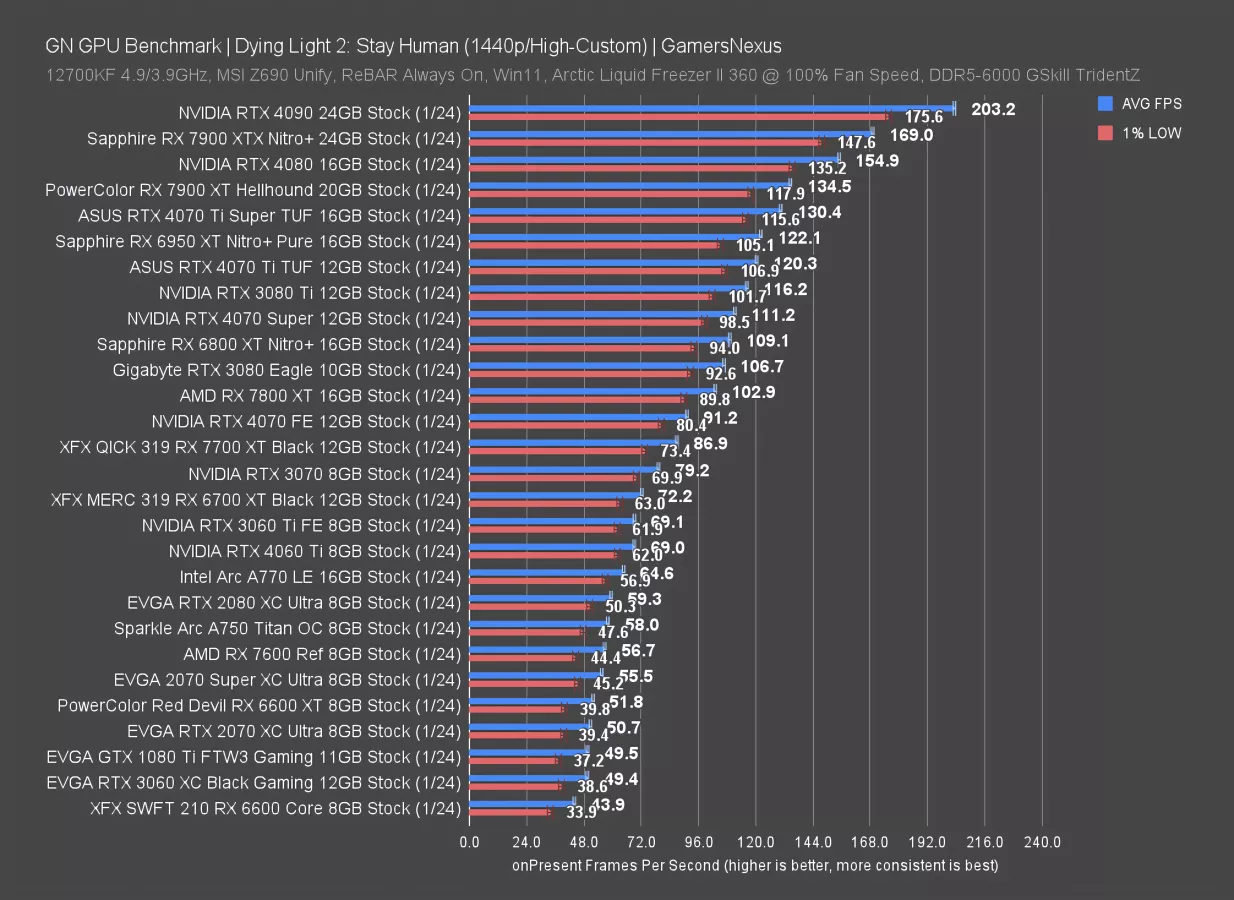
Up next is 1440p. 0.1% lows scaled perfectly fine with this, so we removed them to permit space for cards on the chart.
This includes fresh retests of the RX 6600, 6600 XT, and 6700 XT. In this test, the 4070 Ti Super’s lead over the 4070 Ti is reduced to 8.4%, with gains against the 6600 XT and 6600 at 152% and 197%, respectively. Alternatives still include the 7900 XT, ahead by 3.1%, the 4080 more meaningfully ahead -- but we’d advise strongly against a 4080 given the 4080 Super’s inbound status and lower price -- and the 4070 Super at 85% of the performance of the 4070 Ti Super.
1080p Benchmarks
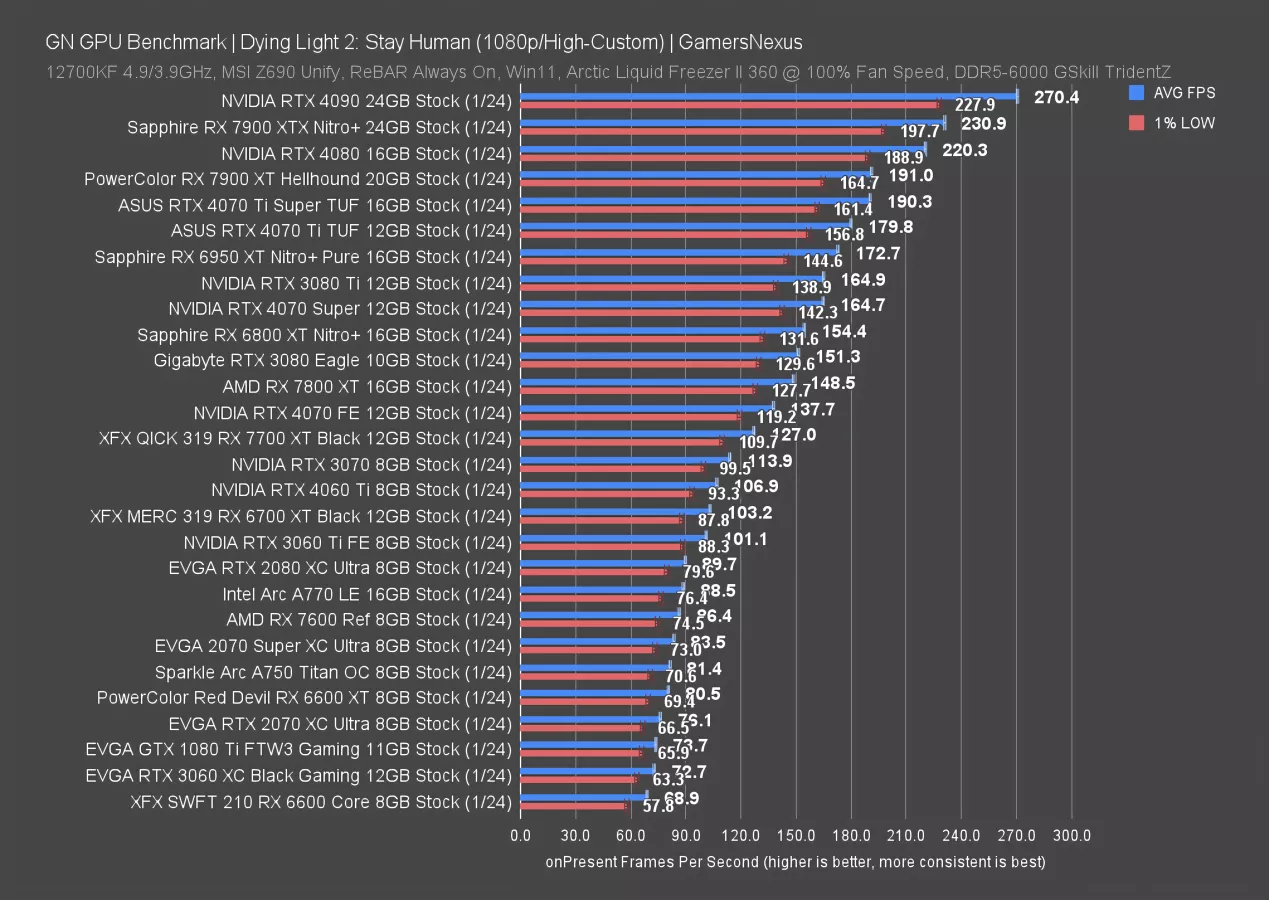
At 1080p, the 4070 Ti Super’s lead over the 4070 Ti is even lower, now at 5.8%. The 7900 XT is now tied, so its lead has also fallen. Scaling is clean from a test standpoint, but this isn’t particularly interesting, so we’ll just move forward.
Shadow of the Tomb Raider
4K Benchmarks
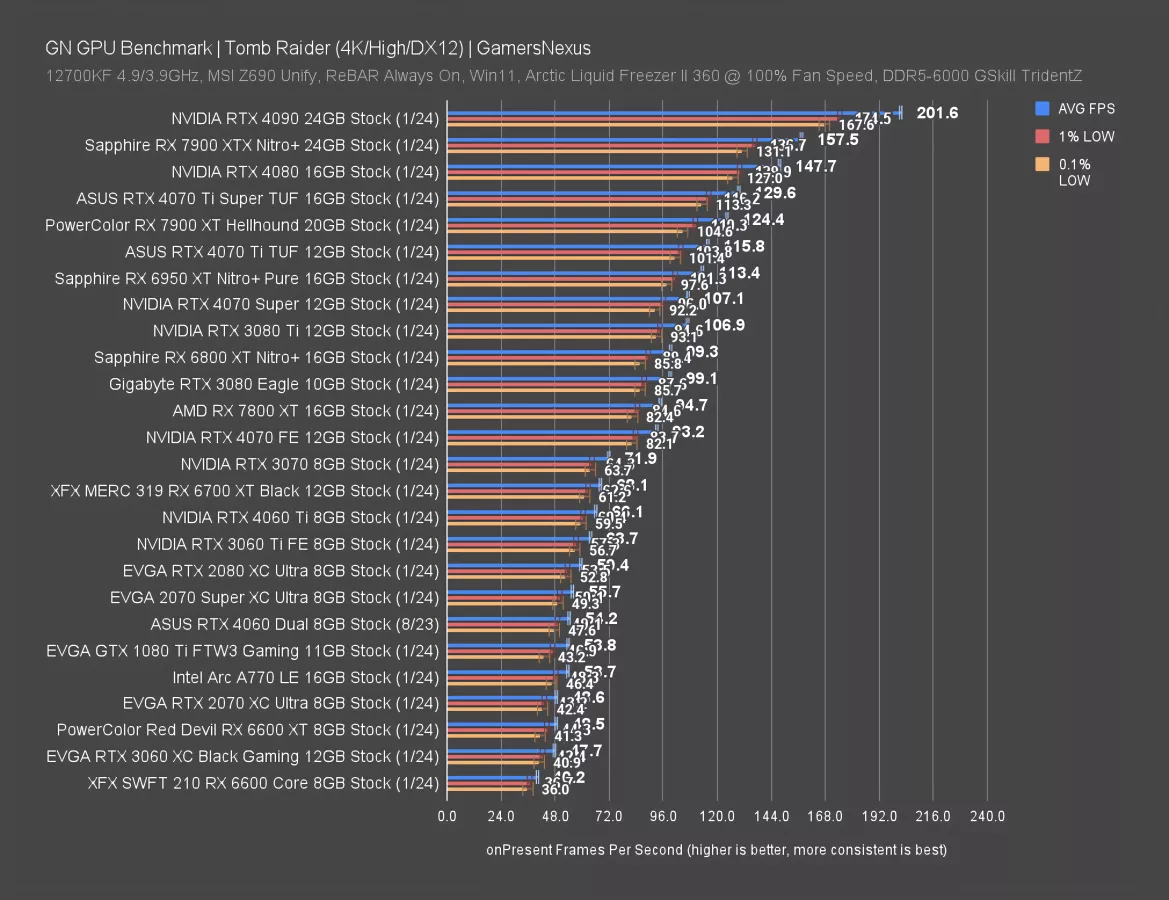
We’re moving on now to our set of benchmarks we keep around for reliability and long-term validation, as the numbers rarely change for these.
In Tomb Raider at 4K, the 4070 Ti Super TUF leads the 4070 Ti by 12% and is roughly tied with the RX 7900 XT. For upgrade references: The lead over the 2070 XC is 167%, the same over the RX 6600 XT and RTX 3060 XC.
1440p Benchmarks
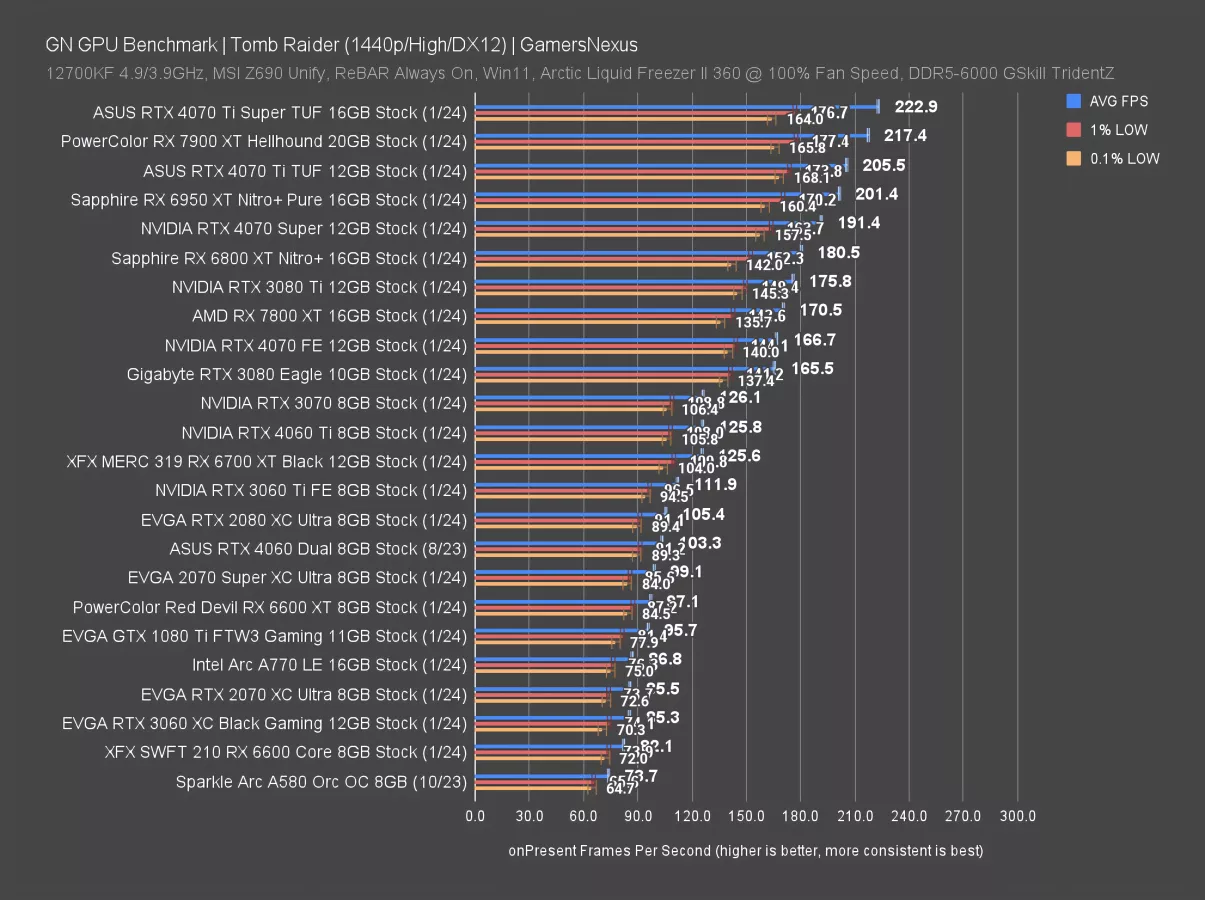
At 1440p, the 4070 Ti Super led the 4070 Ti by 8.5%, posting full scaling, with the lead over the new 4070 Super at about 16.5%. Compared to older generation cards you might upgrade from, options include a doubling over the RTX 3060 Ti and RTX 2080, a 171% boost over the RX 6600 non-XT at 82FPS, and similar over the original RTX 3060.
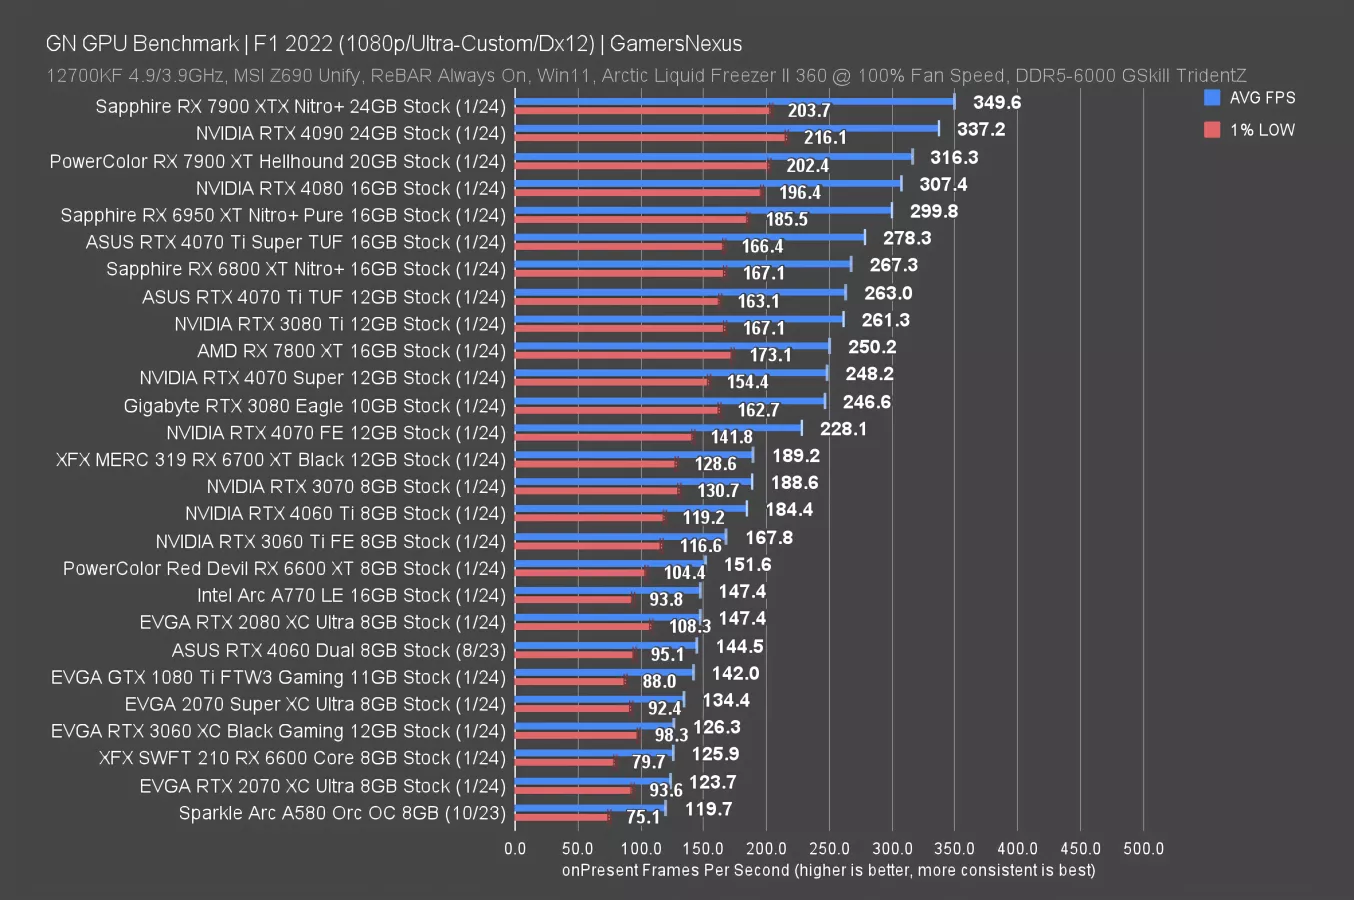
F1 2022
4K Benchmarks
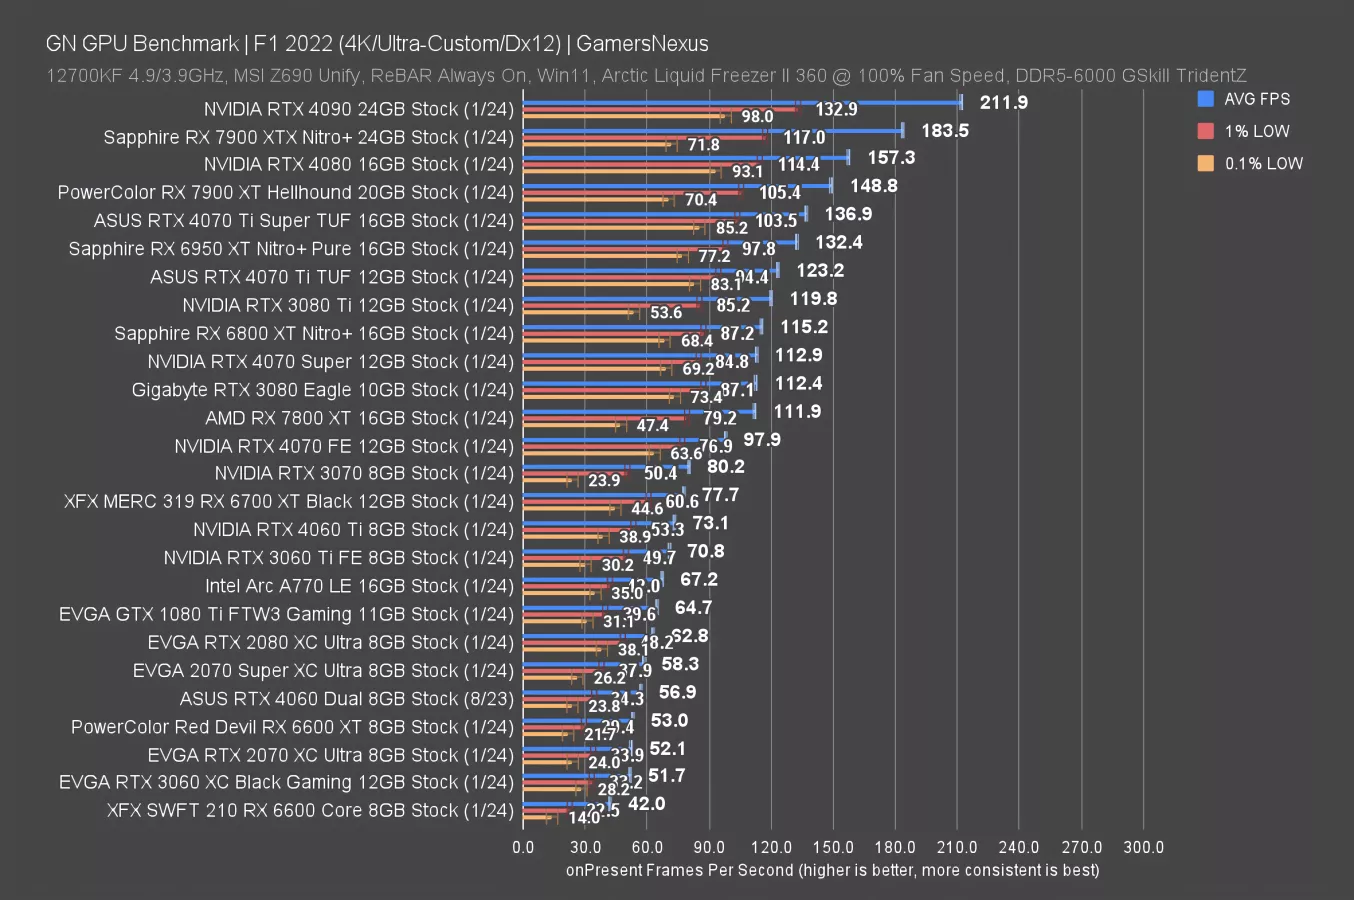
In F1 22 at 4K, the RTX 4070 Ti Super ran at 137FPS AVG, leading the 4070 Ti by 11%. That has the 7900 XT ahead of the 4070 Ti Super by 8.7%, with the 4080 past that. Compared to upgrade options, the lead of the 4070 Ti Super over the 2070 XC is 163% against the 52FPS AVG result. It’s about the same boost from the RX 6600 XT and RTX 3060 XC.
Alternatives might include the 4070 Super, which achieves 82% of the performance of the Ti Super for 75% of the price, or the 6800 XT, which achieves 84% of the performance for 63% of the price in this game -- though that changes with RT.
1440p Benchmarks
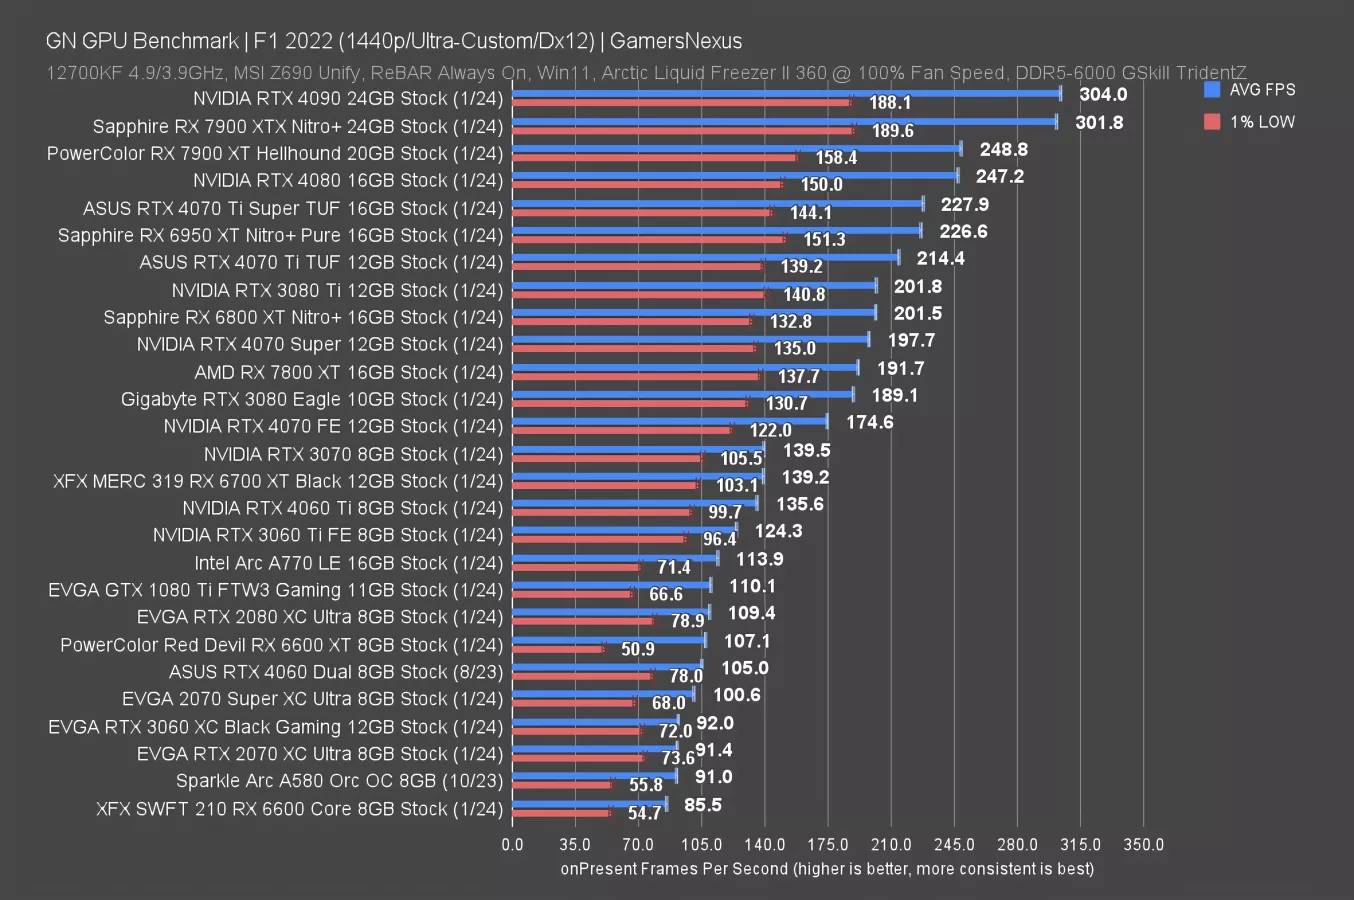
At 1440p, the 4070 Ti Super posts full scaling at 228FPS AVG, leading the 4070 Ti by 6.3% -- a reduction against 4K, despite unbound scaling. The 7900 XT is closer to the 4080 than the Ti Super, meanwhile the 4070 Super gives the Ti Super a 15% lead. Bringing upgrades back into the picture, 1080 Ti users would gain more than double the framerate, although the 1080 Ti is still plenty good for a lot of rasterized games, and RX 6600 users would jump 167% from 86FPS AVG.
1080p Benchmarks
We’re still not CPU-bound at 1080p for the 4070 Ti Super. The Ti Super leads the Ti by 5.8% now and the 4070 Super by 12%. The 7900 XT has climbed the ranks a little and established a 14% lead over the 4070 Ti Super.
Revisiting those upgrade options: The 2070 was down at around 120FPS AVG, so there’d be a huge boost here, with the 3060 at 126FPS AVG, the 1080 Ti at 142, and the 6600 XT at 152FPS AVG. In any of these scenarios, the Ti Super would be a big jump, with RT jumping more. Whether or not that’s worth it really depends on the games you play. If you’re not playing heavier, newer games, then it’s less likely to be critical.
Rainbow Six Siege
4K Benchmarks
Rainbow Six Siege is up now. We ran efficiency tests for this up above, but the FPS numbers weren't taken from this chart (they were taken separately since we had background tasks for efficiency).
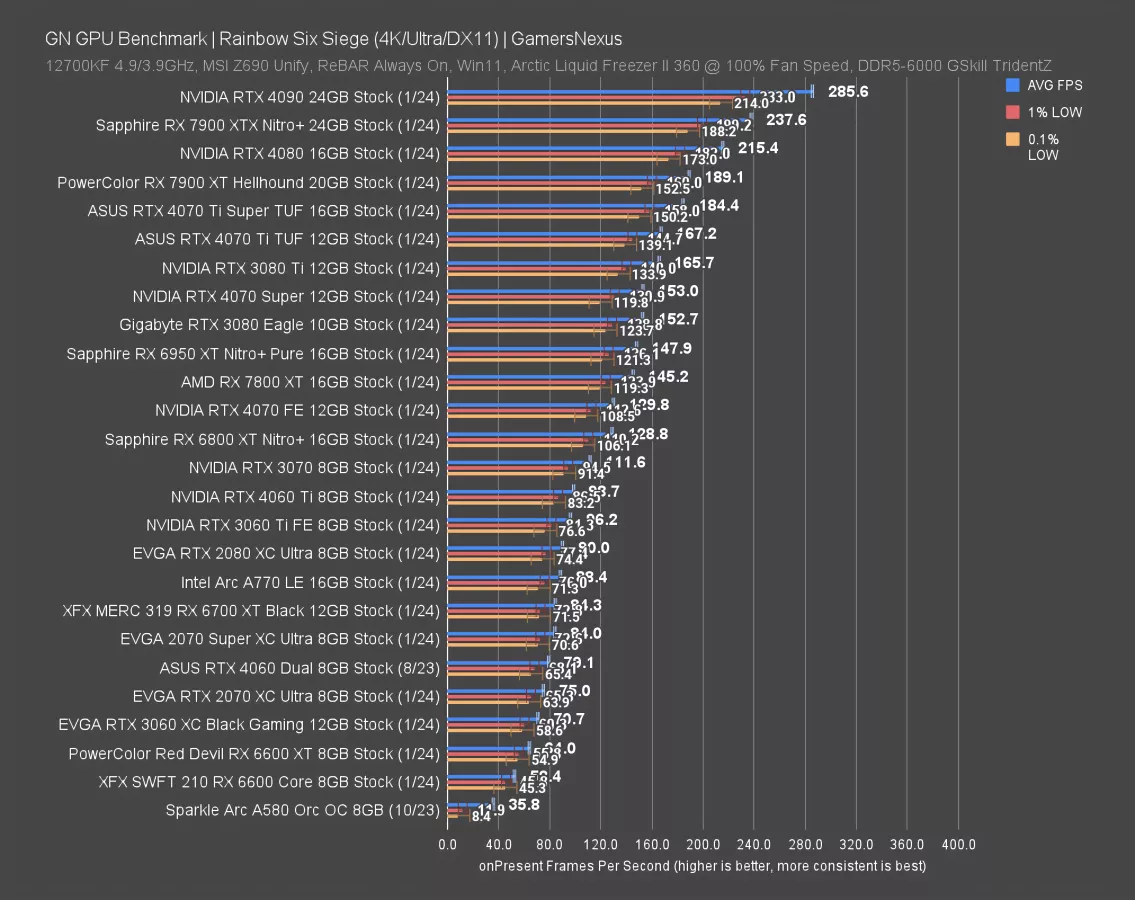
The 4070 Ti Super’s 184FPS AVG had it 10% ahead of the 4070 Ti and 21% ahead of the 4070 Super. AMD’s 7900 XT puts up a strong fight here, technically -- but not particularly noticeably -- outpacing the 4070 Ti Super. Price is what’ll matter there.
Compared to the 2070 Super at 84 FPS AVG, we’re seeing a 120% improvement in the Ti Super. The 3060 isn’t distant from that math, down at 71FPS AVG.
1440p Benchmarks
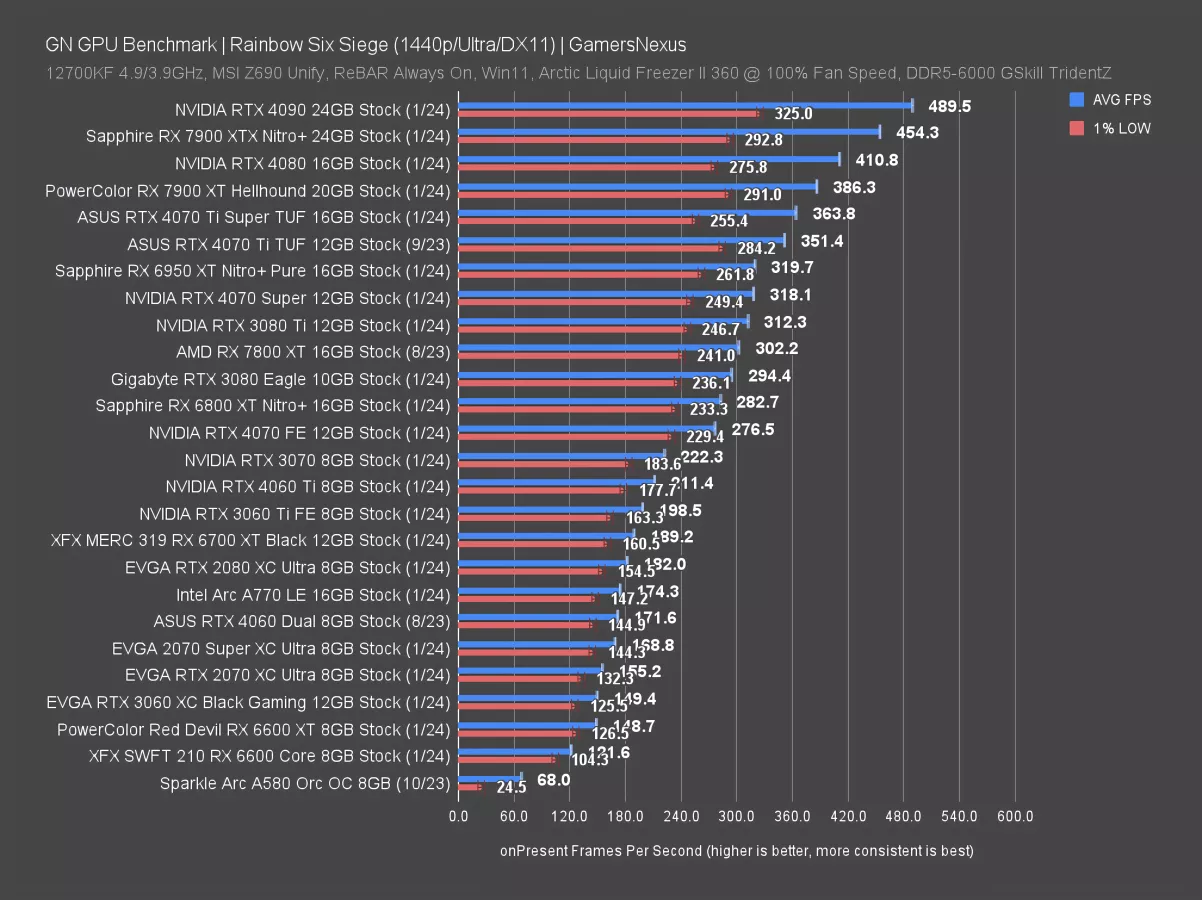
1440p reduces the Ti Super’s lead to just 3.5% over the 4070 Ti, an unexciting move. The 7900 XTX and 4090 indicate that we still have plenty of CPU headroom, so this is an unfortunately real, boring change from the 4070 Ti. There’s no point spending more time here: It does not meaningfully move the needle from the 4070 Ti, but certainly arrests its price.
FFXIV
4K Benchmarks
Final Fantasy 14 is up now.

The 4070 Ti Super ran at 129FPS AVG here, establishing a 15FPS lead over the 4070 Ti, or about 12.5%. The 7900 XT sits close to the Ti Super, but behind it -- and AMD has worse 0.1% lows in this game than would be proportional to the average.
Against the 4070 Super, the Ti Super is 23% better, and against the baseline RTX 2070, it’s 178% improved. We haven’t retested it in a while, but the RTX 2060 is on this chart as a point of reference. Its framerate may have moved slightly in the past year, but we don’t see many meaningful gaps developing with this game, at this point.
GTA V
4K Benchmarks
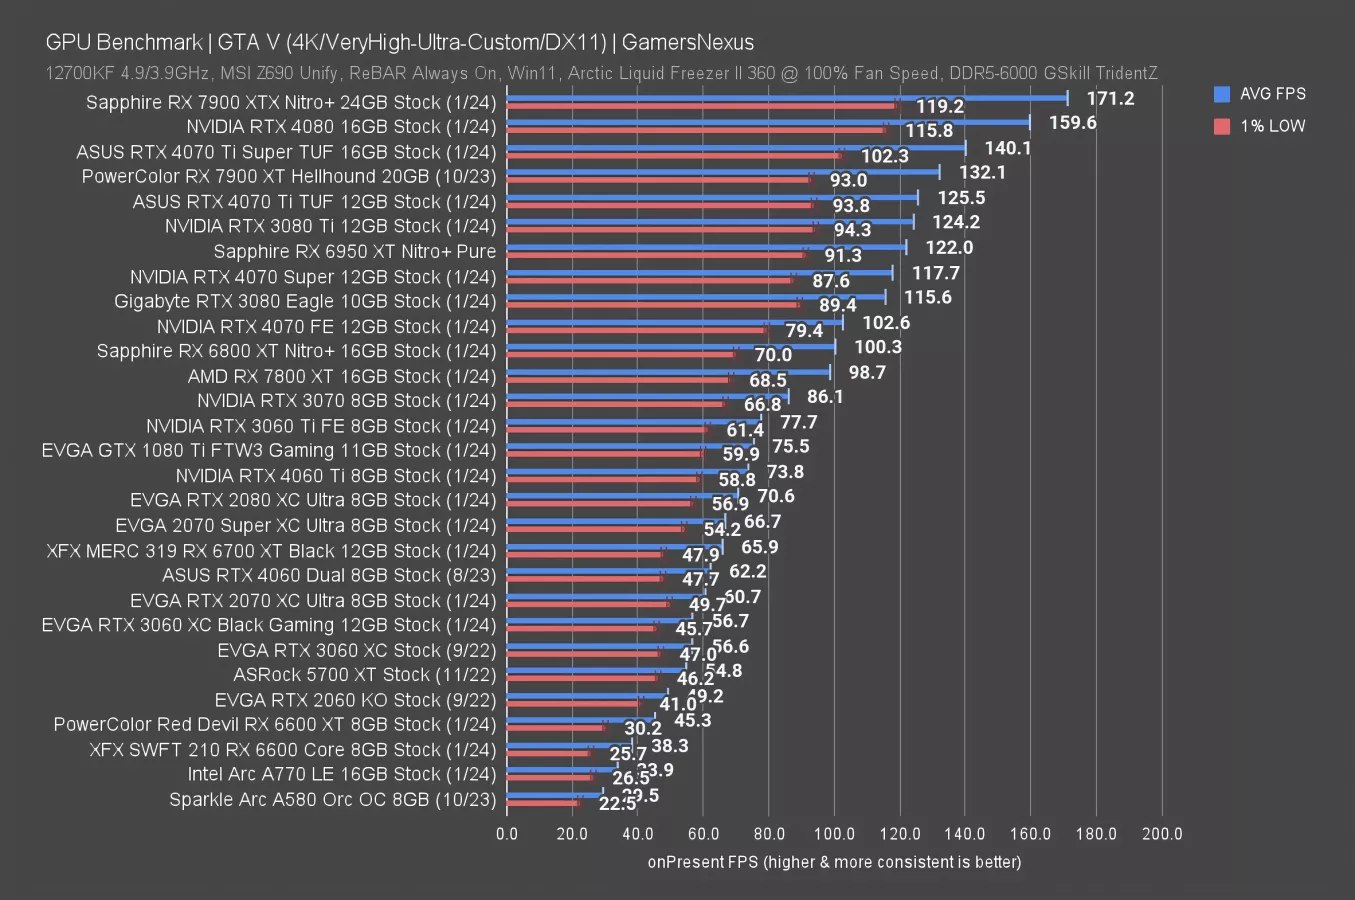
Finally for the old reliable benchmarks, GTA V at 4K has the 4070 Ti Super at 140FPS AVG, leading the 4070 Ti by 11.6% and the 4070 Super by 19%. If you bought an RTX 2060 when it launched, an upgrade here would yield a 185% uplift. The 7900 XT is just behind the Ti Super here.
RTX 4070 Ti Super Ray Tracing Benchmarks
Ray Tracing - Cyberpunk 2077

Benchmarks
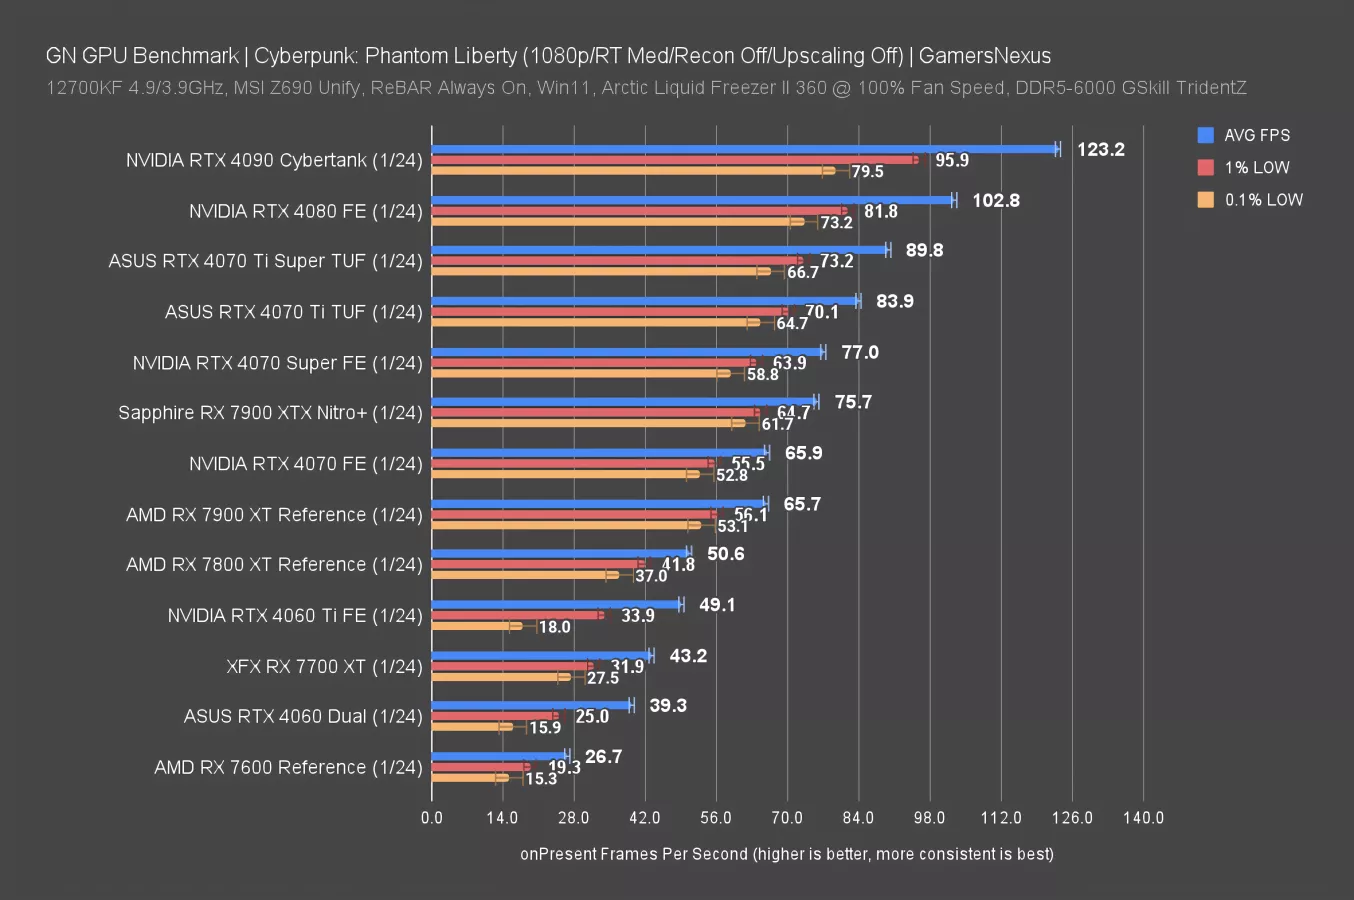
We’ll open our ray tracing testing with Cyberpunk: Phantom Liberty, which was only just added to the test suite and therefore has fewer cards than the RT tests we’ll look at next. We’re iterating and adding to this each review. All of these tests were conducted in the last two days and were done across two groups of settings: The first batch uses RT Ultra with upscaling disabled, ray reconstruction disabled, and overdrive off. The second batch uses a much lighter RT Medium, which we found to have lower scaling impact overall and more favorable -- but still weak -- AMD performance. AMD’s performance deficit widens as RT load increases.
Here’s the chart.
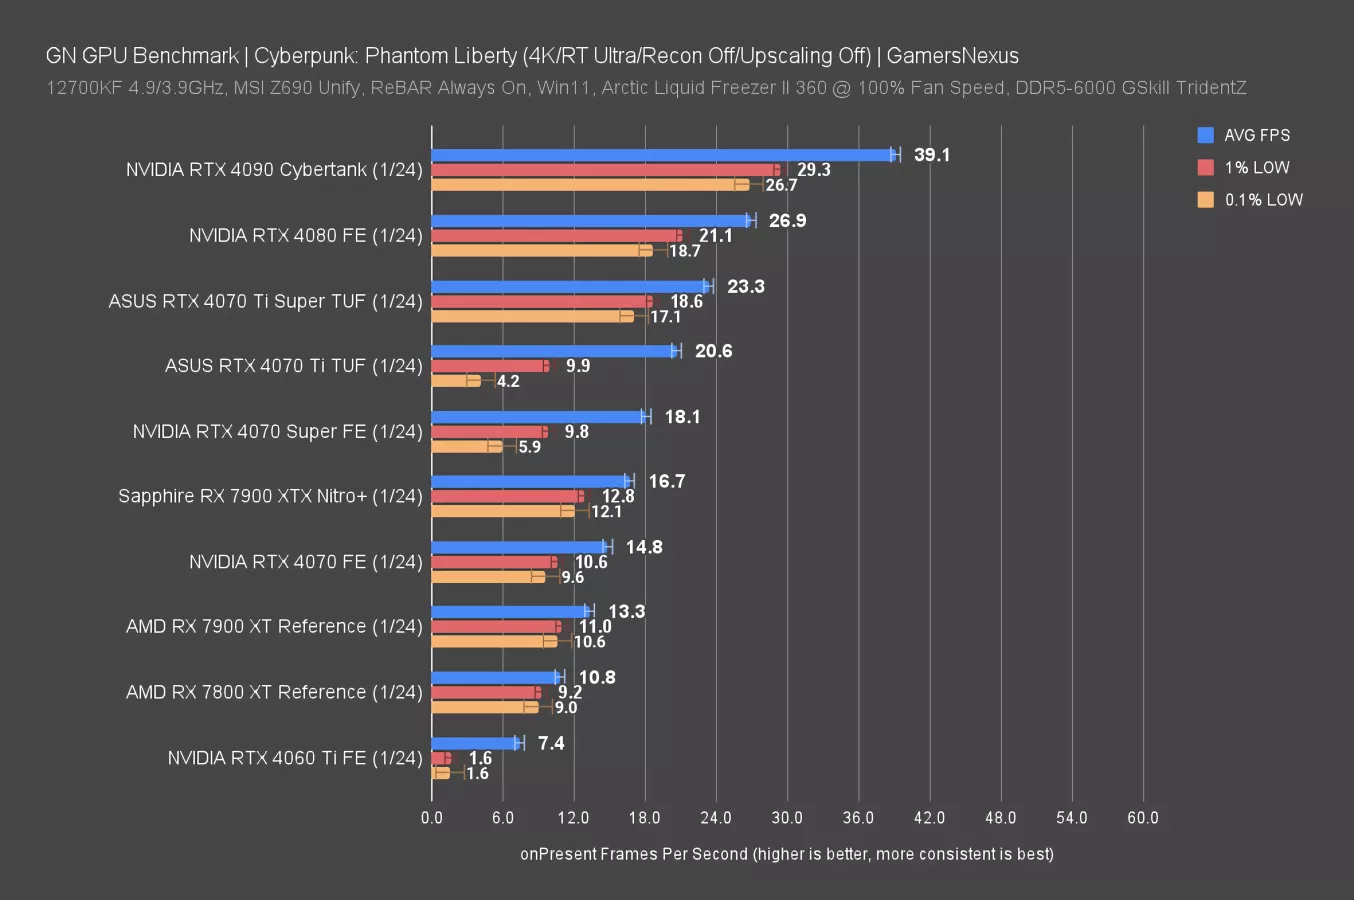
At 4K first, the RTX 4070 Ti Super ran at about 23 FPS AVG. This average is low, but the lows are spaced proportionally and well as compared to the average; despite being unplayable, this is good as an academic study of bandwidth and is why we included it. The 4070 Ti ran at 20.6 FPS AVG, allowing the Ti Super a lead of 13%. Critically, the original Ti has significantly worse lows here. You wouldn’t use these settings for either card, but it does show that the memory bandwidth and capacity change influenced the performance in some key areas.
The closest AMD card here is the RX 7900 XTX, which underperformed against the 4070 Super but held stronger lows.
1440p Benchmarks
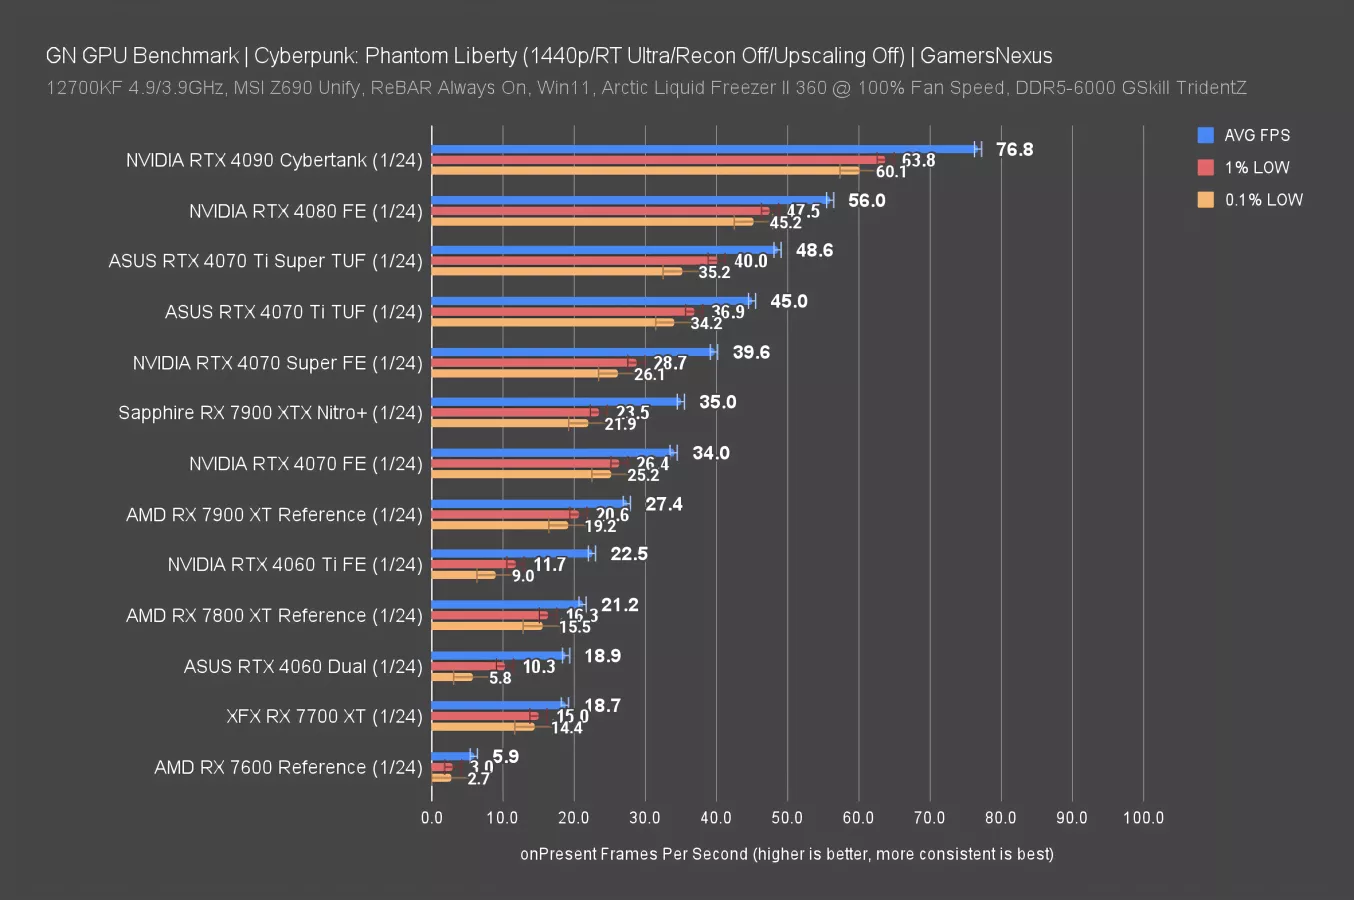
At 1440p/Ultra, the 4070 Ti Super’s lead over the 4070 Ti drops to 8%. The cards diverge as load increases as a result of the memory subsystem changes, so it does in fact do something, but that impact becomes largely academic since we were in unplayable territory at 4K/Ultra.
The 7900 XTX runs below the 4070 Super here. The 4090 posts a massive lead of 58% against the 4070 Ti Super.
1080p Benchmarks
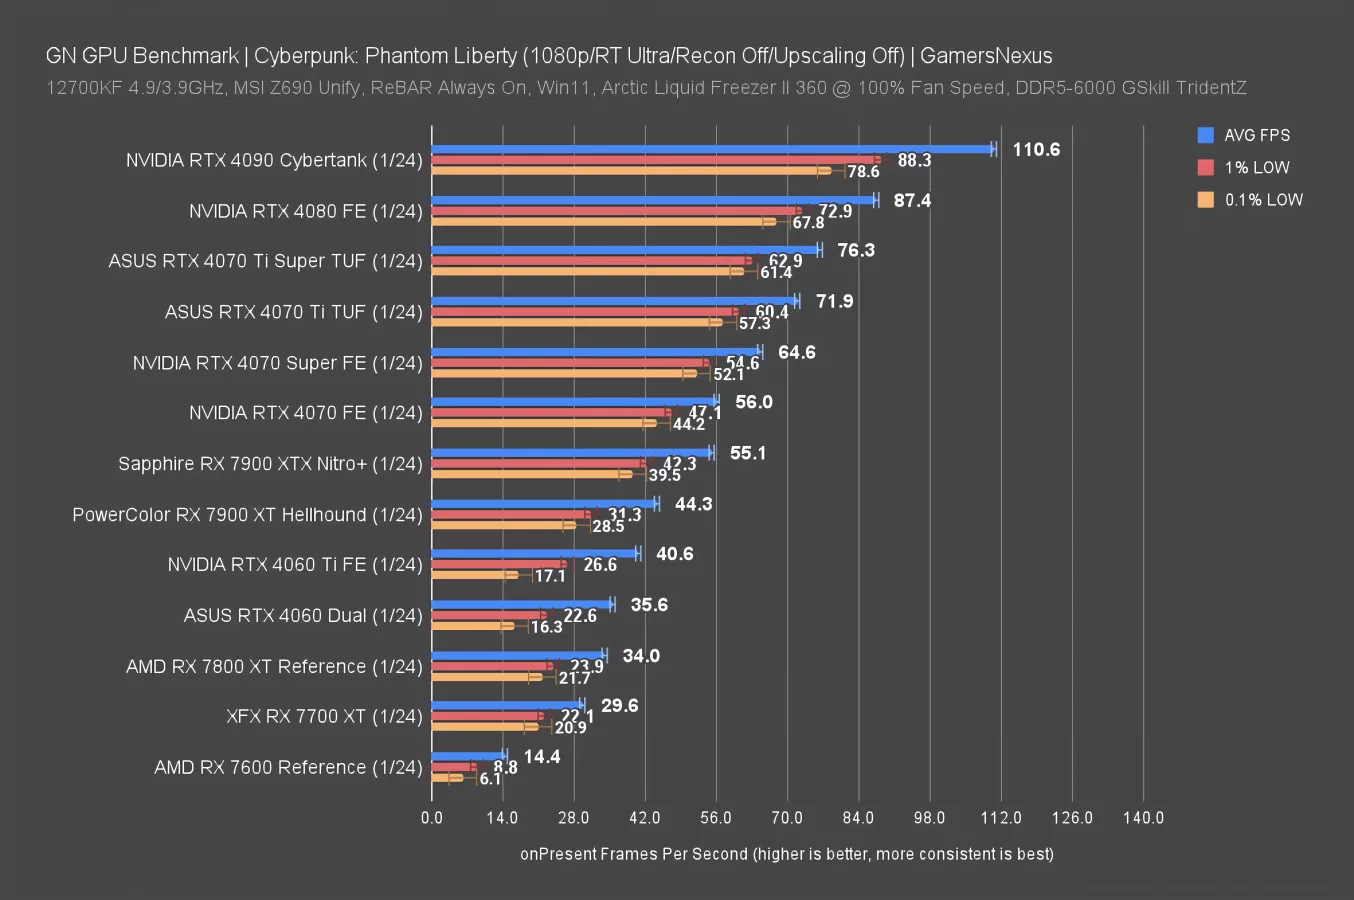
At 1080p/Ultra, the 4070 Ti Super’s lead was reduced to 6%. The memory subsystem overhaul doesn’t matter much here. The 4080 leads by 15% here, with the 7900 XTX still tied with the 4070.
1440p/Medium
Let’s look at RT Medium briefly.
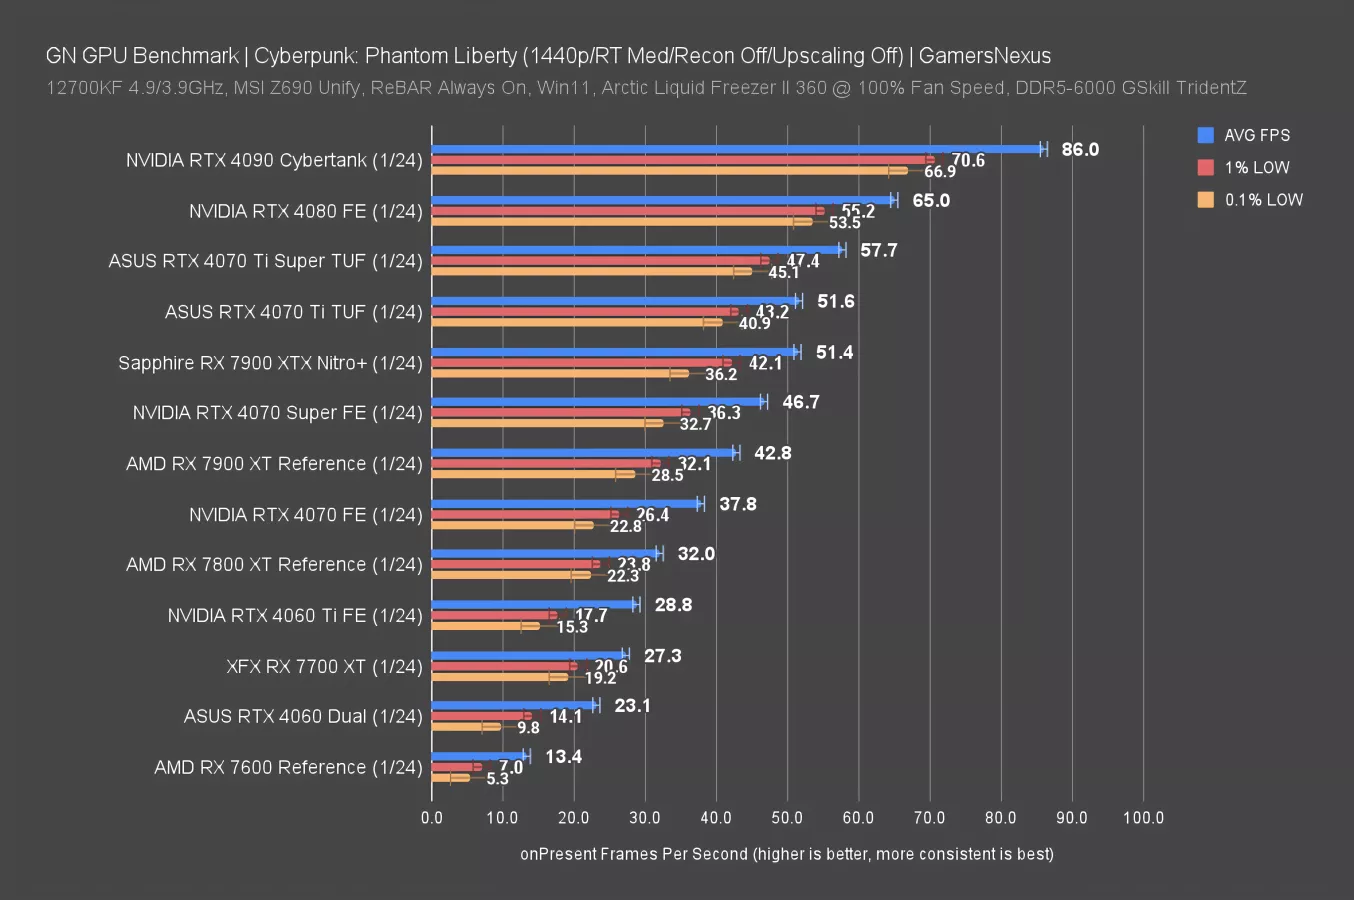
Here, the 4070 Ti Super leads the Ti by 12%, at 57.7 to 51.6. The 7900 XTX is much more competitive here than it was at Ultra, now surpassing the 4070 Super and roughly tying with the 4070 Ti. It’s still not competitive on the whole in this test, but this illustrates that heavier RT loads disproportionately separate AMD and NVIDIA, favoring NVIDIA as RT workload goes higher.
1080p/Medium Benchmarks
Finally, at 1080p/Medium, the 4070 Ti Super leads the 4070 Ti by 7%, the lowest of this game so far. The 7900 XTX is about equal with the 4070 Super here, with the XT about equal to the 4070. AMD’s relative rank overall has fallen at this resolution. It’s benefited by the higher resolution combination with lower ray tracing settings.
Ray Tracing - Resident Evil 4
4K Benchmarks
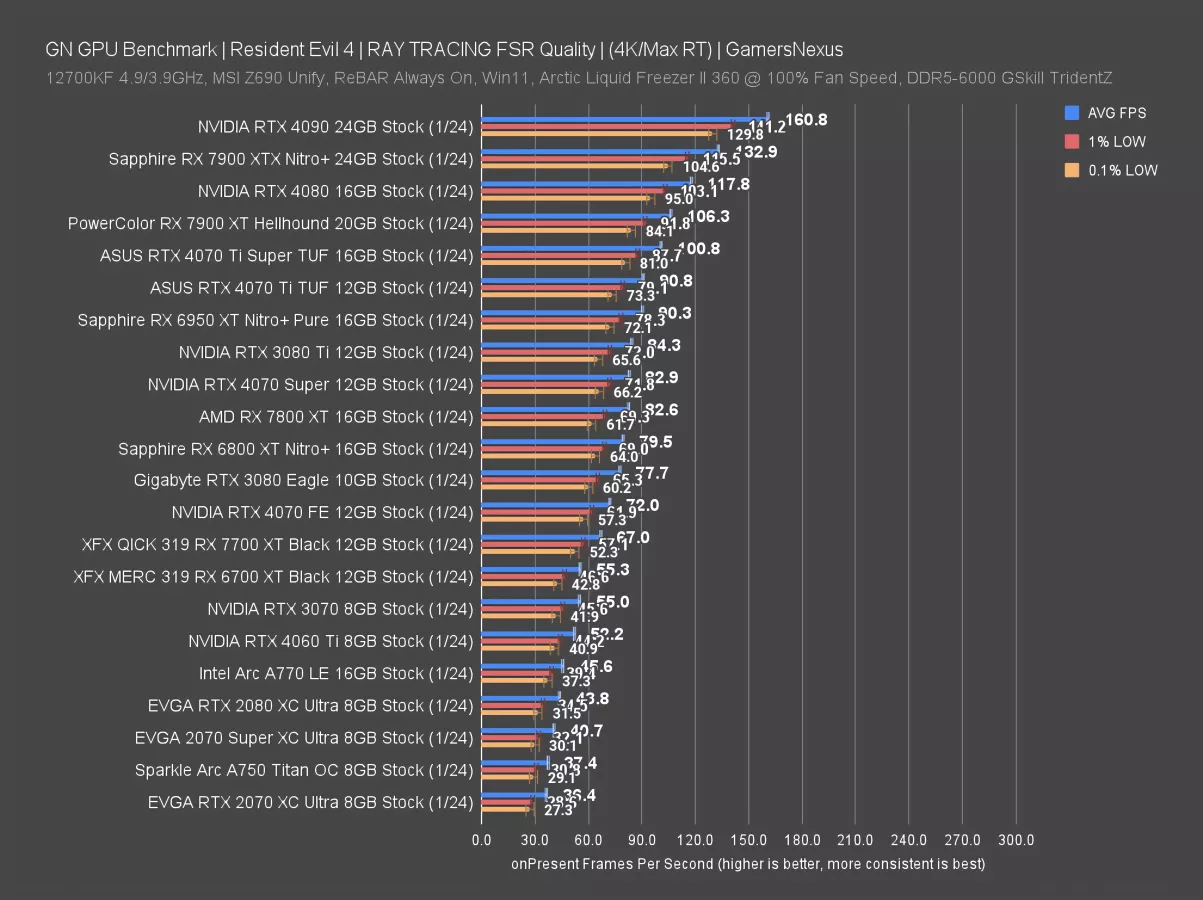
In Resident Evil 4 with RT and at 4K, we’re using FSR as a test of both upscaling and RT impact.
We measured the 4070 Ti Super at 101 FPS AVG, leading the 4070 Ti by 11%. The 7900 XT manages to outperform the 4070 Ti Super in this one, although that doesn’t persist to heavier RT games like Cyberpunk, as we saw earlier.
Compared to the 4070 Super, the Ti Super is about 22% better, and compared to the older 2070, back when RTX was new, it’s about 150% better.
1440p Benchmarks
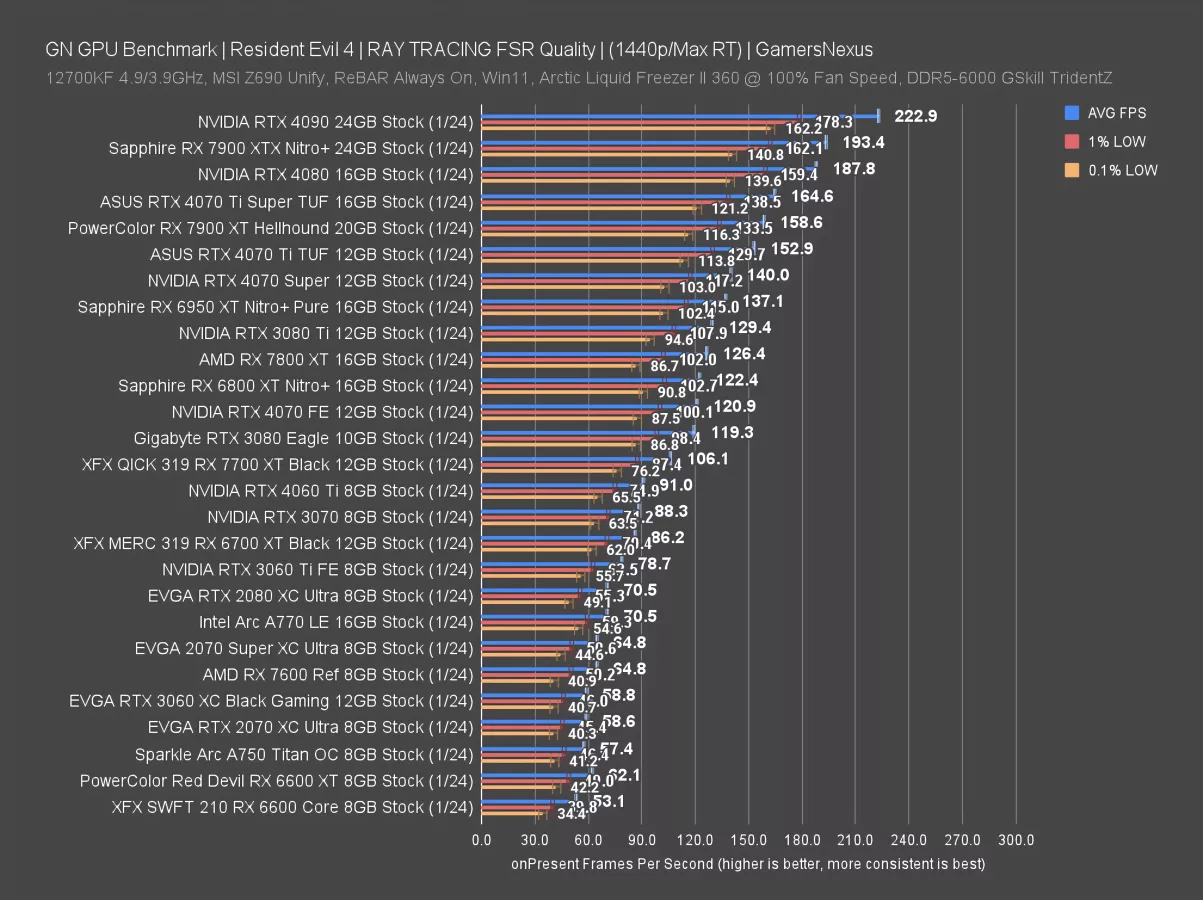
At 1440p, the 4070 Ti Super runs at 165 FPS AVG with upscaling and RT. That has it just ahead of the 7900 XT and 7.7% ahead of the 4070 Ti.
1080p Benchmarks
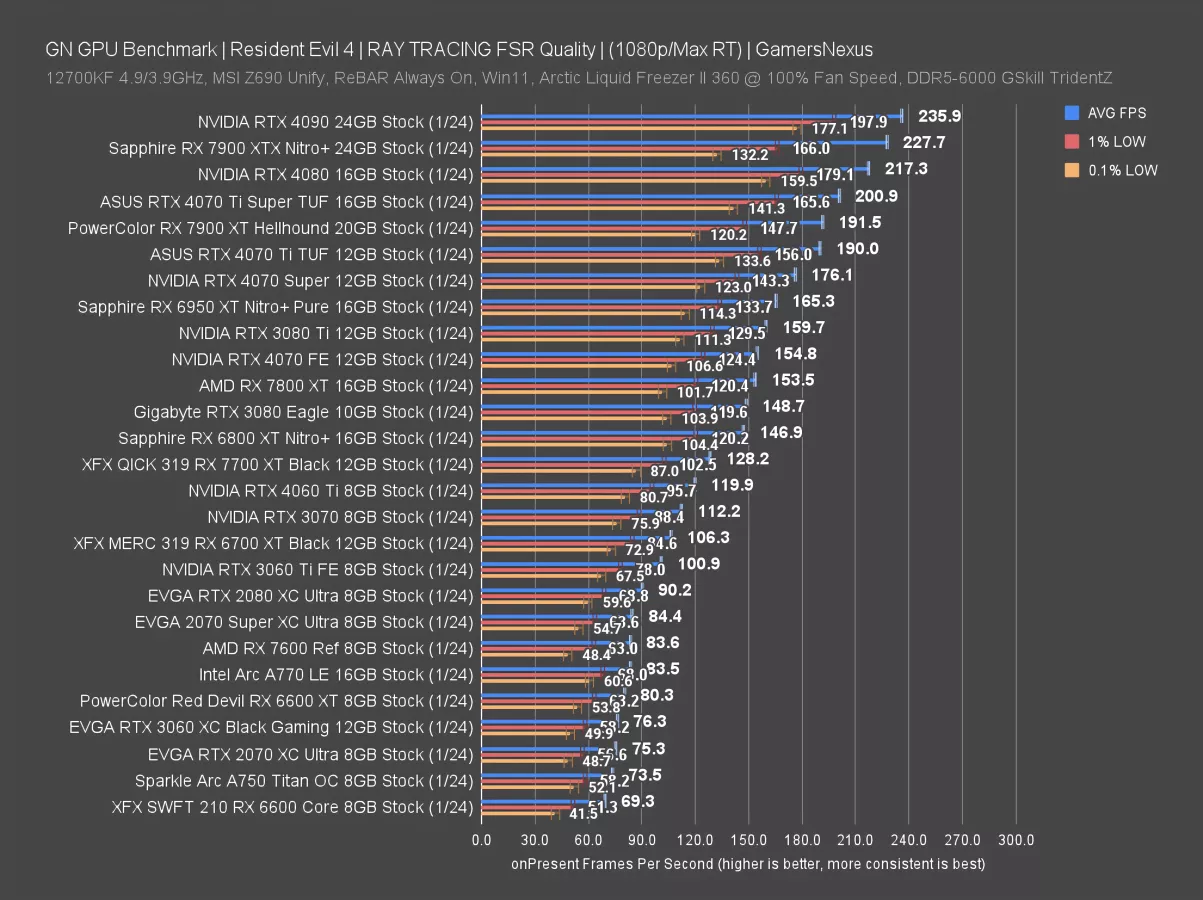
Finally for Resident Evil RT, 1080p has the 4070 Ti Super at 201 FPS AVG with FSR, reducing the lead over the Ti to 5.7%. The 7900 XT sits between the two of them and is closer to the original 4070 Ti than the 4070 Ti Super.
Ray Tracing - Dying Light 2
4K
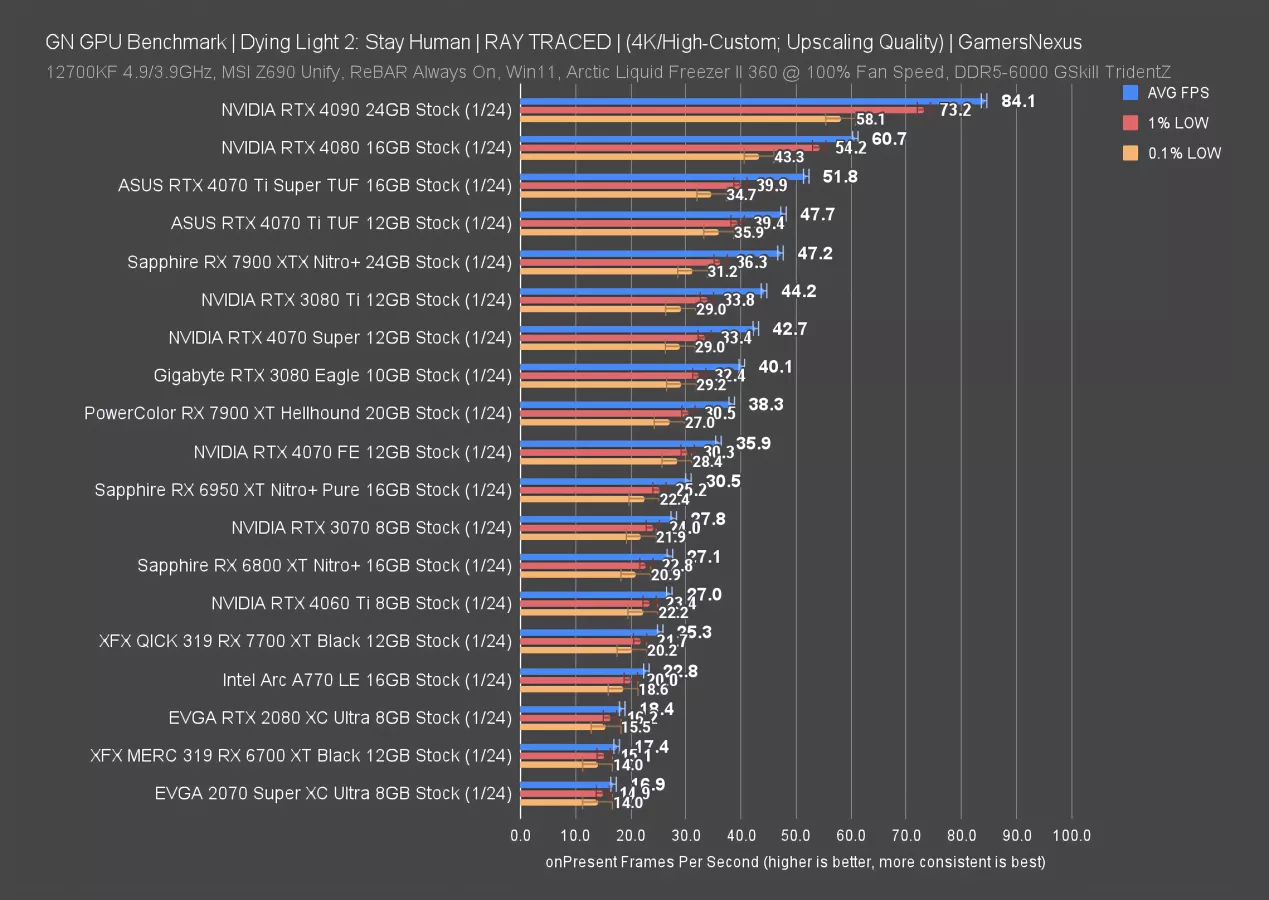
In Dying Light 2 with RT and equivalent upscaling between all vendors, we saw the 4070 Ti Super at 51.8 FPS AVG, leading the 4070 Ti by just 9%. The 7900 XT trails the 4070 Super here, down at 38 FPS AVG and just ahead of the 4070 baseline card. The XT is not in a great spot competitively. NVIDIA is advantaged here. It’s not as extreme as in Cyberpunk, but definitely more than in Resident Evil 4.
Generationally, the 4070 Ti Super leads the RTX 3070 by 86% and the RTX 2080 by 182%.
1440p Benchmarks
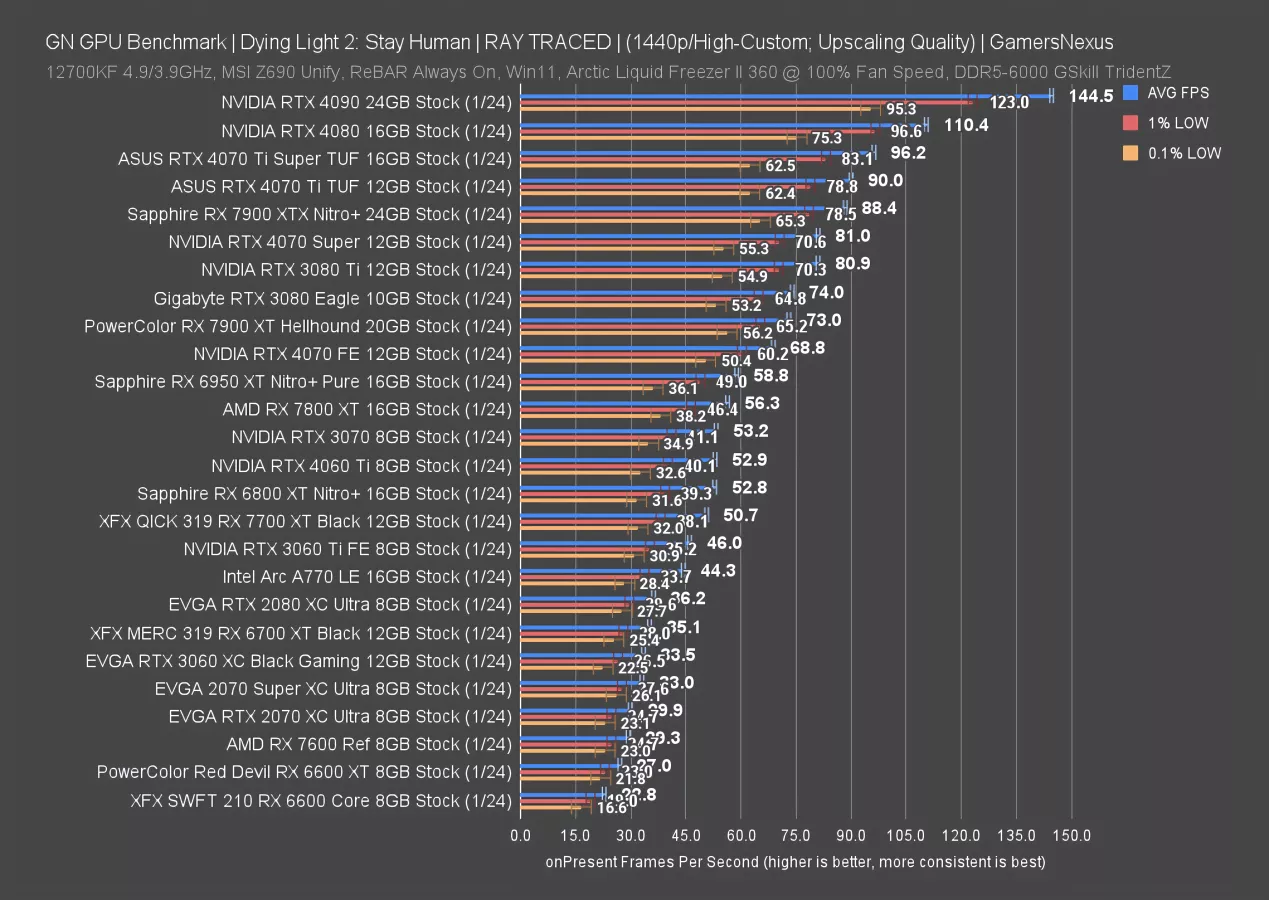
At 1440p, we’ve added some mid-range past-gen cards to the list: The RTX 2070 now appears down at 30 FPS AVG, ahead of the 6600 XT’s 27 FPS result and behind the 3060 Ti’s 46 FPS AVG result.
The 4070 Ti Super’s 96 FPS leads the 4070 Ti by about 7%. It’s dropping again. The 7900 XT is behind the RTX 3080 and RTX 4070 Super in this one and ahead of the RTX 4070. It’s not competing with the Ti-class cards directly.
1080p Benchmarks
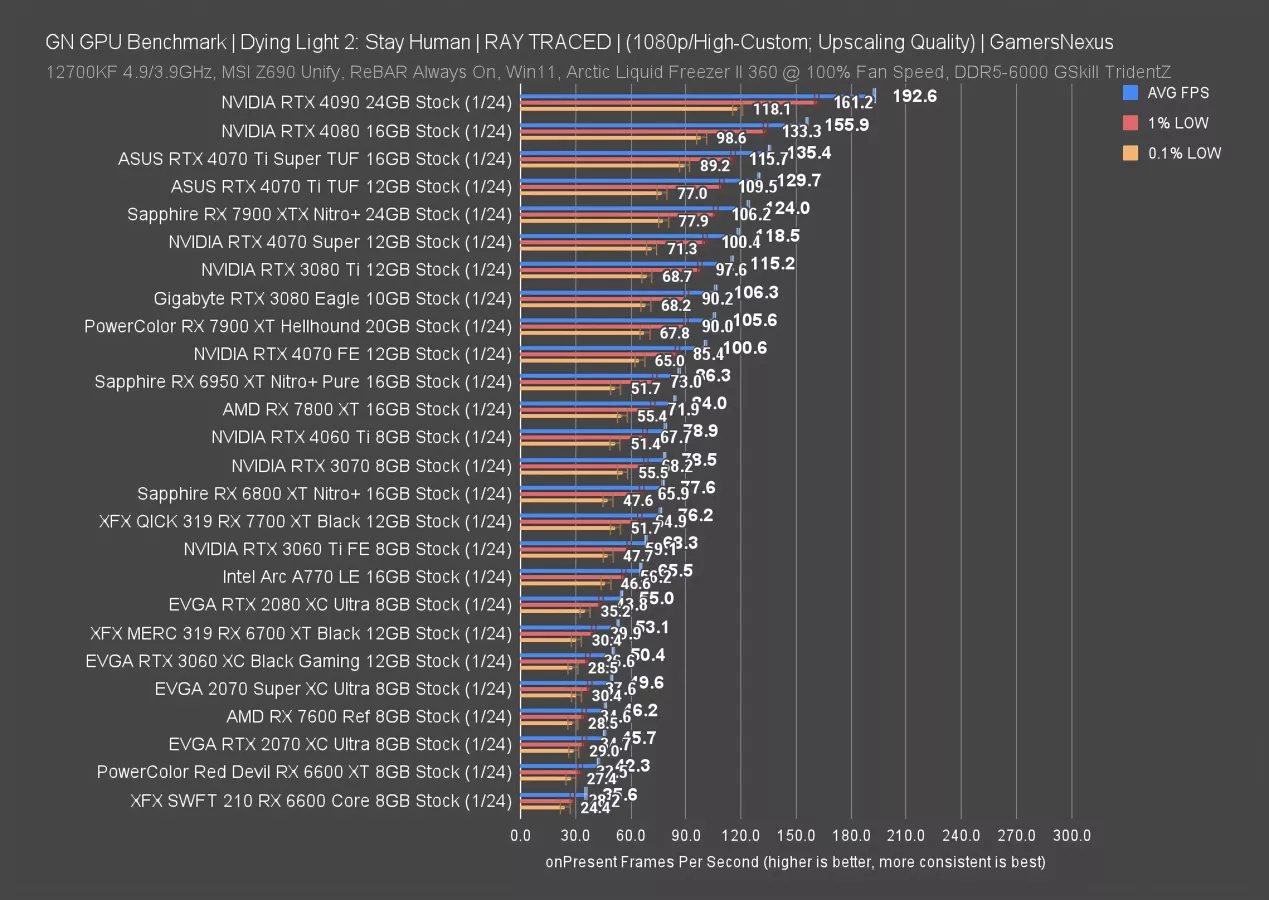
At 1080p, the 4070 Ti Super’s lead over the 4070 Ti is reduced to just 4.4%. The 7900 XT is about 5-6% ahead of the 4070 and continues to yield an advantage to NVIDIA. Not much has changed for these ranks.
RTX 4070 Ti Super Power
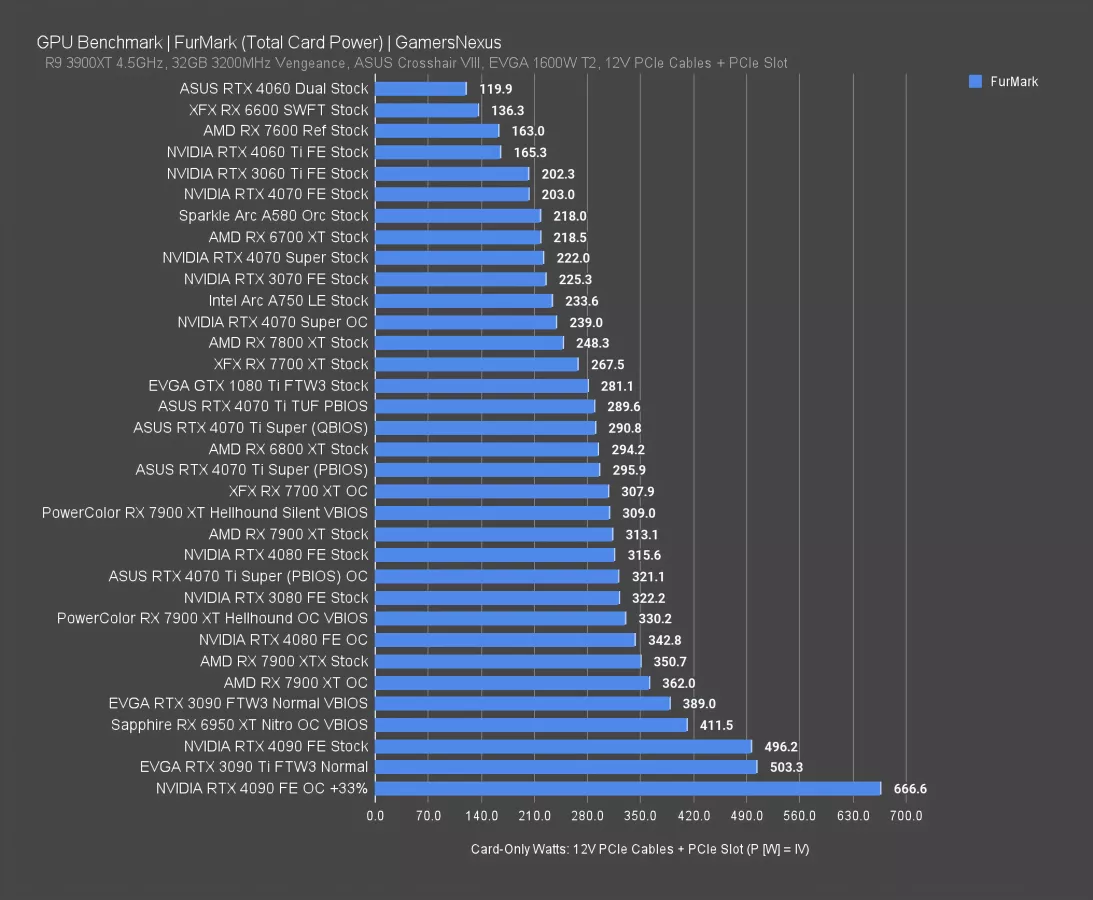
Although we looked at power efficiency earlier, now we’ll briefly look at our standardized total power consumption against more cards. The RTX 4070 Ti Super TUF card pulled 291W with the “quiet” BIOS, or 296W with the default performance VBIOS that ours shipped in. Overclocking allows a maximum power consumption of 321W with the OC on the performance BIOS.
The 296W figure has it about the same as a 6800 XT and less than an RX 7900 XT by 10-25W, depending on what card you look at. The 4070 Ti was about 5W less, at 290W in our original testing. This contributes to some of the performance gap as well.
RTX 4070 Ti Super Conclusion
Well, that’s a lot of numbers.
First, on our side of things: The efficiency testing is exciting and there’s a lot of room for us to improve on it. The methodologies aren’t final nor are the choices of data presentation, so remember that when we add new tests, it’s sort of a living document. We’ll keep iterating on this until we land on something we feel like covers the hardware well. That’ll just mean a lot of trial and error on identifying the test cases and the scaling. It’s a cool start, though, and will give us some new insight into performance outside of elements like frame time, frame pacing, frame rate, and power. For latency, we’re actually already overhauling our next iteration on that and plan to re-introduce it for the 4080 Super review. We debuted it last week and liked how it turned out, but we want to fine-tune the testing and so made way for efficiency instead. This is just us experimenting with new types of data presentation.
As for the cards, you have all the numbers and we’ll let you make your own decision. But for our stance on it, as briefly as possible, this 4070 Ti Super launch can largely be summed-up as “meh.” It’s really not particularly strong but it’s also not offensively bad. The price is locked, so maybe a downside is that we might traditionally have a price cut instead, but the average selling price (ASP) remains up as a result of this launch. But the performance also goes up a little bit, so we’re back to “meh.” It’s not the worst card we’ve reviewed. It’s just kind of in the middle.
It seems like NVIDIA has chosen to couch this card in between the 4070 Super and the 4080 Super, with the 4080 Super, in particular, potentially resetting the value scale for NVIDIA’s high-end with that $1,000 price.
The 4070 Ti Super puts pressure on AMD’s 7900 XT. If you care a lot about super heavy ray tracing, like ultra or high settings in games like Cyberpunk and Alan Wake, then the 7900 XT falls behind in big ways. If you don’t care about RT or you play less RT-intensive titles, like games with a single RT feature, then the 7900 XT and 4070 Ti Super are less different.
But we’ve been totally overhauling our testing one new benchmark at a time, so we’re going back to the lab to do it all again for the 4080 Super launch and we’ll leave you with this data to make your decisions.