
We've got 30 charts that test the AMD Radeon RX 7600 XT through rasterization, ray tracing, power efficiency, and power consumption benchmarks
The Highlights
- Compared to the RX 7600, the 7600 XT has an increased power budget and clock bumps
- Costing $60 more than the RX 7600, the 7600 XT doesn’t justify its price increase
- With 16GB, the RX 7600 XT has twice the VRAM as the RX 7600
- Original MSRP: $330
- Release Date: January 24, 2024
Table of Contents
- AutoTOC

Intro
We’re on a tear right now with iterative GPU review updates, this time adding Baldur’s Gate 3 in for the RX 7600 XT review and benchmarks. AMD’s new card starts at $330 and slots in over the RX 7600, which is around $270 right now, and we’ll be benchmarking it in the usual suite plus new additions like Cyberpunk 2077. We also have our brand new power efficiency testing that we debuted in our RTX 4070 Ti Super review.
Anyway, the pricing of the 7600 XT is going to be immediately problematic, but this is what you get when you demand more VRAM: memory is one of the more expensive non-GPU components on a PCB, and doubling it adds cost. Whether it should add $60-$70 of cost is maybe debatable, but that’s how AMD priced it. The trouble is that if a card isn’t sufficiently powerful to utilize the extra capacity, the impact to performance won’t be realized. We’ll look at all of that in this review. AMD also increased the power budget on the 7600 XT, so it’s getting clock bumps alongside the memory capacity doubling. Otherwise, the CU count, stream processor count, and even the memory interface are all the same as the 7600.
Editor's note: This was originally published on January 24, 2024 as a video. This content has been adapted to written format for this article and is unchanged from the original publication.
Credits
Test Lead, Host, Writing
Steve Burke
Testing
Patrick Lathan
Mike Gaglione
Camera, Video Editing
Vitalii Makhnovets
Additional Research
Jeremy Clayton
Web Editing
Jimmy Thang
AMD RX 7600 XT Overview
Let’s start with a quick pricing update:
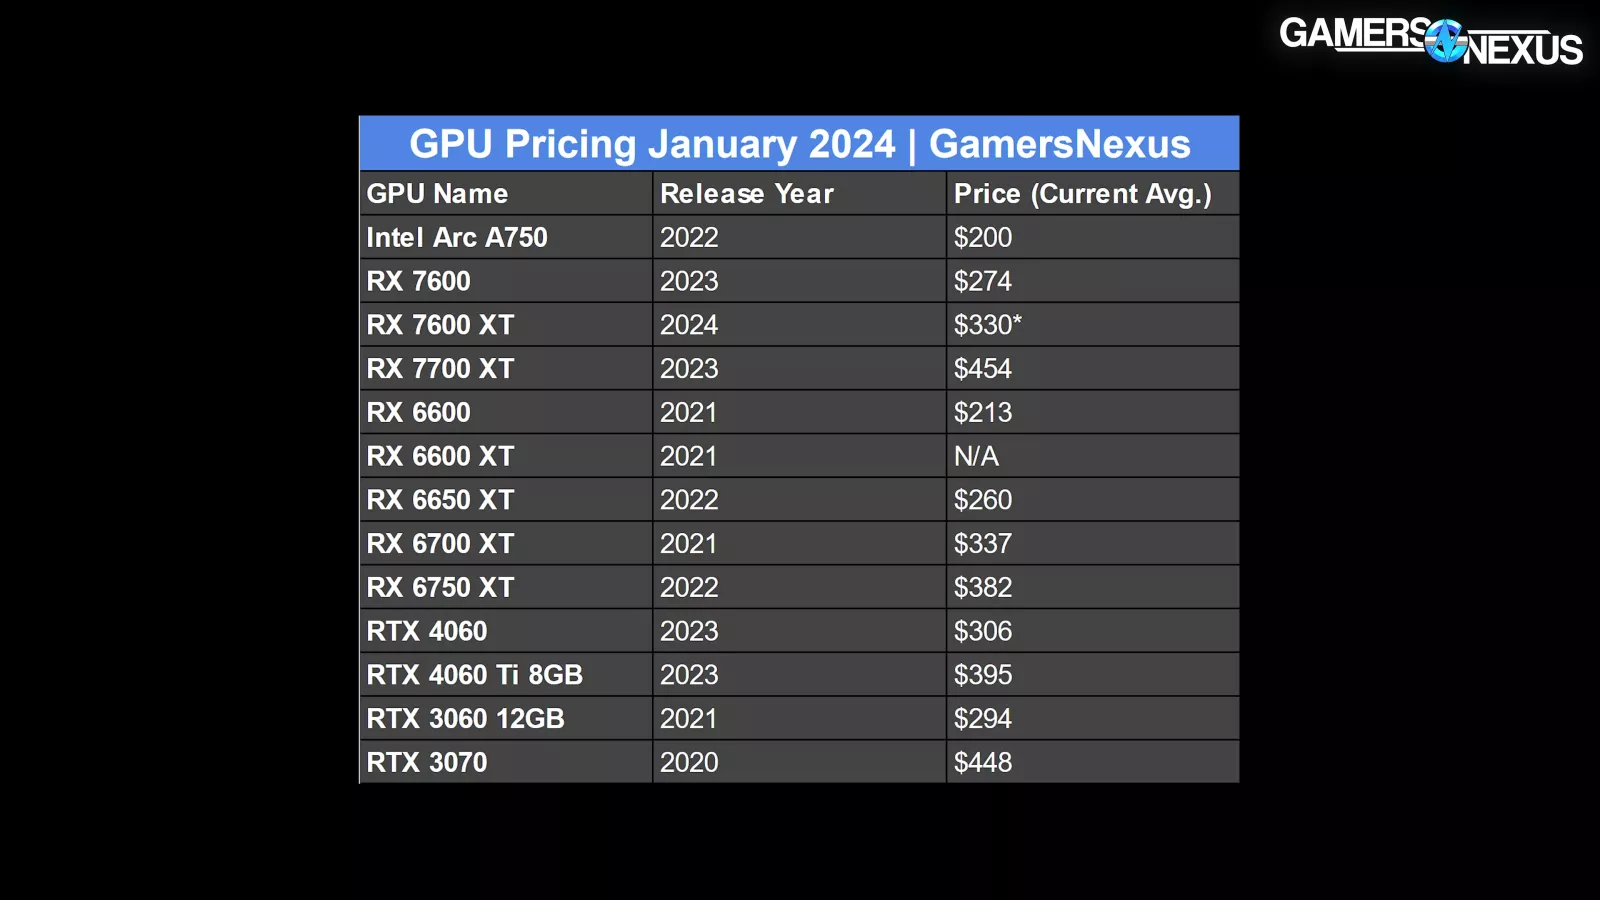
Jeremy on the team put together this quick reference table for GPUs that might be relevant in this price range. We averaged the price of several of the cheapest cards for each SKU, eliminating outliers like those listed by third-party sellers.
The RX 7600 (watch our review) is currently averaging about $274, so it’s still near the launch price. The RX 7700 XT, the prior next class up, is $454. The 7600 XT will be determined at launch but should be around $330.
Where you can still find the RX 6600, it’s about $213 -- that definitely keeps it relevant. The A750 is also super relevant and is as low as $190 now, but typically around $200-$210. The 6650 XT is also relevant, at $260, as is the 6700 XT, which is a direct price alternative to the 7600 XT and runs 12GB of memory that’s more likely to be utilized anyway.
NVIDIA’s closest competition remains the RTX 4060. It hasn’t launched anything near the A750 yet.
Other options might include the used market, but for those buying used, AMD is contending largely with itself.
AMD RX 7600 XT Specs
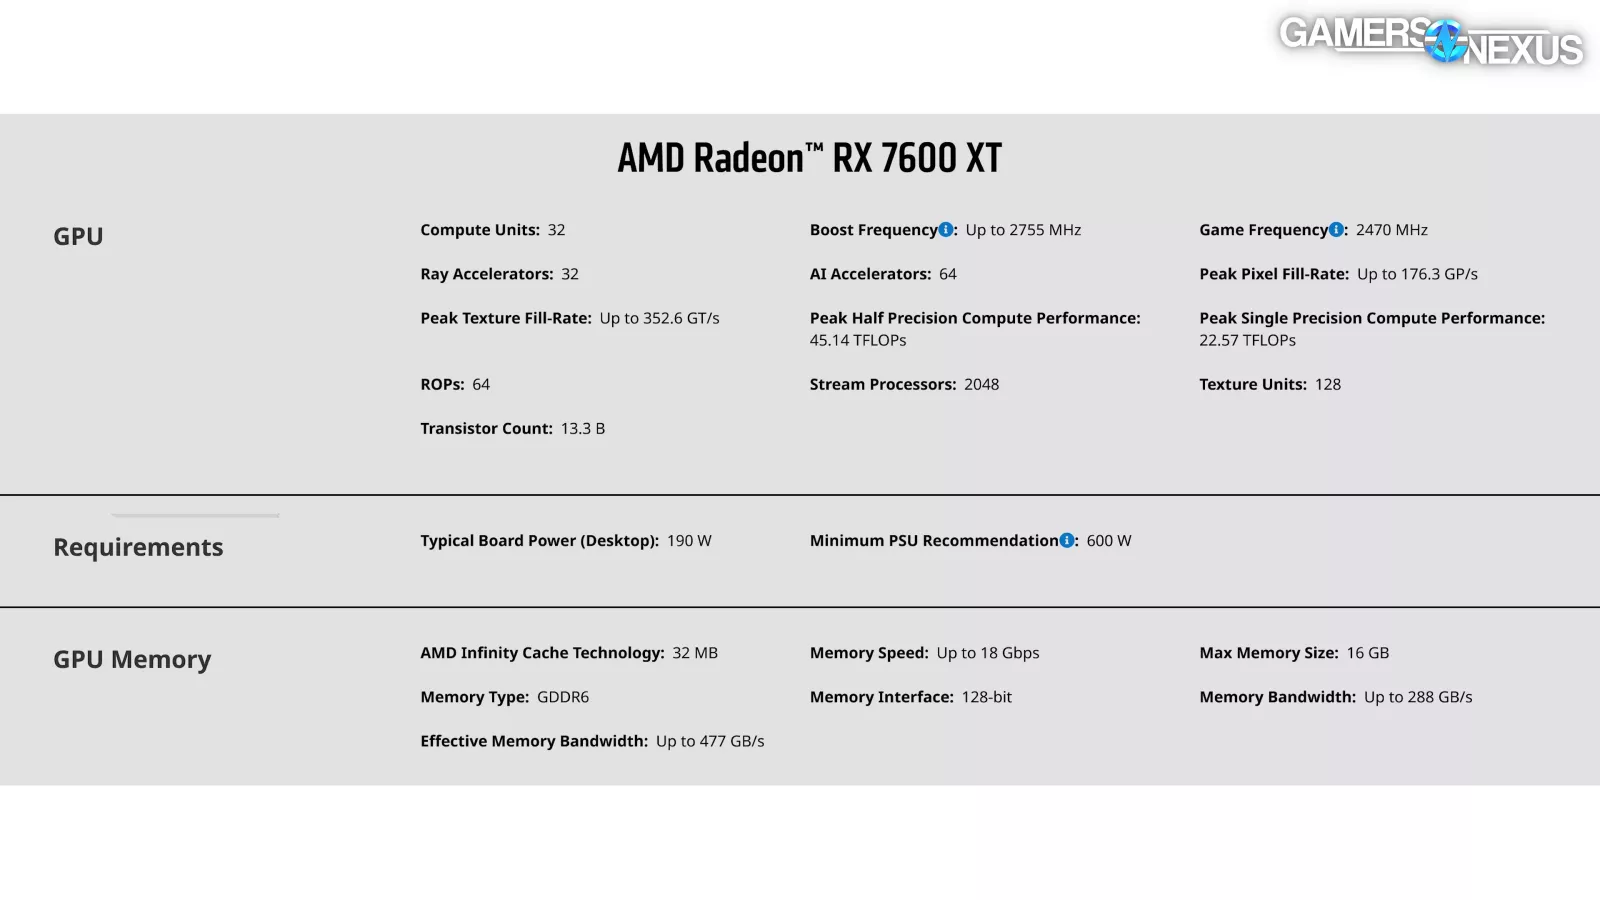
In terms of specs, it is nearly identical other than the power budget and the memory capacity. There’s a frequency boost alongside the power budget increase. We’ll look at the full power draw later in the review.
Let’s get straight into the testing.
GPU Reviews Test Bench
You can find additional test methodology notes in our Test Benches Living Document.
| Part | Component | Provided By |
| CPU | Intel Core i7-12700KF Overclocked (4.9GHz P-Cores, 3.9GHz E-Cores) | Bought by GN |
| Motherboard | MSI Z690 Unify | MSI |
| RAM | DDR5-6000 G.Skill Trident Z (manually tightened timings) | G.Skill |
| Cooler | Arctic Liquid Freezer II 360 @ 100% Fan Speed | Bought by GN |
| PSU | EVGA 1600W T2 Supernova Corsair AX1600i | EVGA Corsair |
| OS | Windows 11 | Bought by GN |
AMD RX 7600 XT Power Efficiency Benchmarks
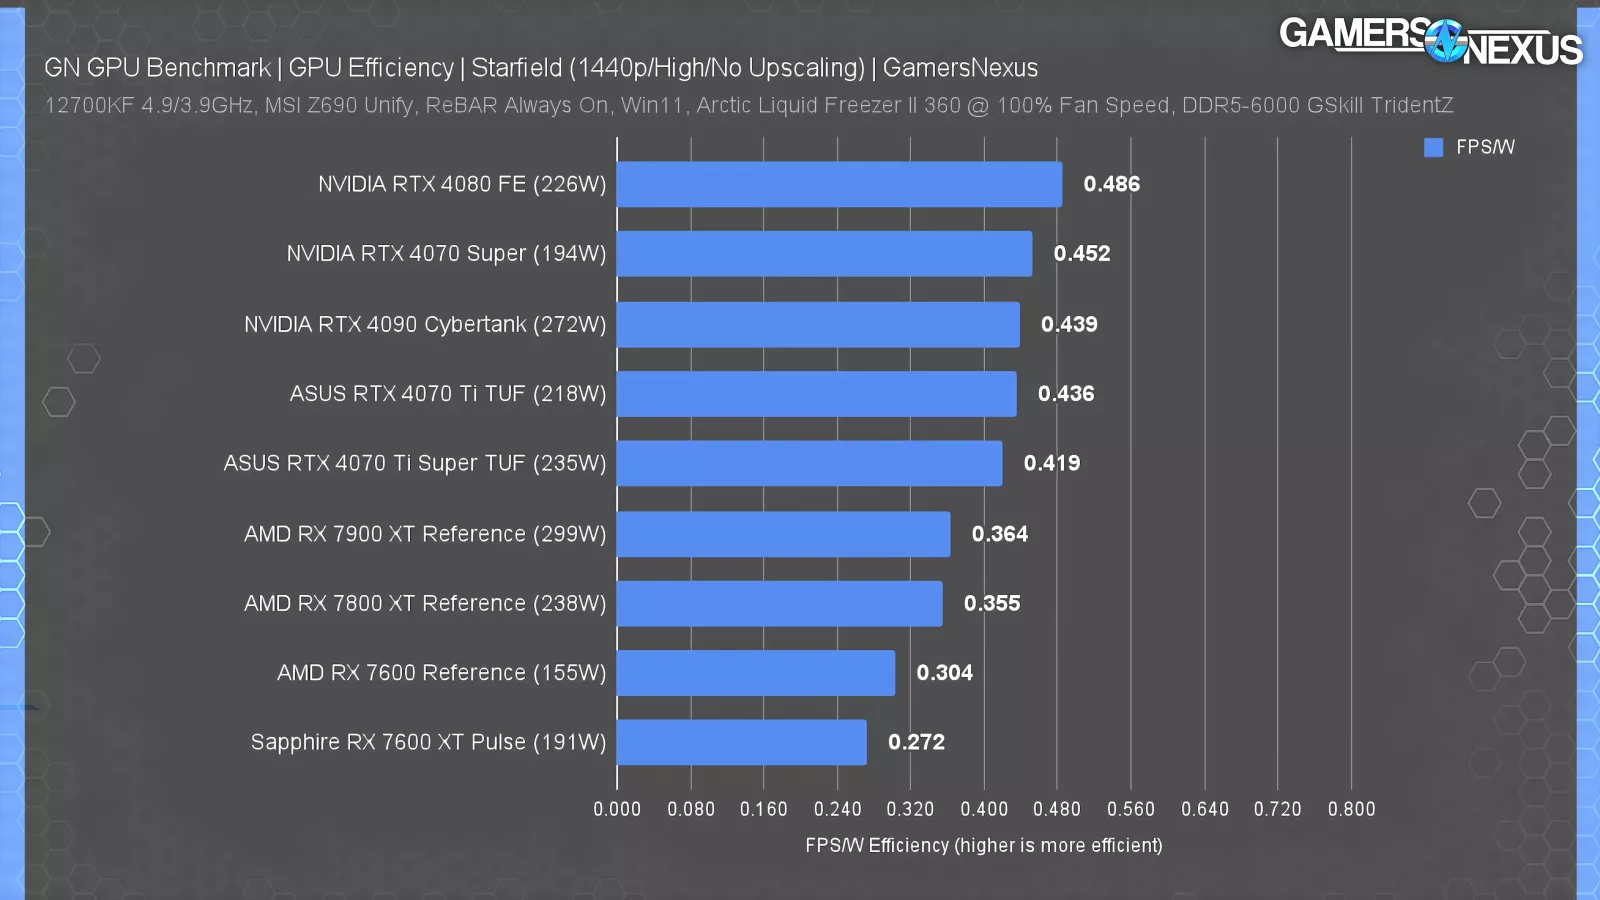
Our power efficiency testing is brand new. We explained this in the 4070 Ti Super review in depth and had a lot more charts, but will just be showing one initial chart here for the 7600 XT. We’re still refining all of this testing and adding to it, but Starfield will mostly tell the story for all the results for the 7600 XT for efficiency.
As a reminder, this is in FPS/W, or effectively frames per joule. Higher is better. The RX 7600 XT is the worst on this chart, down at 0.27 FPS/W. That has it behind the original RX 7600, which was more efficient in this test by 12%. Interestingly, there was about a 12% change at most in Starfield between these cards, so it at least scaled fairly close to 1-to-1 for the performance increase in this particular game. But that still makes it clear where AMD got its gains: Blasting more power, with the card now 40W higher in total power consumption. The 10-point highs won’t be charted separately this time, but landed at 229W for the 7600 XT and 196W for the 7600. If you see nothing else from the 4070 Ti Super review, check out the efficiency section for more information on this new testing.
AMD RX 7600 XT Summary Charts
RX 7600 XT vs. RX 7600
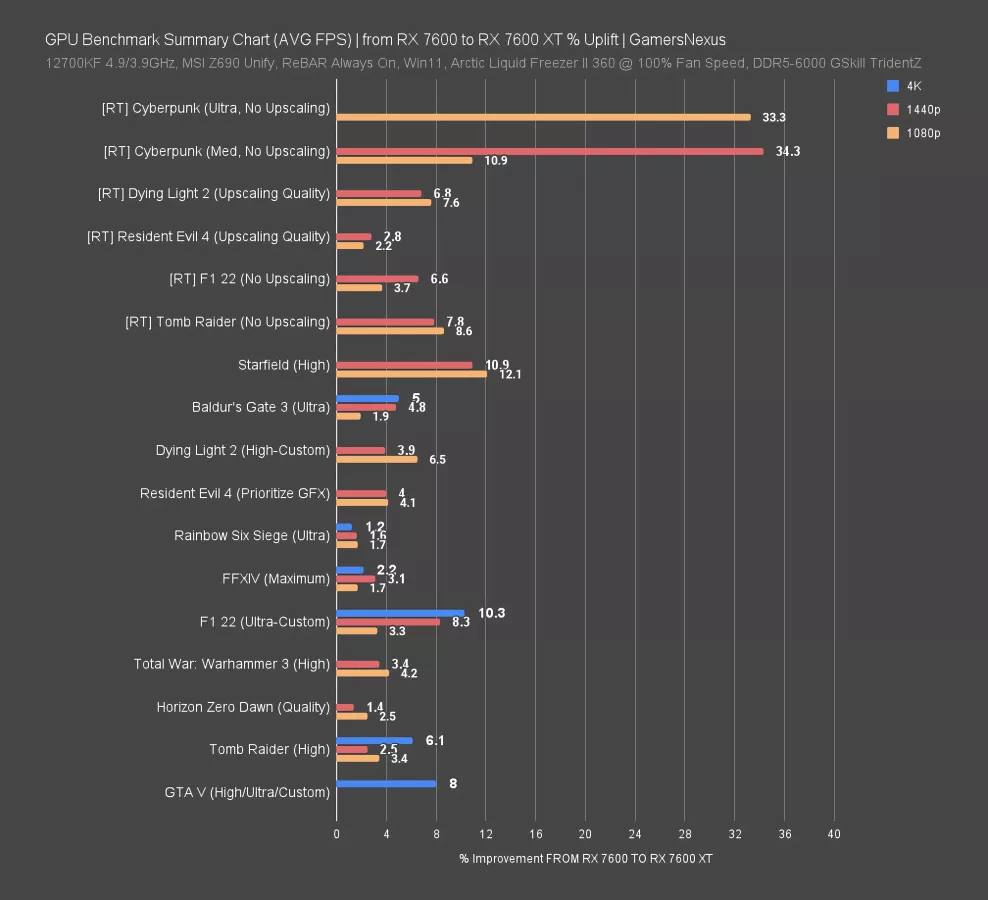
The first summary chart looks at the RX 7600 XT vs. the RX 7600. The power budget drives part of this, with the memory driving the larger numbers but only in scenarios where the memory is actually utilized.
Cyberpunk with ray tracing is our recently added test. With medium settings, we saw about an 11% increase at 1080p and RT, whereas we saw a significant increase of 34% with 1440p. That’s not a playable framerate, but percentage-wise, it serves its academic purpose of illustrating that memory can have a big impact when constrained, it’s just that the card isn’t fast enough at a core level for the memory to be relevant here.
On to the rest of the games:
Generally speaking, we’re seeing about a 5.5% uplift at 4K where tested and about 7% uplift at 1440p and 1080p. Some break-outs include F1 at 10% for 4K and Starfield at 12% for 1080p. RT uplift was generally within the same range, aside from Cyberpunk’s more intensive settings. If we eliminate Cyberpunk from the averaging, that brings the approximate improvement down closer to 5% from 7%, and that’s in exchange for 22% more money. Not great, and the scenarios where you need that memory while also being in playable territory are rare.
Ray Tracing: RTX 4060 vs. RX 7600 XT
The next summary has to be broken into two pieces: We’re presenting RT separately from rasterized testing. As we explained before, we do this because we try to keep as much of the math as possible in the direction of percent increase.
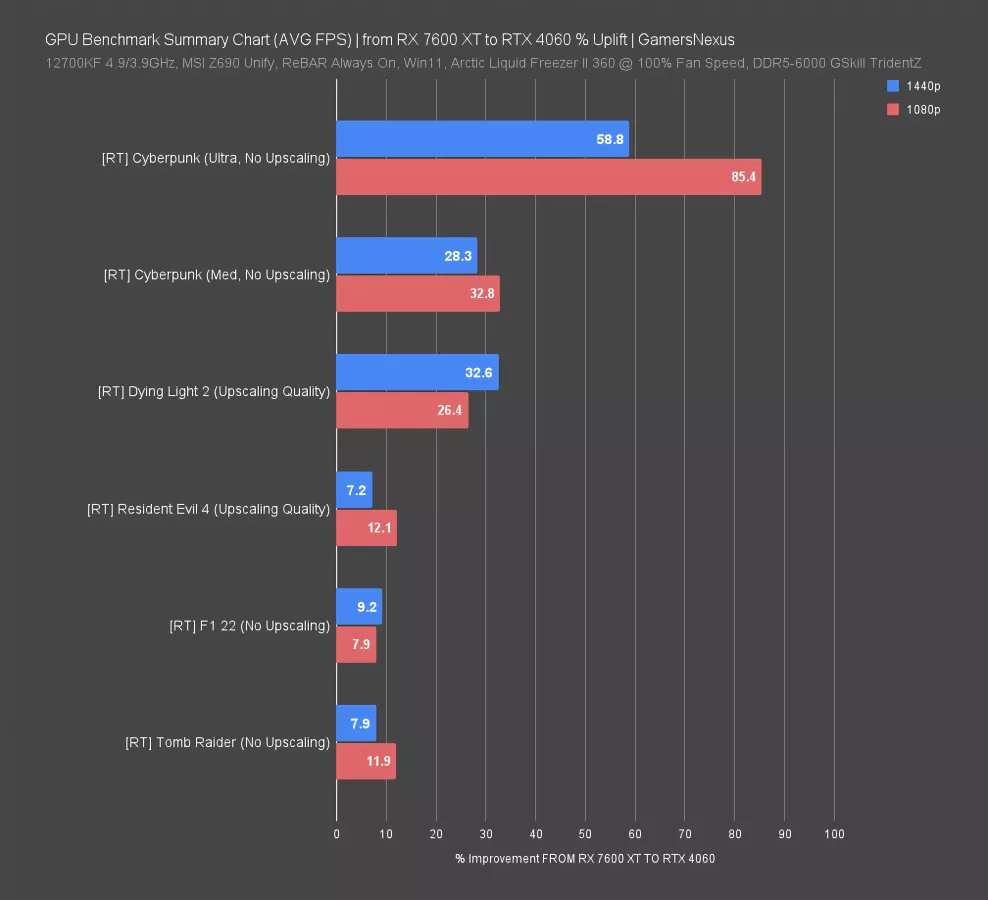
Anyway, here are the RT results when moving FROM the RX 7600 XT TO the RTX 4060.
The scale is insane for Cyberpunk. With the newly-added testing, we accommodated both Cyberpunk with ultra RT and with medium RT. We did that because we noticed increasing RT load on the GPU disproportionately favors NVIDIA -- which is a real advantage, so that’s fine -- but we wanted to represent both options fairly.
At 1080p and RT ultra, we saw an 85% uplift. The card is crumbling under this much load. The 1440p result isn’t really fully representative: The cards are both so overloaded that they are totally unplayable without any upscaling assistance, and even then, it’d be rough. But the nature of being that overloaded is that the FPS numbers start skewing and are largely meaningless anyway. Even still, it’s 60%.
With lower medium RT settings, the RTX 4060 (watch out review) maintains an advantage of about 30%, which is still significant.
In Dying Light 2, the 4060 also has about a 26-33% advantage.
After that, we have 3 lighter RT workloads that fall below 15% improvement for the RTX 4060. This gives you a fairly representative picture of the two types of RT titles right now: Those that supplement raster graphics and those that frontload RT visuals. It’s up to you on what kind of games you play with regard to whether this matters.
Rasterization: RX 7600 XT vs. RTX 4060
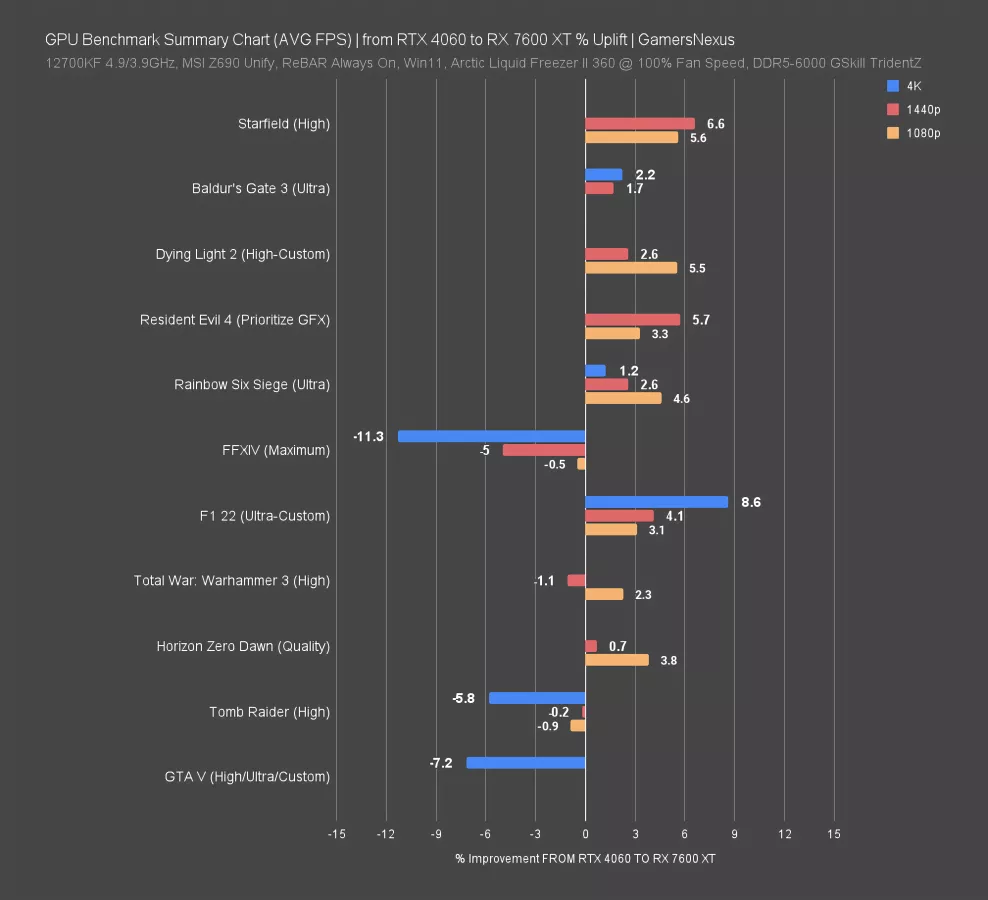
With rasterized benchmarks only and now looking at percent improvement in the RX 7600 XT against the RTX 4060, with the 7600 XT going in the positive direction, we see an average wash between them. When it’s better, the 7600 XT tends to be about 3-5% better. When it’s worse, it tends to be 2% to 5% worse. Generally speaking, it most consistently did worse in 4K with games that are lighter. Tomb Raider, GTA, and Final Fantasy won’t meaningfully utilize that extra VRAM, so it provides no value. As such, and particularly in Final Fantasy where we tend to see NVIDIA disproportionately favored (a counter to Starfield, which disproportionately favors AMD), it’s the core specs of the GPU that matter more than the VRAM.
AMD RX 7600 XT Game Benchmarks
Resident Evil 4
1440p Benchmarks
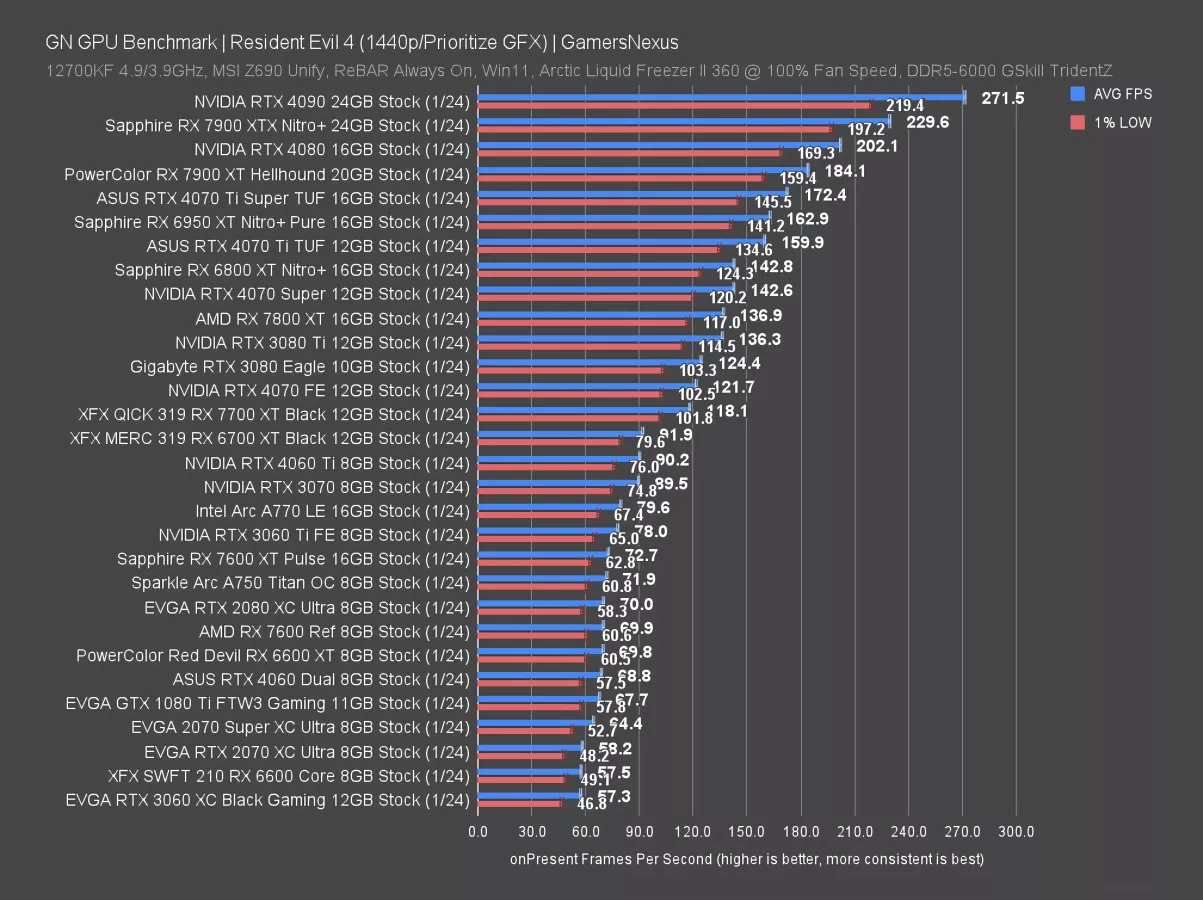
In the 2023 remake of Resident Evil 4, the RX 7600 XT ran at 72.7 FPS AVG against the 69.9 FPS AVG of the RX 7600. Normally, we’d round those two numbers -- but we need every fraction of a frame of difference to even begin to tell these two cards apart unless memory-bound. The 7600 XT’s lead is 4% -- so we’re even lower than 4070 Ti Super 1080p levels of uplift territory when compared to the 4070 Ti.
The 7600 XT’s closest NVIDIA competition would be the RTX 4060 at 68.8 FPS AVG, just below the RX 7600 and with no meaningful difference to frame pacing. It’s between the two for price. The RTX 4060 Ti 8GB card is about $390 to $400, so it’s 20% more expensive than MSRP for the 7600 XT and about 24% higher performance in AVG FPS, up at 90.
The 7600 XT doesn’t meaningfully move the needle from the 6600 XT in this test.
1080p Benchmarks
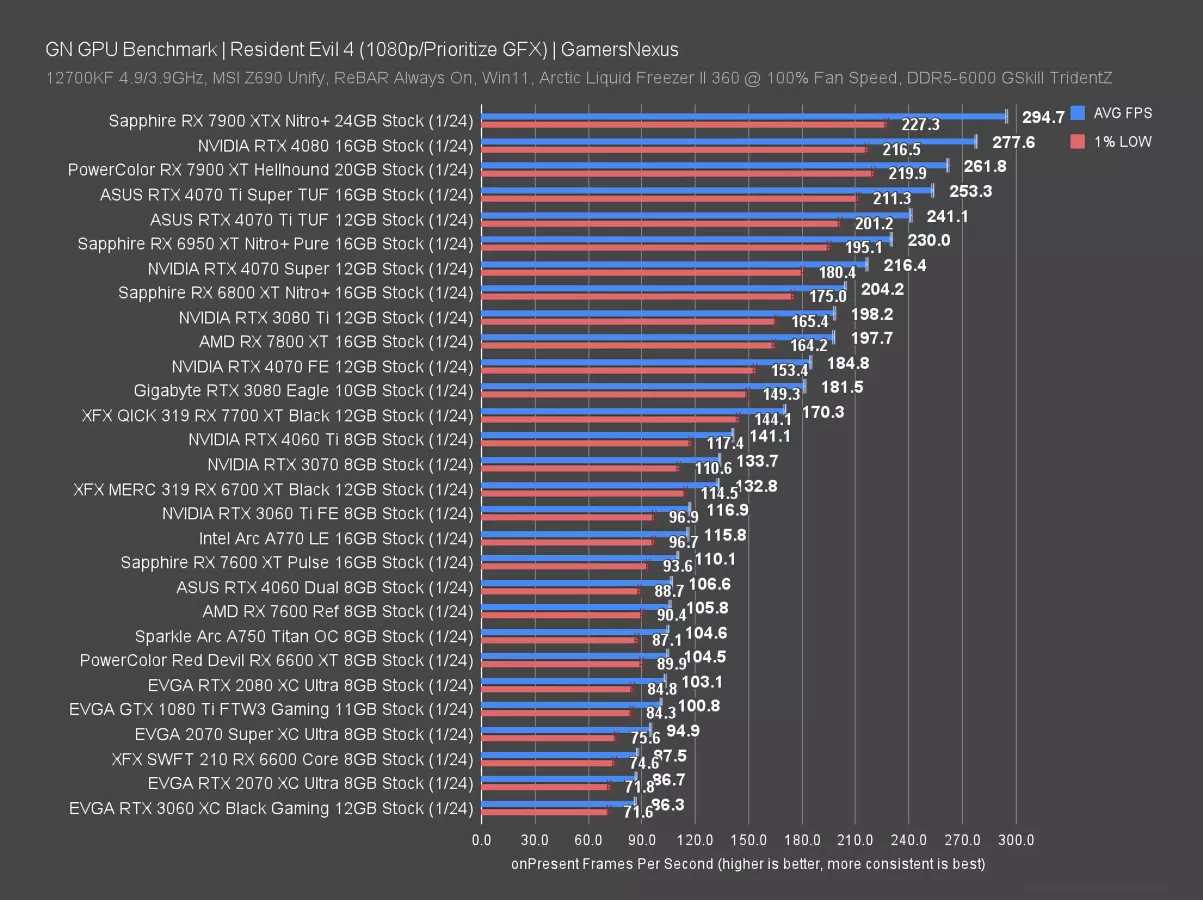
At 1080p, the RX 7600 XT’s 110 FPS AVG led the RX 7600 by a staggering, mind-blowing 4.1%. We were worried we’d have to break out the double-digits for this review, but as we all know, numbers above 10 are in finite supply. We just wastefully used one right there. Rumor has it that this is also why NVIDIA launched its 4070 Ti Super: To protect the supply of double-digit numbers.
As for competition, the 4060 ends up right between them when compared to the newest test run. They’re about the same, including in 1% lows. The RTX 4060 Ti 8GB runs about 28% ahead of the 7600 XT at the 20% price bump. Intel’s A750 is due another round of testing with its current beta drivers, but as of about 10 days ago, the A750 was clocked at 105 FPS AVG in this test. That has it just below the RX 7600 baseline card. Intel currently has a $70-$80 price advantage over the 7600, so this is fiercely competitive. But it’s still more sporadic than NVIDIA and AMD for game-to-game reliability, despite significant improvements. You can check out our recent revisit video to see how Intel has updated its drivers.
Starfield
1440p Benchmarks
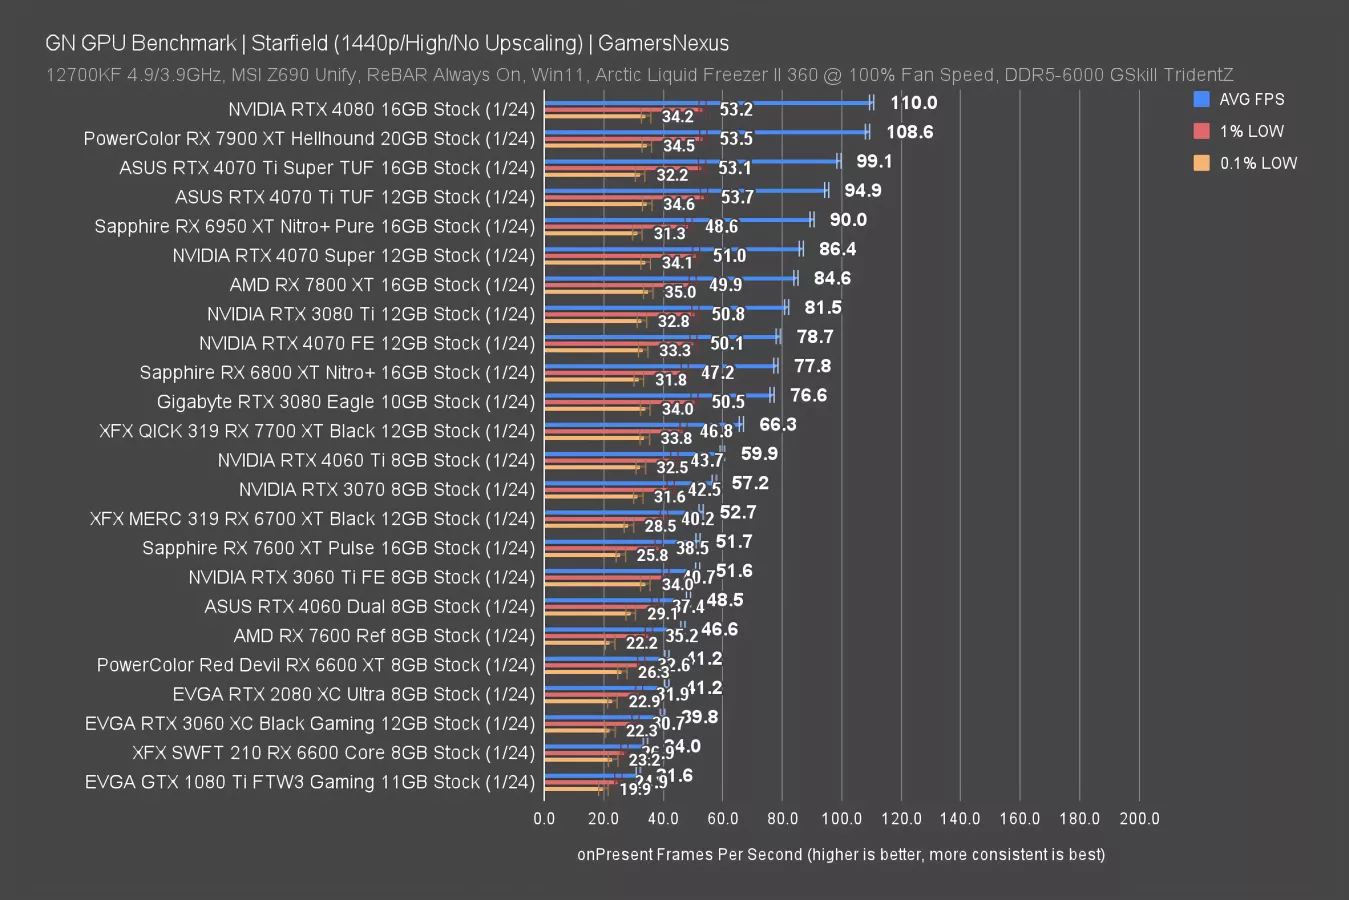
Starfield is up next. Tested at 1440p, this 2023 title has the RX 7600 XT at 51.7 FPS AVG and the RX 7600 non-XT at 46.6 FPS AVG. That’s about an 11% swing to the XT, which is far more than we saw in many of the other games tested today. That’s about the most exciting it’ll get. F1 is also in this range.
This result positions the 7600 as behind the RTX 4060, which itself is behind the 3060 Ti (watch our review), and the 7600 XT is behind the 4060 Ti (watch our review). The 4060 Ti leads it by about 15% here.
1080p Benchmarks
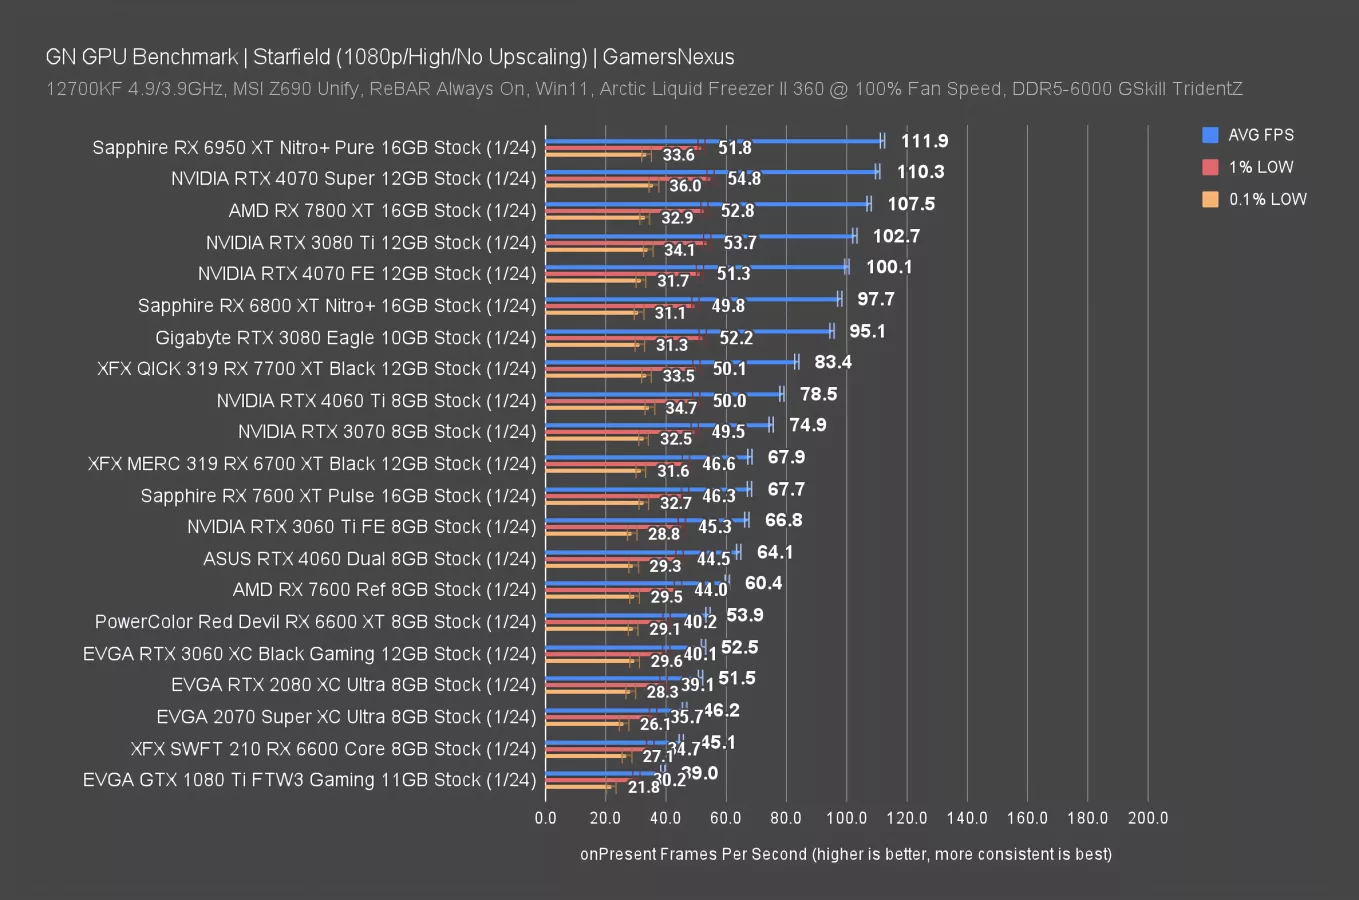
At 1080p, the RX 7600 XT leads by 12%, which is a significant margin when compared to the other positions we’ve seen in this testing. Unfortunately, that doesn’t show up in many other places. The 7600 XT ends up about equal to the 6700 XT here, with the 7600 behind the 4060.
Baldur’s Gate 3
4K Benchmarks
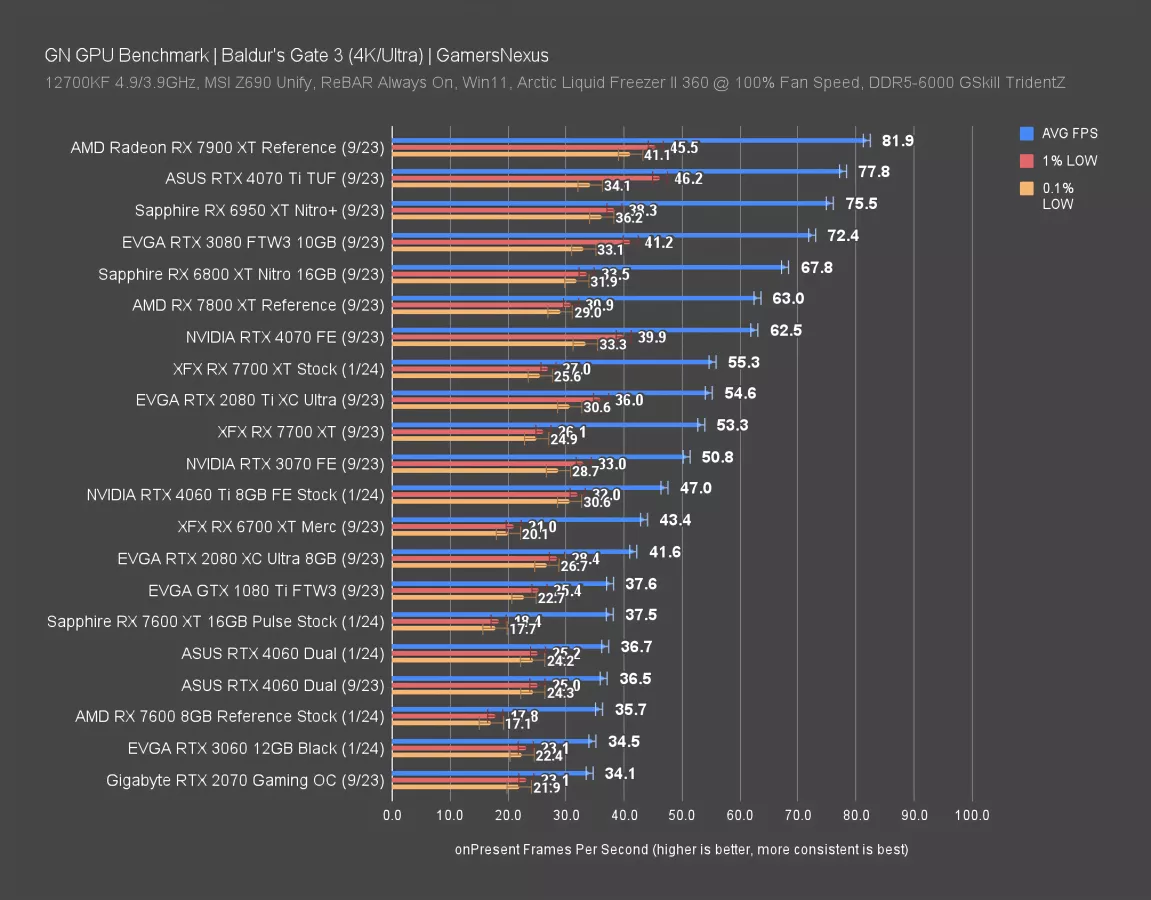
On to the games. We started running entirely new tests for Baldur’s Gate 3 since it’s been updated so much since our last round and in the last couple hours before posting this, we managed to get 6 cards through and noticed something: Overall, the results aren’t too different. We’re still re-running everything, but for purposes of giving as much referential data as possible, we’re also including old data. The disclaimer here is that performance has improved. Anything marked 1/24 is directly comparable.
Some quick examples: The RX 7700 XT has improved by 3.8% from the September version of the game, with the 4060 about the same as its original result.
For directly comparable data at 4K, the RX 7600 XT is about 5% better than the RX 7600 and roughly equal with the RTX 4060. The RTX 4060 Ti’s 47 FPS AVG result gives it a strong lead over the new XT.
1440p Benchmarks
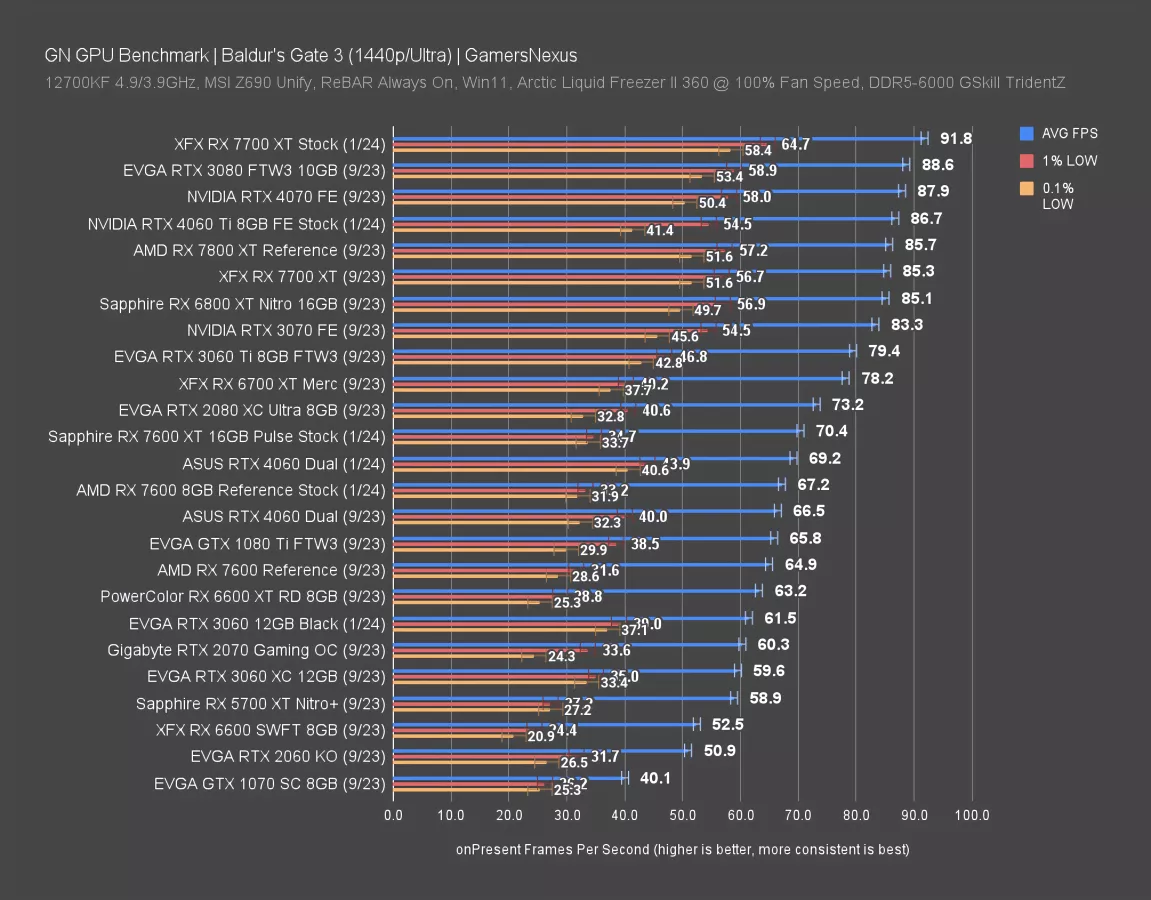
1440p is up now. Old-to-new, we saw a 3.5% uplift in the RX 7600 since September, 4% in the RTX 4060 since the last test, 3.2% for the 3060, and 7.6% in the 7700 XT (watch our review). That’s interesting data to have as well. But for direct comparisons with our new data, the 7600 XT leads the 7600 by the same predictable amount we’ve seen a few times now. The RTX 4060 sits about tied with it once again.
Dying Light 2
1440p Benchmarks
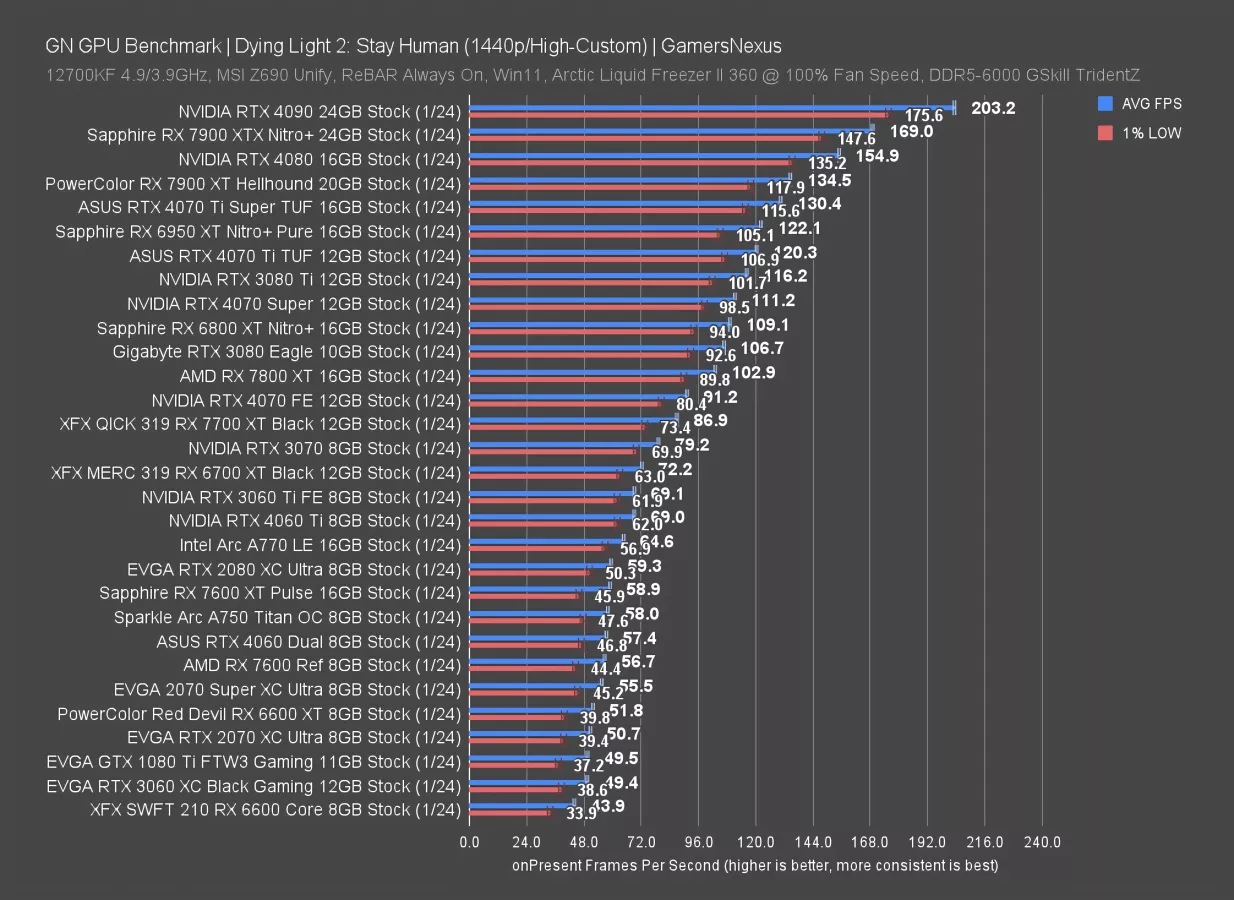
Dying Light 2 from 2022 is up next. In this one, the RX 7600 XT ran at 58.9 FPS AVG -- again, we’ll need every one of those digits -- to the 7600’s 56.7 FPS, a staggering 3.88% difference. If AMD had pulled an NVIDIA and done a price-for-price swap, then we’d be neutral toward that change. But a price hike for under 4% is simply not worth it in this scenario.
The A750 (watch our revisit) manages to outperform the RX 7600 and sits just behind the 7600 XT, including with roughly equivalent lows. That’s great positioning for Intel’s GPU and shows driver maturity. NVIDIA’s RTX 4060 is between the 7600 and 7600 XT as well, with indistinguishable lows. The 4060 Ti leads the 7600 XT by 17% here, so its advantage has diminished in this game.
1080p Benchmarks
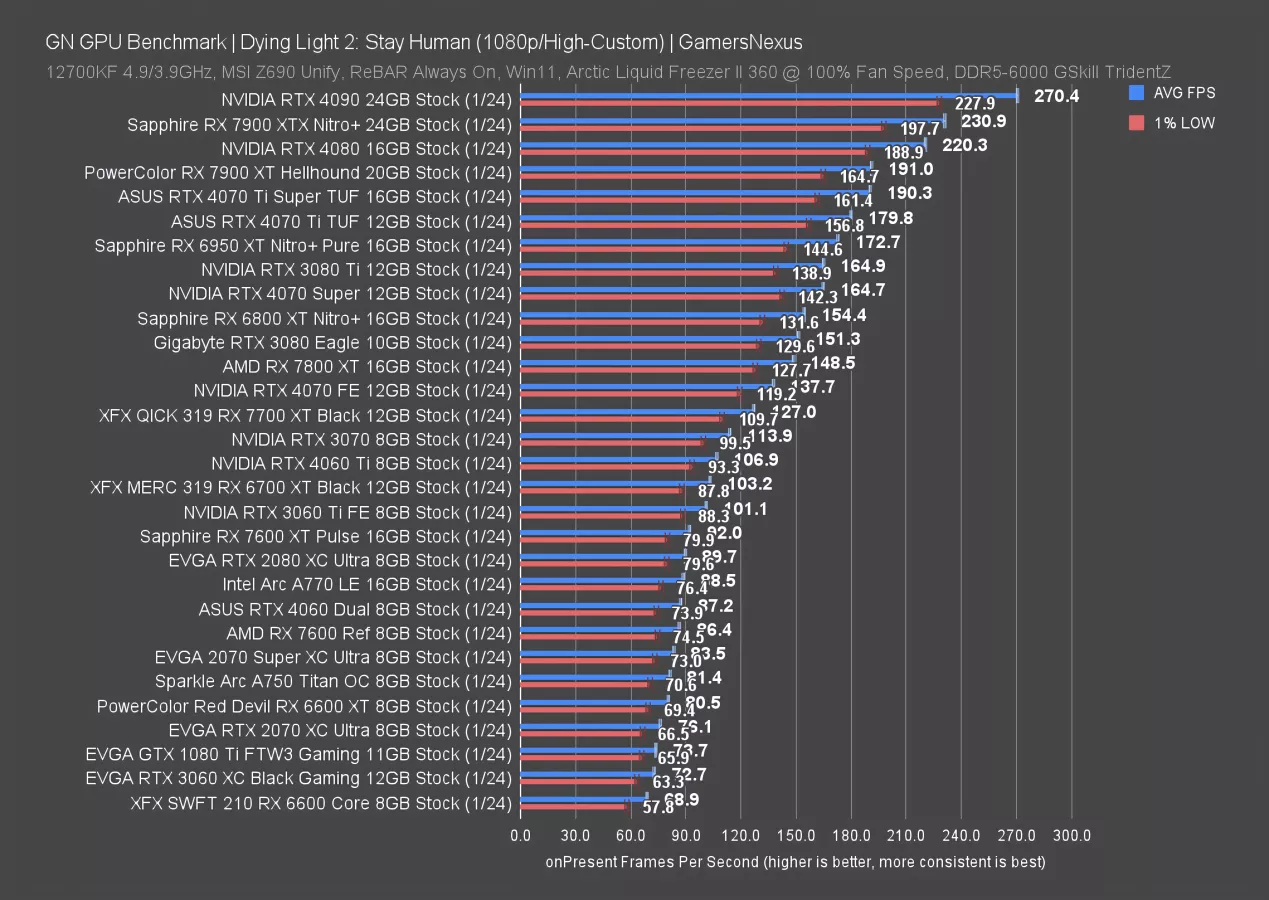
At 1080p, the RX 7600’s 86 FPS AVG allows the new 7600 XT a lead of 6.5%. That’s so exciting. We can’t wait to pay 22% more money for that.
NVIDIA’s 4060 sits between these two again, so this is perhaps one of the limpest games of leapfrog since the launch of Skylake #39.
The A770 is also between the 7600 XT and 7600, with the A750 behind a bit. The 4060 Ti again sets the ceiling for this group of cards. None of the cards on the chart would be worth upgrading from to one of these -- you’d have to go further back, maybe to the 1050 Ti (watch our review).
Now we’re moving to our older and reliable set of benchmarks, which allows us to have years of comparative data against older cards. These are mostly useful for rapidly establishing scaling performance. Although we’re adding new games, we won’t necessarily be replacing the old suite with them. We might run them partly in tandem to give us more percent scaling numbers to work with. It’s also useful for seeing scaling at 4K.
Shadow of the Tomb Raider
4K Benchmarks
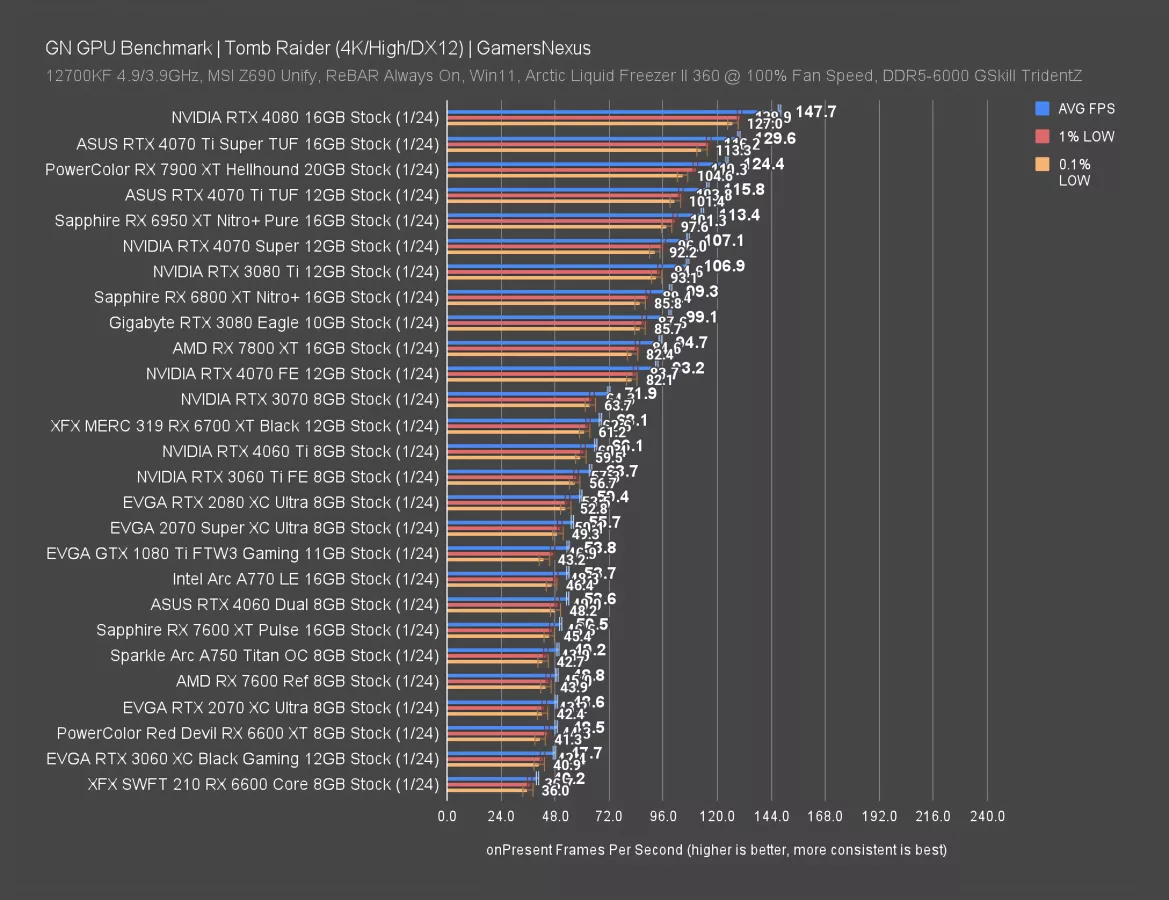
Speaking of, here it is. At 4K, the RX 7600 XT ran at 51 FPS AVG, behind the 4060’s 54 FPS result and ahead of the RX 7600’s 49 FPS AVG result -- wait, sorry, 48.8 -- by 3.5%. Great. Maybe AMD can sponsor another F1 team with all the extra money per XT they sell.
Intel’s A750 runs at 49 FPS AVG here, with lows actually in-step with the average. That has it between the 7600 and 7600 XT while costing significantly less, if you’re willing to deal with occasional Arc driver issues.
1440p Benchmarks
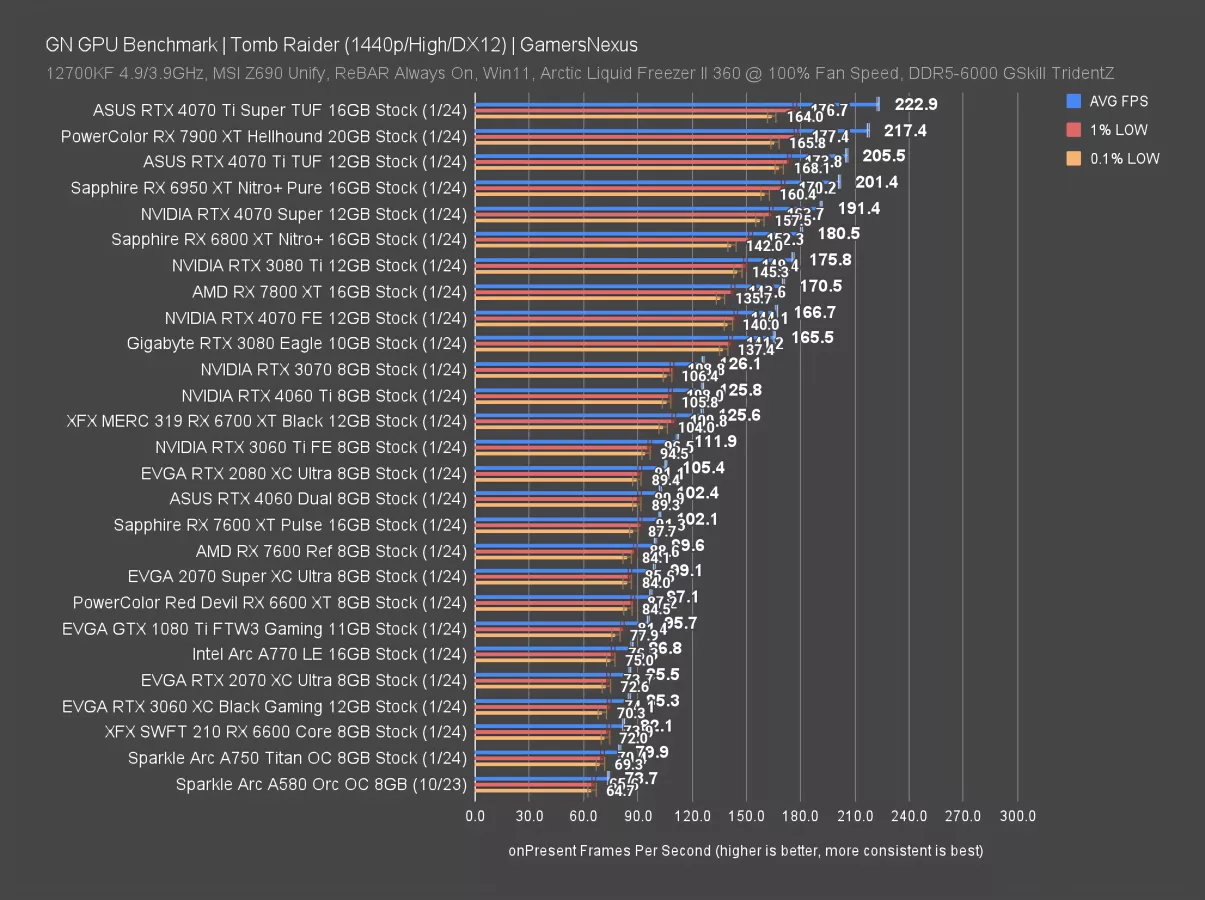
At 1440p, the RX 7600 XT’s 102 FPS AVG has it 2.5% ahead of the RX 7600, tied with the RTX 4060, and meaningfully ahead of the A750 this time. This isn’t interesting, so let’s move on.
F1 22
4K Benchmarks
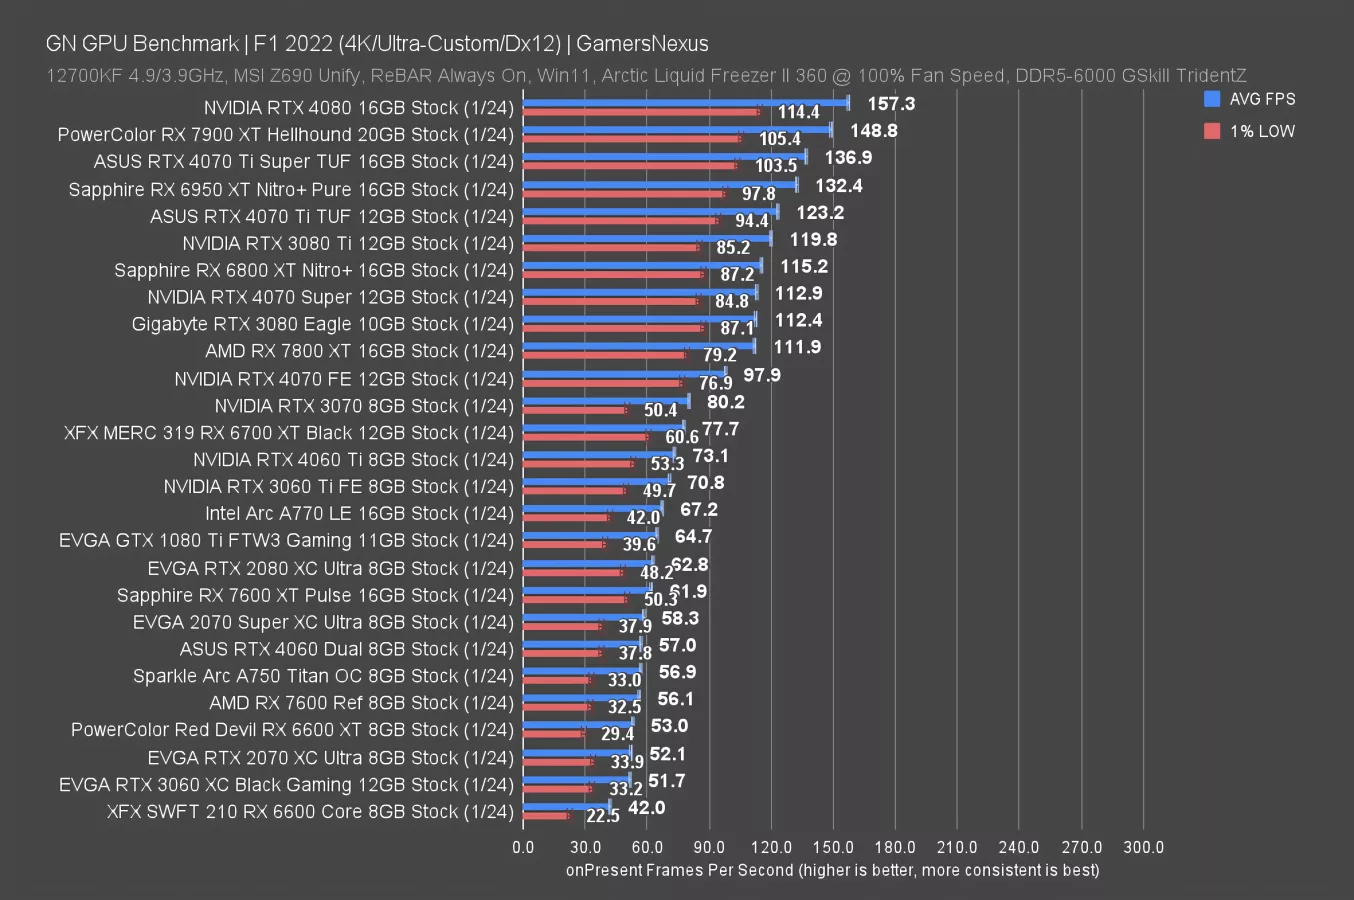
In F1 at 4K, the RX 7600 XT ran at 62 FPS AVG, leading the 4060 by 8.6% and the RX 7600 by 10.3%. That’s at least a more meaningful change. It’s not worth the money for it but it’s one of those sparingly used double-digit numbers. This seems to align with the resolution bump, which is likewise reflected in the lows of the 7600 vs. 7600 XT. The XT does better for frametime pacing here.
As for the 4060 Ti 8GB, that landed at 73 FPS -- a lead over the 7600 XT of about 18%. The Intel A770’s 67 FPS AVG result also leads the 7600 XT here.
1440p Benchmarks
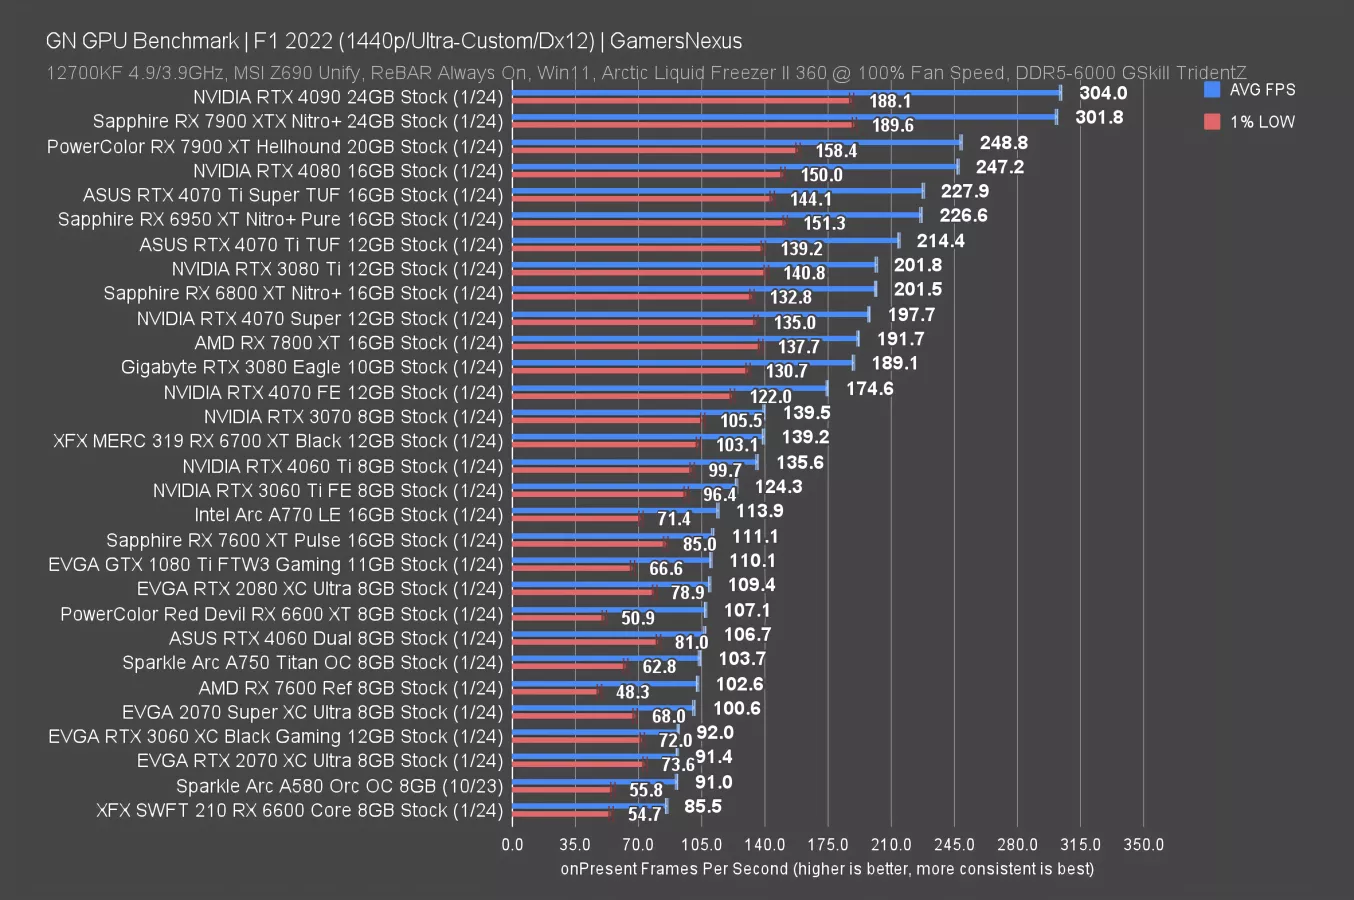
At 1440p, the RX 7600 XT’s 111 FPS AVG result leads the RX 7600’s 103 FPS average result by 8.3%. F1 seems to just scale better between these two.
The A750 is down alongside the RX 7600, with the A770 up with the RX 7600 XT. NVIDIA’s RTX 4060 is between the two RX 7600 cards, creating options every couple of FPS. The total range encompassing all these models is relatively narrow, so it’ll ultimately come down to other features or price.
1080p Benchmarks
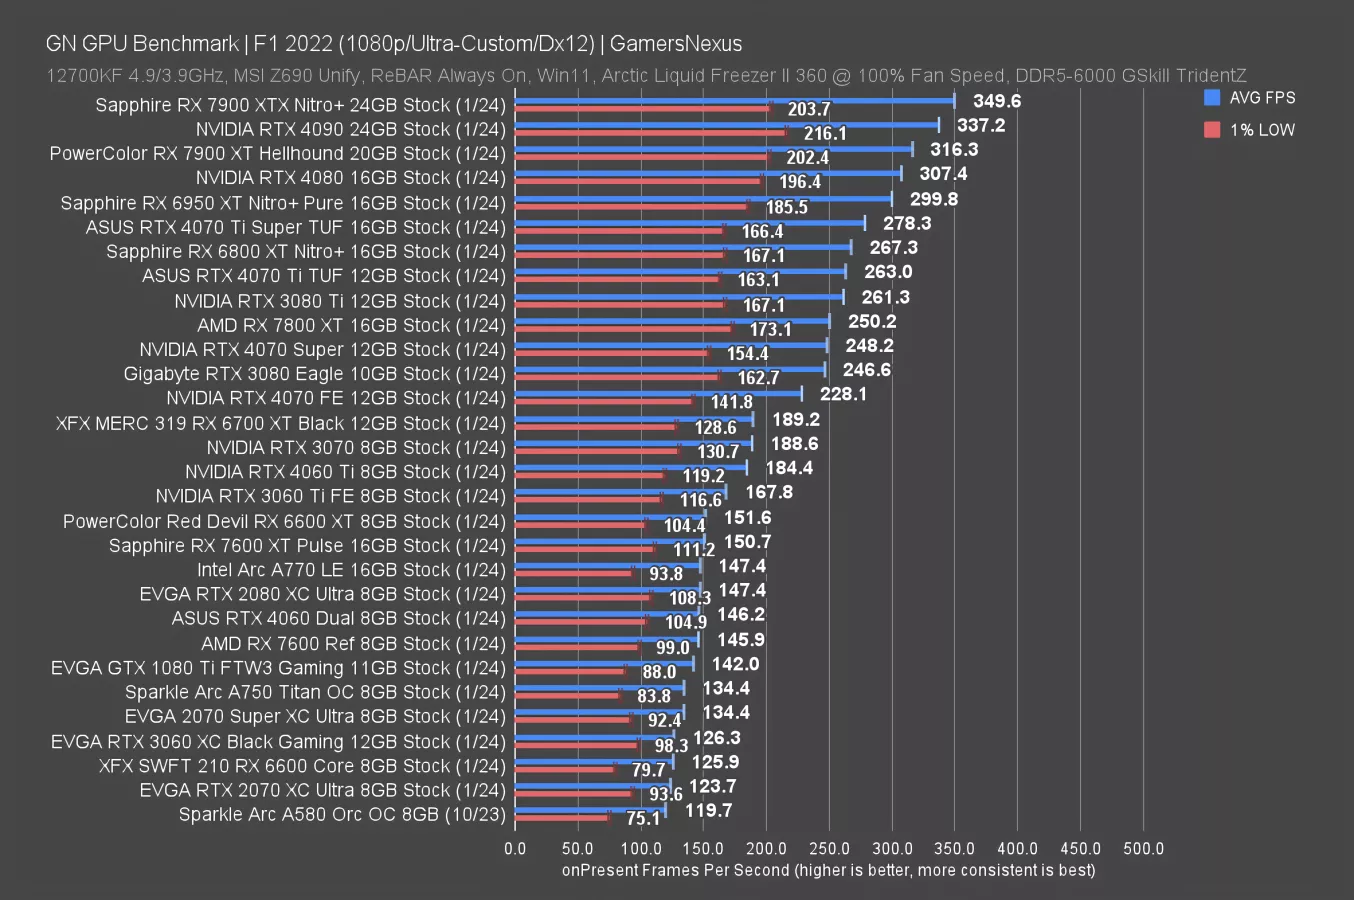
At 1080p, the 7600 XT leads the 7600 by 3.3%, with the 4060 about tied with the 7600. The A750 runs slower than the 7600 here, down at 134 FPS AVG but with acceptable lows. It’s similar to a 2070 Super (watch our review). AMD’s 7600 XT scaling has reduced as we’ve dropped resolution, which makes sense given that most of the improvement is theoretically in memory.
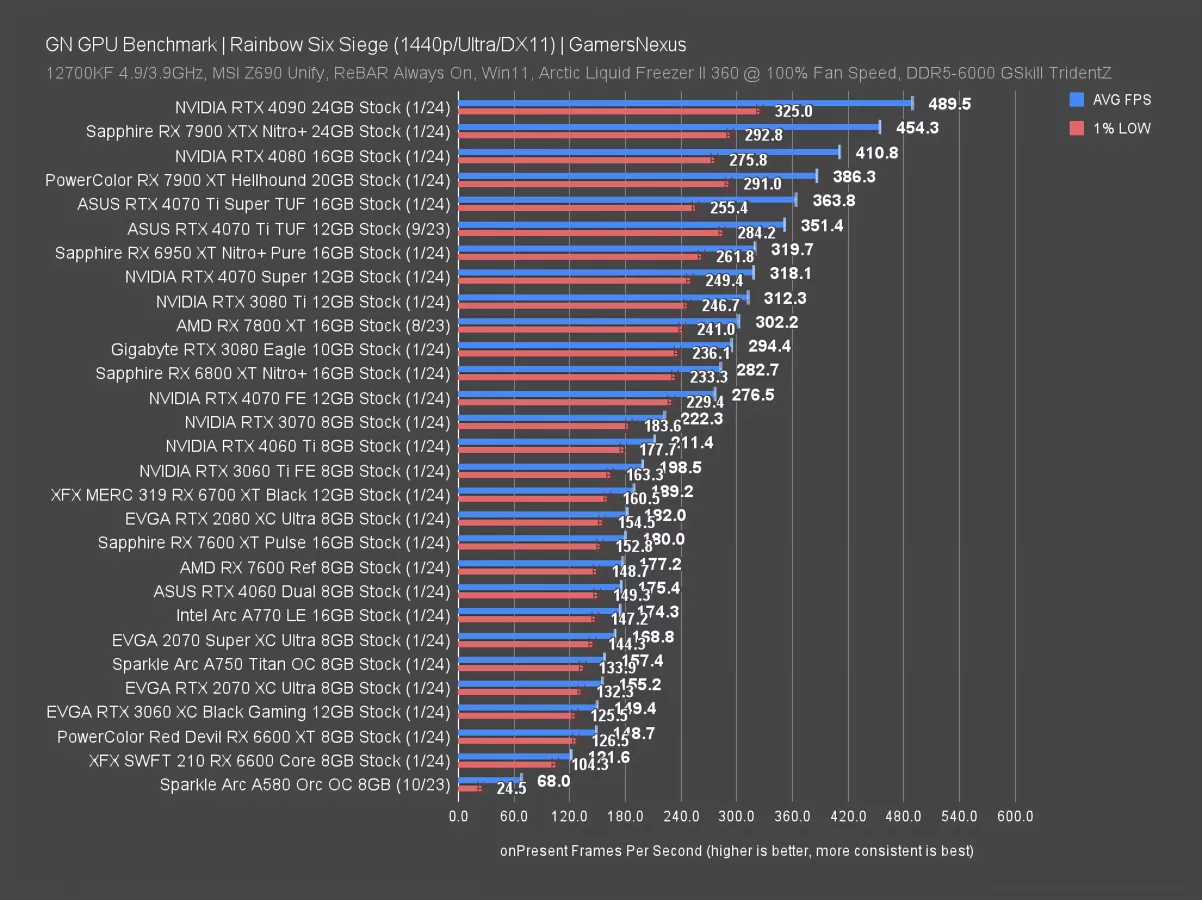
Rainbow Six Siege
4K Benchmarks
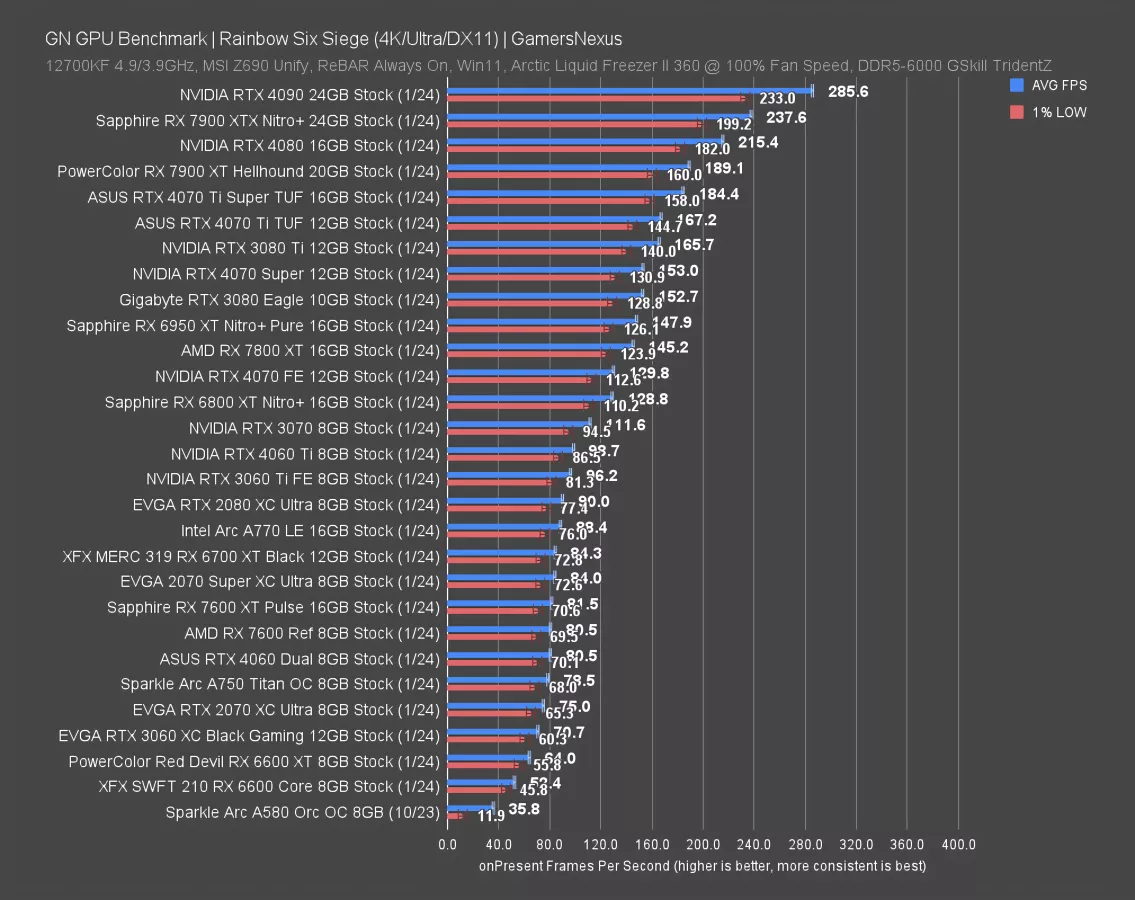
In Rainbow Six Siege at 4K, the RX 7600 XT ran at 82 FPS AVG, leading the RX 7600 by 1.2%. Great. And that’s at 4K. The RTX 4060 is about tied with these results, so they’re all basically within run-to-run variance. The 4060 Ti leads more meaningfully, although has its own issues with getting embarrassed by the 3060 Ti.
The A750 falls behind in this one, but given the new pricing, it’s not in a bad value position at 4K.
1440p Benchmarks
At 1440p, the RX 7600 XT has about a 1.6% lead over the RX 7600. Now, if we worked at AMD, we’d want that number to sound more impressive -- so here’s how to do it: In the 4K test, the 7600 XT was 1.2% better than the 7600. In this test, it’s 1.6% better. So the percent increase in percent increase is actually 33%, which sounds a lot better than 0.4 percentage points and is still technically correct, which is the only kind of correct that matters for marketing.
The RTX 4060 is just behind the RX 7600 baseline card, with the A750 further down the stack than its proportional positioning in other games.
FFXIV
4K Benchmarks
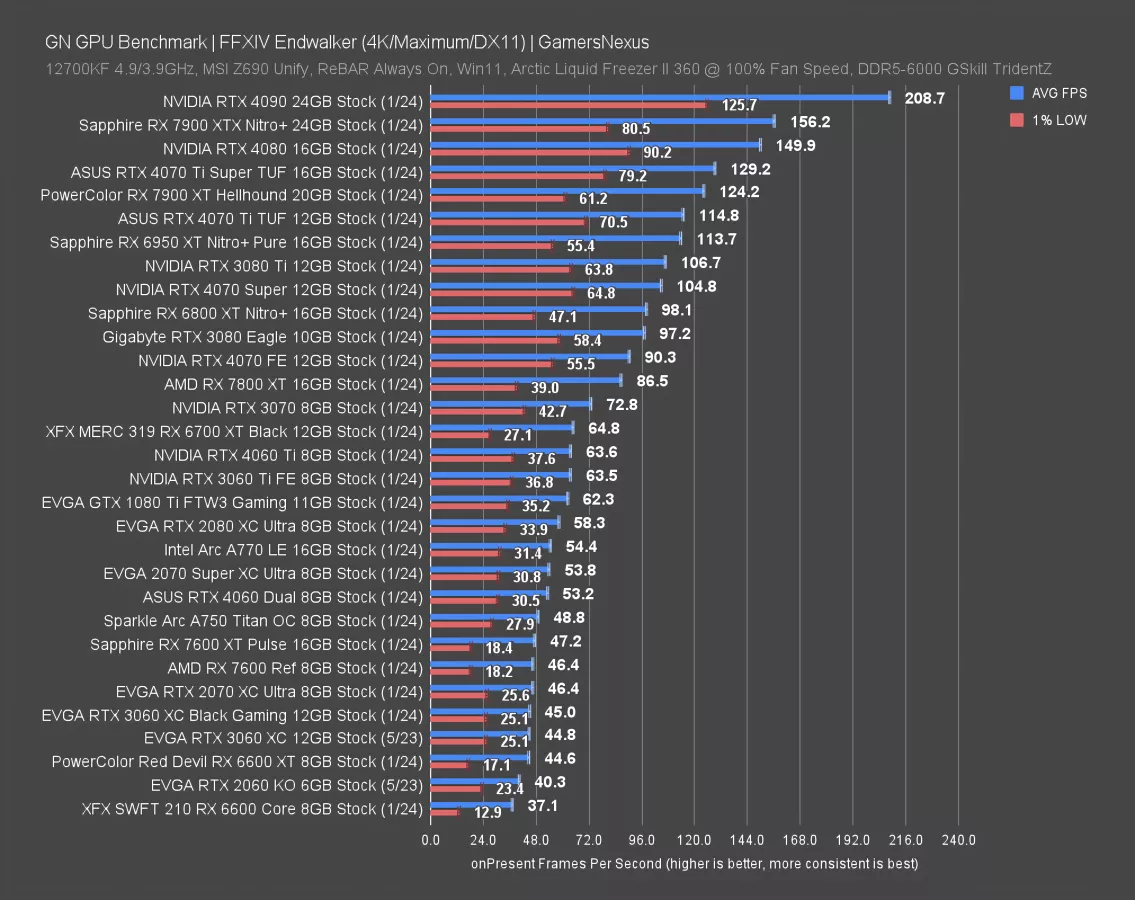
Final Fantasy 14 is up now. At 4K, the RX 7600 XT ran at 47 FPS AVG, leading the original 7600 by all of 1.7%. The A750 actually leads both of these, including in lows, with a 48.8 FPS AVG. The 4060 is ahead of that, at 53 for 4K. That establishes a 13% lead for the 4060 over the 7600 XT. The 4060 Ti’s 63.6 FPS AVG result produces a 19.5% gap over the 4060 baseline card.
As for older cards, the RTX 2070 is similar in performance to the modern 7600. The 7600 XT leads the 6600 XT by about 6%, so not particularly exciting.
1440p Benchmarks
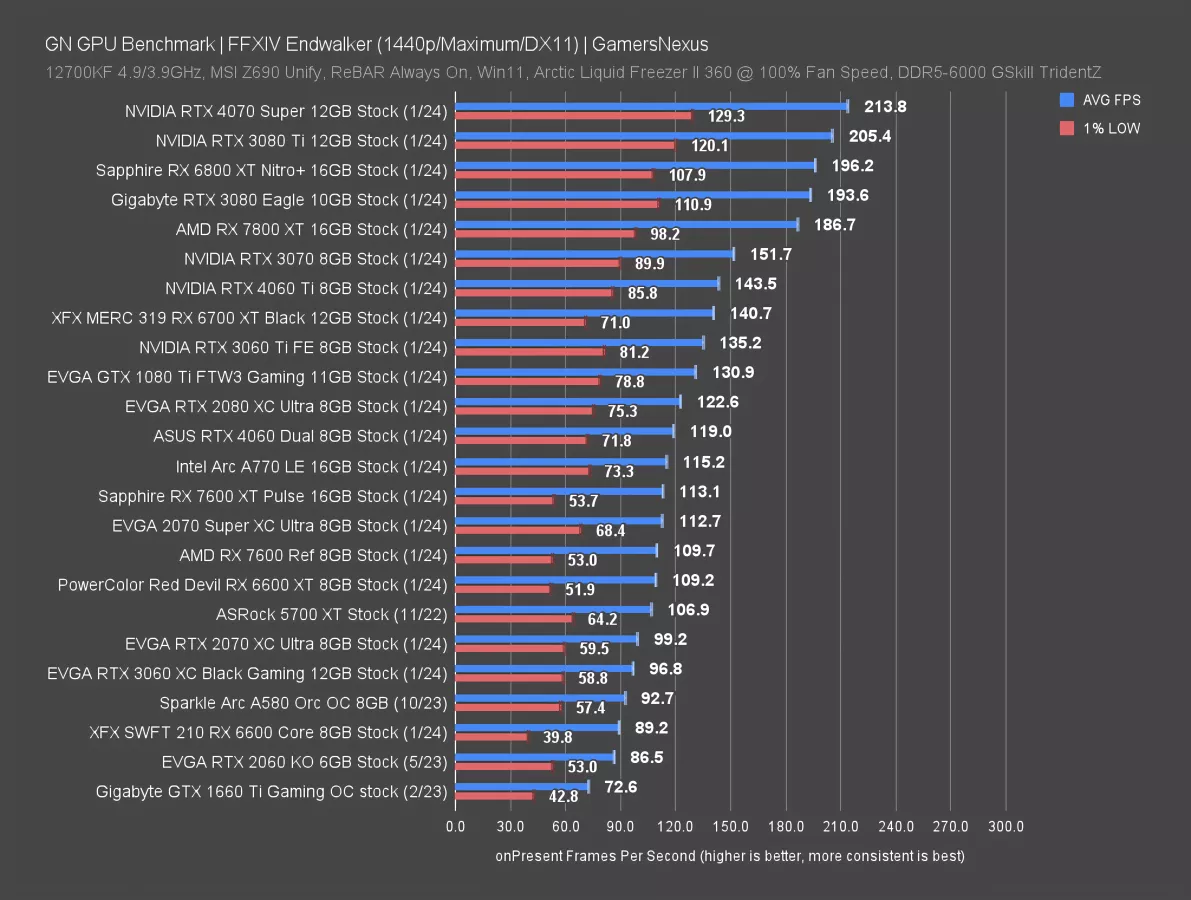
At 1440p, the RX 7600 XT leads the baseline 7600 by 3%, with the RX 6600 XT about tied with the original 7600. Even if these are linked primarily by name, that’s just a disappointing swing. The original launch MSRP of the RX 6600 XT was $380, but we’re going on 3 years since its launch and not much has changed.
GTA V
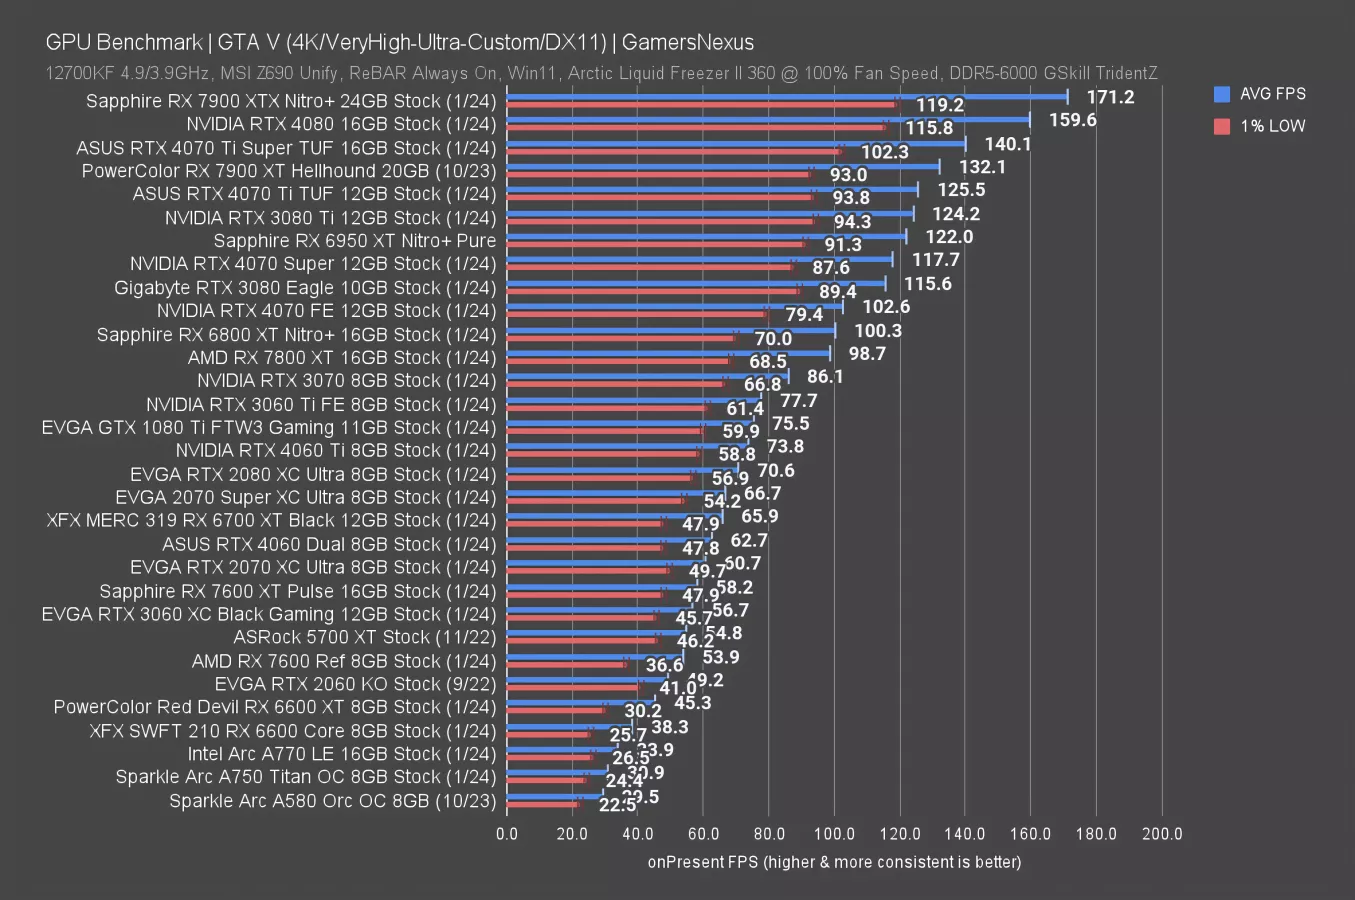
GTA V at 4K at least posts more of a change, but still not enough to justify the price. The 7600 XT gains 8% over the original 7600 here, moving from 54 FPS AVG to 58. That puts the 7600 XT between the 4060’s 63 FPS AVG and the 3060 XC’s 57 FPS AVG. Intel’s A750 doesn’t do that well here, down at 31 FPS AVG. If anything, this test serves to show that Intel’s GPU performance still isn’t as predictable as NVIDIA and AMD options. Generally speaking, we can accurately predict that the 7600 and 4060 will normally be relatively close to each other in performance. But the A750 still bounces around based on the game.

AMD RX 7600 XT Ray Tracing Benchmarks
RT - Cyberpunk 2077
Time for ray traced testing. We’ll start with our freshly re-added Cyberpunk with a mix of RT ultra and RT medium, leading with RT medium.
1080p/Medium RT Benchmarks
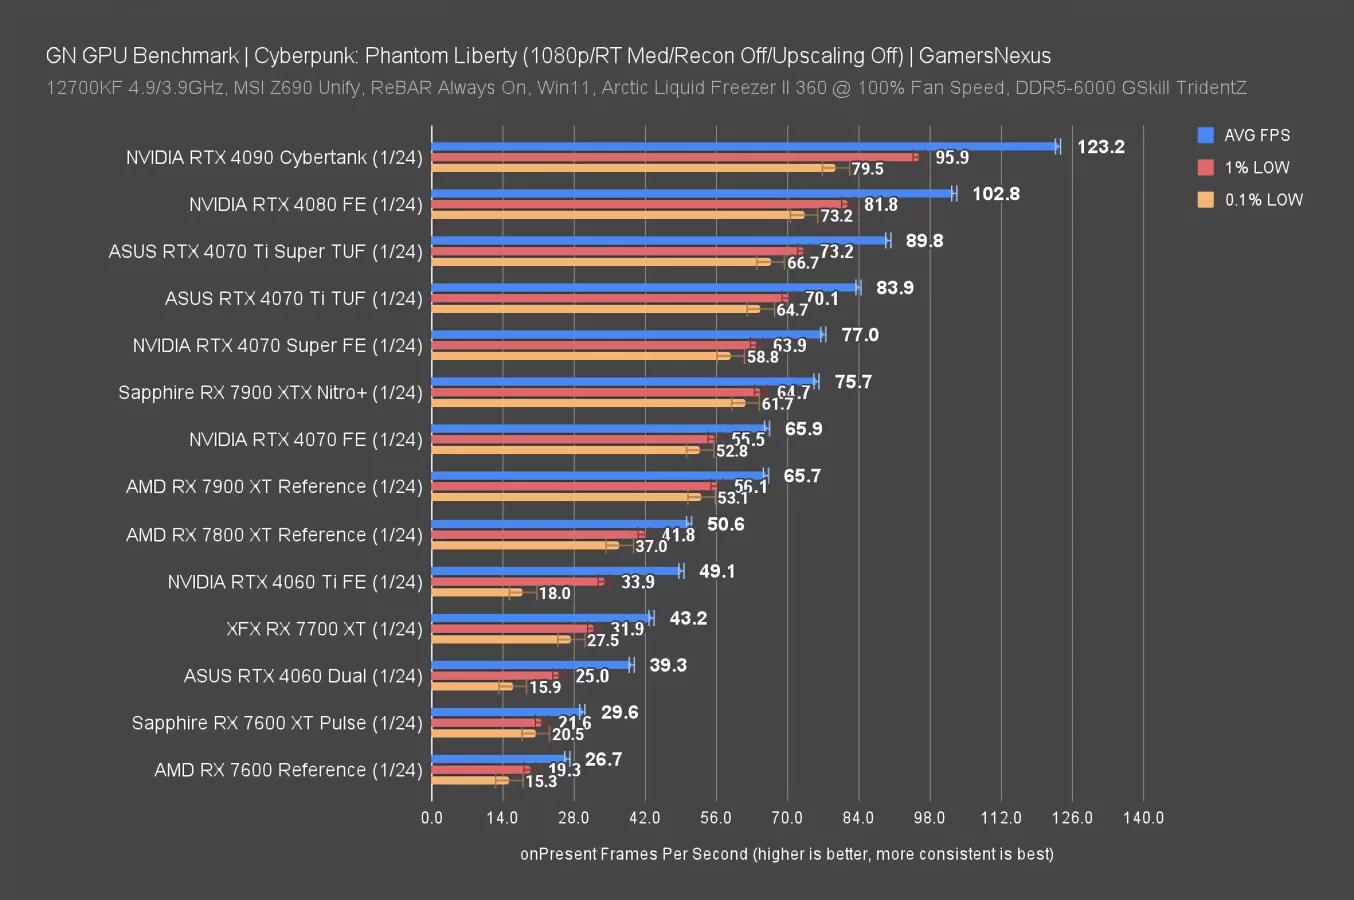
At 1080p and with medium RT settings, the RX 7600 XT and RX 7600 are about equal to an end user without upscaling. Upscaling mostly proportionally scales, so you can factor that in if you’d like. The difference is about 11% for these results. There is no heavy constraint on VRAM here -- at least, not anything exceeding what the cards are already capable of.
As for the RTX 4060, its lead is massive here, as discussed in the summary charts. We also saw that with the 7900 XT tying the RTX 4070 here, and it gets worse as RT load increases with Ultra.
You could make this work on the RX 7600 cards with upscaling and settings tuned down a little more.
1440p/Medium RT Benchmarks
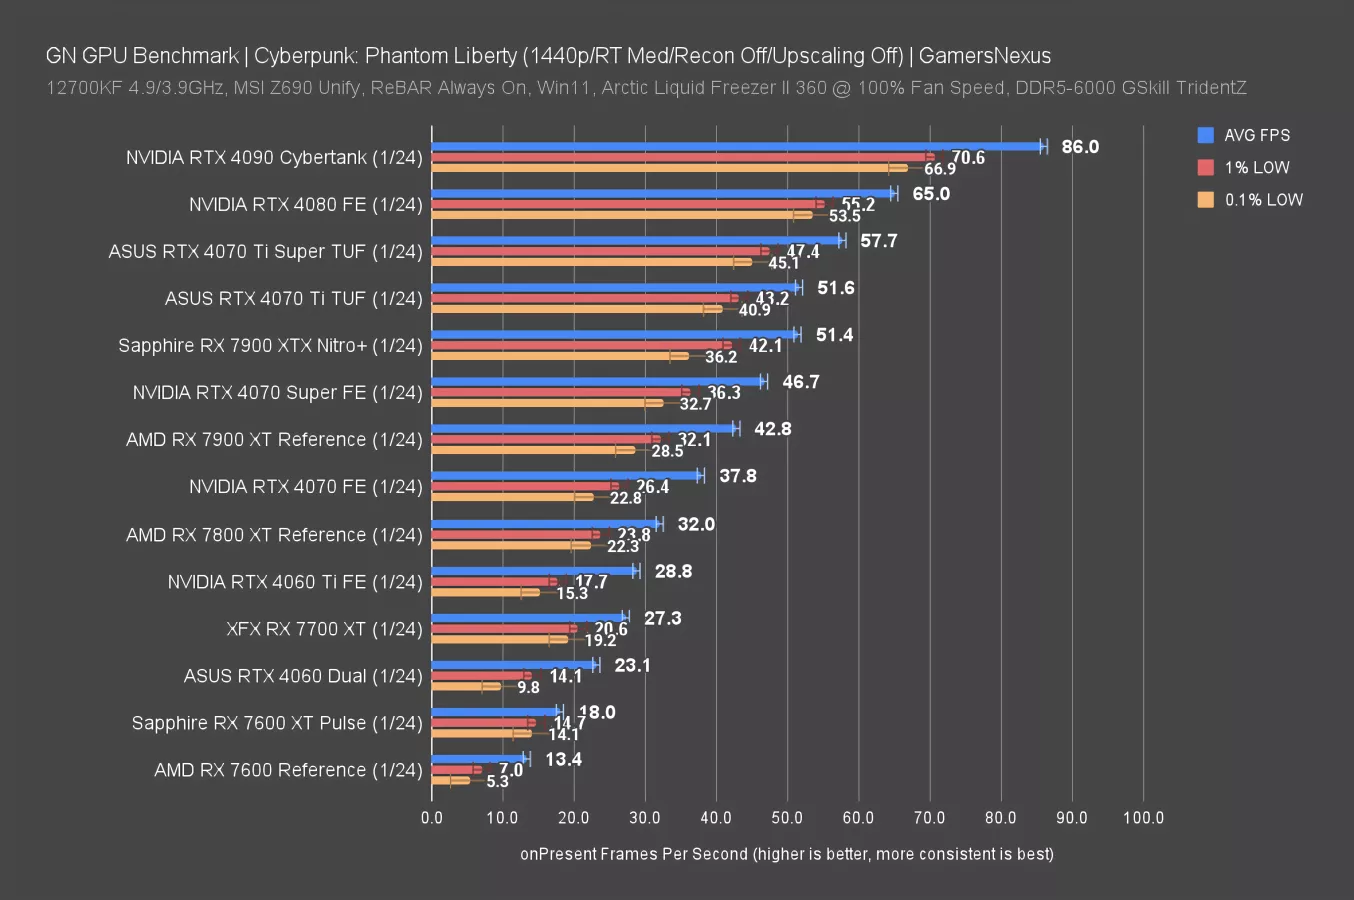
At 1440p and with medium still, the RX 7600 XT posts an 18 FPS AVG result. This is more for an academic exercise: The RX 7600 is actually struggling enough here that its FPS becomes unreliable and generally spikier, we have less data to work with, and it is also starting to get overloaded. Also, in situations of percent scaling, a +/- 1 FPS change can have a big impact on the difference calculated, so these tend to get exaggerated. Regardless, the XT is significantly improved here.
Memory is never so simple, though: the RTX 4060 has less than the 7600 XT, but its baseline performance and ability to process RT helps it keep a lead.
1080p/Ultra RT Benchmarks
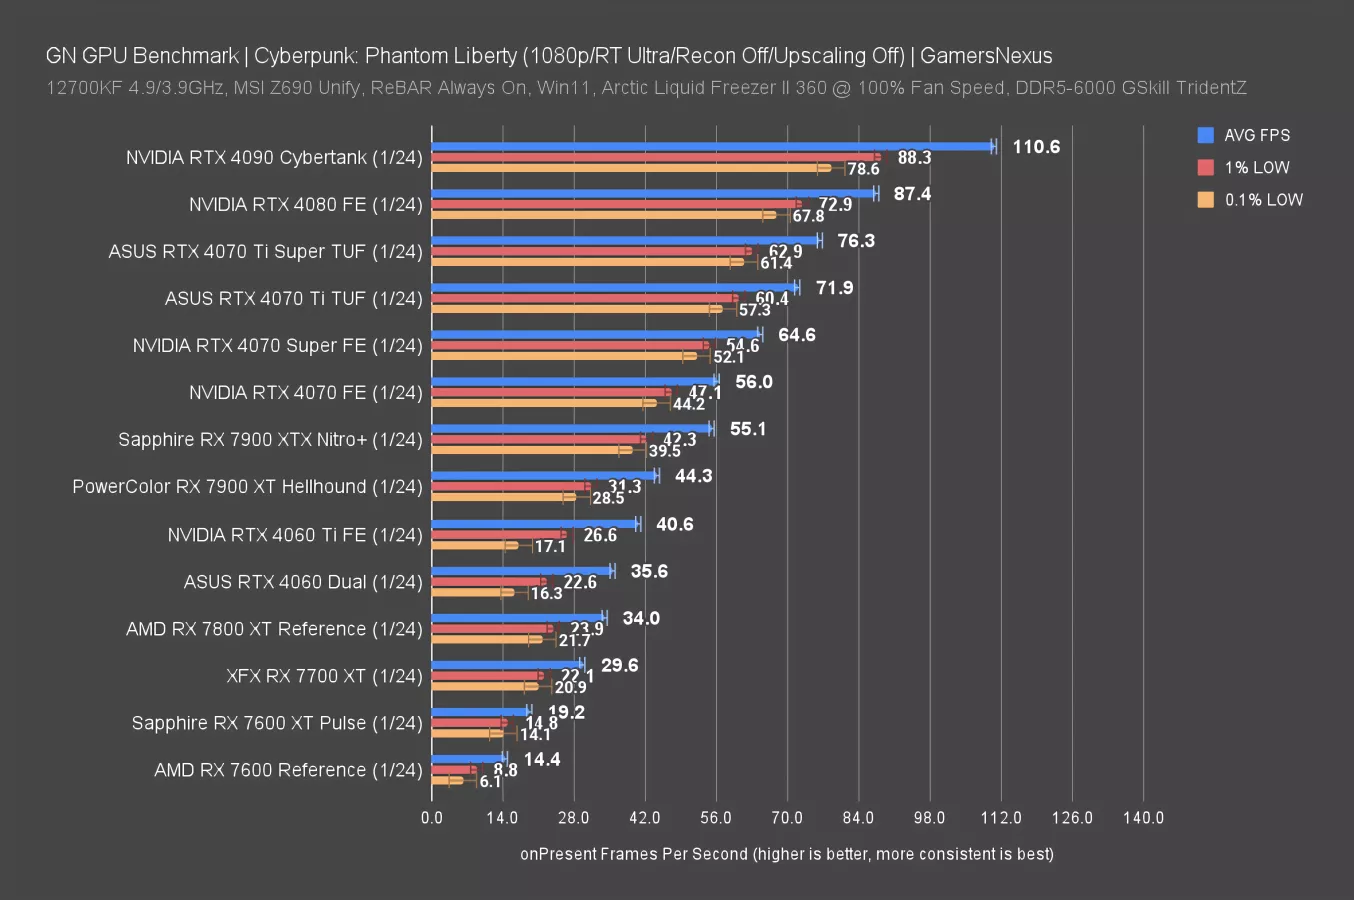
At 1080p/Ultra, the RX 7600 XT and RX 7600 post similar scaling to the 1440p/Medium results. The RTX 4060 leads the RX 7600 XT by 85% here. Again, with this higher RT load, NVIDIA is scaling better.
RT - Dying Light 2
1440p Benchmarks
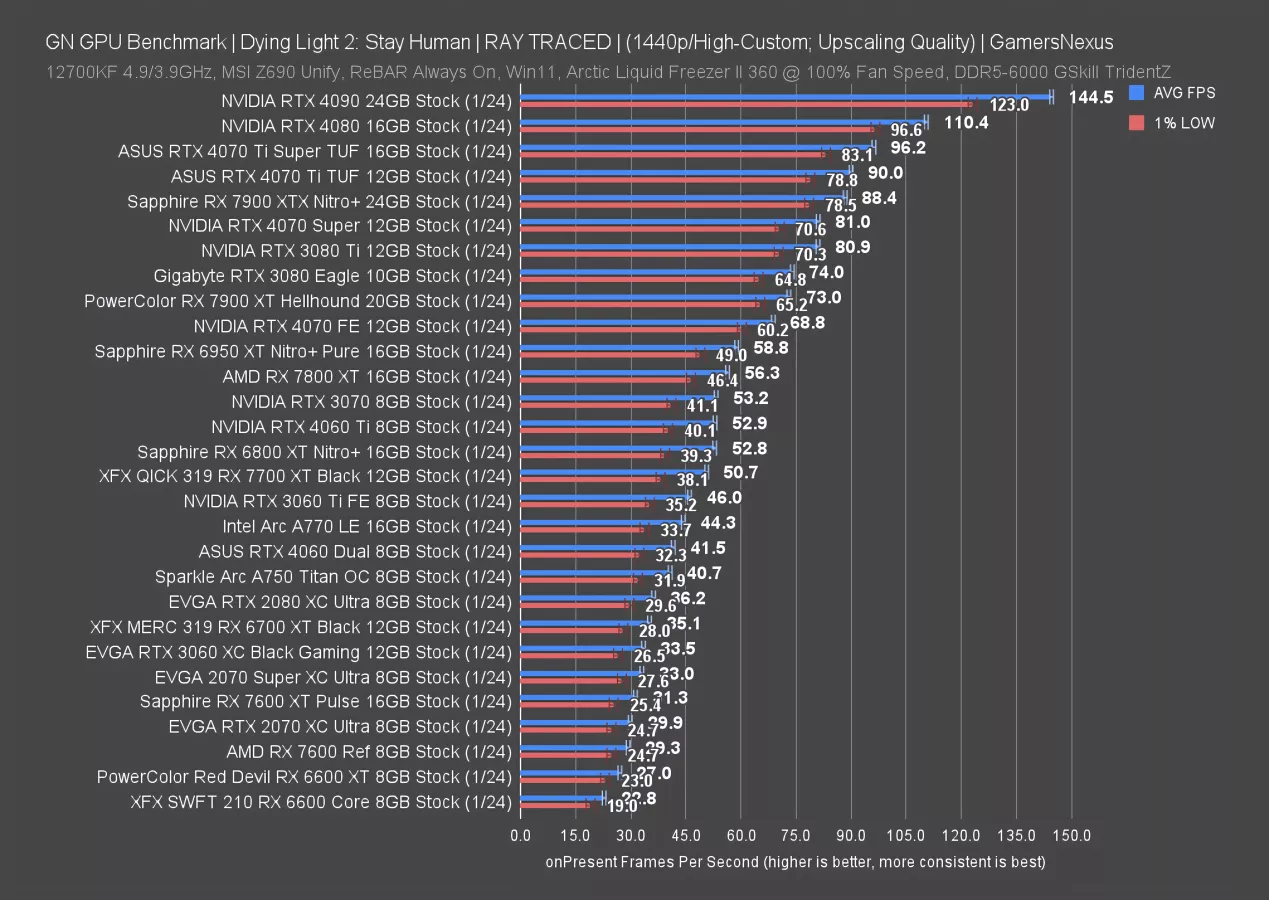
Now for Dying Light 2 with ray tracing and at 1440p. Here, the RX 7600 XT ran at 31.3 FPS AVG, leading the 7600 by about 6.8%. That’s on the higher side, but still not a huge swing for the price. The RTX 4060 runs this one at 41.5 FPS AVG, leading the 7600 XT now by 33%. The 4060 Ti has an advantage of 70% over the 7600 XT, not distant from the RX 7700 XT.
AMD’s 7600 series cards have a particular weakness in some ray tracing tests, and that’s showing here.
1080p Benchmarks
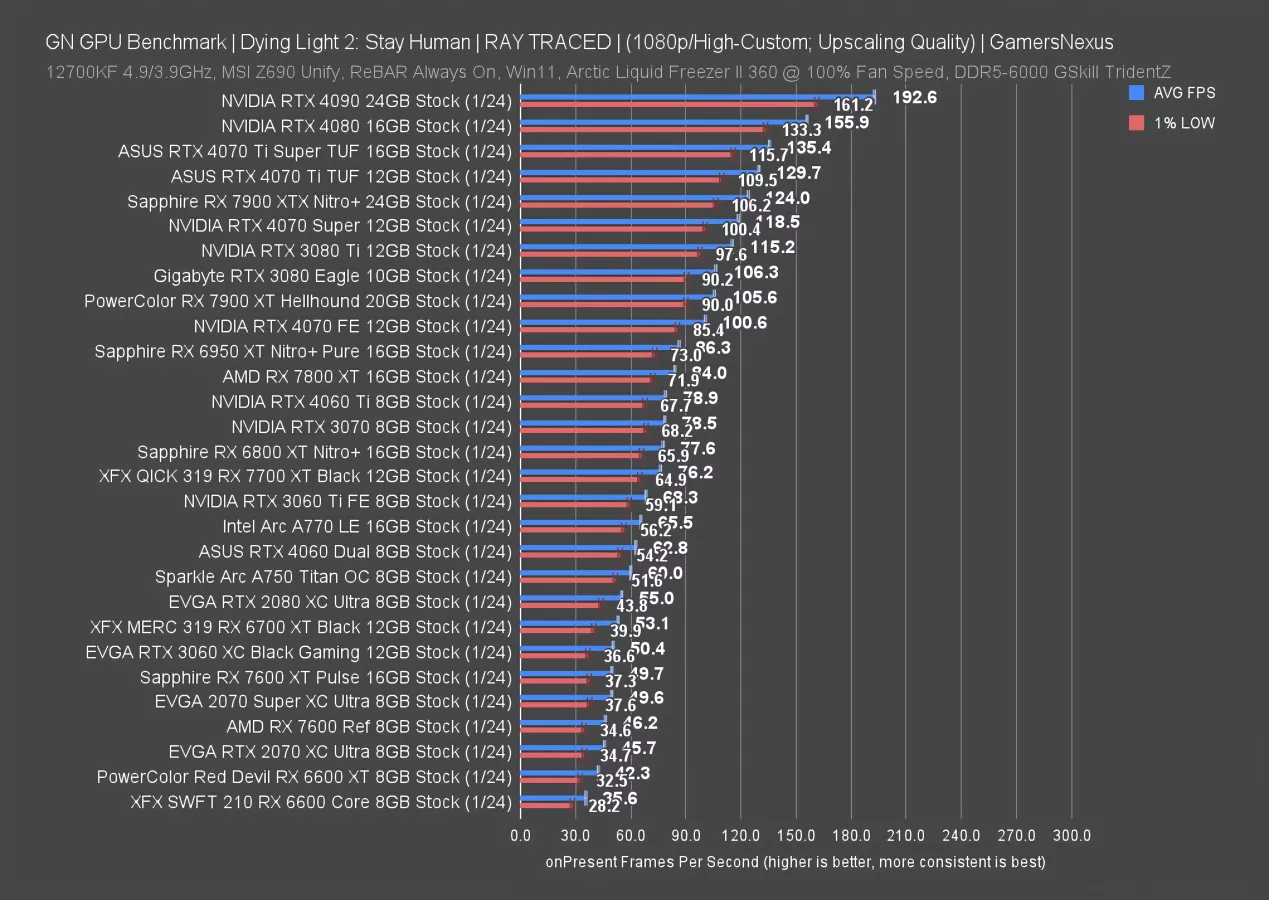
At 1080p, we’re seeing a 7.6% advantage in the 7600 XT over the original RX 7600. The cards still struggle though, ultimately landing below the Intel A750 and RTX 4060, both of which are in the low 60s for framerate. AMD is struggling to get into the 50s with its RX 7600 series cards.
RT - Resident Evil 4
1440p Benchmarks
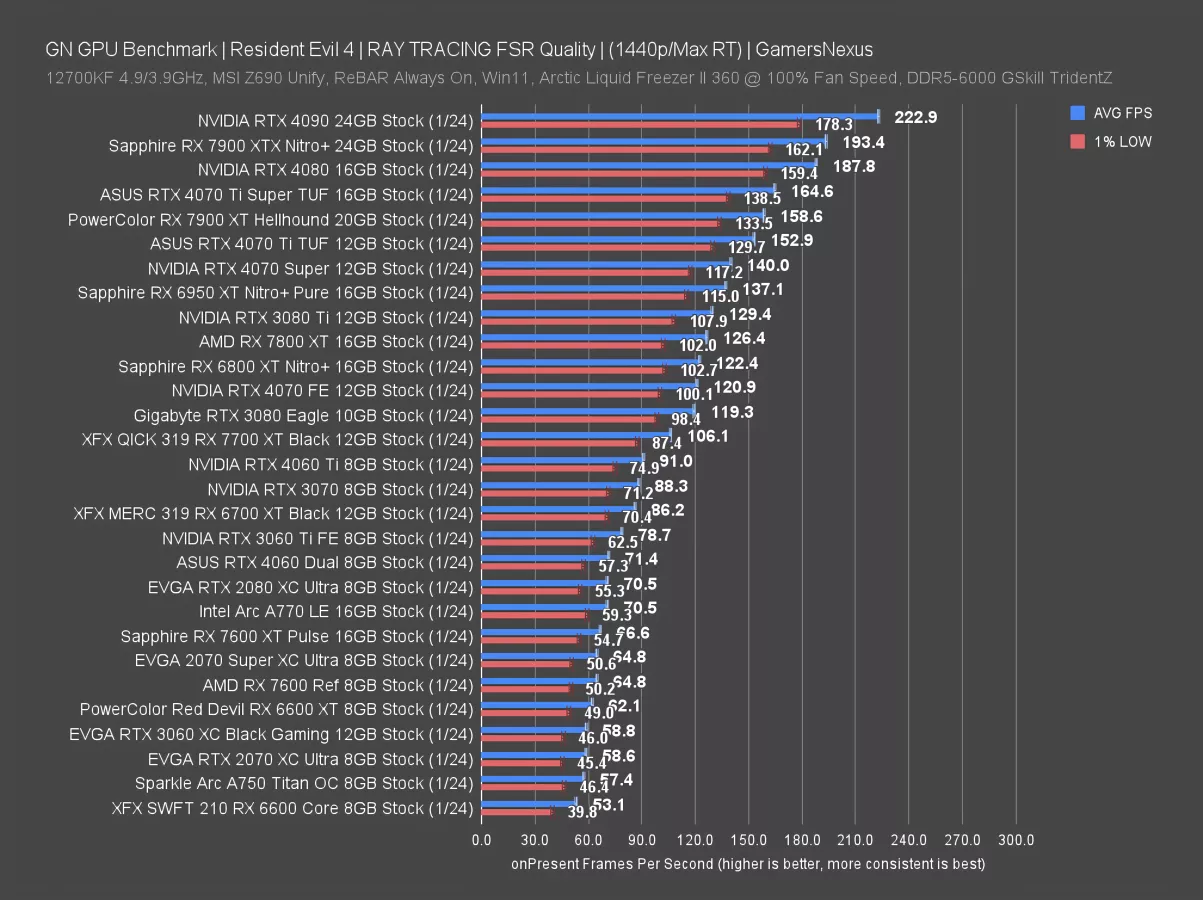
In Resident Evil 4 with ray tracing and at 1440p, the RX 7600 baseline performed at 65 FPS AVG, establishing an improvement of 2.8% for the RX 7600 XT. That puts the RTX 4060 up at 71 FPS AVG, or 7% ahead of the RX 7600 XT.
1080p Benchmarks
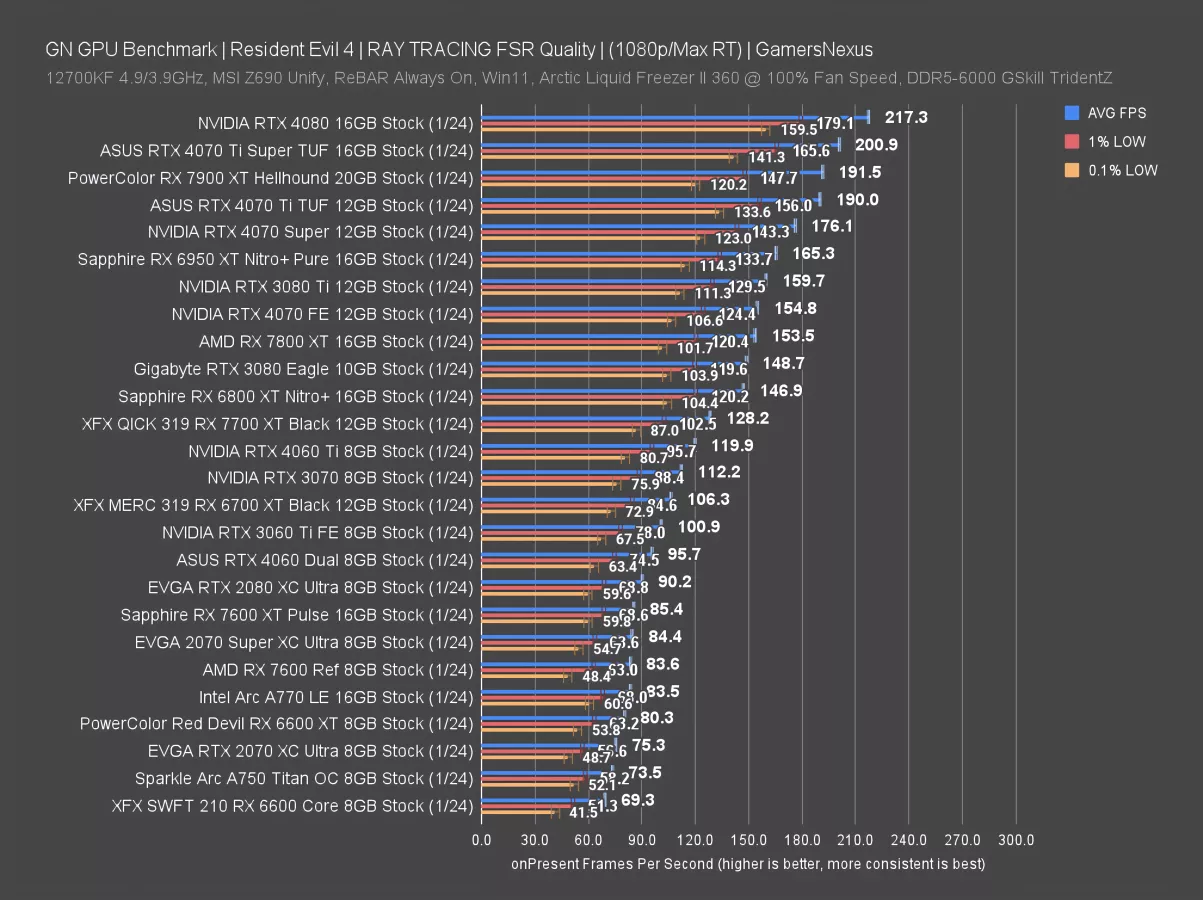
At 1080p, the RX 7600 XT leads the 7600 by 2.2%. The 4060 is about 12% ahead of the 7600 XT in this one. The gap isn’t as wide here for an RT test as we’ve seen in Dying Light and Cyberpunk for NVIDIA.
AMD RX 7600 XT Power Consumption
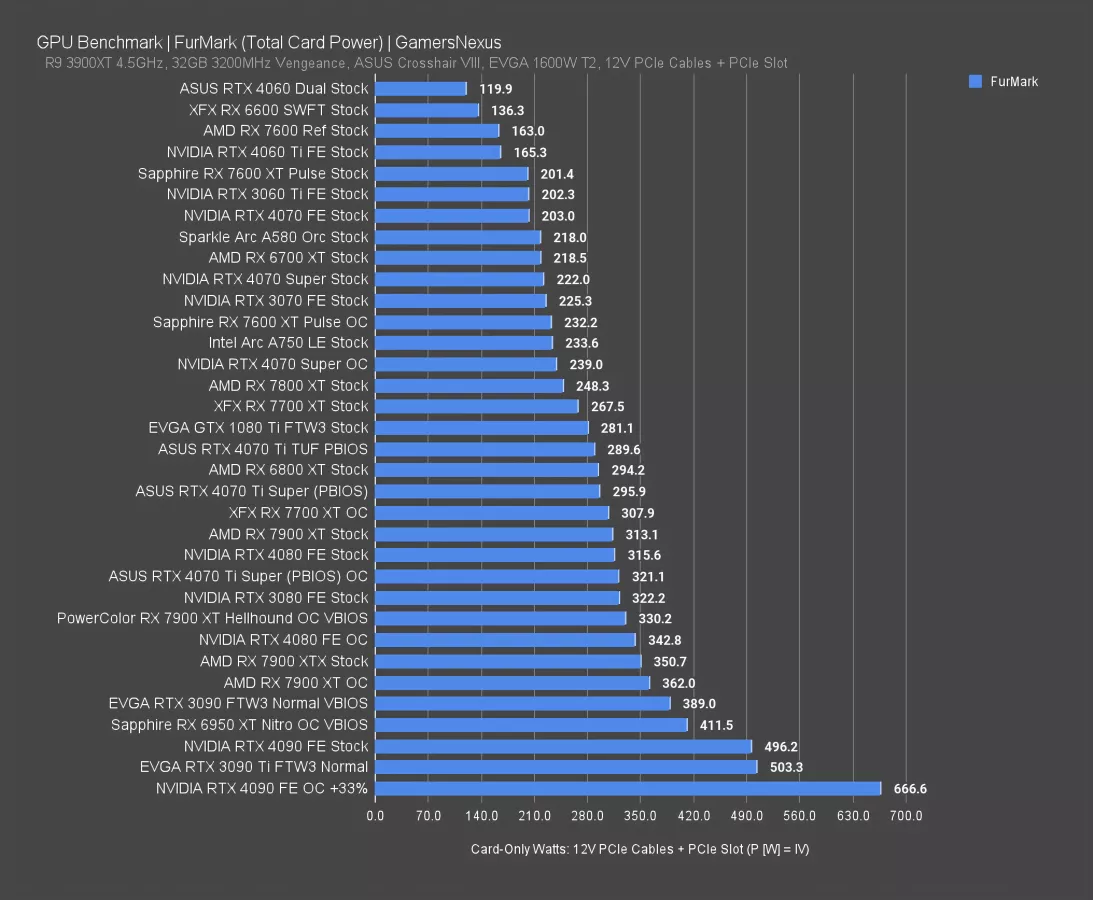
Finally, in flat-out, 100% power consumption and fully maxed -- which is similar behavior to what you’d see in a completely taxing render workload -- we have the RX 7600 XT at 200W against the original 7600 non-XT’s 163W. That’s where a lot of the performance uplift is coming from: In situations where we did see 10% or 12% swings, like in Starfield and F1, it’s derived from the added power budget more often than from the memory change alone. The VBIOS allowed up to 232W when overclocking, which had it roughly aligned with the much less efficient A750. NVIDIA’s 4060 holds an overall efficiency advantage here.
AMD RX 7600 XT Conclusion

This 7600 XT isn’t particularly interesting and serves as a great reminder for everyone that more memory doesn’t automatically make a card better. There is a functional limit to what can be leveraged, and it’s not just limited by bandwidth, but also by what the cores are capable of.
In this instance, the card is generally not powerful enough to leverage the memory. In the one instance we found where it was memory-bound, there was a huge swing -- it’s just not common enough to shop for. The rest of that average 5-7% uplift comes from the power increase and clock increase.
We can’t recommend this card. It really just doesn’t make sense at the price and is a boring launch, especially flanked by Super cards that at least had the courtesy to retain a price with the upgrade or drop it. AMD is in a tough spot in the $200-$300 market: It’s flanked by its own older options, like the 6700 XT, and in the $200 class, by Intel’s increasingly relevant Arc A750 GPU.
We’d pass on this one. Simple as that.