Intel i5-10600K CPU Review & Benchmarks vs. Ryzen 5 3600, i9-10900K, R7 3700X, & More
Posted on
Right after we said that an AMD R3 CPU is “enough for gaming,” stealing the old Intel mantra from many generations ago, Intel decided to launch its 10-series CPUs. Intel calls this “10th Gen,” but in reality, it’s the nth Gen of a long-standing architecture. We’ve lost count at this point, but either way, it’s the 10-series of processors. The i5-10600K is the one we’re reviewing here, and it’s actually repositioned to resurrect that old “an i5 is enough for gaming” phrasing from the days of the i5-4690K and i5-6600K. This, we think, is the more interesting CPU as compared to Intel’s i9-10900K that we reviewed in the previous video, but both have points of intrigue. The biggest one is core-to-core deltas in thermals now that Intel is sanding the die down, something we showed previously in our i9-10900K delid. Today, we’re reviewing the i5-10600K.
NOTE: THIS IS A DELAYED PUBLICATION OF OUR 10600K REVIEW FROM YouTube. If you already saw this on YouTube, it's the same thing, just the written format. We have not changed anything, so new information we've uncovered about the 10600K isn't included post-launch and you'll need to check our channel for follow-up coverage, like our in-depth tuning piece on the 10600K.
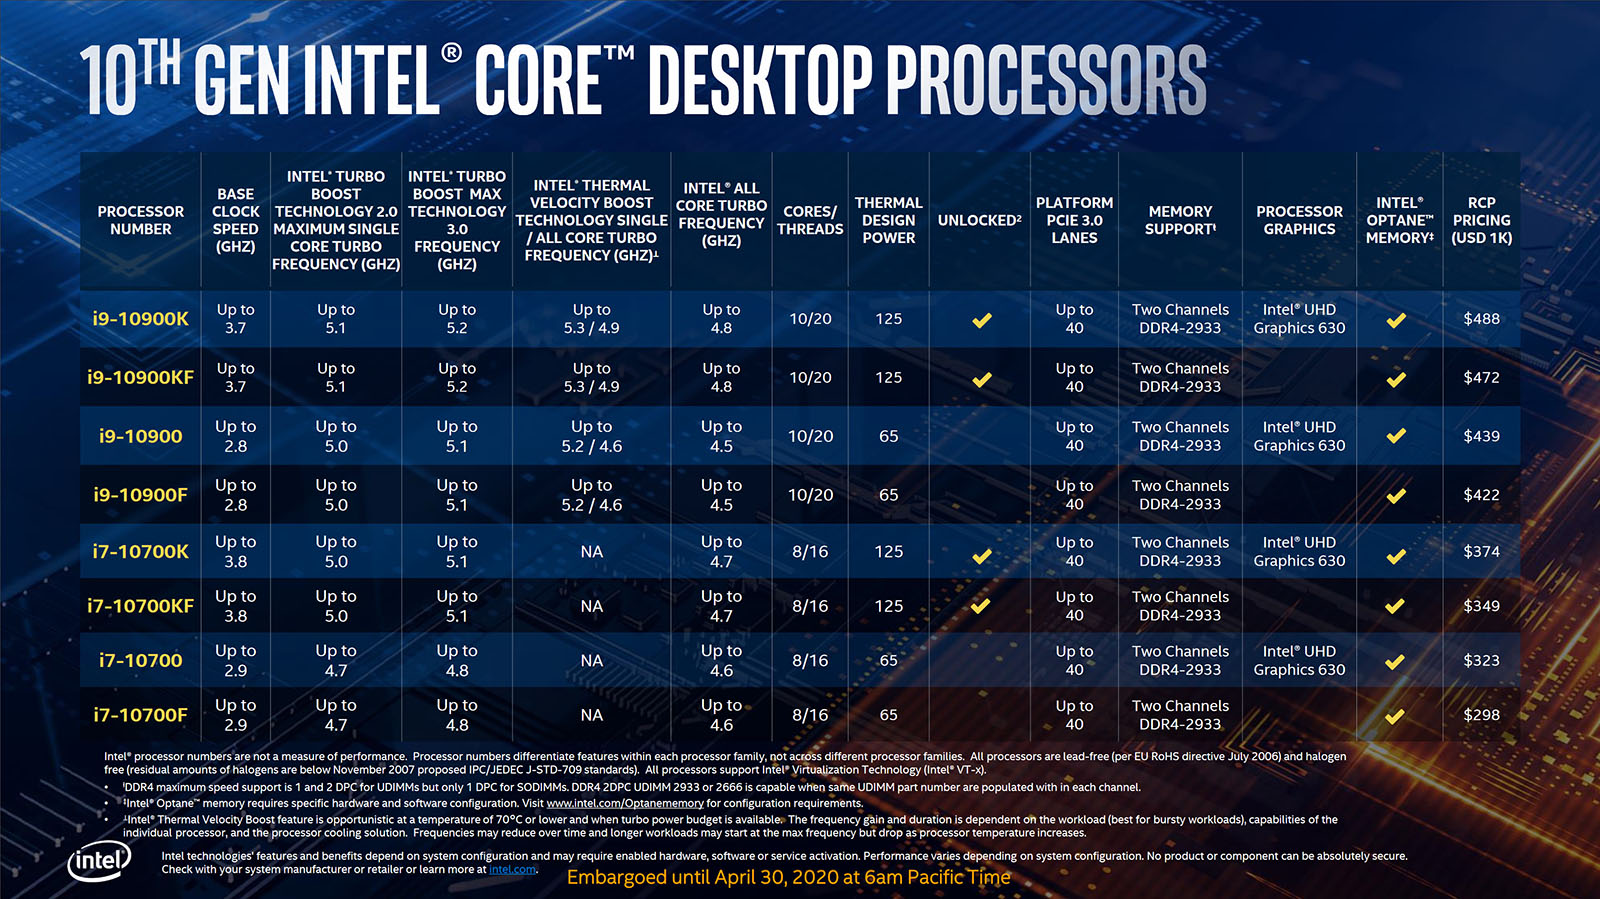
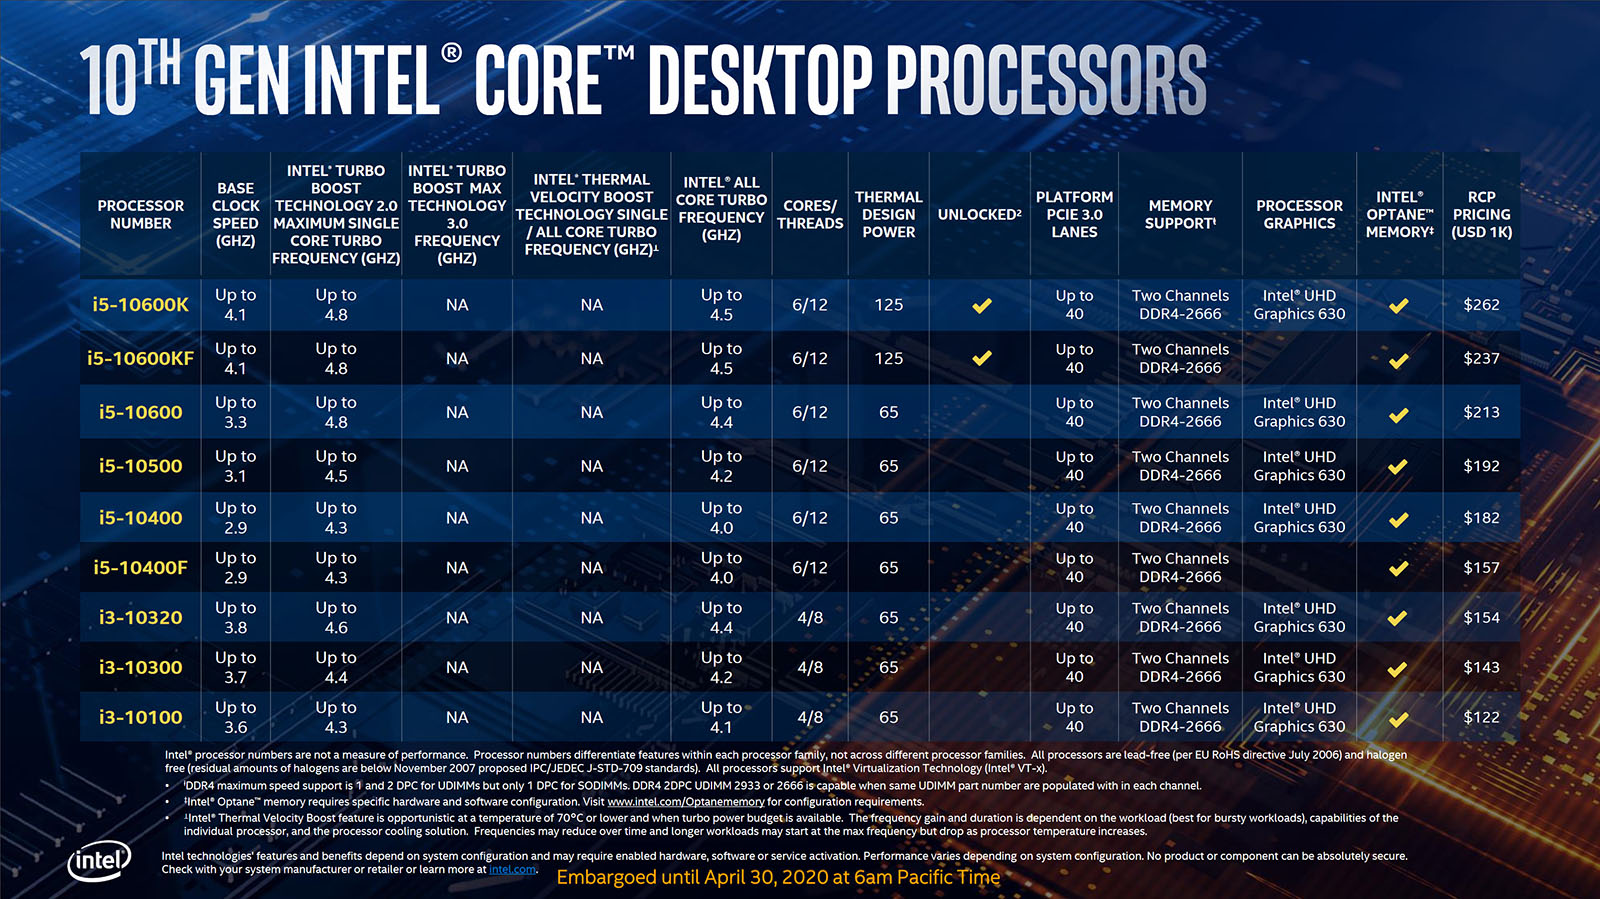
We won’t recite the spec sheet to you, but if unfamiliar with the specs of Intel’s new lineup, you can check our initial news recap for that. However, we’ll bring up a couple of important notes as it relates the i5-10600K. First things first, the naming. As we’ve stated multiple times now, Intel’s naming nomenclature is getting tired and convoluted; we don’t expect anyone to keep up, because frankly, we can barely keep up. As ever, it’s important to remember Intel’s suffixes. The i9-10900K and i9-10900X are two very different parts, and users have already mistaken the two. A “K” suffix explicitly denotes an unlocked multiplier, while an “X” suffix identifies a CPU belonging to Intel’s HEDT line.
Secondly, the i5-10600K does not come with Intel’s Thermal Velocity Boost (TVB). The i5-10600K strictly operates with 4.1GHz base and 4.8GHz boost, subject to Intel’s Turbo Boost 2.0 technology for single-core turbo frequencies. Intel’s TVB defines a 70C threshold (for desktop parts) and temporarily boosts the maximum single-core turbo by two bins (200MHz) assuming the chip is operating under that threshold. Again, this feature is not present with the i5-10600K and is limited to the upper end of the stack, like the i9-10900K and i7-10700K.
Last but not least, Intel may have listed its, uh, “cock speed” at 4.8GHz for this CPU, but we were disappointed to find out later that it’s actually supposed to say “clock,” and that Intel did not actually reinvent overcocking. So, while we will be overclocking the i5-10600K, it seems overcocking is out.
Next, we’ll get into some benchmarks, where we’ll keep a careful eye on how the i5-10600K performs (both stock and overclocked) relative to the neighboring competition. That would be AMD’s Ryzen 5 3600 and Ryzen 7 3700X.
Thermal Improvement
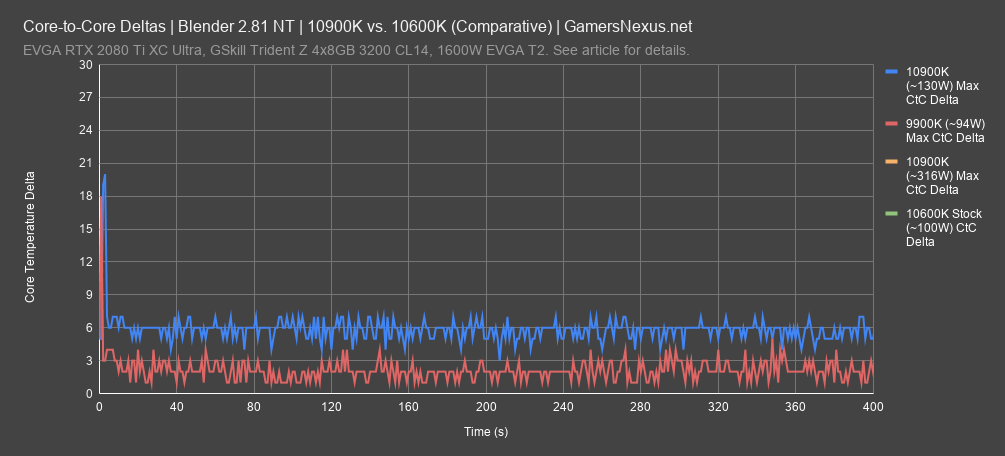
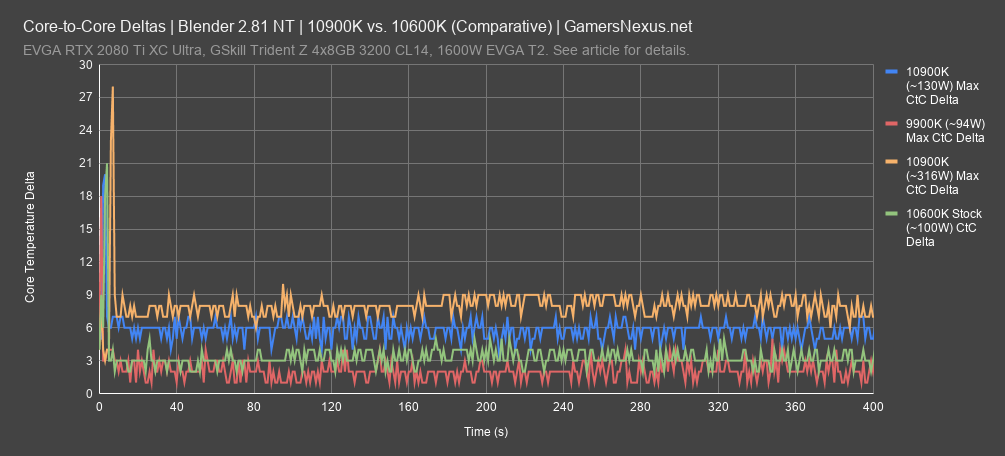
In our i9-10900K piece, we talked about how the Intel i9-10900K improved its core-to-core deltas massively -- at least in our sample -- versus some of Intel’s previous endeavors. Our i9-10900K had a range of about 9 degrees Celsius max core-to-core at 317W, which is impressively tight together. That means more overclocking headroom before becoming bound on the single hottest core, and that was thanks to Intel’s die sanding approach it took exclusively with K-SKU chips in the 10-series. The i5-10600K is another one of those chips that benefits from a sanded die.
Our previous chart from the i9-10900K review left off with the 9C number for the overclock result, or about 5-6C with the stock result at 130W. The i5-10600K at full stock settings runs an average of about 3 degrees Celsius max core-to-core delta, peak-to-peak at a given interval, so it’s similar to the i9-9900K stock.
What It’s Supposed to Do
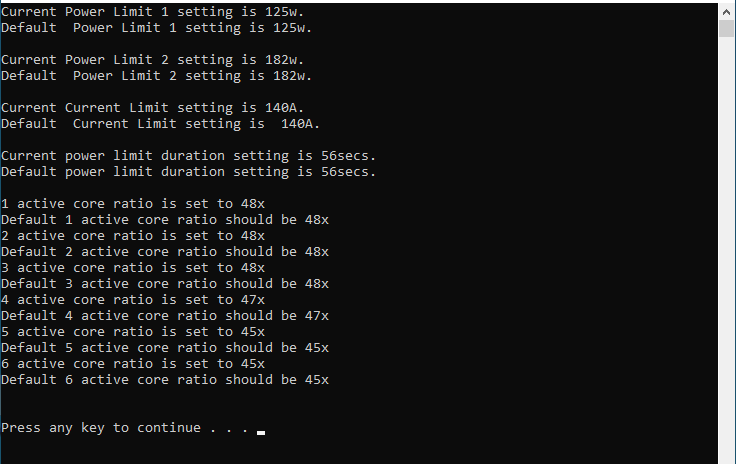
Here’s a look at what this CPU is supposed to do. This command line readout comes from a tool we acquired from a motherboard partner, and it’s useful for verifying if your CPU is running at actual Intel default guidance settings, rather than pre-overclocked settings. Intel’s PL1 is defined as 125W for this CPU. The i9-10900K calls for 125W as well, but defines PL2 as 250W. PL2 for the i5-10600K is 182W, with Tau set to 56 seconds -- that’s the maximum window that Turbo is allowed to execute at its higher power consumption before falling back to lower clocks and lower power.
Cores 1, 2, and 3 are the best on our i5-10600K and run a 48x multiplier under stock settings, with the rest at 47x, 45x, and 45x. That’s how it’s supposed to behave, and anything outside of this is outside of Intel spec. We define this now because of previous games motherboard makers have played where they’ll enable MCE and blast the power without people noticing.
Intel i5-10600K Frequency Log - Cinebench
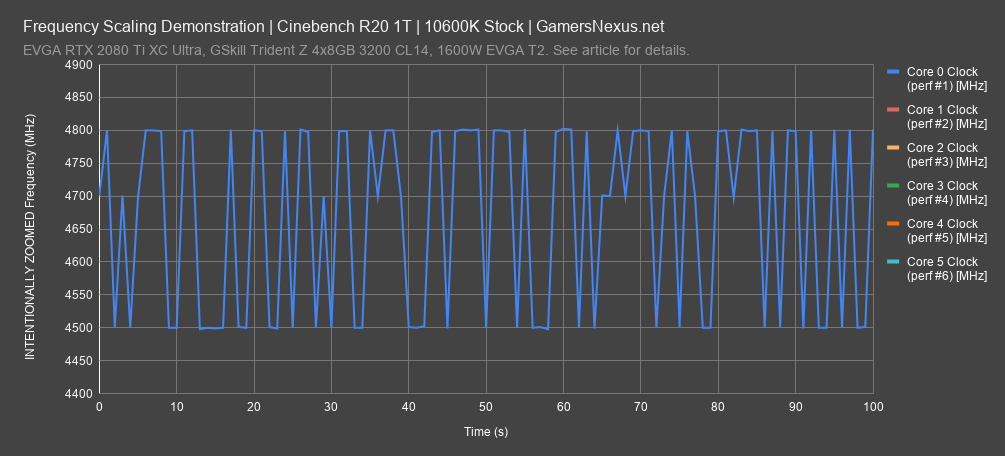
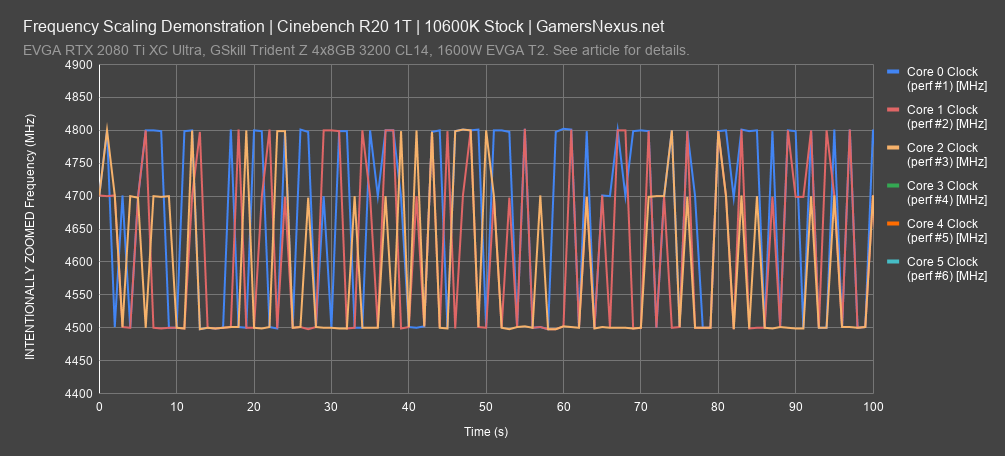
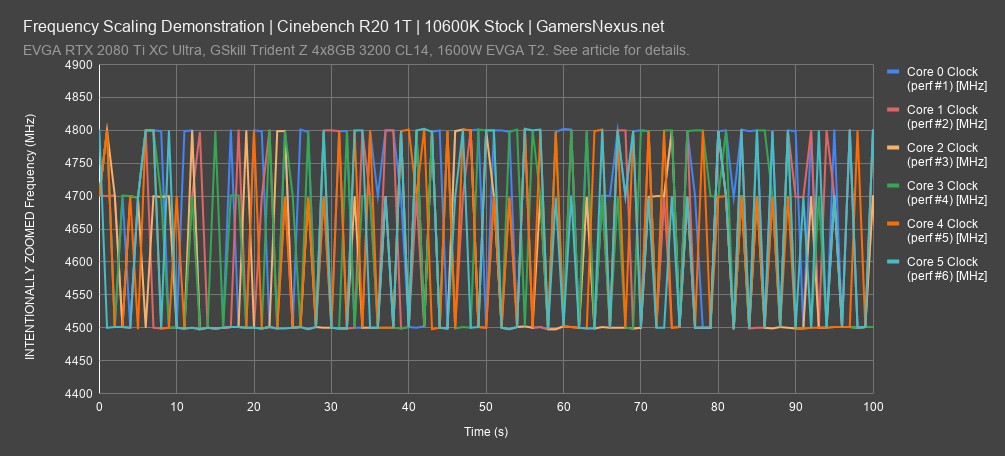
We log a pass of Cinebench R20’s single-threaded test to verify that boosting behavior is normal and any multi-core enhancement features are disabled. Base clock for the i5-10600K is 4.1GHz, max boost is 4.8GHz, and max all-core is 4.5GHz. All in all, a relatively narrow range of operating frequencies.
The 10-series CPUs that fall below the i9-10900 lack Intel’s new temperature-dependent Thermal Velocity Boost, and the ones that fall below the i7-10700 lack Turbo Boost 3.0, so 4.8GHz is the absolute maximum frequency that any core should hit in the i5-10600K (without an overclock). The logged frequency confirms this, with the processor maxing out at 4.8GHz on three cores while the others hold between 4.5GHz and 4.7GHz. Intel lists “Max Turbo” as the “maximum single core frequency” on Ark, but we’ve confirmed that 4.8GHz on three cores is expected behavior per our internal BIOS validation tool.
The chart you’ve been looking at is super zoomed-in intentionally, so we’re looking at a range of 4400MHz to 4900MHz and a time window of only 100 seconds. This helps illustrate what the cores are doing individually, although it’s still hard to read.
Intel i5-10600K Frequency Log - Blender
This chart is for all-core in Blender, starting with the i9-10900K as a baseline, highlighted in blue. The i5-10600K all-core Blender load we designed for thermal testing and sustained loads locked frequencies down to a max of 4.5GHz, but with frequent dips down to 4.4GHz on individual cores. This confirms the processor is boosting as expected and is following Intel’s spec.
Total War: Three Kingdoms Campaign (1080p)
Moving into games, we’ll start with Total War: Three Kingdoms and the campaign benchmark at 1080p.
AVG FPS for the stock 10600K in the campaign benchmark was 138 FPS, which improved by 5.8% up to 146 FPS average with an overclock, a promising start for the overclocked results. 5.1GHz isn’t an especially impressive number for Intel at this point, but with the relatively low boost clocks of the i5-10600K, it’s a significant step up from stock. Like most games, Total War: Three Kingdoms has a steep dropoff in the performance scaling with higher thread counts past a point, so the 6C/6T i5-9600K that the i5-10600K replaced isn’t hurt much by the lack of hyperthreading, with averages of 133FPS stock and 144FPS at 5.1GHz.
A more favorable comparison for Intel is its 8C/8T i7-9700K, which is a price tier above the i5 SKUs, but still only ties the i5-10600K at 138FPS average stock and 145FPS average at 5.1GHz. Intel is at a point where its advantages in the i9 are difficult to illustrate within reason, and so the i5-10600K begins to look better from a strict realism and value standpoint.
AMD’s Ryzen 7 3700X is in the same price range as the i5-10600K should be due to sales at time of writing, but overhead on the AMD chips has them falling behind Intel’s CPUs here. The R7 3700X averaged 125FPS stock, behind the i5-9600K. AMD’s core/thread equivalent to the i5, the R5 3600, averaged 122FPS even with a 4.3GHz overclock. Additionally, 1% and 0.1% lows on the R7 3700X and i5-10600K are approximately the same, both comfortably above 60FPS, but the overclocked i5-10600K increased its 1% low to 101FPS average from 93FPS stock. The nature of 1% and 0.1% lows means that they’re more variable than the overall average, so neither AMD nor Intel has a clear advantage in this category.
Hitman 2 - Dx12, 1080p
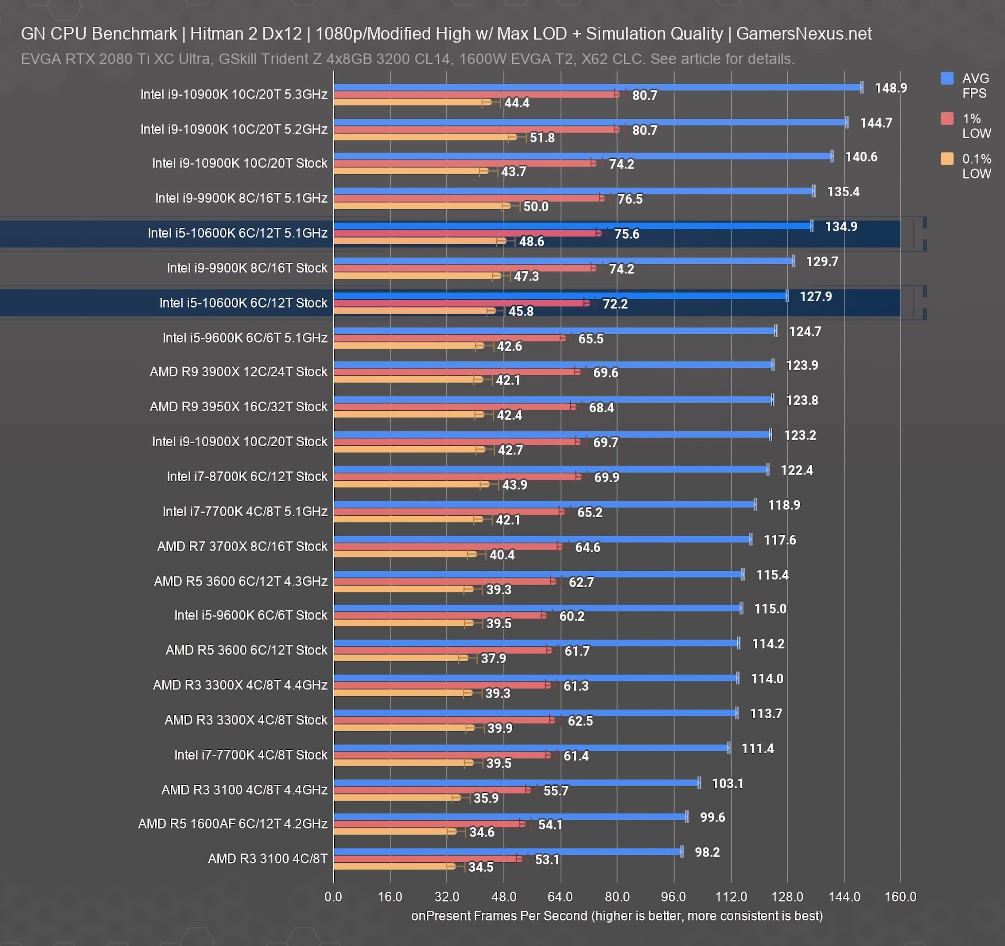
The Hitman 2 results are favorable for the i5-10600K. Stock average was 128FPS, but the overclocked average was 135FPS, tying the overclocked i9-9900K at the same frequency. Note that we actually have direct CPU scaling in this game, illustrated by the i9-10900K maxing-out at 5.3GHz and 149FPS AVG.
The overclocked i9-9900K regularly tops our charts. The fact that the cheaper i5-10600K -- with a lower core count, a lower boost clock, and a smaller cache -- is coming close to it is an achievement. The i5-10600K’s stock average is significantly higher than the non-hyperthreaded i5-9600K’s average of 115FPS, and even its average of 125FPS when overclocked to 5.1GHz.
This is another title where the framerate cap seems to be a step lower with AMD’s CPUs, so their price-competitive R7 3700X averaged only 118FPS, while the 4.3GHz overclock on the R5 3600 achieved 115FPS average. Our 1% and 0.1% lows are always lower in this benchmark than others, but they still follow the same pattern as the overall FPS averages, with none of the CPUs we’ve mentioned experiencing serious frametime issues. The i5-10600K ends up 9% ahead of the R7 3700X when both are stock, or 12% ahead of the R5 3600.
Civilization VI
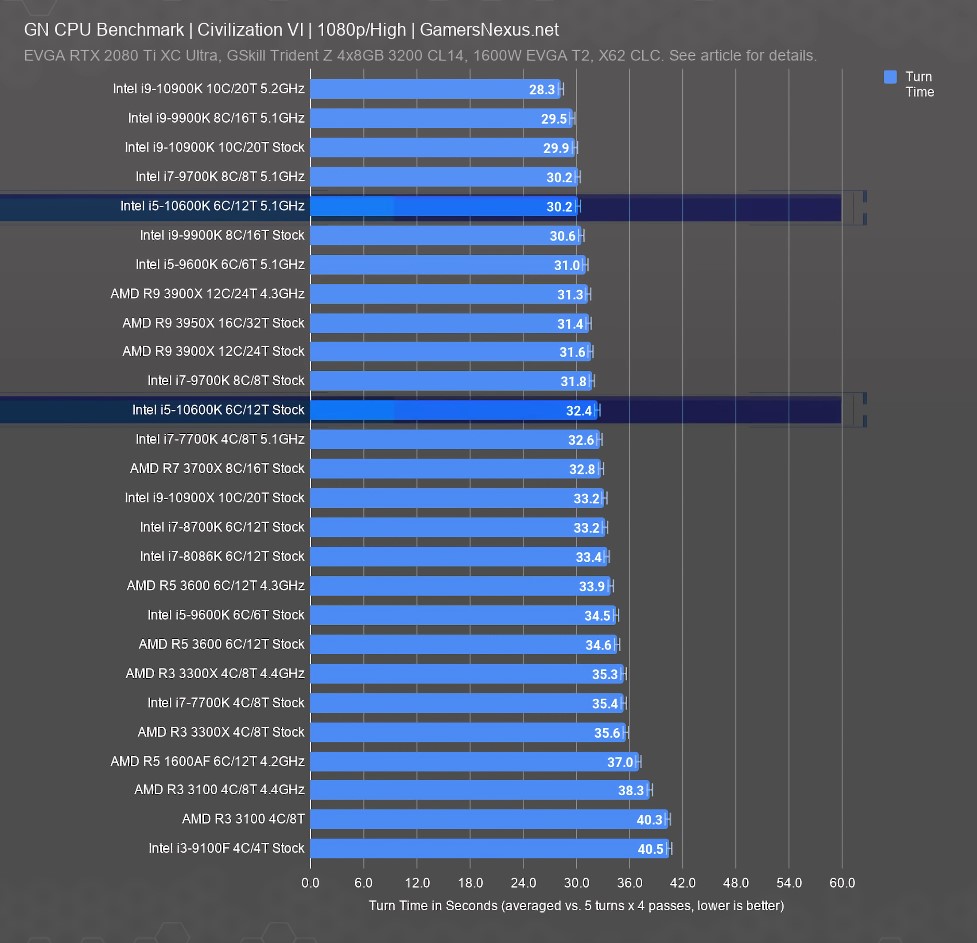
The Civilization VI Gathering Storm AI benchmark scores based on turn time rather than FPS, making it unique among our game benchmarks. Average turn time for the stock i5-10600K was 32.4 seconds, and the overclock brought that down by 6.8%, or 30.2 seconds. The i5-10600K is 6% faster than the older i5-9600K here, which averaged 34.5 seconds stock and 31 seconds overclocked. Civilization VI benchmark averages are extremely consistent, so fractions of a second are valid differences.
The i5-10600K also outperforms the pricier stock i7-9700K, which averaged 31.8 seconds. The odd scenario of a non-hyperthreaded i7 followed by a hyperthreaded i5 in the next generation creates some results like this. AMD put up a much better showing here than in the previous two games, with the R7 3700X almost tying the i5-10600K with both chips at stock settings, while the overclocked R5 3600 falls behind. Max boost for the R7 3700X is 4.4GHz, so even though the 4.3GHz all-core overclock on the R5 3600 is pretty good, the R7 3700X can boost even higher in limited-core scenarios and often outperforms it in games.
F1 2019 - 1080p
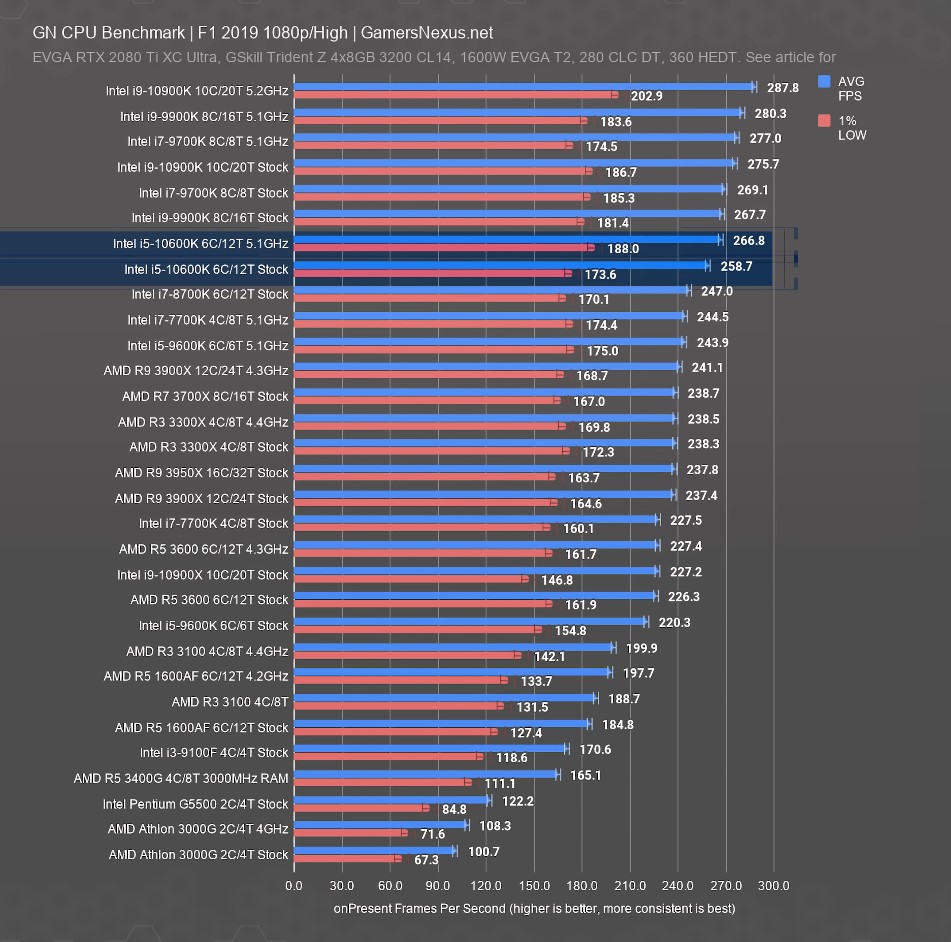
The F1 2019 benchmark has become one of our favorites for CPU reviews. While the framerates are ridiculously high, this is because we still haven’t encountered any hard non-CPU limits, which means there’s good non-bottlenecked scaling all the way up to the top of the chart. However, usefulness outside of empirical differences becomes more questionable.
Stock FPS was 259 average, and the overclock average was 3.1% higher at 267FPS, with lows improving in lockstep fashion with the overclock. The i5-9600K is far behind, although the high numbers make it look even further than it is -- the i5-10600K outperforms it by 17.4%, and even a 5.1GHz overclock only brings the i5-9600K up to 244FPS average. Going a price tier above the i5 territory and into the stock i7-9700K leapfrogs the i5-10600K’s result with an average of 269FPS, practically tied with the overclocked i5-10600K. AMD’s R7 3700X averaged a stable 239FPS with a 1% low of 167FPS and a superior 131FPS 0.1% low compared to 98FPS for the stock i5-10600K, but neither of these numbers are low enough to reflect any visible stuttering or hitching.
F1 2019 - 1440p
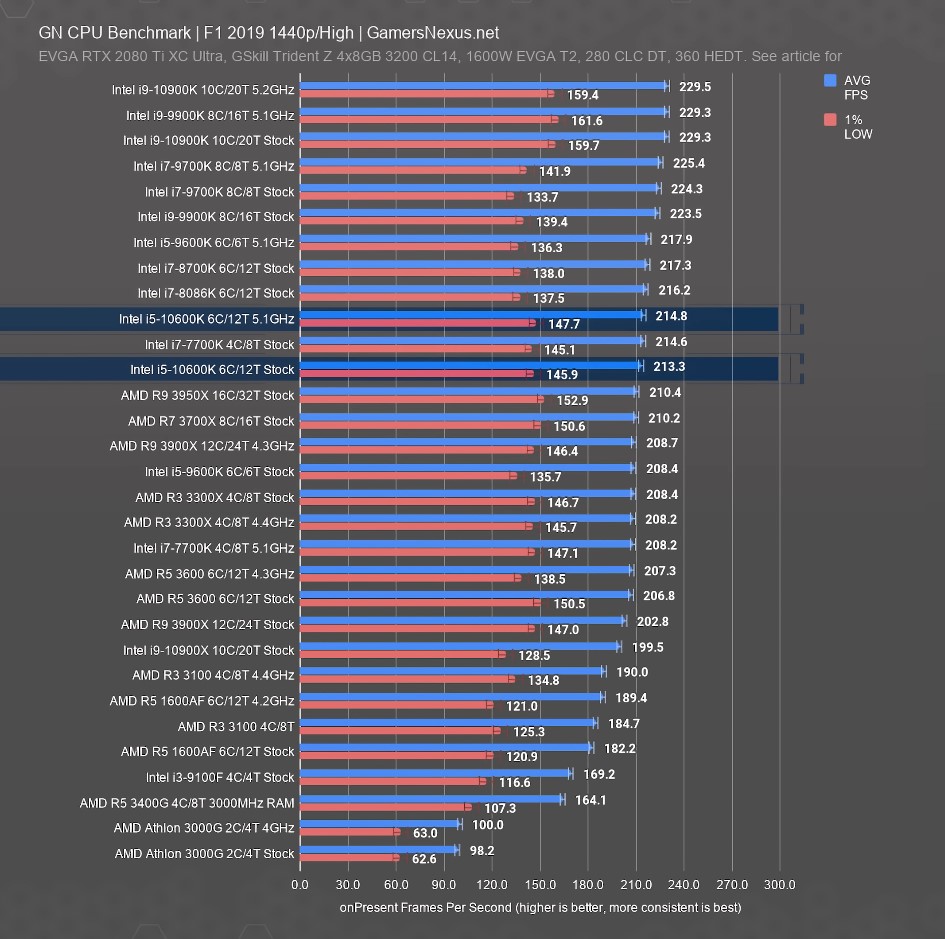
Results at 1440p are at best the same as results at 1080p, and at worst, are all limited to the same FPS average due to GPU bottlenecking -- which is why we typically discuss our 1080p results far more. F1 2019 is one of the less GPU-bottlenecked games we test, though, so there is still some limited scaling. The compressed scale has the i5-10600K only outperforming the R7 3700X by 1.5% here, which is a useful reminder that at higher resolutions, any half-decent CPU will achieve the same level of performance. You’re GPU-bound now, and that may diminish the importance of the CPU.
The Division 2 - 1080p
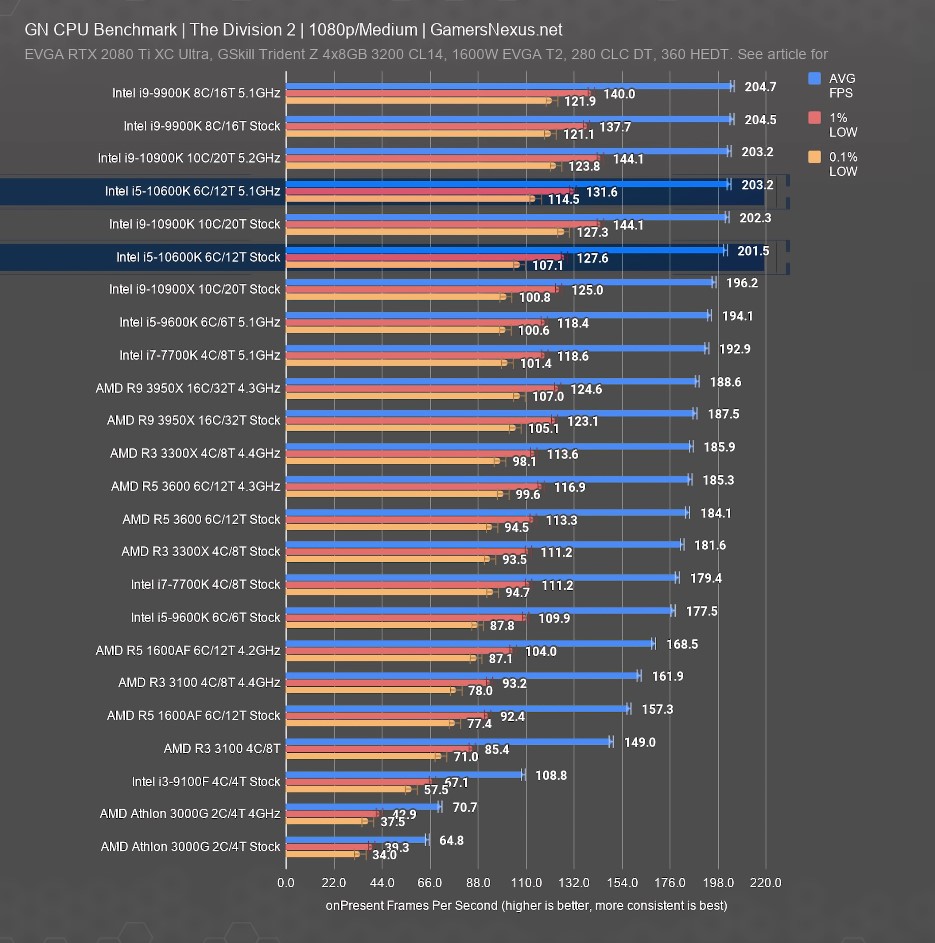
Even with the adjustments we’ve made to our Division 2 benchmark, it’s susceptible to GPU bottlenecking at the upper end of the chart where the i5-10600K lands. Scaling with an overclock is minimal, up to 203FPS average from 202FPS stock. The real scaling begins at the i5-9600K and below: the older i5 scales up 9.4% with an overclock from 177FPS stock, putting it at almost the same limit as the overclocked i5-10600K at 194FPS.
Our chart for this test will remain relatively limited until we finish retesting our inventory of CPUs, but the takeaway is that the i5-10600K can easily keep up with Intel’s highest-end offerings in this GPU-limited title.
The Division 2 - 1440p
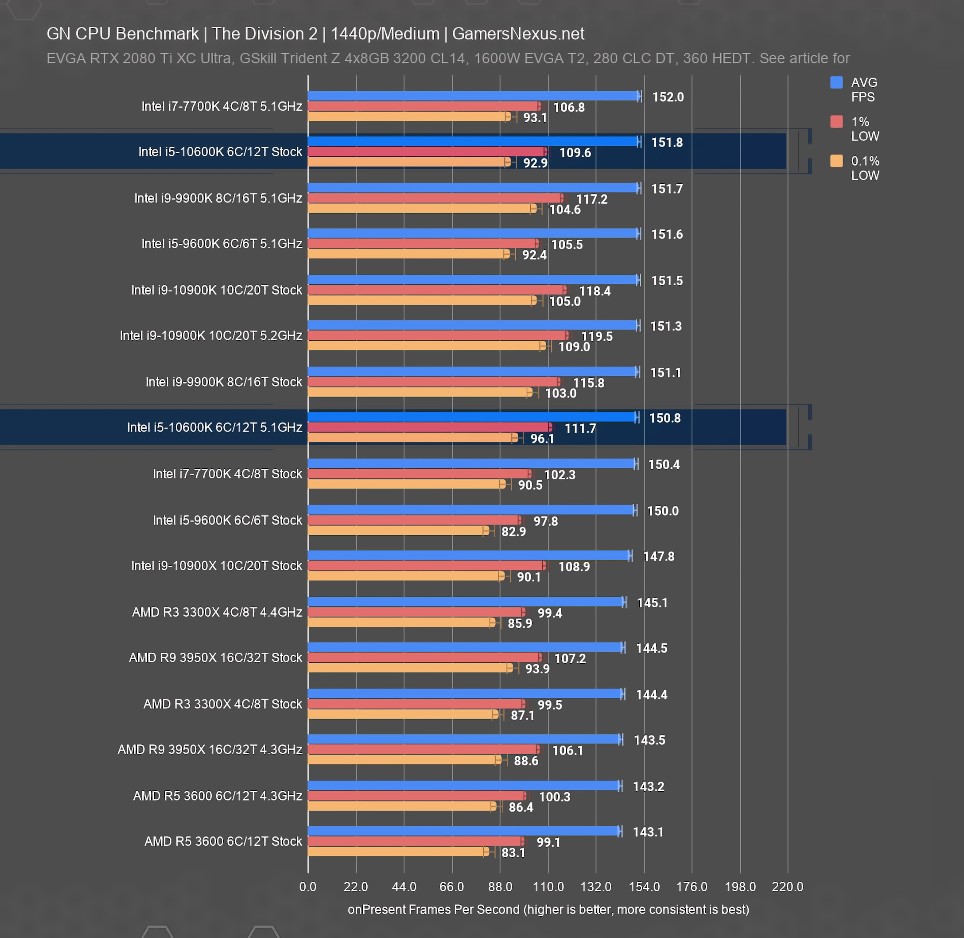
If the 1080p Division 2 test has GPU limitations, the 1440p Division 2 test has a GPU brick wall. All the Intel i5s and i7s we’ve tested thus far have averaged in a range of 149FPS to 152FPS. At least this confirms that the new 10-series parts don’t pull that GPU limit any lower, and they still fall safely in the same bracket as the rest of the Intel CPUs. The AMD R5 through R9 CPUs fall in their own bracket from 142FPS to 145FPS, so it’s a safe bet that this is where the R7 3700X will fall when we retest it.
Shadow of the Tomb Raider - 1080p
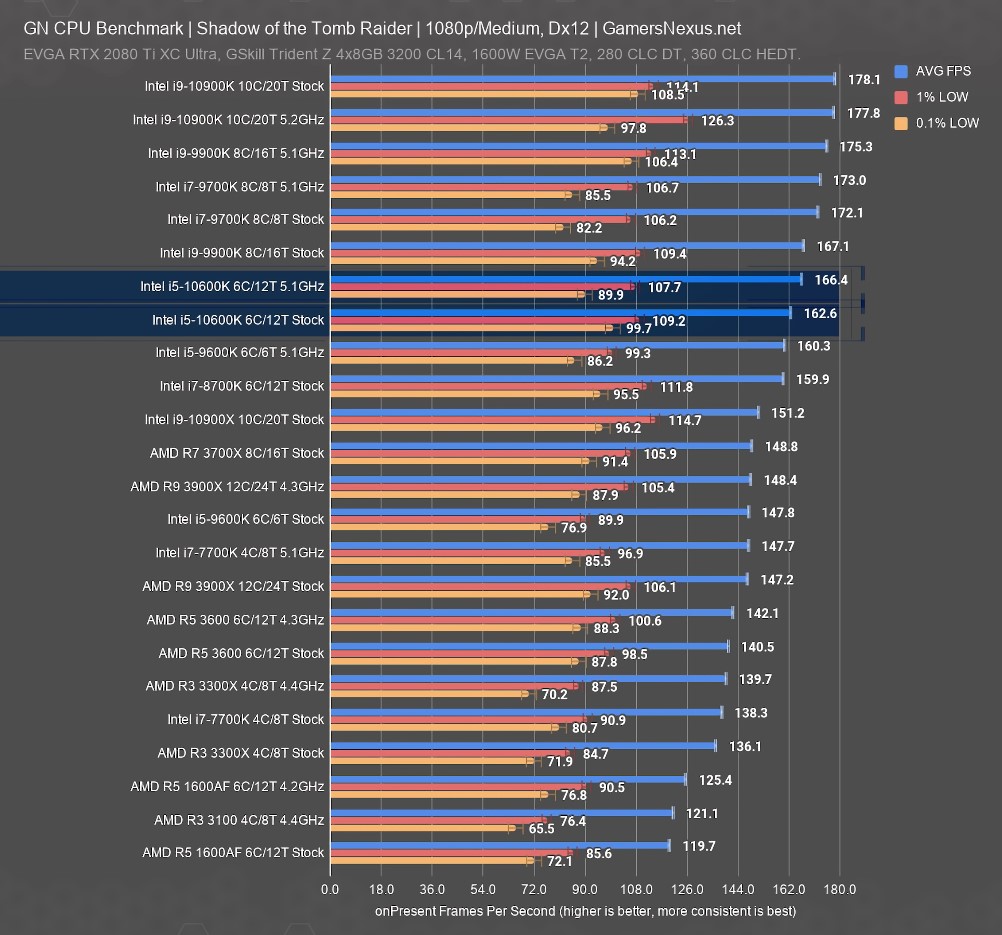
Shadow of the Tomb Raider showed minimal response to the i5-10600K’s 5.1GHz overclock, with the overall average rising only slightly from stock up from 163FPS to 166FPS. The i5-10600K fell behind the higher-priced i7-9700K’s 172 FPS average in this test, but the 6C/6T i5-9600K averaged only 148 FPS stock, so the 10th-gen i5 is positioned appropriately between last-gen’s price equivalent and higher-end CPUs. AMD’s R7 3700X averaged 149FPS, which is at the upper end of the range for Ryzen CPUs in this test, but well behind the i5-10600K.
GTA V - 1080p
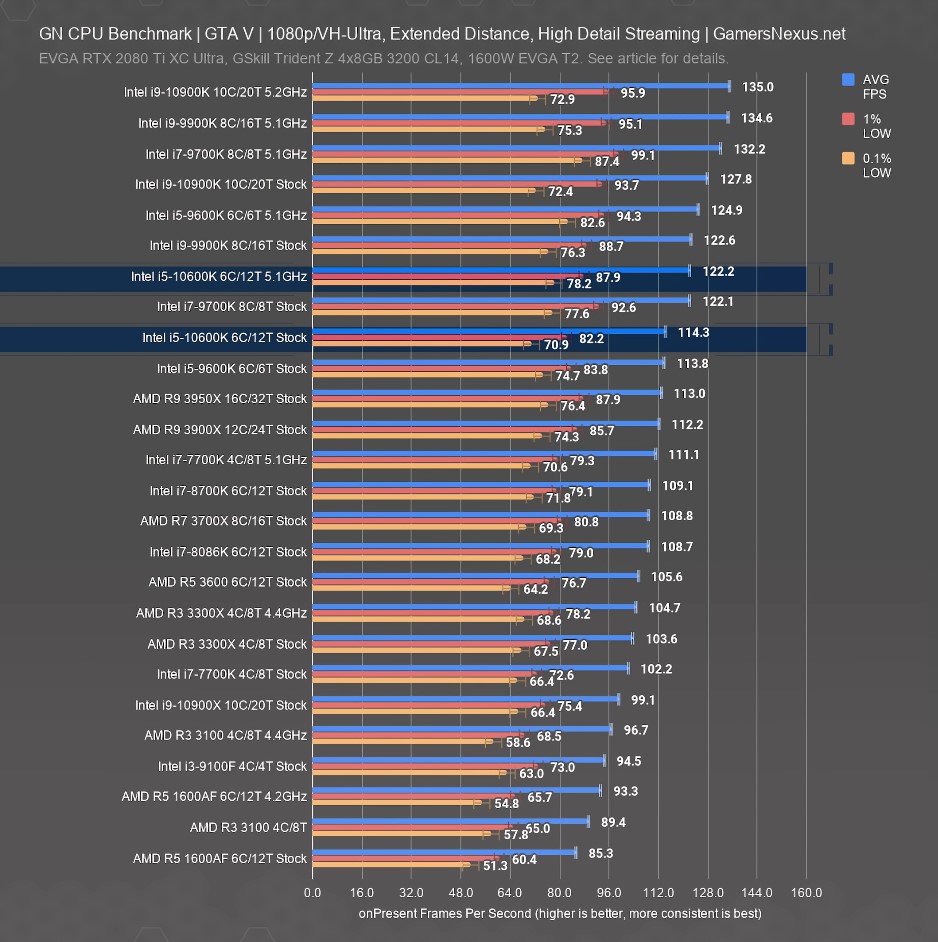
As one of our oldest game benchmarks, GTA V is also one of our most frequency-dependent rather than core-dependent benchmarks, which isn’t especially good news for the i5-10600K.
The stock average was 114FPS, and up 6.9% to 122FPS when overclocked. The slightly higher-boosting i7-9700K averaged 122FPS stock, but it also performed better when both CPUs were overclocked to 5.1GHz. We did retest to verify this result, and it held up. Additionally, we’ve seen GTA V ignore or even perform slightly worse with SMT in the past. For instance, with the nearly identical 6C/6T R5 3500X and 6C/12T R5 3600 results, and the fairly similar 8C/8T i7-9700K and 8C/16T i9-9900K results.
With that in mind, it makes sense that the 8C/16T R7 3700X doesn’t derive any advantage from its higher core count and averages 109FPS here. Our 1% and 0.1% lows scale in line with the overall averages, with the R7 3700X being the lowest of the CPUs mentioned at 69.3FPS and the overclocked i5-9600K being the highest at 83FPS.
PRODUCTION BENCHMARKS
Blender 2.81 - Monkey Heads
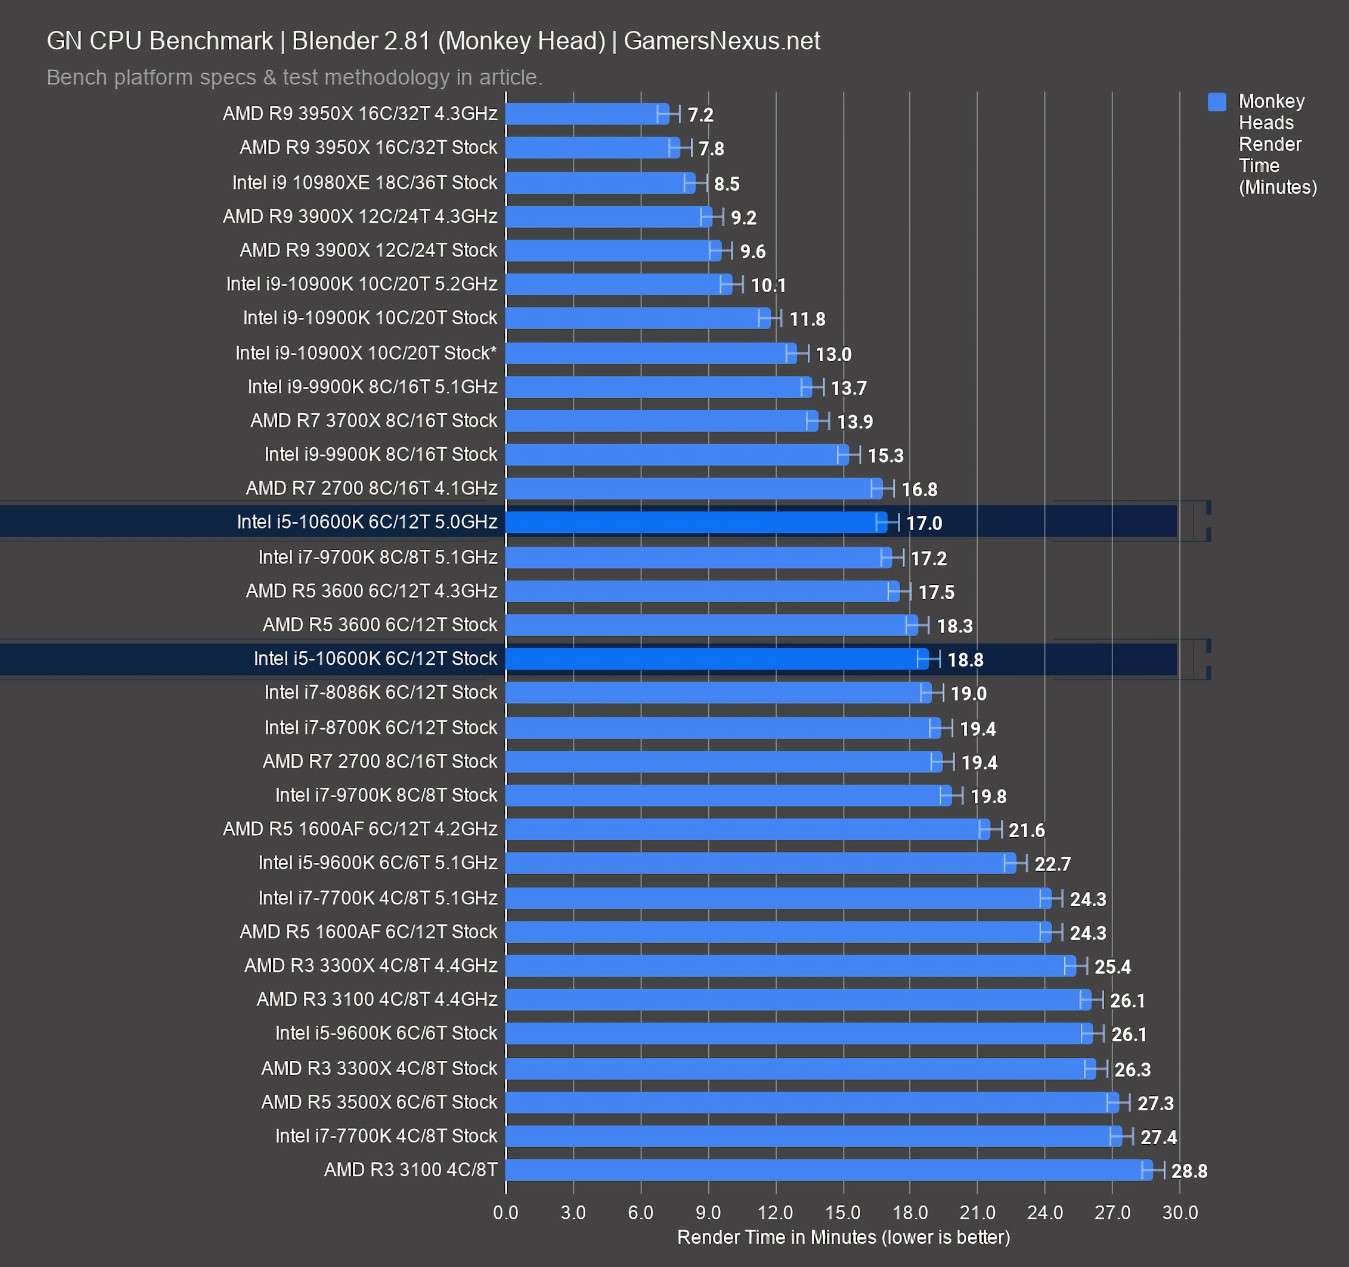
Time to move on to production benchmarks. Interestingly, there’s finally an i5 CPU that might actually be competitive in production applications like Blender. We’ll start there, since we can use a tile-based renderer to set the stage for thread scaling.
With the GN Monkey Head render, the Intel i5-10600K stock CPU completes the render in 18.8 minutes, which puts it marginally ahead of the 6C/12T i7-8086K and just behind the AMD R5 3600, which has been under $200 lately. Overclocking the i5-10600K to 5GHz puts it past both R5 3600 results, landing at 17 minutes. That’s a reduction in time of 9.6%, landing it next to an R7 2700 at 4.1GHz and an i7-9700K at 17 minutes.
Interestingly, this is where we see the usual 30% improvement from hyperthreading, as opposed to a more linear pure core increase: The i7-9700K, despite having four fewer threads, is keeping pace with the i5-10600K at similar frequencies. The i5-10600K and its two less cores account for that. The R5 3600 and i5-10600K are neck-and-neck here, and can be thought of as functionally equivalent thus far. The pricing favors the R5 3600, while the overclocking favors the i5-10600K.
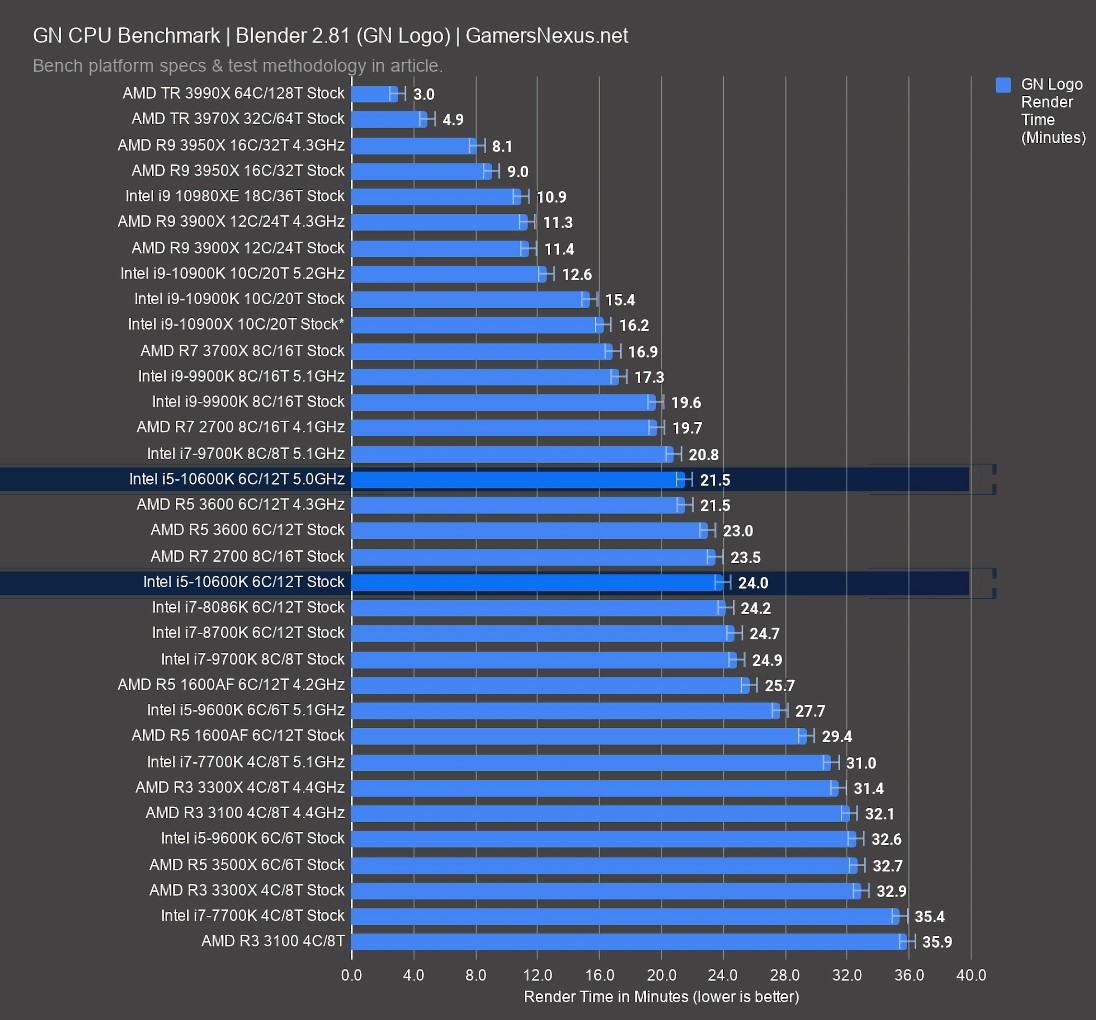
Blender 2.81 - GN Logo
Our GN Logo render is next. For this, the i5-10600K completes the render in about 24 minutes, or 21.5 minutes when overclocked to 5GHz. That’s a reduction of about 10% against the stock time. The AMD R5 3600 stock CPU completes the render in 23 minutes, so it needs 4% less time than the i5-10600K. Intel is definitely getting closer here than it has in the past, but AMD’s pricing advantage does give it a bonus in this application.
For this application, the Intel overclock matches AMD’s overclocked position. This is clearly hugely improved over both the stock and overclocked results for the i5-9600K, which we were never able to find ourselves recommending. So, the i5-10600K is in a much better position this generation -- but AMD’s is still cheaper, and for the first time in decades, it’s on a more mature platform right now. While Z490 might just be a reskinned Z390, initial BIOS issues have been rough. The R7 3700X is even further advantaged and is roughly the same price as the i5-10600K.
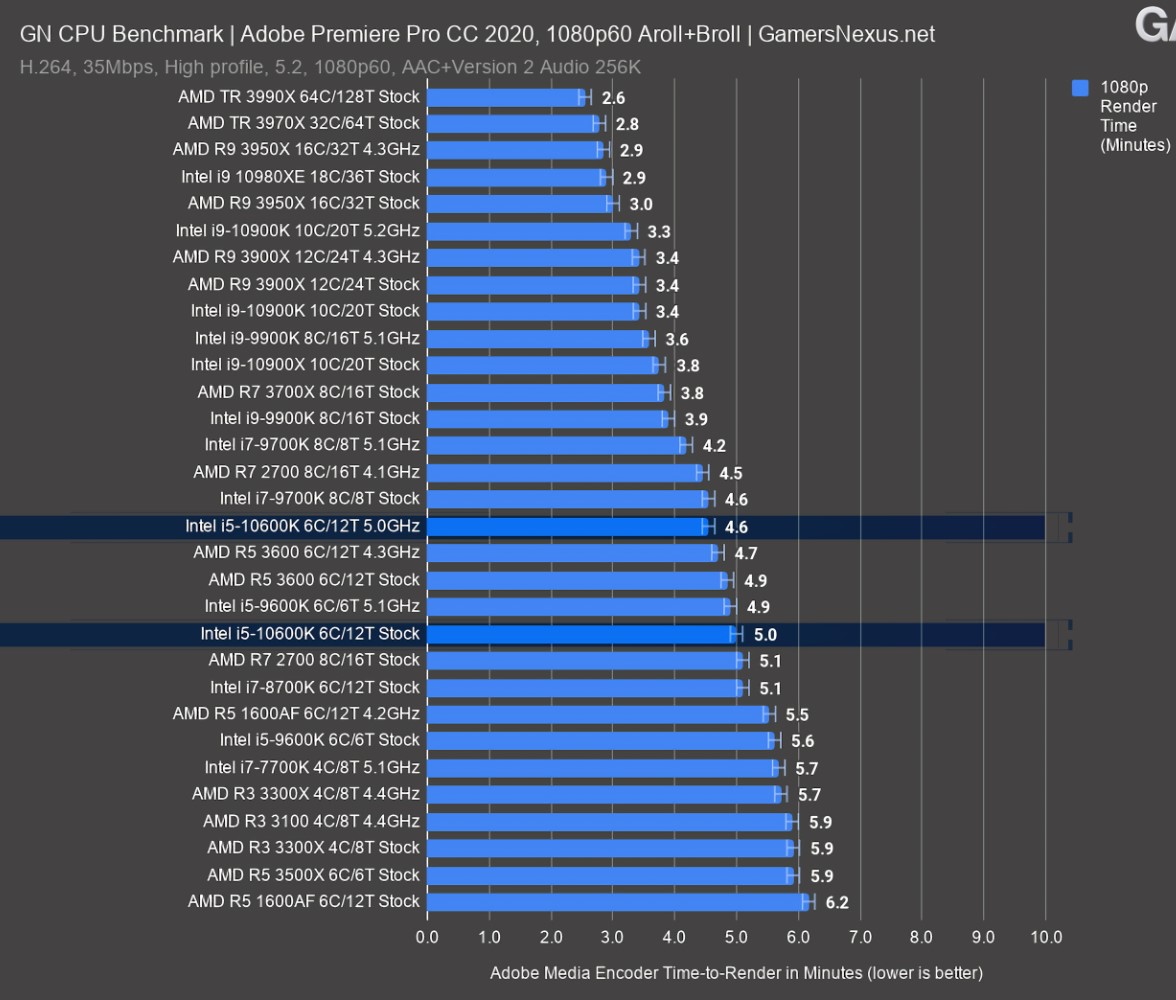
Adobe Premiere - 1080p
Adobe Premiere is next, using real videos that we uploaded to this channel in the past. For this one, we’re starting with a 1080p ENG shoot that would be comparable to other RNG-style, a-roll heavy reports. The i5-10600K stock CPU completed the render in 5 minutes, so it’s roughly identical to an i7-8700K or AMD R7 2700 stock CPU. It’s also about the same as a 5.1GHz i5-9600K, so that's a generational improvement for Intel.
The AMD R7 3700X finishes the render in 24% less time required, at 3.8 minutes, while the R5 3600 stock CPU finishes in about the same time, at 4.9 minutes. Although Intel has improved here, the R5 3600 being directly tied makes it a harder fight given the pricing advantage of the R5 3600.
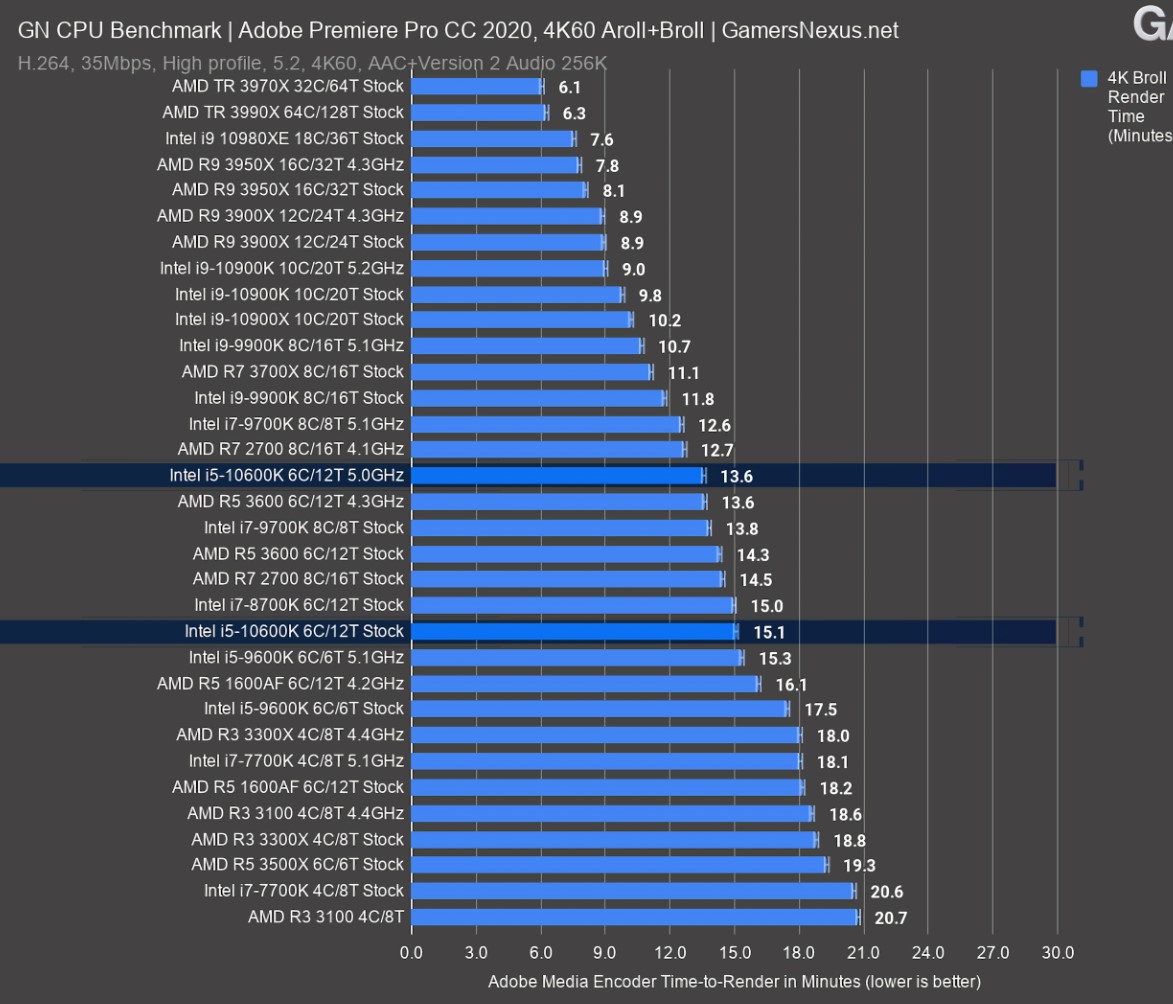
Adobe Premiere - 4K
Our 4K render is next, being mostly comprised of b-roll at a higher quality. This one is more stressful for CPUs and the Intel i5-10600K stock CPU shows that, completing the render in 15.1 minutes, again landing it between the i7-8700K (stock) and i5-9600K 5.1GHz (overclocked) results. For reference to what used to be an $85 part, the i5-10600K needs 6% less time than an overclocked Ryzen 5 1600 AF to finish the render.
The i5-10600K overclock brings a 10% improvement over stock, roughly tying the R5 3600 overclock and R7 2700 overclock in the 13.6 to 12.7 minute range. The i7-9700K at 5.1GHz outdoes the i5-10600K here, showing that the extra frequency and two extra physical cores for reduced resource contention proves more valuable in this benchmark. The stock R7 3700X, meanwhile, requires 26% less time than the stock i5-10600K, although the overclocked result is closer.
Adobe Photoshop
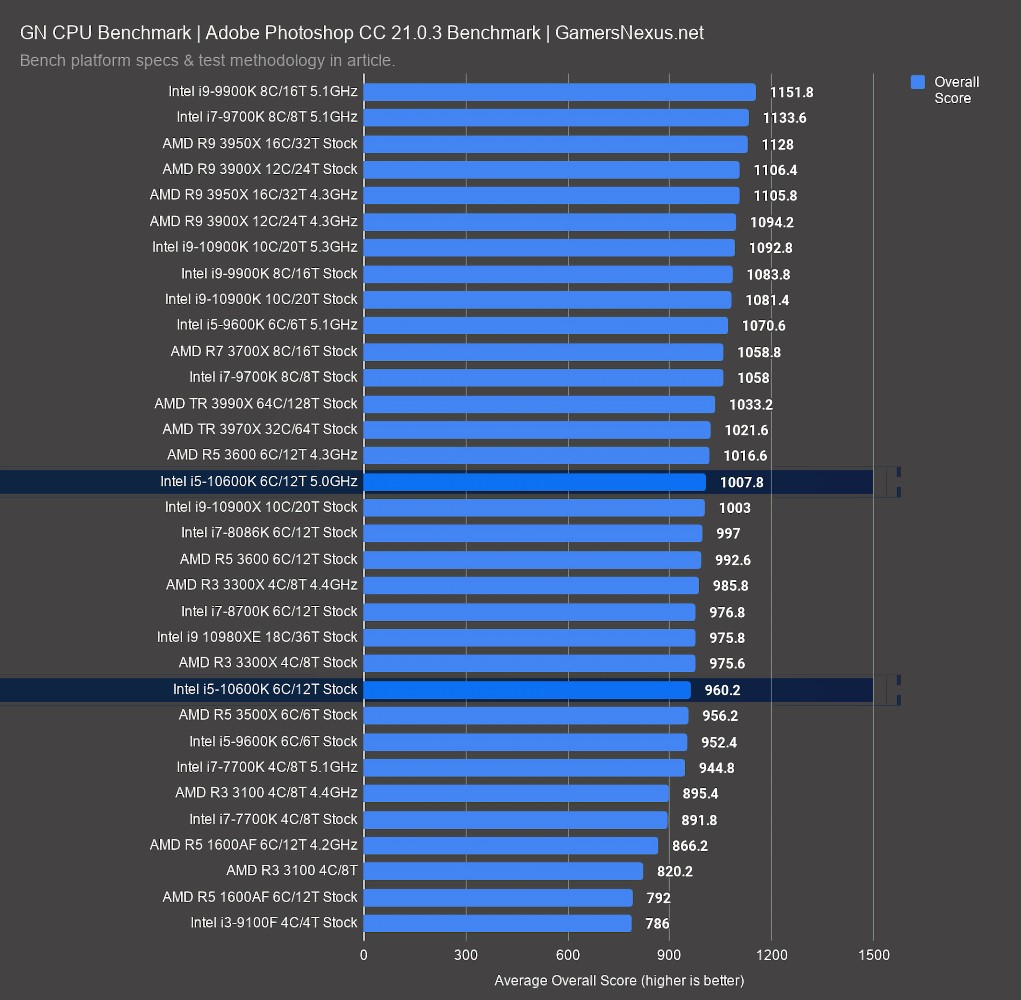
Adobe Photoshop is next, with this one often favoring higher frequency parts over higher core counts. The i5-10600K stock CPU scores 960 points, marking it as about equal to an AMD Ryzen 3 3300X. The i5-10600K does exceptionally poorly in the Photoshop test, even after subsequent retests, exhibiting similar performance characteristics to the i9-10900K and its peculiar results. The fact that the R3 3300X is in a better position makes the i5-10600K a bad buy for this test.
7-Zip
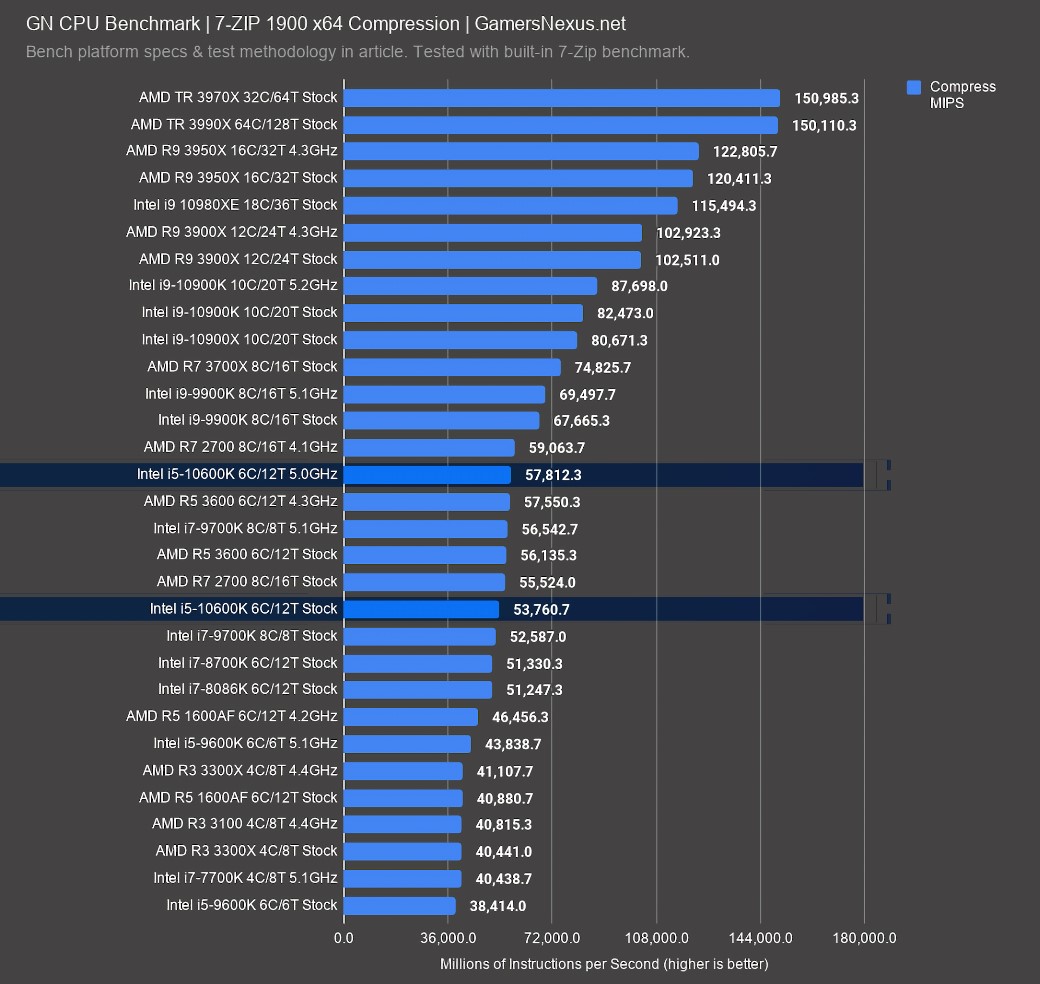
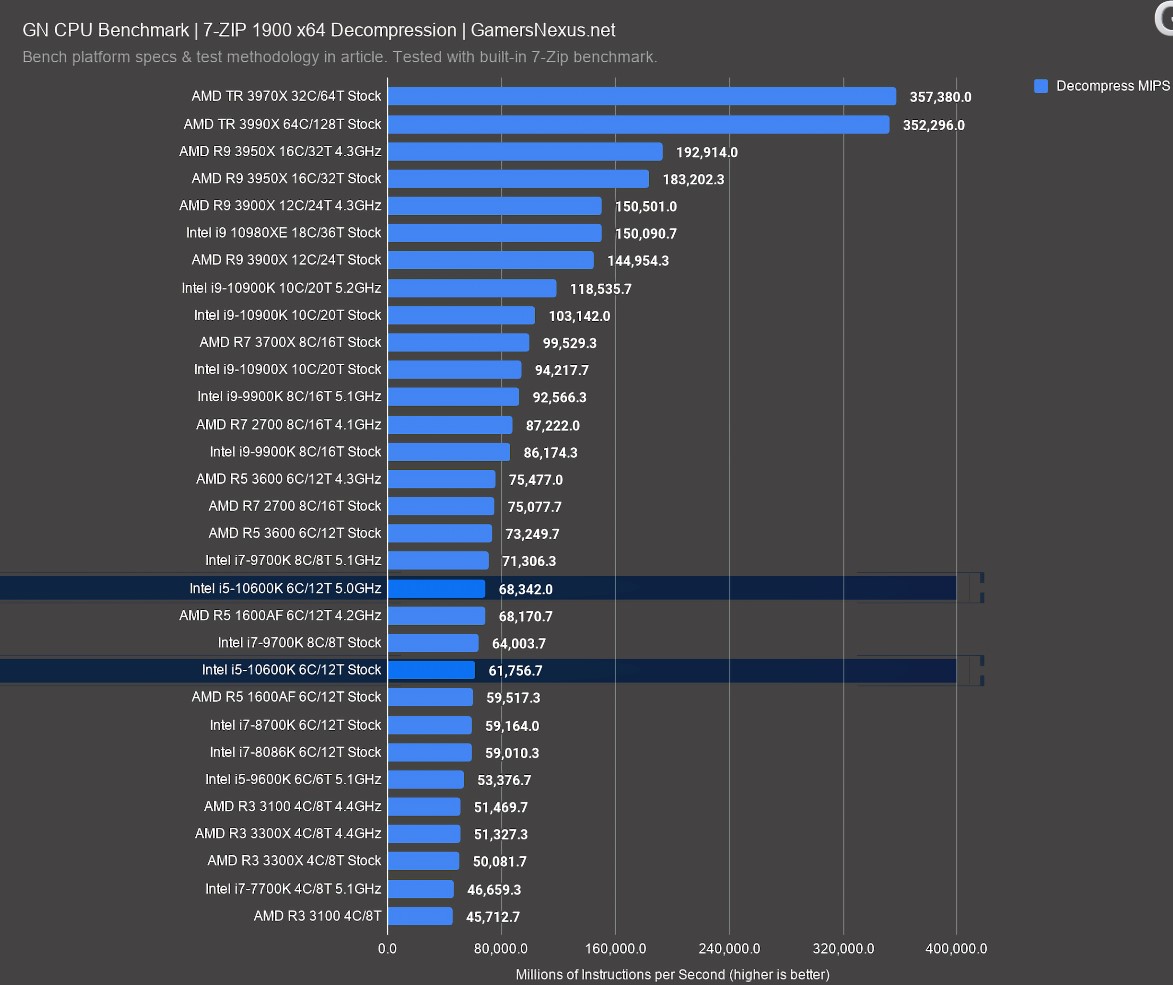
7-Zip compression and decompression benchmarks are next, measured in millions of instructions per second. For compression, the i5-10600K stock CPU scores 54K MIPS, putting it between the i7-9700K stock CPU and R7 2700 stock CPU. The R5 3600 stock result scores 56K points, or about 4.4% better. This is consistent with previous rankings and shows that the R5 CPU doesn’t have a noteworthy lead in pure performance, despite a price advantage.
The i5-10600K at 5GHz outdoes the R5 3600 at 4.3GHz, but not by enough to matter -- these two results are functionally equivalent and close to error. As for the AMD R7 3700X, that’s just behind the i9-10900X, which is itself just behind the i9-10900K stock CPU -- and those are the two parts you shouldn’t confuse with one another.
For decompression, the Intel i5-10600K stock CPU scores 62K MIPS, now between the R5 1600AF stock CPU and i7-9700K stock CPU. The i5-10600K at 5GHz is right behind the i7-9700K at 5.1GHz, illustrating again that, although the frequency helps, true cores can help make up for some of the gap against a deficit in hyperthreading. The R5 3600 stock, meanwhile, is 7% ahead of the overclocked i5-10600K result, or 19% ahead of the stock i5-10600K.
Chromium
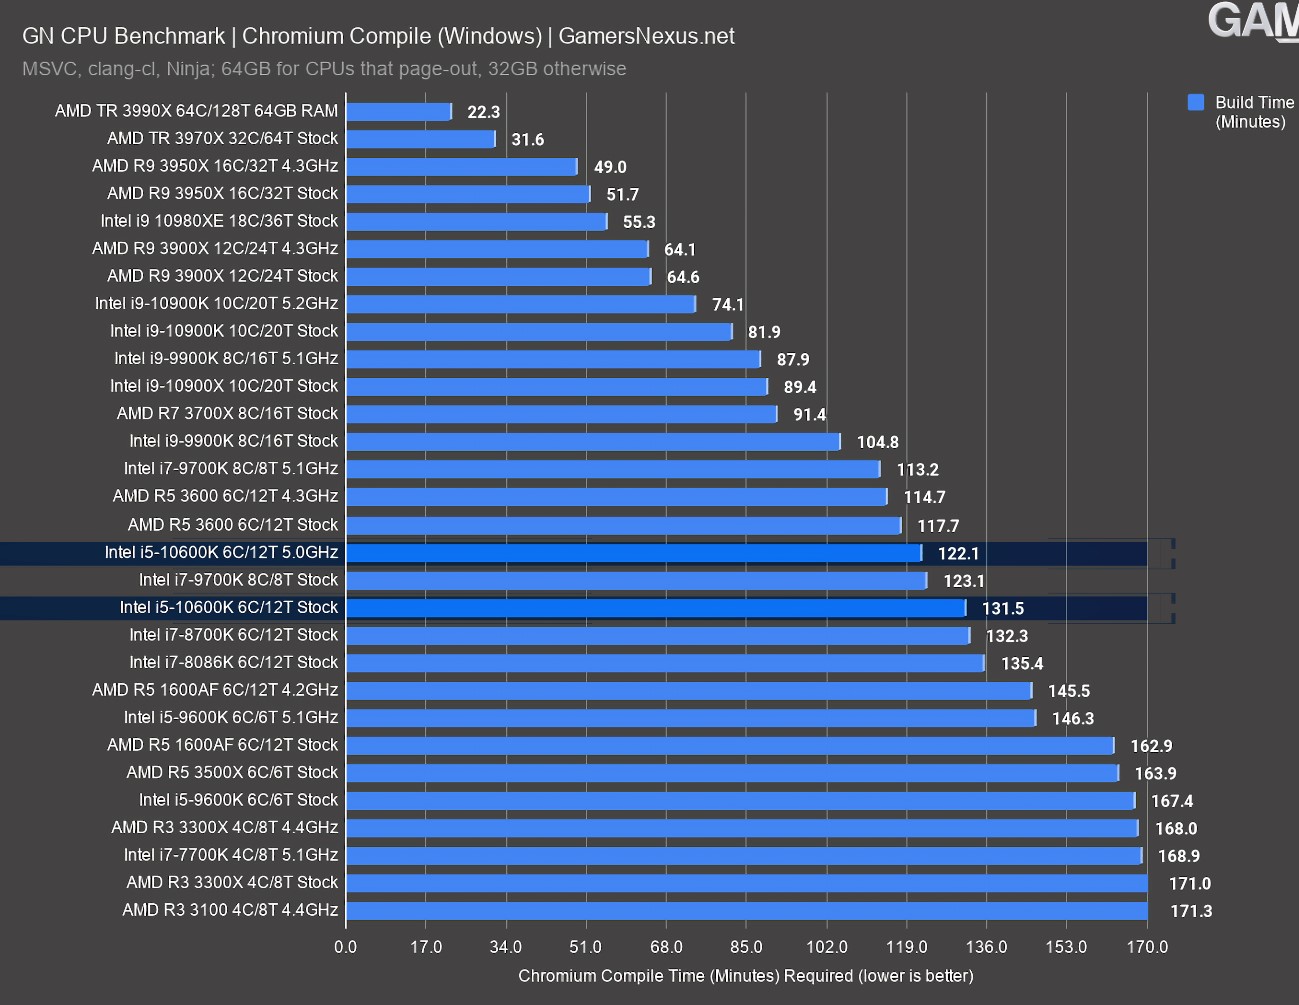
Our Chromium compile is next, looking at the compile time in minutes with clang-cl and Ninja on Windows. Lower is better here, like in the render tests. The Intel i5-10600K stock CPU completes the compile in 132 minutes, which puts it again between the i7-8700K and i7-9700K -- it’s consistent, in that regard. We’ll give Intel credit for its improvement over the 2017 i7-7700K flagship, even at 5.1GHz, and improvement over the i5-9600K at a drop-in price (theoretically).
As for AMD, the R5 3600 requires 118 minutes, so it’s about 4 minutes faster than the overclocked i5-10600K, requiring 3.6% less time. Stock-to-stock, the R5 3600 is in the lead by 10.5%. Intel doesn’t have direct benefit from adding more threads in this one, as the i7-9700K stock result illustrates against the i5-10600K overclock result, and the frequency accounts for more of its positioning.
Handbrake
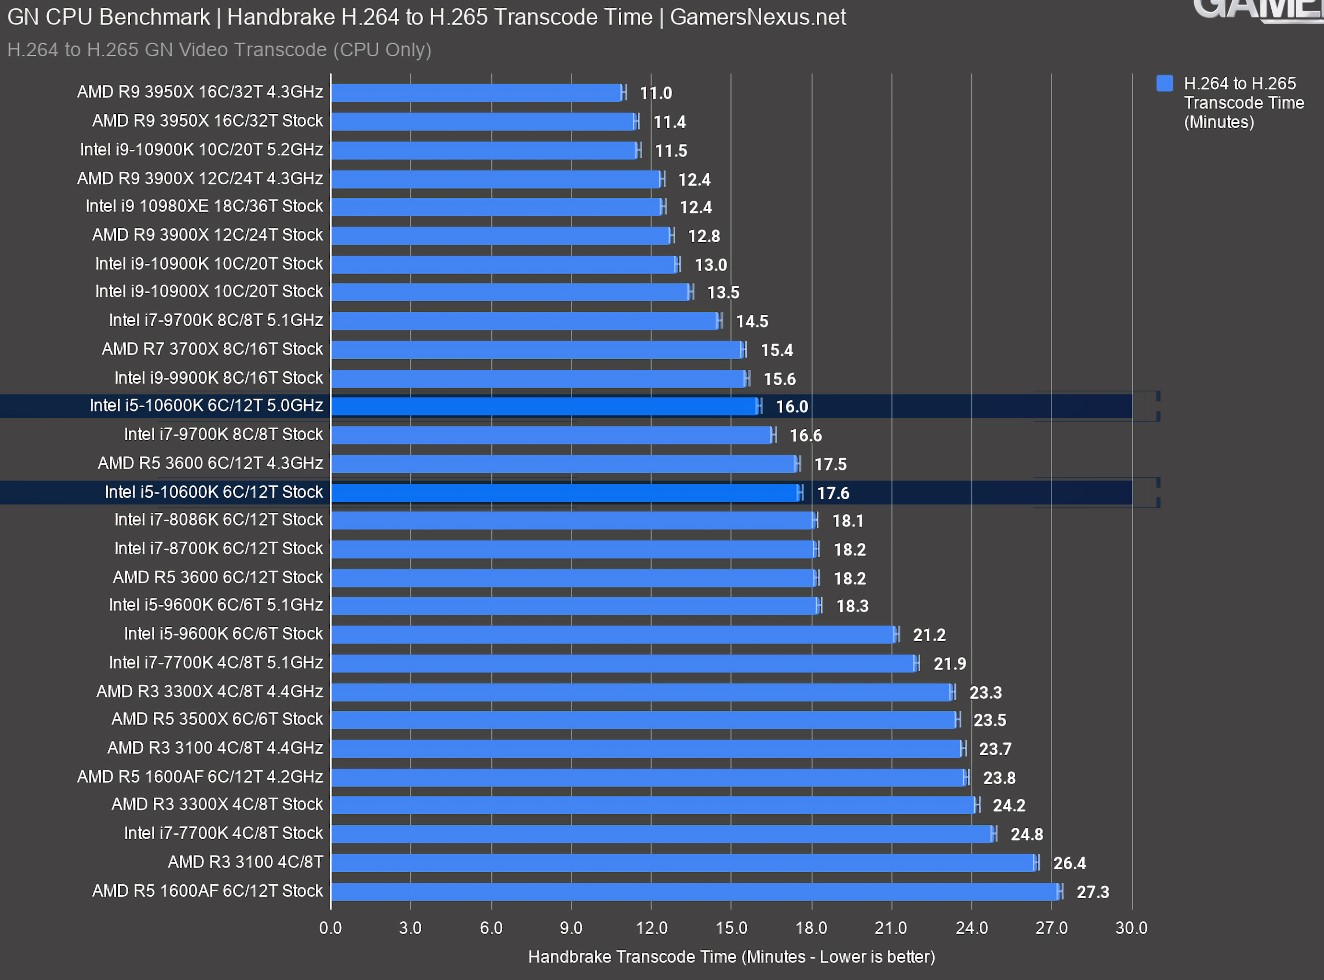
Our Handbrake transcode to H.265 is up now. This one has some optimization-level issues at the extreme high-end, mostly with Threadripper CPUs that aren’t shown here, but runs fine for the parts we’re discussing today. The i5-10600K stock result requires 17.6 minutes to complete the transcode, which is equivalent to the 4.3GHz all-core R5 3600, or just ahead of the i7-8700K. Intel is actually outpacing AMD’s R5 3600 in this test when both are stock, with an advantage of 3.3% in time reduction. The R7 3700X, meanwhile, runs at about 15.4 minutes, and so is advantaged by 12.5%.
V-Ray
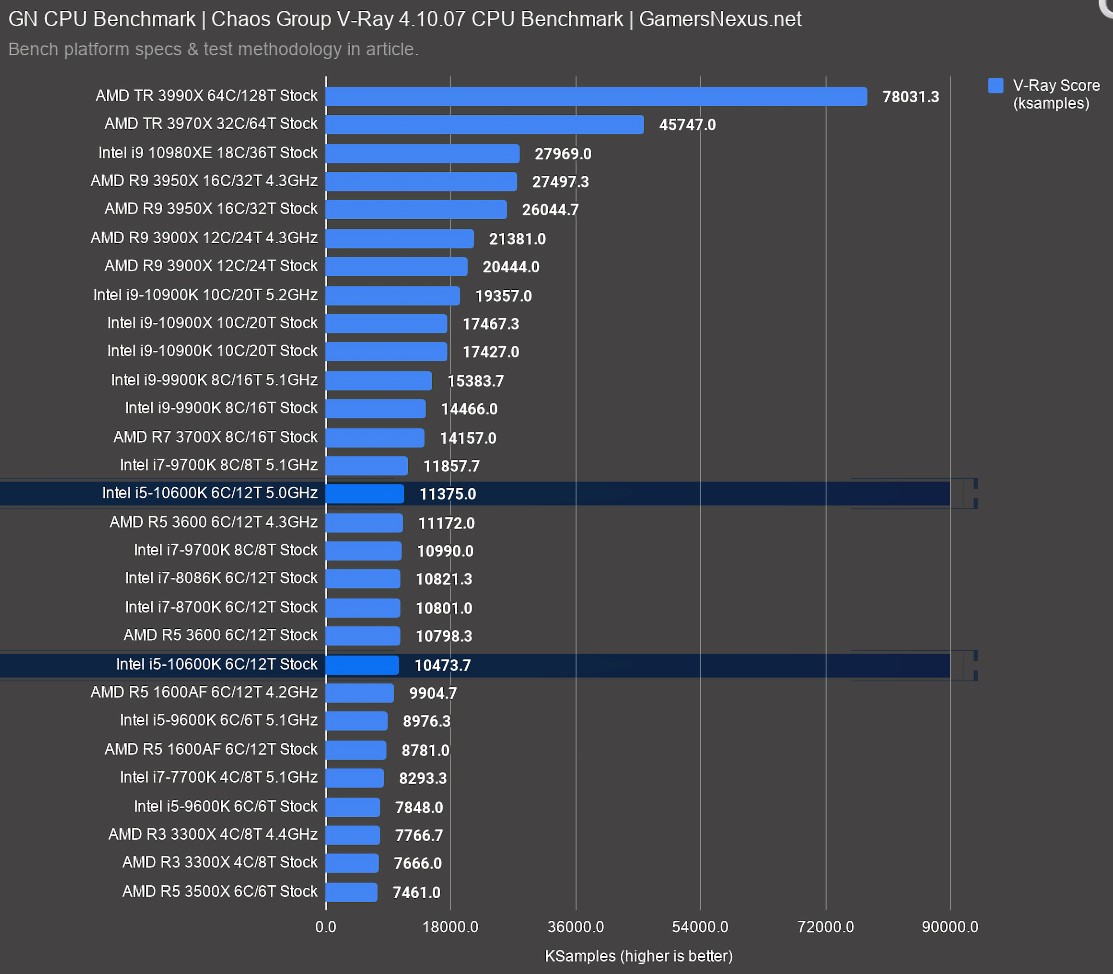
V-Ray results scale almost perfectly with thread count from top to bottom, with only a couple of hiccups. The i5-10600K falls between fellow 6C/12T parts at 10,474 ksamples, with the stock R5 3600 above it at 10,798 ksamples, and the overclocked R5 1600AF at 4.2GHz below it at 9,905 ksamples. The higher-end R7 3700X that falls closer to the i5-10600K in pricing is much higher, more than 35% ahead of the i5-10600K in score.
Intel’s own 8C/8T i7-9700K outstrips the i5-10600K in performance in this test, but the combination of eight true cores and a slightly higher boost allow it to overcome the i5-10600K’s 12 thread advantage. Since we were forced to reduce our i5-10600K’s overclock to 5GHz to complete the production tests, the gap only widens when comparing the i7-9700K at 5.1GHz versus the i5-10600K at 5.0GHz, with 11,859 ksamples and 11,375 ksamples respectively.
Power Testing
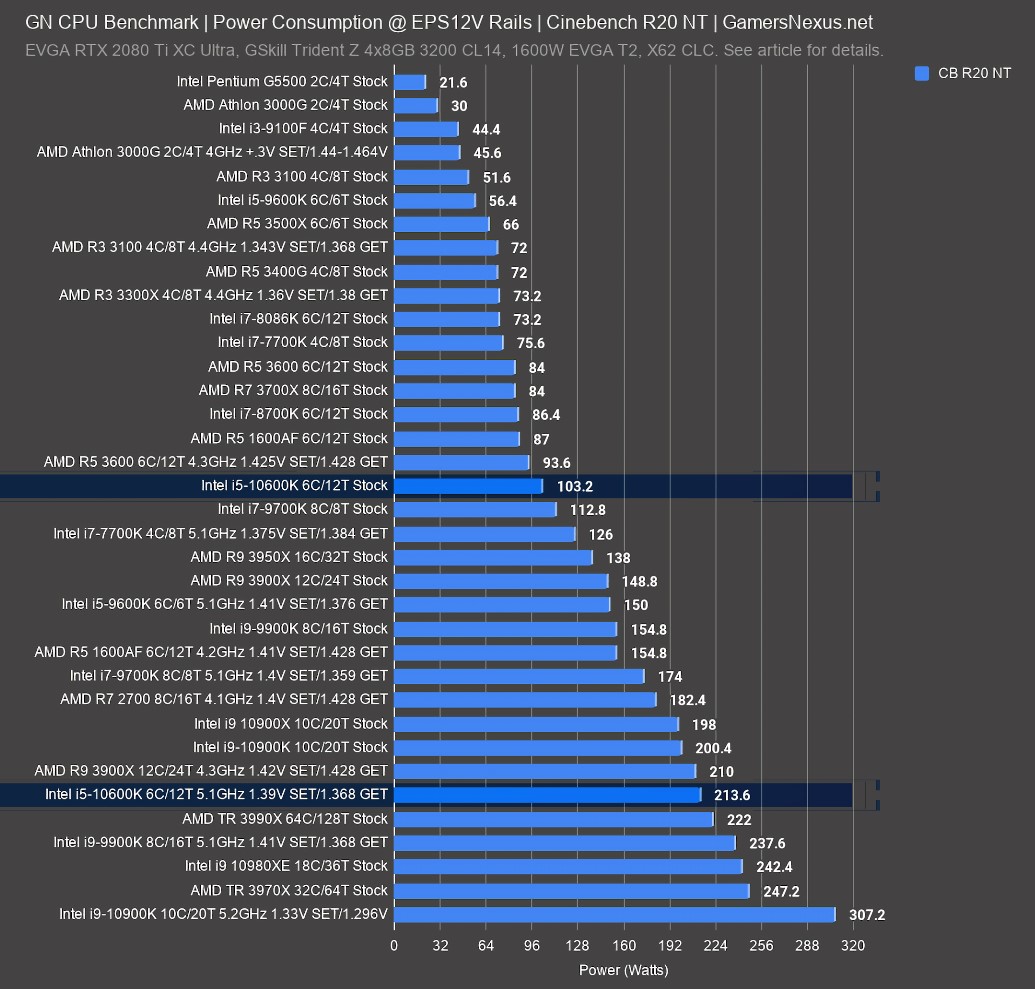
Power testing is next, measured at the EPS12V cables rather than the wall. This allows us more accuracy than wall measurements, but doesn’t account for VRM efficiency losses. We’ll start with an all-core workload from Blender after 5 minutes, which allows turbo time expiry via Tau to kick in. For this one, the Intel i5-10600K stock CPU requires about 104W, putting it higher than Intel’s i9-9900K stock CPU at 8C/16T. AMD’s R5 3600, for reference, measures 80W stock and 90W at an abusive voltage for our stable 4.3GHz overclock. The i5-10600K overclock puts it at 218W at 5.1GHz and 1.368V GET. This is outdone handily by the i9-10900K, at 317W for its overclock.
Cinebench R20 is next. We use this one to get the pre-expiry Tau numbers for Intel Turbo. The i5-10600K stock CPU is in roughly the same position as before, but the i9-10900K shows what to expect for CPUs that run Turbo 3.0 and TVB -- it’s now at 200W for the stock result, where it’ll hold for 56 seconds prior to dropping back to about 120-125W. The rest of these numbers are about the same as in the previous chart.
Conclusion
Wrapping this review up, we find the i5-10600K more interesting than the i9-10900K -- at least in some aspects. The i9-10900K is more or less a drop-in i9-9900K replacement that doesn’t move the positioning a whole lot: It’s another “technical best” for gaming, and more competitive than before, but it’s lower in the stack where Intel was struggling. The 10600K is meant to address that. The i9-10900K scores wins where its raw frequency performance isn't limited by the GPU. In terms of production, we’re still looking at the R9 3900X as the better choice, especially as it’s cheaper. And, as we mentioned earlier, AMD and its Ryzen 3000 CPUs are currently enjoying the more mature platform in a sort of odd twist of fate.
The i9-10900K still holds the crown for pure gaming performance, although ~$500 is a lot to pay for a strictly gaming CPU, especially as most games become GPU bound and all decent CPUs become effectively equivalent. That brings us back to the old “an i5 is good enough for gaming” phrasing, where it does look like that with the i5-10600K, an i5 is good enough for gaming again. If you’re primarily gaming, and using your PC for non-production tasks, then the i5-10600K seems an apt choice. It does fine in workstation and production applications as well, but tends to allow the 3600 a lead by 3-4% and a significant pricing advantage, so we wouldn’t buy it only for that.
Moving down the ladder a rung, if you’re looking for something a bit cheaper that’s not quite as good in an objective sense (for gaming), but nearly as good in a practical sense, there’s the R5 3600. The R5 3600 also has some expanded capabilities in production, albeit the margins between it and the i5-10600K are slim -- again around 3% to 6% in most cases.
For production workloads, AMD simply has the advantage here. The R7 3700X or R9 3900X make more sense for production, and aren’t dissimilar in price from the 10600K and 10900K. Meanwhile, the R5 3600 is competitive all around, gaming included, even if it doesn’t top our gaming charts.
While the i5-10600K is certainly worthy of consideration, especially in terms of value germane to its higher priced i7 and i9 brethren, AMD’s R5 3600 still wins the outright best value award. The Intel i5-10600K, however, is our top choice for a gaming-focused build where the budget can stretch past the 3600. Further, it’s an overclocking monster, as we showed in our separate 10600K heavy tune content on YouTube.
NOTE: THIS IS A DELAYED PUBLICATION OF OUR 10600K REVIEW FROM YouTube. If you already saw this on YouTube, it's the same thing, just the written format. We have not changed anything, so new information we've uncovered about the 10600K isn't included post-launch and you'll need to check our channel for follow-up coverage, like our in-depth tuning piece on the 10600K. We do our best to publish articles for our videos when we can. In this climate of web publishing, obviously, the money is in video to keep us operating, so articles are published largely at a loss or at cost. You can support our efforts by grabbing one of our new wireframe PC component mouse mats, mod mats for PC building, or by visiting us on Patreon.
Editorial: Steve Burke, Patrick Lathan
Copy Editing: Eric Hamilton
Video: Keegan Gallick, Andrew Coleman
