The Intel i7-2600K is arguably one of the most iconic products released by Intel in the last decade, following-up the seminal Nehalem CPUs with major architectural improvements in Sandy Bridge. The 2600K was a soldered CPU with significant performance uplift over Nehalem 930s, and launched when AMD’s Phenom II X6 CPUs were already embattled with the previous Intel architecture. We revisited these CPUs last year, but wanted to come back around to the 2600K in 2018 to see if it’s finally time to upgrade for hangers-on to the once-king CPU.
Our original Intel i7-2600K revisit (2017) can be found here, but we had a completely different test methodology at the time. The data is not at all comparable.
The 2600K CPU was manufactured starting around 2009-2010, launching alongside the Intel Sandy Bridge 2nd Gen Core i-Series of CPUs. This launch followed Nehalem, which challenged the Phenom II X6’s appeal in a heated market. Sandy Bridge launched and has remained a well-respected, nearly idolized CPU since its launch. Intel made tremendous gains over Nehalem and hasn’t quite recaptured that level of per-core increase since. For everyone still on Sandy Bridge and the i7-2600K (or i7-2700K), we wanted to revisit the CPUs and benchmark them in 2018. These 2018 i7-2600K benchmarks compare against Ryzen (R7 2700 and others), the i7-8700K, and the i9-9900K, alongside several other CPUs. For anyone with a 2700K, it’s mostly the same thing, just 100MHz faster.
Test Components
Tested CPUs primarily include the below list:
- Intel i9-9900K
- AMD R7 2700
- AMD R7 2700X
- Intel i7-8700K
- AMD R5 2600
- AMD R5 2600 OC (2600X stand-in)
- Intel i5-8600K
- Intel i9-7900X
- Intel i9-7960X
- AMD R7 1700
- Intel i7-4790K
Motherboards used for testing are as follows:
- ASUS Maximus XI Hero Z390
- Gigabyte Gaming 9 Z370
- Gigabyte Z97X Gaming G1 BK
- ASUS Crosshair VII Hero X470
- ASUS Crosshair VI Hero X370
- Gigabyte X299 Gaming 9
- MSI GD65 Z77 w/ HyperX Savage DDR3 32GB 2166MHz (max supported)
Constants used are as follows:
- All desktop platforms: 2x 8GB 3200MHz Corsair Vengeance LPX 16-18-18-36 DDR4
- (Exception: Z97X uses HyperX Savage 2133MHz DDR3)
- All quad-channel HEDT platforms: 4x 8GB 3200MHz Corsair Vengeance LPX 16-18-18-36 DDR4
- Corsair AX1600i PSU
- NZXT Kraken X62 at 100% speeds
Windows 10 version 1803 was used for all testing with Windows Update disabled. PresentMon is used for framerate data logging, with custom scripts for capturing data accurately.
Intel i7-2600K Benchmark in 2018 vs. 9900K, 8700K, R7 2700 – F1 2018
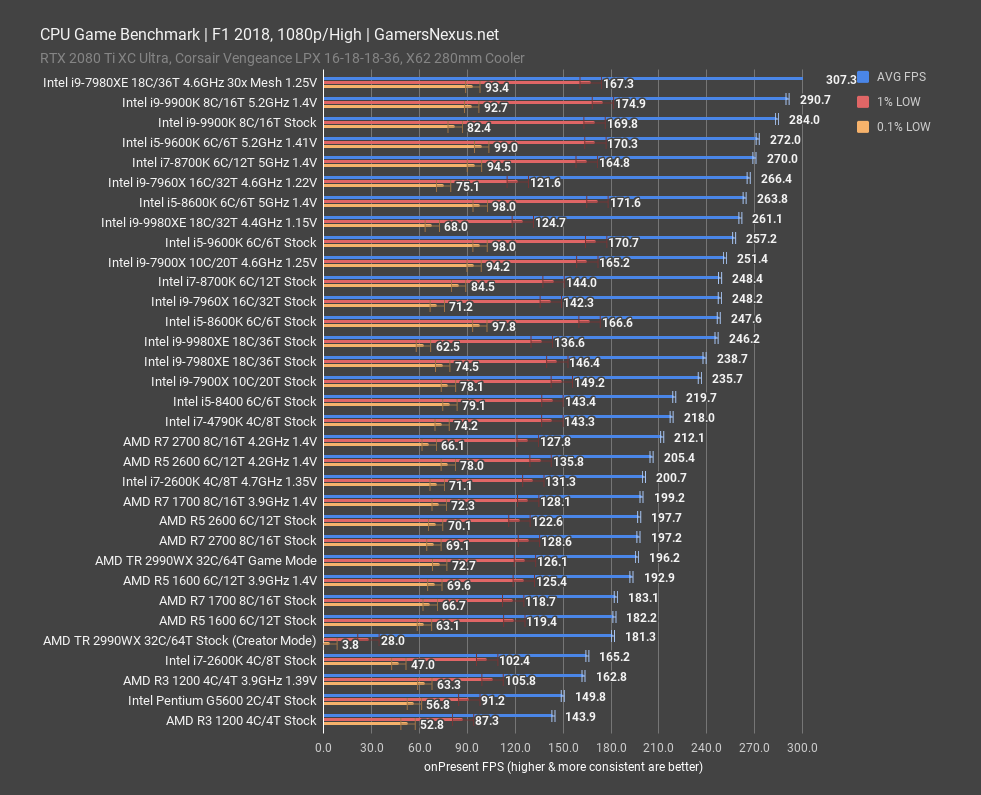
F1 2018 is up next. Using the EGO engine by CodeMasters, F1 2018 offers a strong representation of some of the most common racing games available. This one tends to push extremely high framerates, even at 1080p resolutions.
For 1080p and High settings, we tracked F1 2018 as hitting 165FPS AVG on the i7-2600K stock CPU, putting the once-king i7-2600K about on-par with the Ryzen 3 1200 CPU overclocked to 3.9GHz. It’s performing behind the R5 1600 stock CPU as well, although we must give credit to the 2600K for keeping up for this long. It’s still perfectly capable in this particular title, although may be limiting for anyone who can see a difference at 200Hz. Generationally, the 4790K ends up at 218FPS AVG, a marked gain over the 2600K. If you want to use percentages in this non-linear metric, that’d be a 32% gain. In terms of frametime differences, you’re looking at roughly 4.6ms frame-to-frame interval on the 4790K, or about 6.1ms on the 2600K. Normalizing for this, the increase is still about 31.5% improved. The 8700K ends up at 248FPS AVG when stock, for reference, with the 9900K stock CPU at 284FPS AVG. These deviate from core count equivalence with the 2600K, but the 8700K does replace its position in spirit.
Overclocking the 2600K to 4.7GHz really helps its positioning, planting it firmly alongside the 4.2GHz overclocked R5 2600 and the 3.9GHz overclocked R7 1700 8C CPU. It has also closed-in on the stock 4790K, overall proving an impressive chip even in 2018.
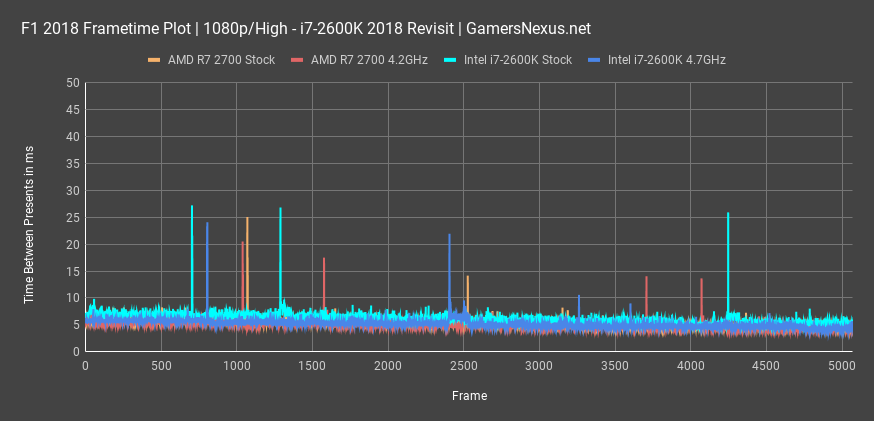
Let’s look at some frametime numbers from F1 2018 at 1080p:
This frametime plot will demonstrate frame-to-frame intervals in milliseconds between the i7-2600K stock and overclocked, alongside the R7 2700 stock and overclocked. Remember, these charts are ultimately the most important, not FPS charts. FPS charts are also important and hard to beat for comparing a large amount of devices, but frametimes illustrate real gameplay experience from one millisecond to the next. Lower is better, but more consistent is better than lower. For perspective, 16.667ms is 60FPS, which you get by dividing 1000ms by 60FPS. onPresent frametime represents the interval of time between frames being presented.
In these results, we can see some frametime spikes that are just the nature of F1 2018. These happen sometimes, and are why our 0.1% low metrics are all over the place for this game. No one CPU has a statistically significant amount more spikes than the others – it appears to be just behavior of the engine.
Overall, we see that the 2600K at 4.7GHz and R7 2700 at 4.2GHz do the best, but all of these remain clustered around 4-6ms frametimes, which is overall excellent performance. Most players would be happy with either device.
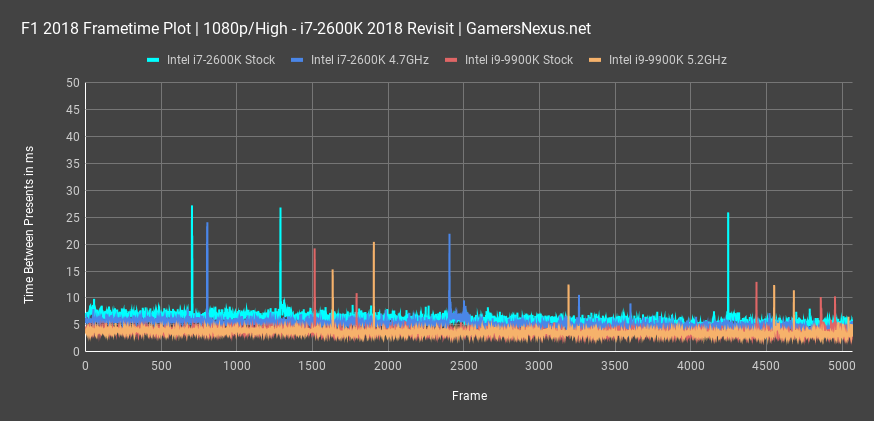
For perspective, here’s one more of those plots with the i9-9900K against the 2600K.
In this one, the 9900K sits close to 4ms frametimes on average, ranging between 3.8 and 4.5, with the 2600K sticking closer to a range of 6.6 to 8.4ms when stock. As for whether you can notice that difference, well, that’s up to you – but the 9900K is obviously significantly better in overall performance than 2010’s 2600K. That also shouldn’t surprise anyone.
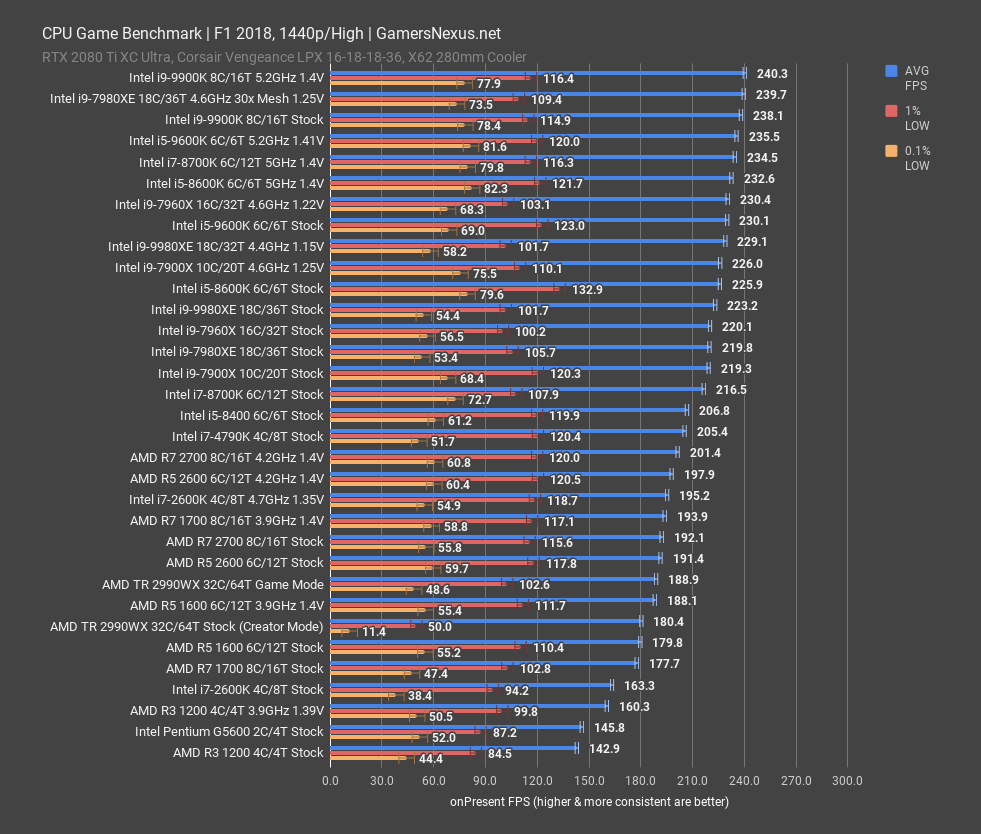
At 1440p, back to FPS charts, the 2600K keeps identical positioning as previously. This makes sense, as we’re becoming GPU-bound at the top-end, while CPU load remains the same. Even at 1440p and with the GPU truncating the max framerate, there is still a significant improvement at the top-end of performance with newer Intel CPUs. A hard line is drawn at the 4790K in this benchmark, where no AMD CPU has managed to cross just yet. That said, the 2700 is awfully close, and one has to evaluate other workloads that may shift the CPU choice in favor of AMD’s lineup. It just depends on what you’re doing – if you’re only playing F1, the stack is clearly in favor of frequency from Intel. Let’s look at another game for perspective.
Intel i7-2600K vs. i9-9900K, i7-8700K, R7 2700, etc – Assassin’s Creed: Origins
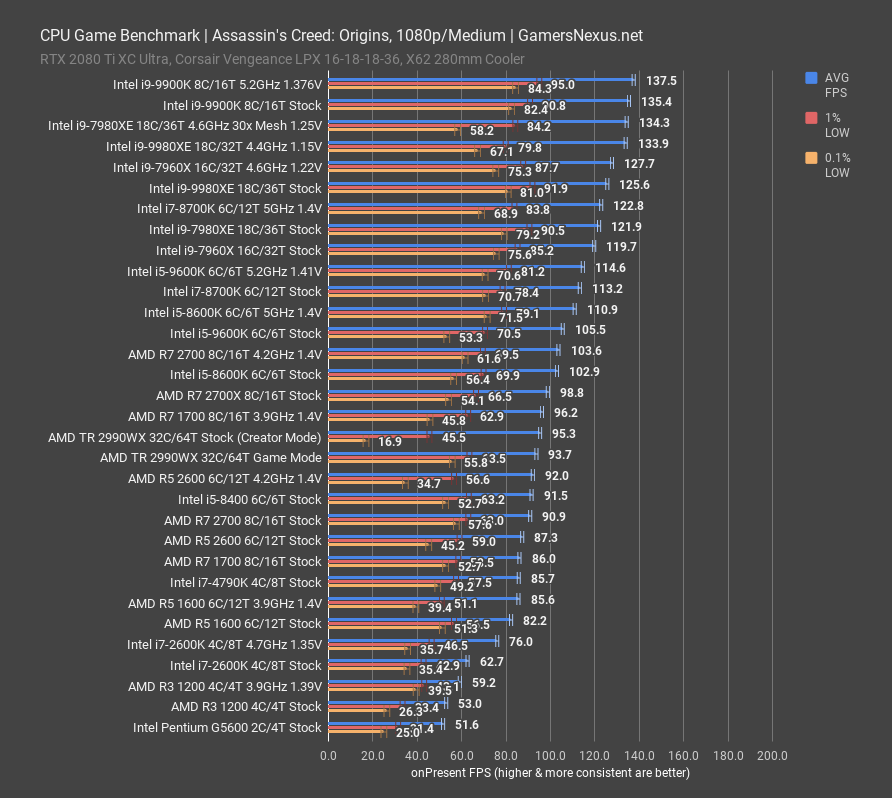
Assassin’s Creed: Origins is up next, giving us a look at a Ubisoft title with a commonly modified engine for other Ubisoft games. At 1080p/Medium, ACO lands the 2600K stock CPU at 63FPS AVG, with lows at 43FPS 1% and 35FPS 0.1%. This game is a bit more consistent than some of the others we’ve tested, and so the low values prove more useful here for rapid indications of frametime consistency.
The 2600K’s stock numbers mark it as a bit better than the overclocked 3.9GHz 1200 in AVG FPS; although measurable, we should also note that this difference is imperceptible to any real user. The low frametime performance delta is within margin of error. Overclocking the 2600K pushes it up to 76FPS AVG, ranking it between the modern R5 1600 stock CPU and the stock 2600K. Performance here becomes limited rapidly, as evidenced by our maximum framerate of about 135-138FPS AVG. Even the modern i5-8400 is outperforming the 2600K in big ways, ranking 92FPS AVG with the 6C/6T configuration. It’s two fewer threads, but the upgrades to cache and architecture as a whole have benefited the 8400 noticeably.
The stock 8700K offers 113FPS AVG, roughly an 80% improvement over the stock 2600K. The R7 2700 ends up about 45% higher in FPS when both are stock. At this point, nearly anything would be an upgrade to the 2600K. It’d be hard to be upset with any modern i7 or R7 CPU when considering these results. Whether you go i7, R7, or i9 will depend on budget and on other use cases, like those exiting gaming. We’ll talk about that more in the conclusion.
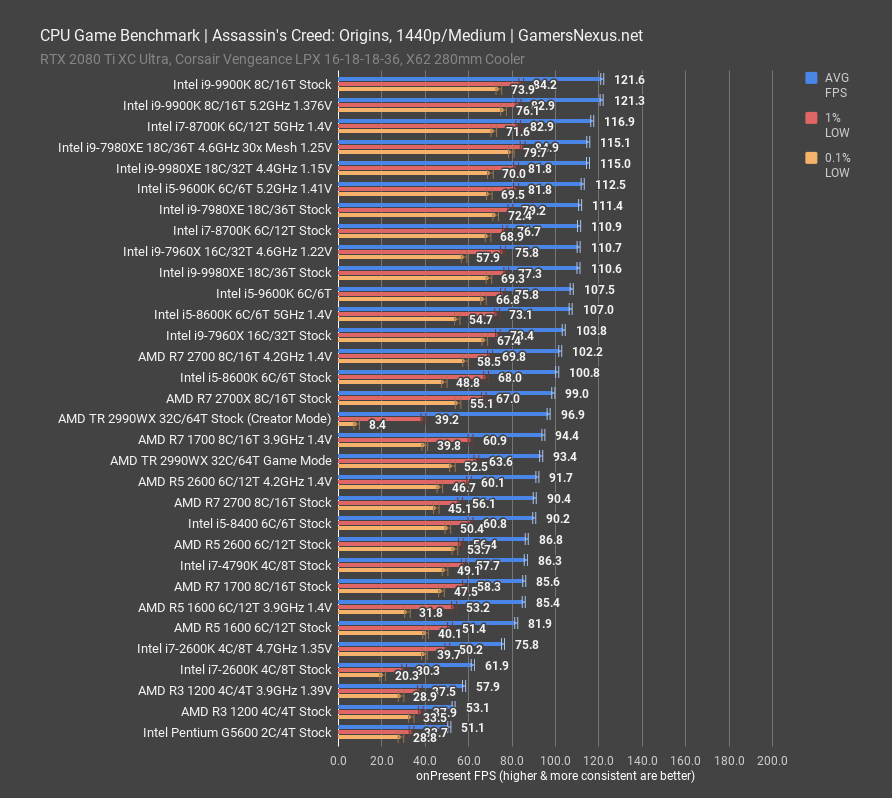
At 1440p, the 2600K ends up in roughly the same exact positioning. This makes sense, because we’re not hitting a GPU stressor at these performance levels. Nothing really changes about the stack at 1440p; at least, nothing aside from the chart-topping CPUs, where the 2080 Ti becomes a limitation.
Intel i7-2600K Review – Far Cry 5
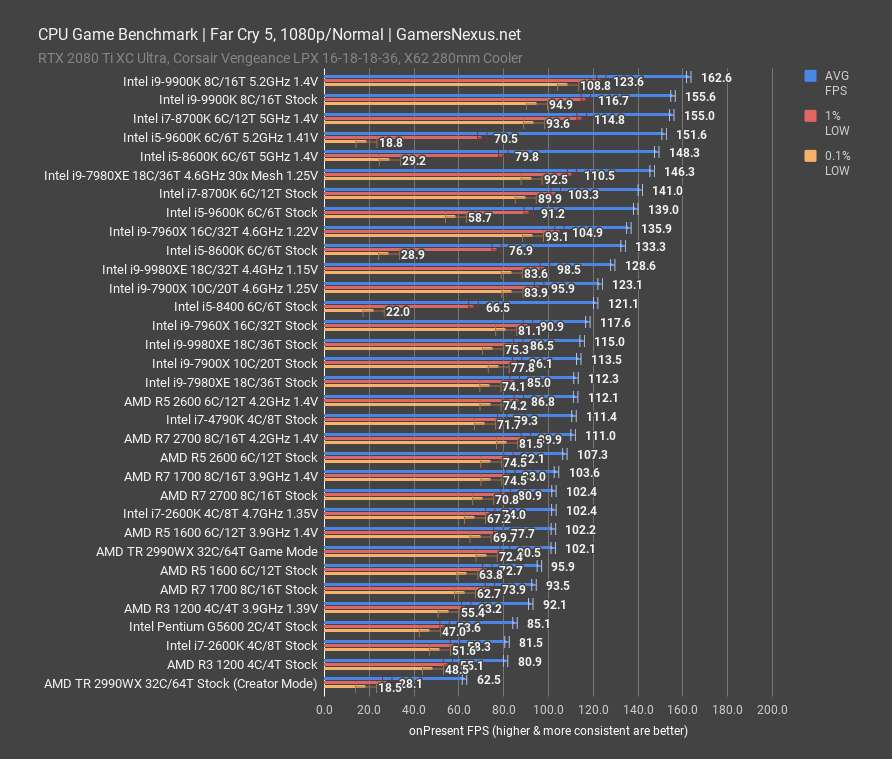
Far Cry 5 is up next, using the Dunia Engine by Ubisoft. We recently explained that this game has some frametime consistency issues on Intel CPUs with fewer than 8 threads, making Far Cry one of the best examples of why 1% and 0.1% low numbers don’t always show the full story. We showed this frametime plot in the 9600K review, illustrating that occasional, severe spikes can get averaged out when using even a 0.1% low average. This has nothing to do with overclock stability, as is made obvious by the frametime plots, and is entirely to do with consistency of frame delivery on these i5 CPUs. We’re still looking into this further.
Anyway, for a normal FPS chart, the i7-2600K lands at around 82FPS AVG. This ranks the 8-year-old flagship CPU as roughly tied with an R3 1200, which is about $100-$115 in 2018. Overclocking the 2600K boosts it to 102FPS AVG, a significant uplift of about 26%. This performance figure ties the 2600K with the R7 2700 stock CPU, even in frametime consistency. There is no objective improvement to, quote, “smoothness” between the 2700 and overclocked 2600K. Overclocking the 2700 does provide further uplift, of course, as does an i7-8700K or similar.
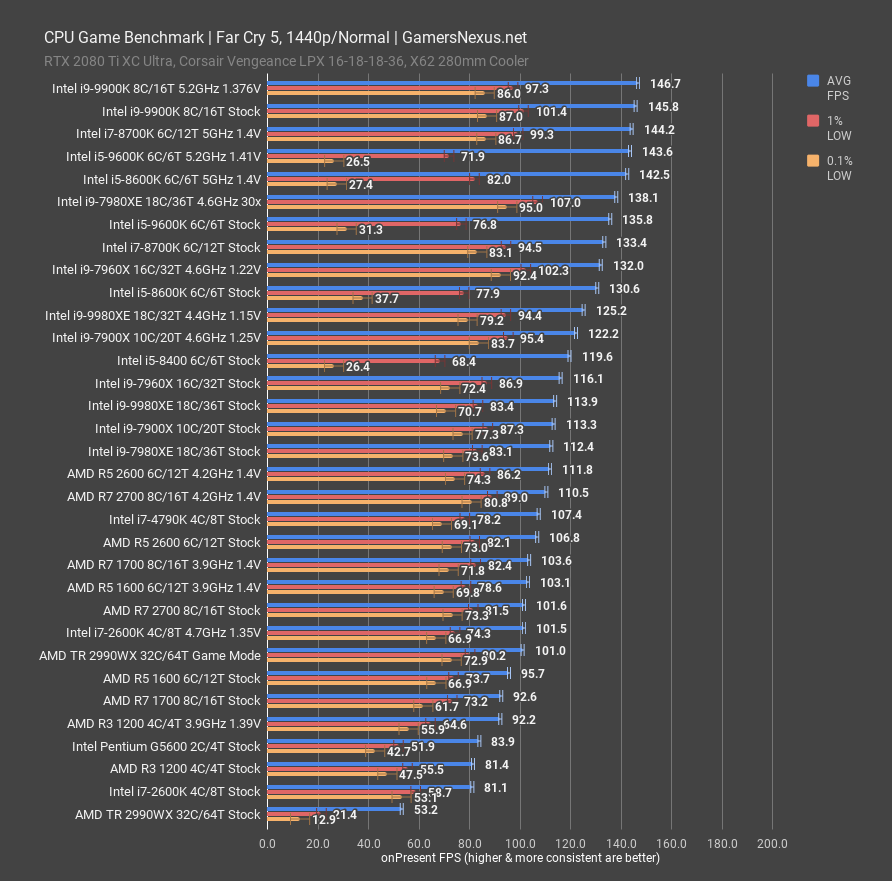
1440p, by the way, helps further illustrate that Far Cry 5 frametime consistency is deeper than an unstable overclock, as averaging yielded equally bad 0.1% metrics on the 9600K stock and overclocked results. That doesn’t matter here, though. The 2600K ends up again at around 81FPS AVG, which is completely expected since we’re not GPU-bound.
Intel i7-2600K Revisit – Civilization VI
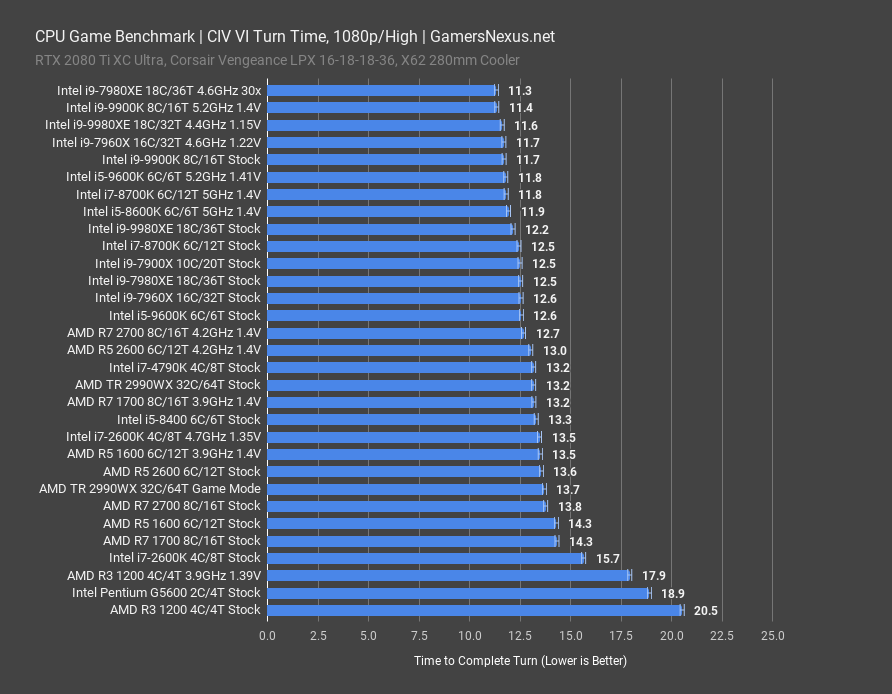
Civilization VI provides an important benchmark for CPUs, giving us a look at turn resolution time requirements. In Grand Campaign-style games where AI players have to “think” about their actions, considering thousands of options, the CPU rapidly becomes the bottleneck as the GPU spins its wheels waiting for the occasional frame.
In this instance, turn time requirements on the stock i7-2600K are 15.7 seconds per turn, which is calculated against 5 AI players and averaged. This means that, for a full rotation back to your own turn, you’d be waiting about 78.5 seconds. For perspective, a modern 9900K stock CPU requires 11.7 seconds to process a turn, meaning that the full rotation takes 58.5 seconds. Considering that turn time goes up as campaigns drag on, this delta rapidly becomes significant for turn-based strategy enthusiasts. The 8700K also does well, at 12.5 seconds stock. Overclocking the 2600K to 4.7GHz provides a significant turn time requirement reduction of 14%, putting it alongside the i5-8400 stock CPU and R5 2600 stock CPU. This game particularly likes frequency, which is why you’ll see the Ryzen CPUs with a higher clock outperforming their higher thread-count counterparts.
Intel i7-2600K Benchmark & Overclocking - Blender
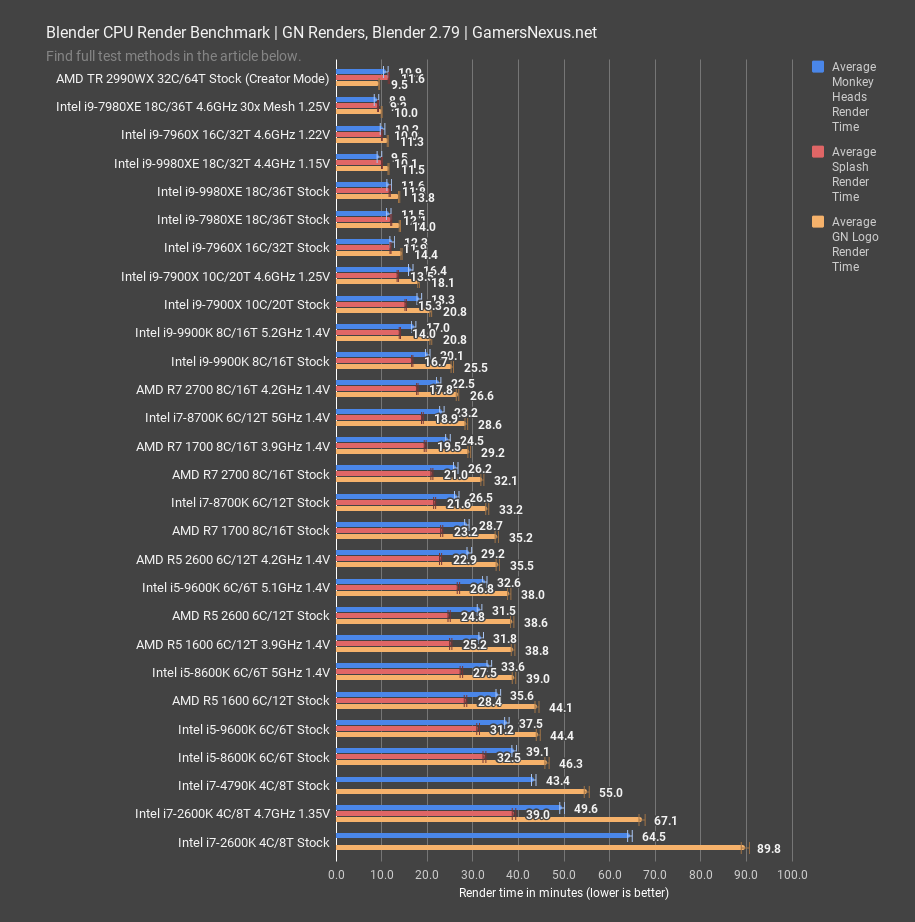
Blender offers a look at a realistic non-gaming workload that a 3D artist might encounter. We used Blender to make our 2-second intro animation to this video, for example, and we also use one of the frames from that animation to benchmark CPU performance. With the GN Logo render as a benchmark, the stock i7-2600K requires 90 minutes to complete the render. For perspective, the 2990WX 32C AMD CPU requires 9.5 minutes for that same render, or a more price-consistent stock 8700K requires about 33 minutes to complete the render. No matter how you look at it, every other CPU on the chart would be an upgrade. Overclocking the 2600K to 4.7GHz pushed it to 67 minutes, a massive and noticeable render time reduction of 25%. This puts it closer to the 4790K, but still distant, as the 4790K reduces its render time over the overclocked 2600K by 18%.
This application is primarily where AMD’s offerings really start to shine, though: The R7 2700 completes the GN Logo render in 32 minutes when stock, which reduces render time against the stock 2600K by 64%. Overclocking to 4.2GHz pushes it even lower, down to 27 minutes render time. If 3D rendering or tile-based rendering is your thing, it would be worth looking into Ryzen as a high-performance part that comes in at relatively low prices. This doesn’t apply globally to all productivity applications, mind you: Photoshop still favors frequency, as does Premiere, but Blender and tile-based renderers really do well with Ryzen.
Conclusion: Is the i7-2600K Still Good in 2018?
Yes, it’s still good – just the extent of its usefulness will depend on your use cases, as always. First of all, for anyone with an i7-2600K and trying to stretch it a bit longer, we can strongly recommend considering an overclock attempt. It’s not too difficult and many guides exist for such an old (and popular) processor, and those 4.7GHz results substantially improved the 2600K’s baseline performance. A new cooler could help here, depending on what was used when it was installed. We can also recommend potentially considering a new Windows installation, as many users often conflate a new system build entirely with “smoother” experiences; in reality, this is oftentimes attributable just as much to a new software environment as it is to a new hardware environment.
The i7-2600K is still an excellent performer. It’s getting long in the tooth, of course: We wouldn’t recommend relying on the 2600K for applications like Blender, where those long render times can start creating serious downtime for the system. Some games have also proven more demanding of the 2600K than others. In a few of the titles above, we’re starting to fall below the 60FPS threshold, whereas others (F1 2018) still allow for over 100FPS throughput on the CPU. It’ll just come down to the type of game you’re playing and, ultimately, whether or not the experience is subjectively “good.” That’d be down to your opinion. Objectively speaking, the 2600K matches a modern R3 1200 in several titles, and falls markedly below even a 4790K (although overclocking the 2600K to 4.7GHz gets it within striking distance of a stock 4790K).
For a pure gaming build – someone who doesn’t use their PC for anything other than light office work (Word/Excel/email), video playback, and gaming – the 2600K isn’t worth upgrading unless jumping to something like an 8700K or 9700K (not on these charts yet). The 9900K would also, clearly, be an upgrade, but it’s hard to find, expensive, and tough to justify overall. Moving to Ryzen would be lateral and not provide a substantially improved gaming experience over the 2600K (and a Windows reinstall would likely smooth-over any frametime issues); however, moving to Ryzen would be a recommended change for someone working with applications like Blender on the regular. In this instance, the 2700 – priced similarly to the launch 2600K price (or cheaper, actually) – provides a several-fold uplift in performance in Blender, reducing render times noticeably with its increased thread count. If this type of workload sounds like you, AMD is a worthy contender to consider. The market is much different than when the 2600K launched.
Note that applications like Photoshop and Premiere still favor frequency, at this time, but that tile-based rendering applications leverage Ryzen’s thread-count well.
For pure gaming, again, we’d encourage trying to keep the 2600K alive a bit longer. If it’s truly at the end of its life (or if you’ve become bored of it), an 8700K upgrade would be similar to where the 2600K once was. Alternatively, check back for our upcoming 9700K review.
Editorial, Testing: Steve Burke
Testing: Patrick Lathan
Video: Andrew Coleman, Keegan Gallick
