The Kaby Lake i7-7700K launched to the usual review verdict for Intel CPUs: Not particularly worthwhile for owners of recent Intel i7 CPUs, but perhaps worth consideration for owners of Sandy Bridge and (maybe) Ivy Bridge. The CPU gave an extra 1.5-3% gaming performance over the i7-6700K and roughly ~+7% performance in render applications. The i5-7600K we’d suspect would be similar in its generational stepping, but it’s worth properly benchmarking.
Our i5-7600K ($240) review and benchmark includes CPUs dating back to the i5-2500K (including OC) and i5-3570K, though we’ve also got a similar amount of i7 CPUs on the bench. We’ve just finished re-benching some of our AMD CPUs for some near-future articles, too, but t hose won’t make it on today’s charts.
Before starting, a quick refresher on Intel Kaby Lake CPU specifications (reprinted from our Intel i7-7700K review):
Intel Core i7-7700K vs. i5-7600K, i3-7350K Specs
| Intel Kaby Lake K-SKU CPUs | |||
| GamersNexus.net | i7-7700K | i5-7600K | i3-7350K |
| Cores | 4C/8T | 4C/4T | 2C/4T |
| Frequency | 4.2/4.5GHz | 3.8/4.2GHz | 4.2GHz |
| Overclocking | Yes | Yes | Yes |
| IGP | HD 630 | HD 630 | HD 630 |
| Dynamic Frequency | 1150MHz | 1150MHz | 1150MHz |
| DDR4/DDR3L MHz | 2400/1600 | 2400/1600 | 2400/1600 |
| Intel Smart Cache | 8M | 6M | 4M |
| Memory Channels | Dual | Dual | Dual |
| TDP | 91W | 91W | 60W |
| Process Technology | 14nm+ | 14nm+ | 14nm+ |
| 1ku Price | $339 | $242 | $168 |
Intel i5-7600K Benchmark [Video Version]
Reminder on Kaby Lake Architecture
Again, check the i7-7700K review for the Kaby Lake architecture updates, along with Page 2 for the chipset differences, but we’ll quickly update here.
Kaby Lake is built on “14nm+” process, which is Intel’s way of marketing fine tuning over the previous 14nm Skylake process. For Kaby Lake, updates primarily consist of changes to the gates and fins (widened gate pitch, slightly modified fin height), ultimately resulting in a clock frequency increase. That change gets us an extra couple hundred MHz in stock clocks over the previous generation, the origin of nearly all performance gains with Kaby Lake.
Caching and features are effectively identical to Skylake, as are most of the chipset features. We see some additions in Intel Optane support (learn what that is here) and HSIO lanes for lower-end chipsets, but that’s about the start and the end of it.
Like other K-SKU CPUs, the 7600K is fully overclockable via BCLK + multipliers and pairs best with the Z-series motherboards. As for other 7600K specs, we’re looking at a 2MB reduction in total cache from the i7, dropping to 6MB (vs. 8MB), but otherwise keeping largely the same specs and compatibilities. The biggest change, as always, is the halved thread count and reduced frequency.
Game Test Methodology
NVIDIA 376.33 drivers were used for benchmarking. Game settings were manually controlled for the DUT. All games were run at presets defined in their respective charts. All other game settings are defined in respective game benchmarks, which we publish separately from GPU and CPU reviews. Our test courses, in the event manual testing is executed, are also uploaded within that content. This allows others to replicate our results by studying our bench courses.
Windows 10-64 build 10586 was used for testing.
Each game was tested for 30 seconds in an identical scenario, then repeated three times for parity.
Some benchmarks disable EIST, Turbo, and other features -- please check each section to learn if that is the case. Otherwise, for game benchmarks, assume stock settings (Turbo enabled). We always disable C-states.
Average FPS, 1% low, and 0.1% low times are measured. We do not measure maximum or minimum FPS results as we consider these numbers to be pure outliers. Instead, we take an average of the lowest 1% of results (1% low) to show real-world, noticeable dips; we then take an average of the lowest 0.1% of results for severe spikes.
Core Components (Unchanging)
- NZXT 1200W Hale90v2
- For DDR4 platforms: Corsair Vengeance LPX 32GB 3200MHz
- For DDR3 platforms: HyperX Savage 32GB 2400MHz
- Intel 730 480GB SSD
- Open Air Test Bench
- Cooler #1 (Air): Be Quiet! Dark Rock 3
- Cooler #2 (Cheap liquid): Asetek 570LC w/ Gentle Typhoon fan
- Cooler #3 (High-end): Kraken X62
- GPU: GTX 1080 FTW (EVGA)
Note: fan and pump settings are configured on a per-test basis.
Z270 Platforms:
- Gigabyte Aorus Gaming 7 (primary)
- MSI Gaming Pro Carbon (secondary - for thermal validation)
- i7-7700K (x2) samples from motherboard vendors
Both used for the 7700K.
Z170 Platform:
- MSI Gaming M7
- i7-6700K retail
Z97 Platform:
- Gigabyte Z97X G1 WIFI-BK
- i7-4790K
Z77 Platform:
- MSI GD65 Z77
- i7-2600K
Dx12 games are benchmarked using PresentMon onPresent, with further data analysis from GN-made tools.
Note: We'd like to add the i5, i3, and FX CPUs, but this was enough for now. We'll add those as we expand into coverage of Zen or i5 Kaby Lake products.
Thermal Test Methodology
We strongly believe that our thermal testing methodology is among the best on this side of the tech-media industry. We've validated our testing methodology with thermal chambers and have proven near-perfect accuracy of results.
Conducting thermal tests requires careful measurement of temperatures in the surrounding environment. We control for ambient by constantly measuring temperatures with K-Type thermocouples and infrared readers. We then produce charts using a Delta T(emperature) over Ambient value where notated, otherwise, we'll use the diode and sensor measurements to provide a baseline performance metric. AIDA64, Intel Xtreme Tuning Utility, and HW Monitor (CPU PKG) are all used to monitor thermals. It appears that XTU and HW Monitor match in their measurement of CPU PKG for Kaby Lake.
All open bench fans are configured to their maximum speed and connected straight to the PSU. This ensures minimal variance when testing, as automatically controlled fan speeds will reduce reliability of benchmarking. The CPU fan is set to maximum fan speed, unless otherwise stated.
We use an AMPROBE multi-diode thermocouple reader to log ambient actively. This ambient measurement is used to monitor fluctuations and is subtracted from absolute GPU diode readings to produce a delta value. For these tests, we configured the thermocouple reader's logging interval to 1s, matching the logging interval of AIDA64, HW Monitor, and other tools. Data is calculated using a custom, in-house spreadsheet and software solution.
Continue to Page 2 for thermals & synthetics.
Intel i5-7600K Temperatures
Temperature performance on the i5-7600K mostly mirrors the i7-7700K, particularly given the matching watt draw for each component. Still, we ran it through the tests with a new understanding of how KBL motherboards heavily dictate thermal performance (again, see P4 of our 7700K review for some of that).
The i5-7600K under an NZXT Kraken X62 (and see Page 1 for full testing methodology) is posting a temperature output of ~74C PKG when under AVX workloads for extended periods. This is about equal to a similarly volted i7-7700K.
| Intel i7-7700K & i5-7600K @ 4.5GHz EIST 0, Turbo 0, CStates 0 | |||
| MSI Pro Carbon 7600K | MSI Pro Carbon 7700K | Gigabyte G7 7700K | |
| vCore (v) | 1.28v (manual) | 1.28-1.32 (auto) | 1.188-1.275 (manual) |
| CPU PKG (C) | 74 | 82 | 70 |
| Core 0 (C) | 71 | 82 | 70 |
| Core 1 (C) | 71 | 79 | 69 |
| Core 2 (C) | 74 | 78 | 70 |
| Core 3 (C) | 68 | 76 | 68 |
| Ambient (C) | 25 | 21 | 22.2 |
| Liquid TMP (C) | 33 | 28 | 28 |
| PKG PWER (W) | 97-100 Max 100.67 | 101-104 Max 111.28 | 101 Max 115.15 |
As we learned with the i7-7700K, you’ll really want to check motherboard auto vCore settings when installing a KBL CPU. Auto vCore on some of these boards is overkill, sometimes pushing 1.4v, and will drastically increase the temperature of the CPU. With manual control over vCore, it’s not unreasonable to rest at ~1.18-1.275v with stock settings, reducing temperatures to a point of control by AIOs and most decent air coolers.
We’re still seeing increased temperatures in KBL overall, but it’s within the ~6C range when controlling for voltage.
Blender Benchmark – Intel i5-7600K vs. i7s & i5s
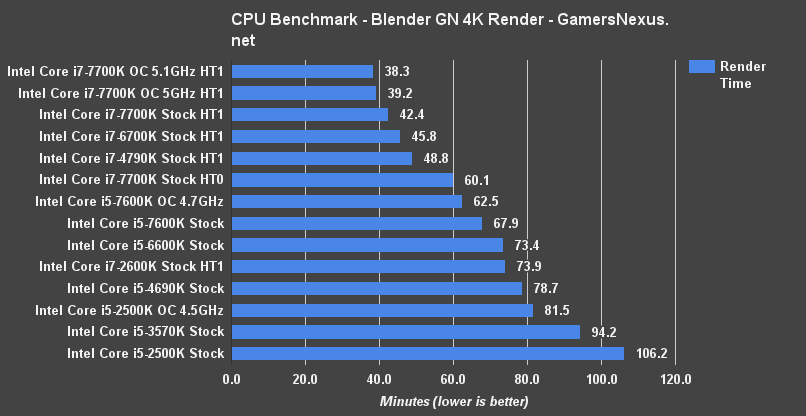
Using our in-house designed Blender benchmark, as built by GN’s Andrew Coleman, we’re recording a total render time on the CPU of approximately 68 minutes with the stock configuration, or 62.5 minutes with the 4.7GHz overclocked version.
As this benchmark demonstrates, having the additional threads helps in render workloads as the tool can render two times as many tiles simultaneously. The 7600K takes just under 30 minutes longer to render the scene than the stock 7700K, and is expectedly slower than all i7 CPUs on the bench other than the aged 2600K. Compared to last generation’s i5-6600K, the 7600K sees an improvement of approximately 5-6 minutes, or about 7%.
Cinebench Benchmark – Intel i5-7600K vs. 6600K, 2500K, & between
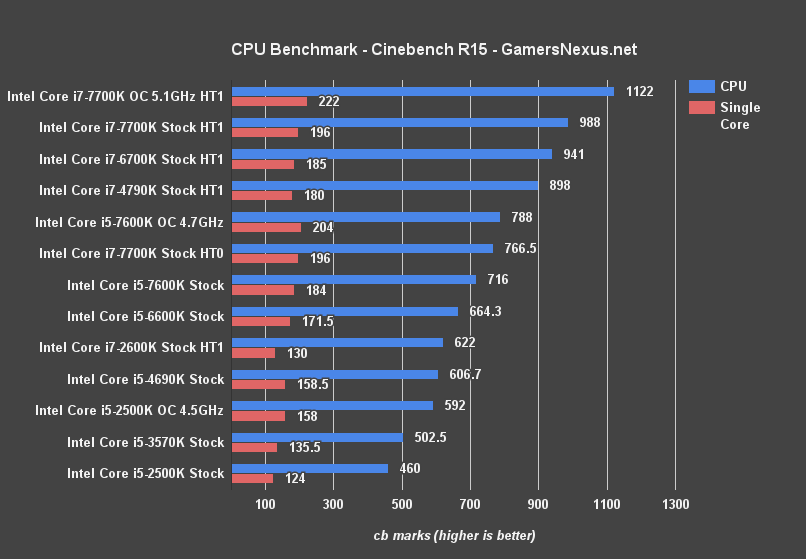
Moving on to synthetics prior to game benchmarks, Cinebench testing places the i5-7600K between the i5-6600K and i7-4790K, with 716 cb marks for CPU performance and 184 marks for single-threaded performance. Comparatively, our overclock boosts that up to 788 for total CPU performance – still below the 4790K – and 204 for single-threaded performance, or just below the 7700K 5.1GHz overclock.
The i5-6600K from last generation operated at 664 cb marks, or 172 single-threaded.
3DMark FireStrike – Intel i5-7600K vs. 6600K, 2500K, 3570K, 4690K
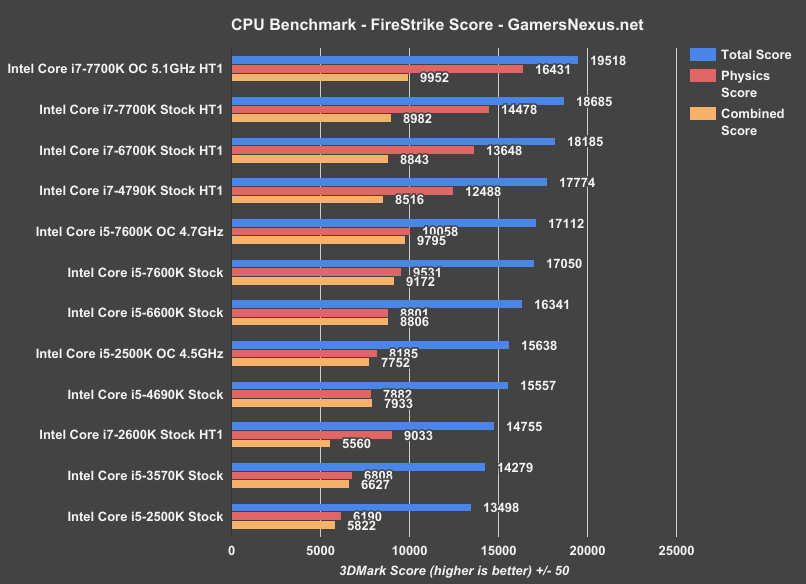
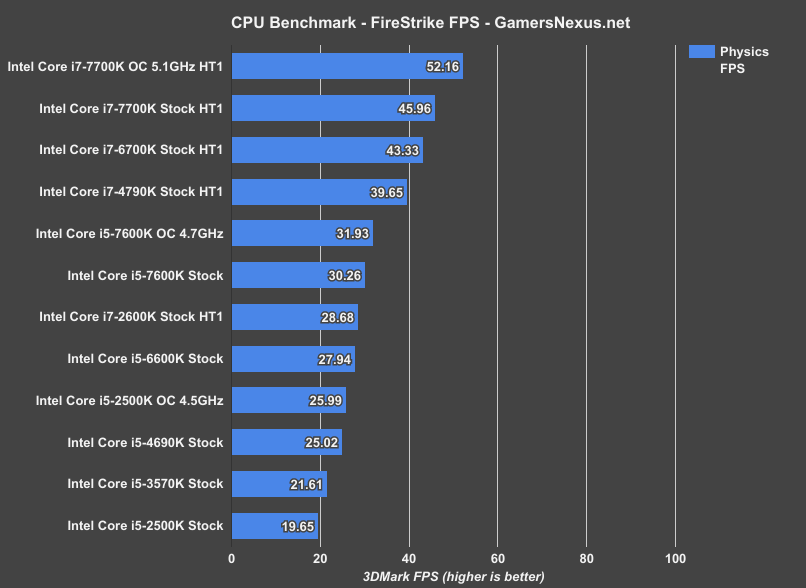
3DMark’s FireStrike benchmark (“normal” settings) lands the 7600K stock at ~17050 points with our total build configuration, as defined on Page 1. The physics score plants us at 9531, and is the more interesting of the points on the chart. Overclocking to 4.7GHz gets us up to 12488 points, or just below the stock 4790K i7 CPU.
Here’s what the physics FPS looks like:
3DMark TimeSpy – Intel i5-7600K Benchmark
Further CPU synthetics with the new, lower level API Timespy benchmark indicates the i5-7600K performing about equally with the i7-4790K (Devil’s Canyon), while the overclocked variant is within reach of a stock i7-6700K (Skylake) CPU. The stock i5-6600K lands between an overclocked i5-2500K and stock i5-7600K.
Continue to Page 3 for FPS benchmarks.
Watch Dogs 2 CPU Benchmark – i5-7600K vs. 6600K, 4690K, etc.
We recently posted a Watch Dogs 2 CPU optimization guide for graphics settings, as the game has proven to be one of the few titles that takes advantage of additional threads from higher-end CPUs. The line dividing i7 and i5 CPUs here is clear, with i7 CPUs dating back to Devil’s Canyon outranking the i5-7600K, even with its overclocked 4.7GHz configuration. We’re seeing an average FPS of about 93 for the overclocked 7600K, with the lows tightly timed as shown with the other CPUs. The non-overclocked version rests at 84FPS AVG. The Intel i7-7700K stock operates at 113FPS AVG, so we’ve got a gap of about 20FPS between the two stock Kaby Lake CPUs.
Looking at the previous generation, the i5-6600K operates at around 79FPS AVG, so we’re gaining approximately 5-6FPS generationally. That’s a gain of about 7%, which is sadly pretty good for this generation of Intel CPUs.
Battlefield 1 CPU Benchmark – i5-7600K vs. i7-7700K, i5-6600K, more
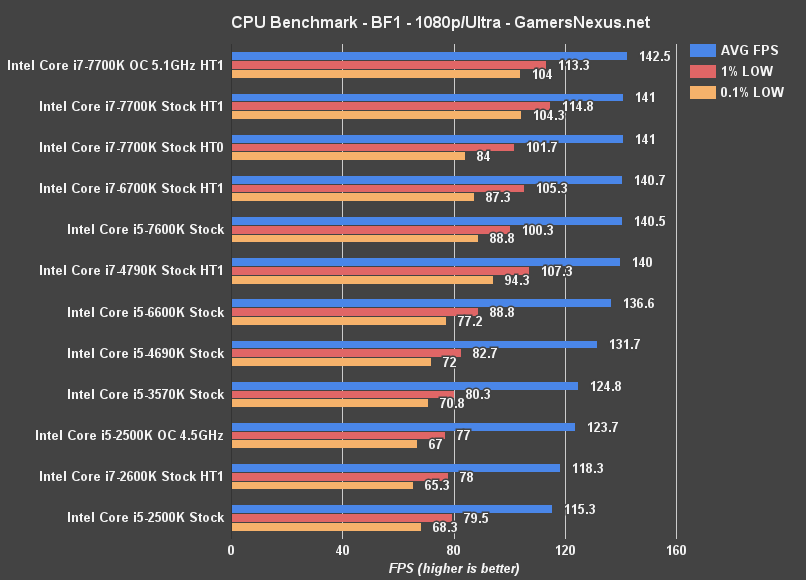
For Battlefield 1, we’re seeing the Intel i5-7600K stock land at around 141FPS AVG, roughly equal to the i7-6700K from last generation. To be fair, it’s also roughly equal to the i7-7700K that also caps out around 141FPS AVG.
Compared to the i5-6600K, there’s not a ton of improvement. We’re moving from 137FPS AVG to 140.5FPS AVG, or a gain of ~2.6%. Not that exciting. We only start seeing meaningful gaps once down to the 3570K, but even that’s not very relevant unless dying for 144Hz gameplay.
Total War: Warhammer CPU Benchmark – i5-7600K
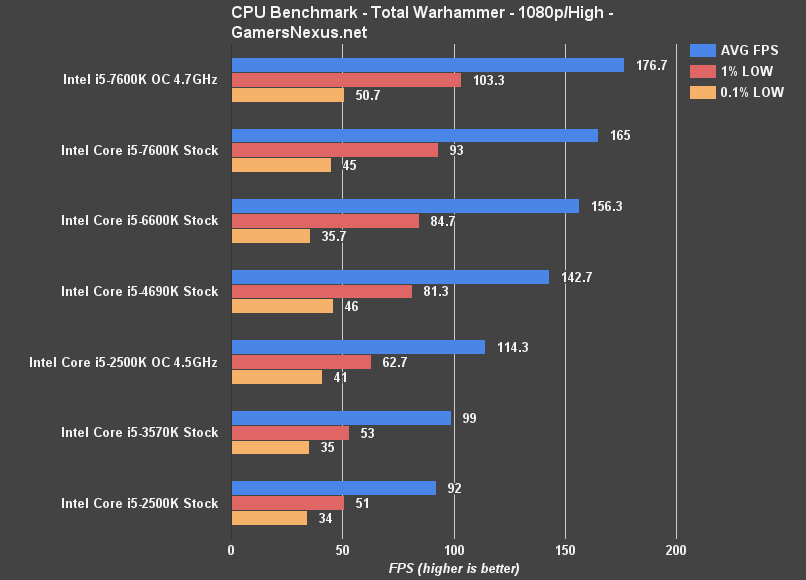
Total War has always been a CPU-intensive series, and that continues to be shown with these benchmarks. As noted previously, the frametimes have a larger range of variance in Total War than we’re used to, so the 0.1% values aren’t quite as useful as normally.
We’re seeing large scalability over the generations of i5 CPUs in this benchmark, with the i5-7600K stock landing at 156FPS AVG and the i5-6600K at around 156FPS AVG. The i5-4690K from Devil’s Canyon operates around 143FPS AVG, with the 3570K at 99FPS AVG. The scaling here shows that there would be a major benefit of upgrade for this particular title if moving up from Ivy Bridge or prior.
The overclocked 7600K shows that frequency matters with Total War, and plants us around 177FPS AVG.
Ashes of the Singularity CPU Benchmark – i5-7600K
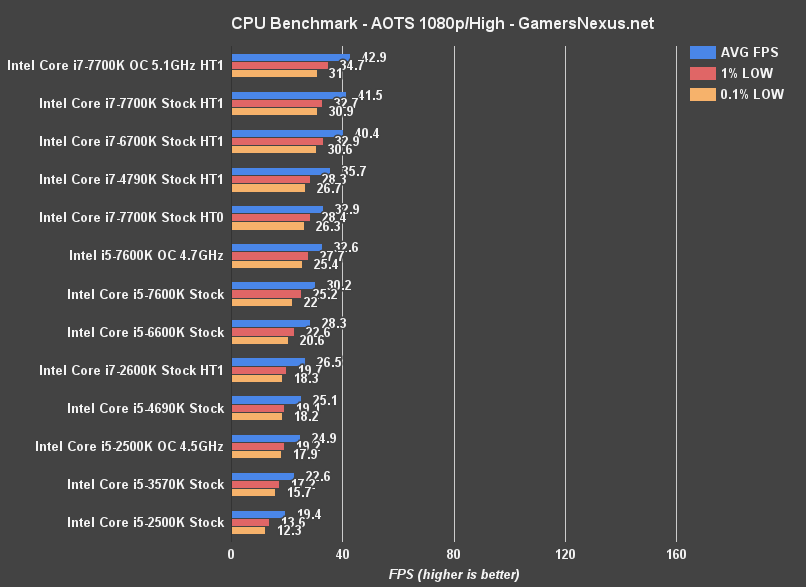
Ashes of the Singularity’s CPU-focused benchmark provides a look at DirectX 12 performance with a title that’s well-optimized for the new API. The 7600K stock performs just ahead of the 6600K and just below the 4790K, as we’ve seen in a few other charts thus far. Moving to the overclocked variant of the i5-7600K, we’re posting an FPS that is still below the 4790K, but getting a bit closer to the next step up.
As for overclocking, the 4.7GHz number used throughout these tests was our maximum achievable overclock. Pushing a vCore of 1.4v got us close to stability with 4.8GHz, but we couldn’t maintain a stable overclock to run games, and so stepped down to 4.7GHz. The chip isn’t quite as impressive as our 7700K sample was for overclocking. It’s still a good overclocker, but our unit may be a bit of a dud. Hard to say without a larger sample size. For what it’s worth, our 7600K is a retail sample that GN purchased.
Conclusion: Is Upgrading to the i5-7600K Worth It?
The 7600K has mostly the same conclusion as the i7-7700K: If you’re on Skylake, stick with it. If you’re on something as old as Ivy Bridge, it’s probably worth considering an upgrade to better enable high-end GPUs with some of these titles, but that’s about where the decision point is.
Of course, Zen will come soon and we are still waiting for further, final info on the new AMD CPU. At this point, we’d recommend waiting around to see how the new AMD architecture performs or sticking with your existing Intel hardware from recent generations.
Editor-in-Chief, Test Lead: Steve Burke
Sr. Editor: Patrick Lathan
Video Producer: Andrew Coleman
