We benchmark and breakdown which GPUs are best for Starfield
The Highlights
- Starfield is the long-awaited space RPG from famed developer Bethesda
- The game is taxing on both GPUs and CPUs
- Being an “AMD-exclusive” launch, AMD’s GPUs perform competitively against NVIDIA’s
- Original MSRP: $70
- Release Date: September 6, 2023
Today we’re testing Starfield, Bethesda’s new “Skyrim in Space” RPG. We have some cool research tests to talk about performance scaling in the game and a good amount of benchmarks -- at least for something turned around inside of about 16 hours -- for a day-one test. We ran about 16 cards through the benches, ranging from the 10 series to 40 series on NVIDIA and the RX 5000 series to RX 7000 series on AMD. This was a HUGE haul to get the data all done in time for people beginning to plan builds, and keep in mind that we’re actively adding more to our Starfield content. We’ll have some follow-up pieces. But a couple of things: This is an AMD exclusive launch title. Intel seemingly didn’t get any kind of access to build its Arc drivers, and likewise, NVIDIA’s “game-ready” driver appears to be the same (or mostly the same) as its driver prior to this one. It’s likely that there will be further game and driver updates improving performance at this point, so if you’re checking these benchmarks in a year, the scaling may move -- especially for NVIDIA. And Intel. Because, in the latter case, you can’t divide by 0.
Credits
Test Lead, Host, Writing
Steve Burke
Testing, Video Editing
Mike Gaglione
Testing
Jeremy Clayton
Patrick Lathan
Video Production
Vitalii Makhnovets
Writing, Web Editing
Jimmy Thang
Starfield Graphics Card Test Setup & Prep
These used the latest NVIDIA and AMD day-one drivers. Intel isn’t ready yet and the game didn’t launch on Arc, but the company says it’ll be ready for the true launch date of September 6.
There are a lot of ways to test games and there’s a ton of room for differing results based on how the test is handled. Today, we’ll be walking you through some of our research process for determining our methods, then we’ll go over the data we got with those methods. Remember that choices such as disabling FSR, Vsync, and Variable Rate Shading (and dynamic resolution) will impact results compared to tests that might leave them on, so you should look at the numbers largely against themselves and avoid cross-comparing if there are unknown variables in the settings.
Researching Starfield's Graphics Performance
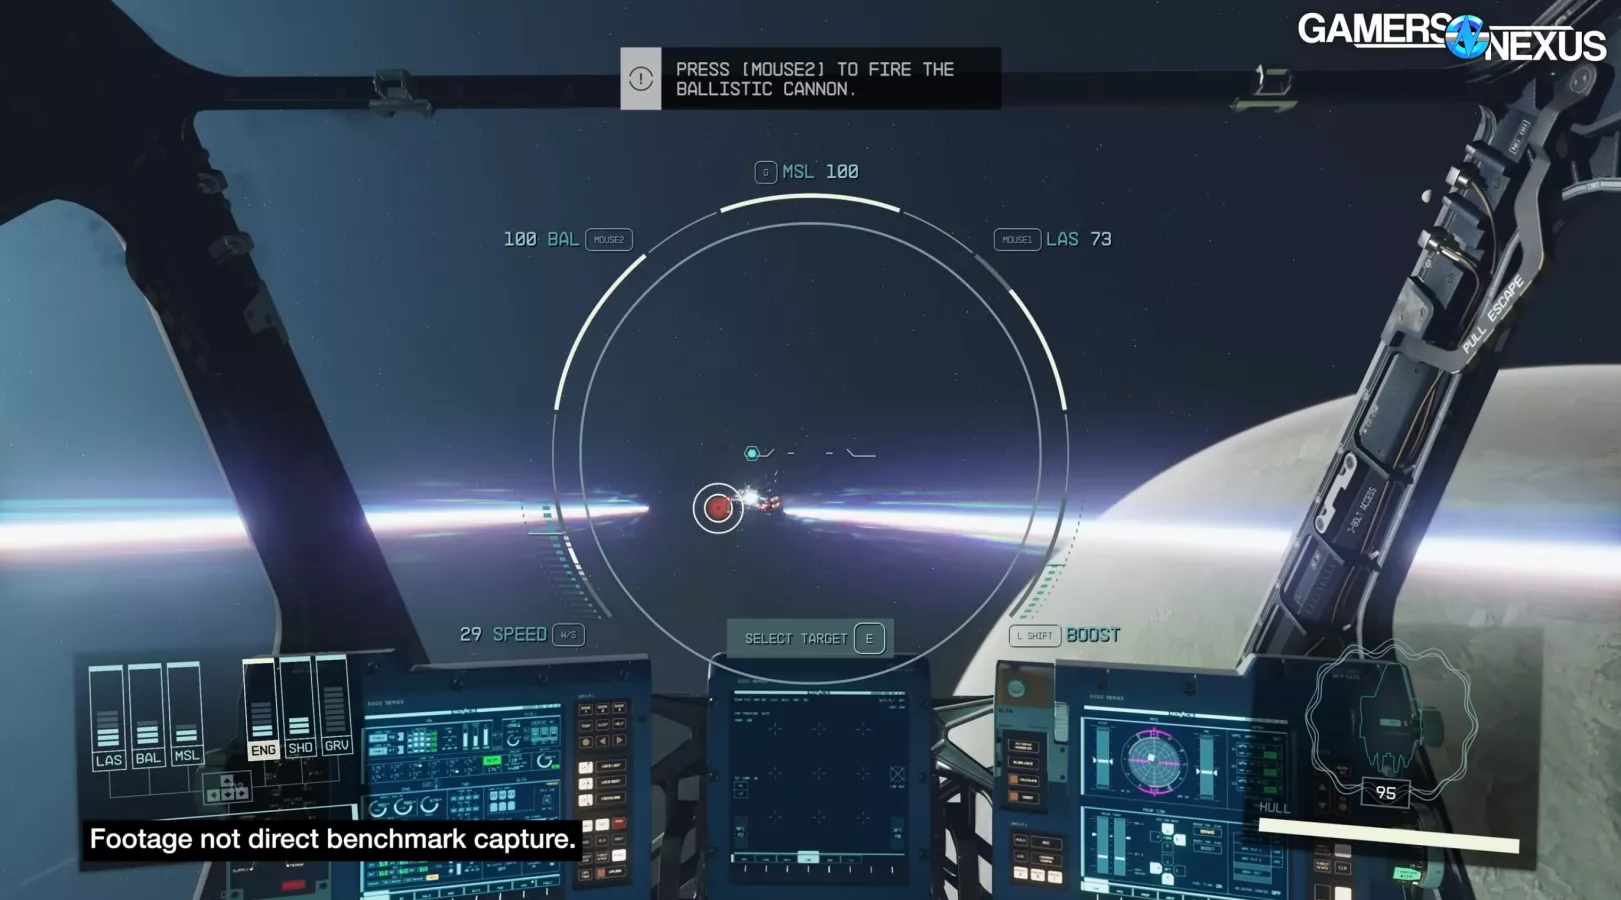
We’ll start with our research for Starfield performance. The research process is an important period where we spend a few hours exploring various types of gameplay and environments to try and get an overall picture for performance, which helps us choose a location for testing. Our goals for finding a test location are to choose something that is closer to a “worst case” while still being a common gameplay scenario.
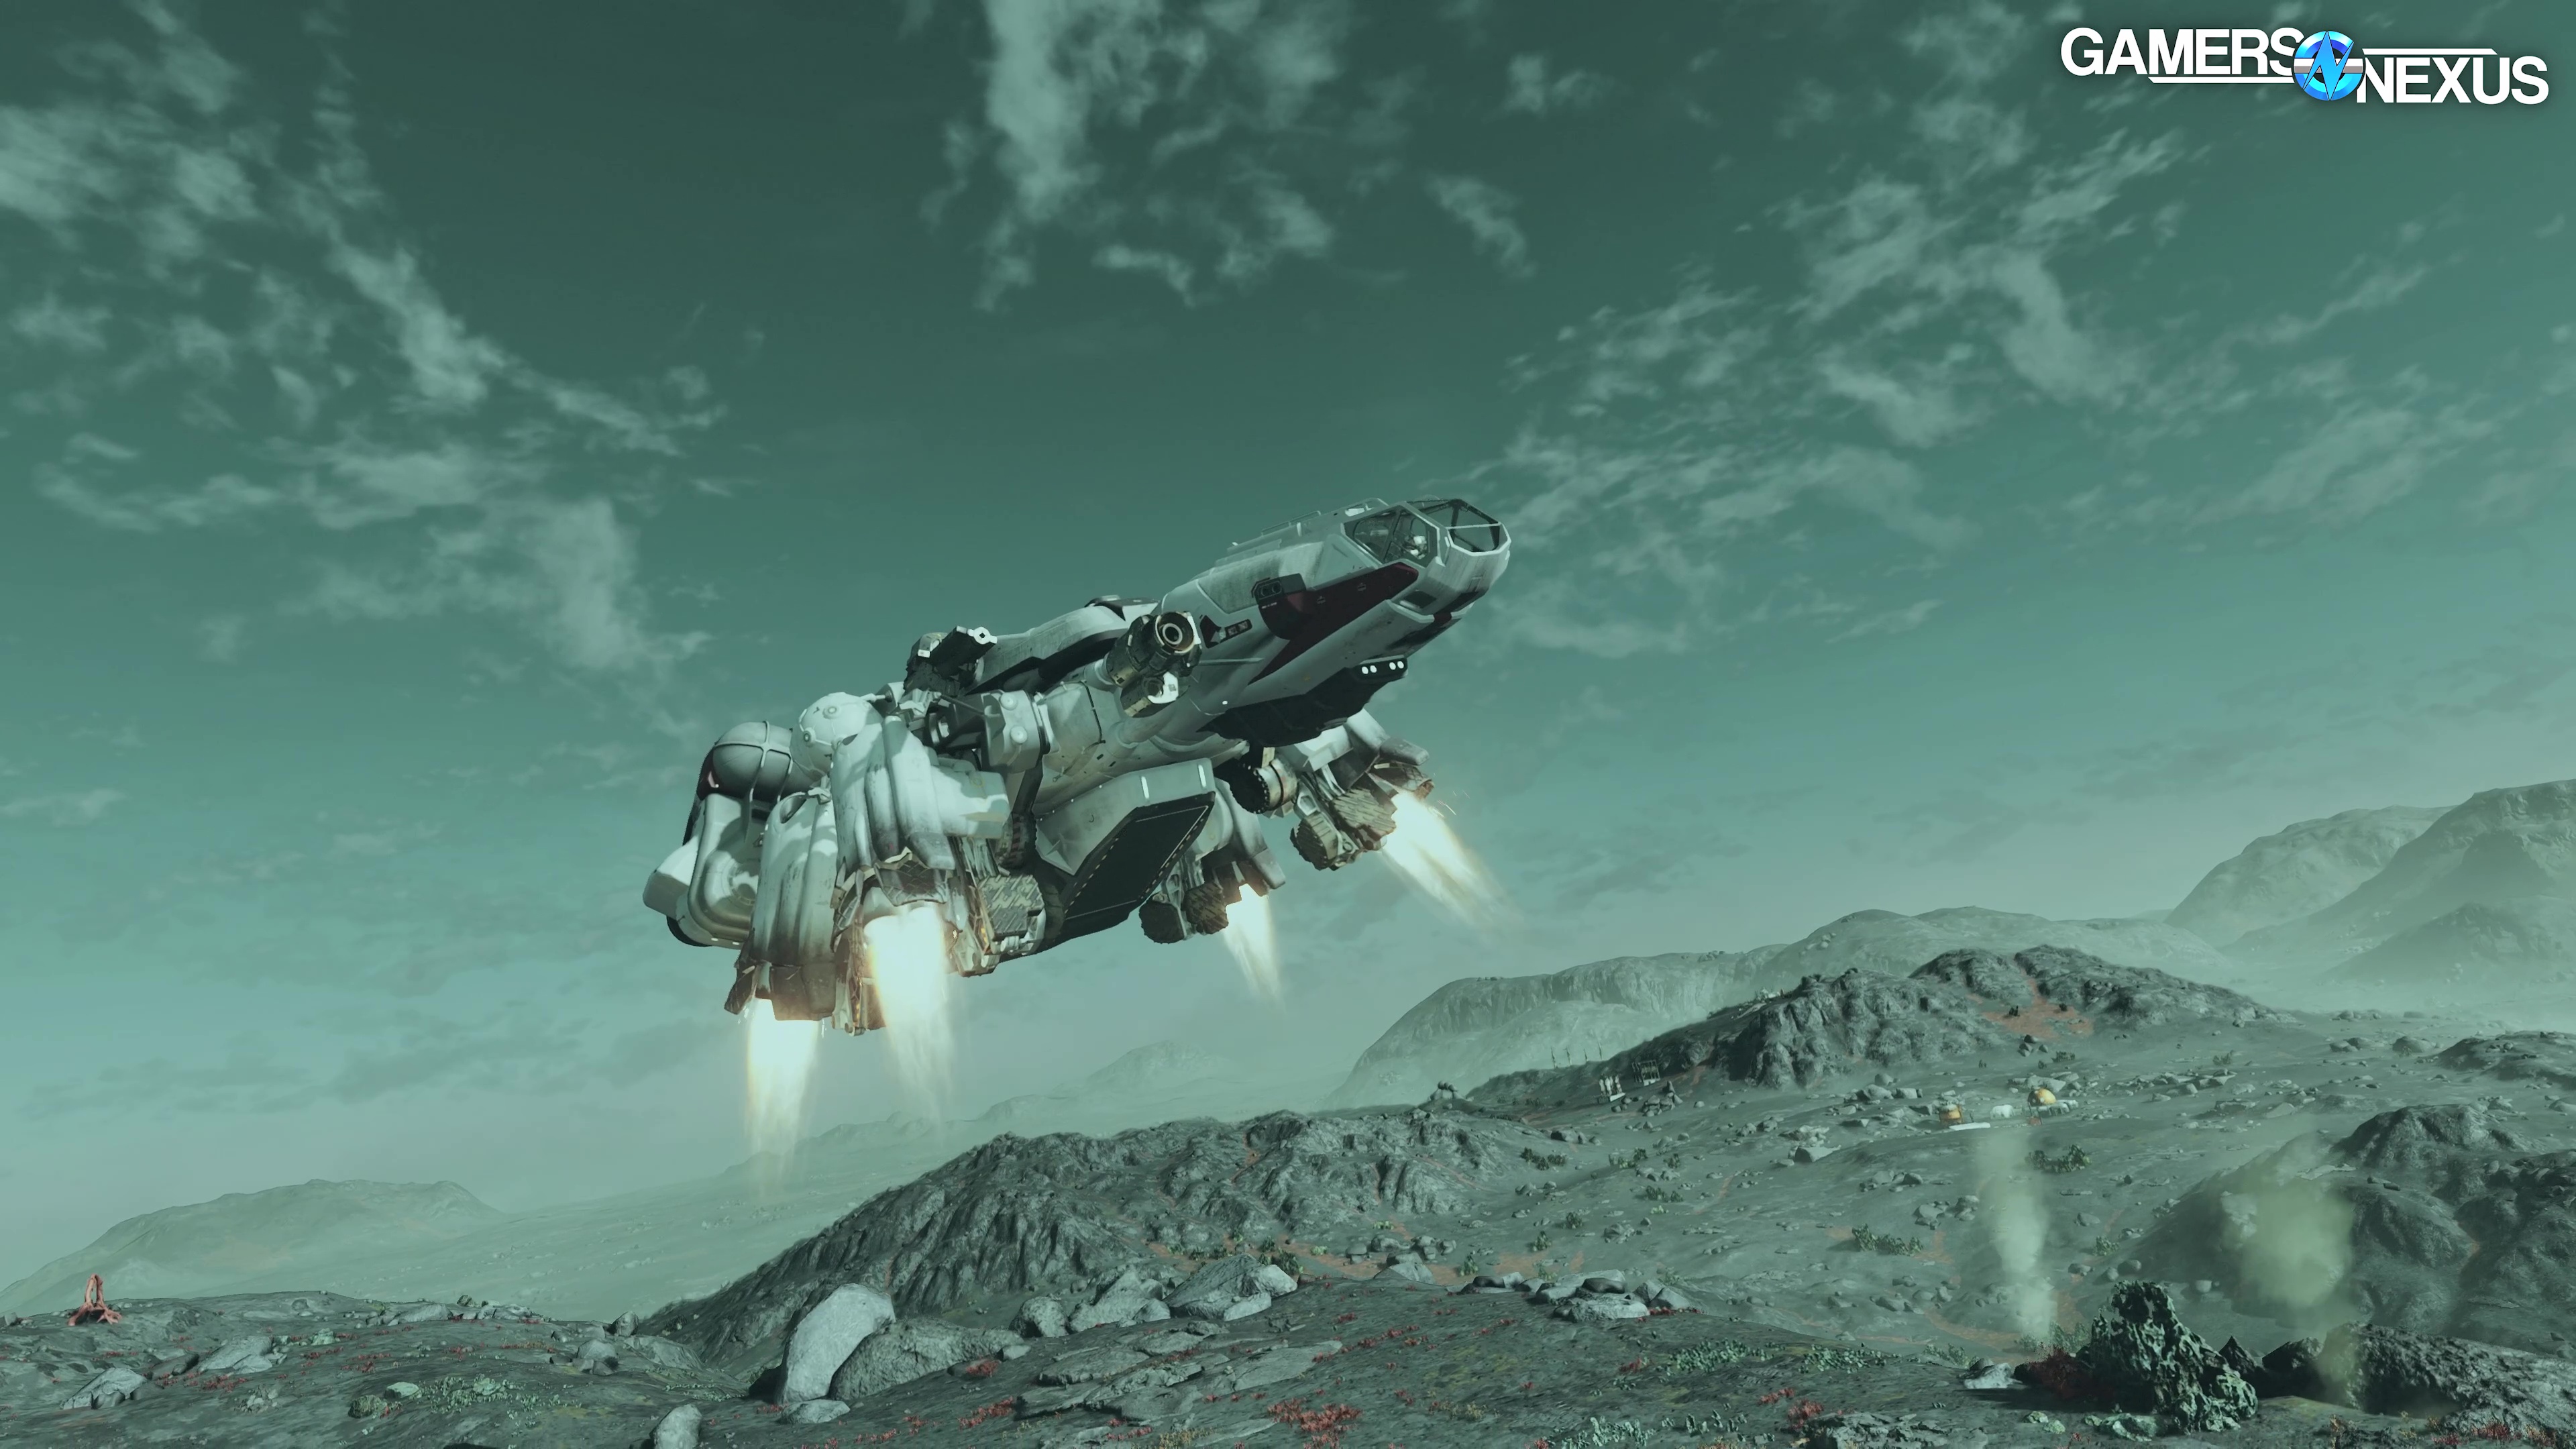
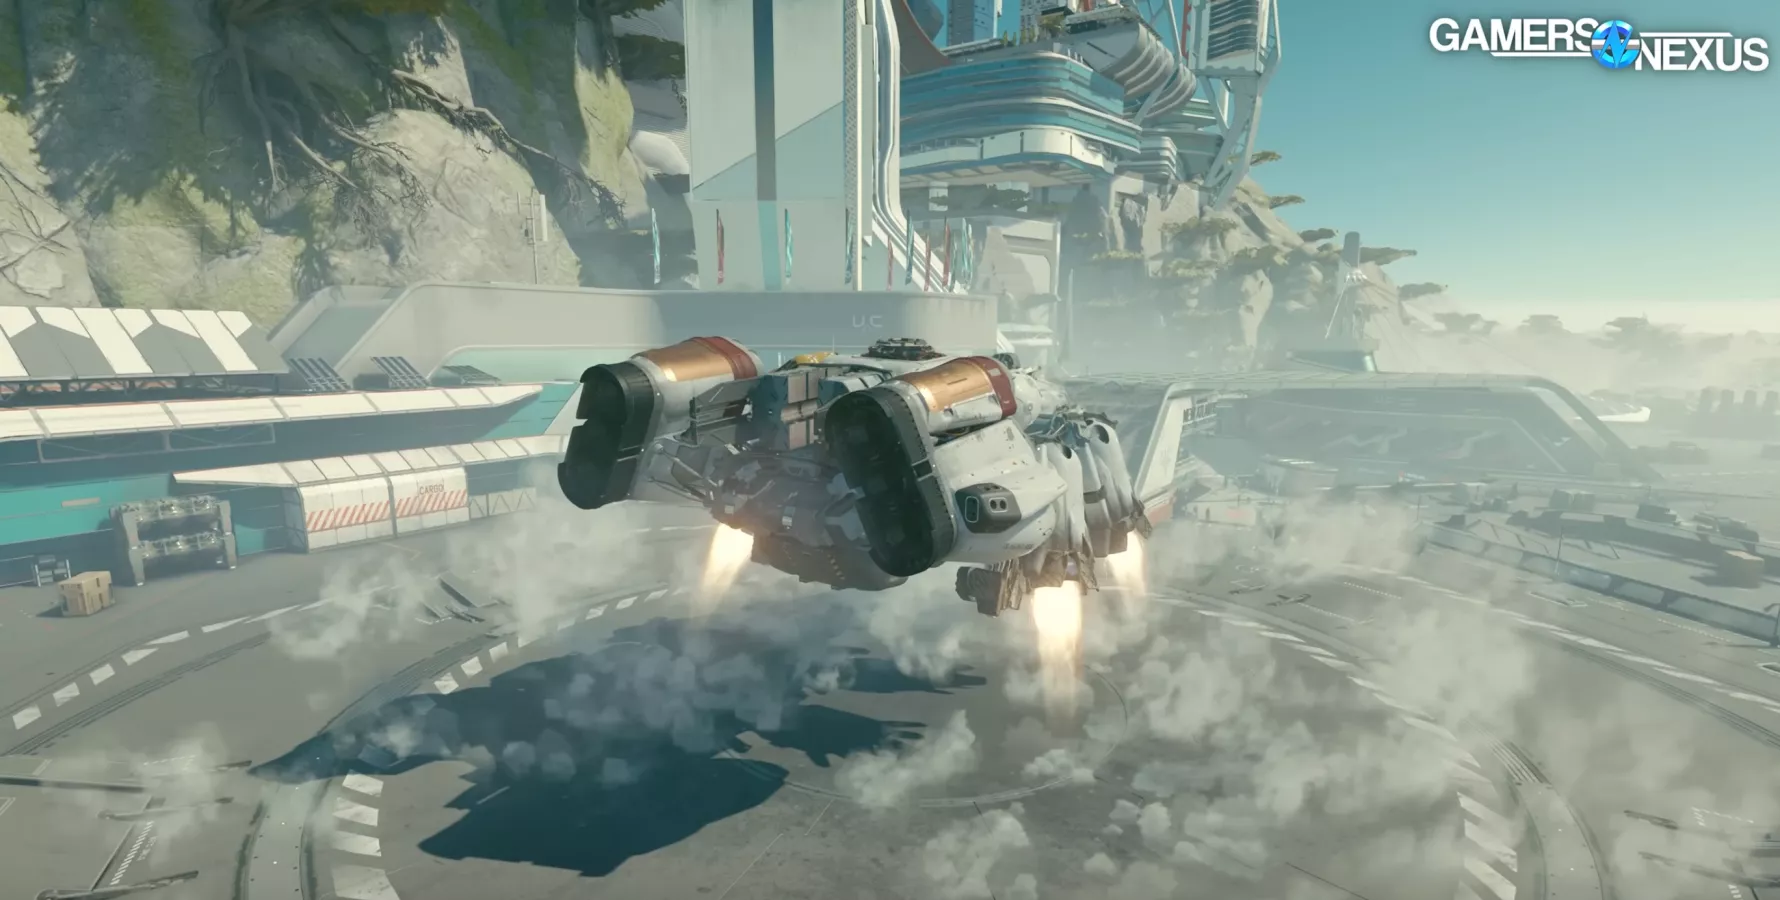
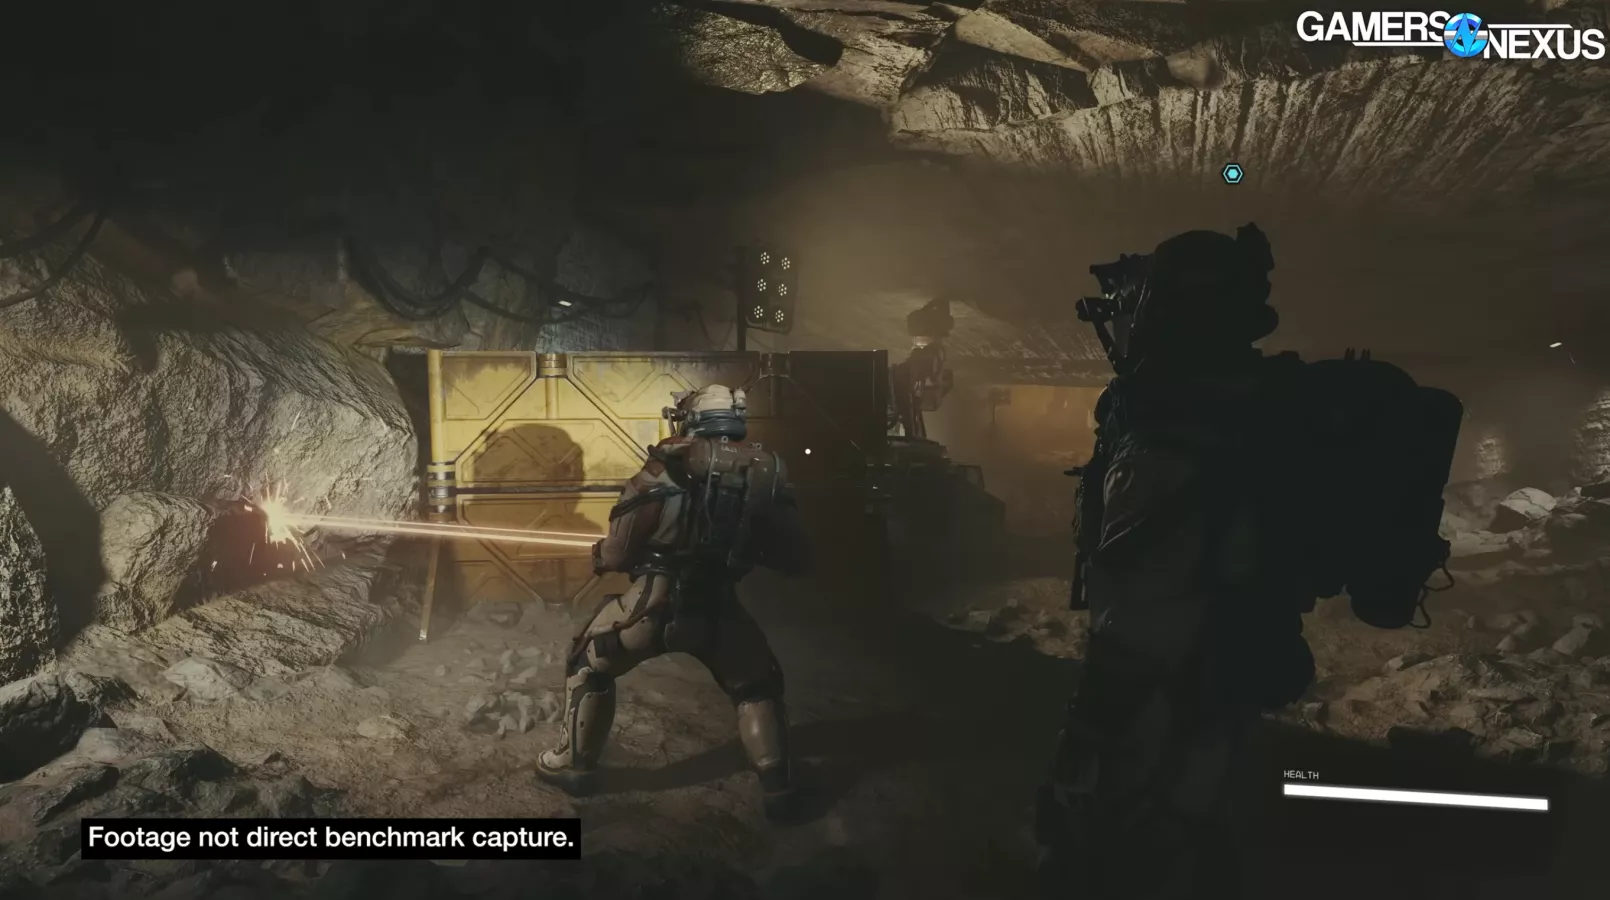
For this process, we captured the frametimes for the first couple hours of play and logged them. This included the tutorial cave, the initial outdoors location on the moon or asteroid or whatever it was, the ship, take-off, space flight, combat on foot and combat in space, Kreet and its indoors research lab, and New Atlantis City. Games are highly variable dependent on location, and choosing a location has all the impact on the results that sets us up for long-term benchmarking.
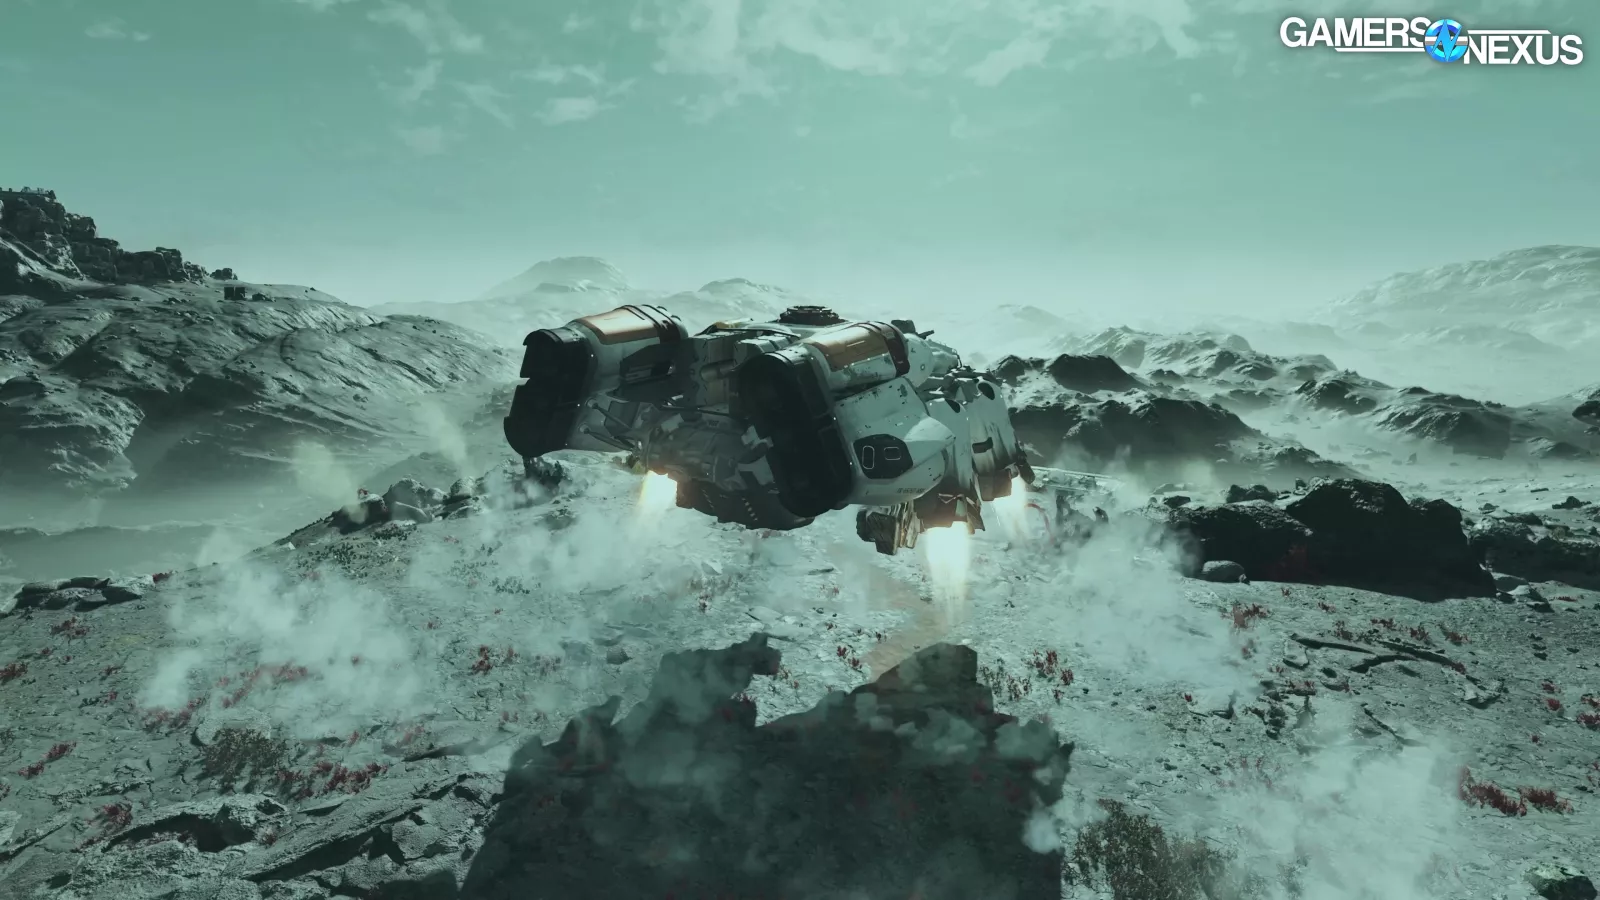
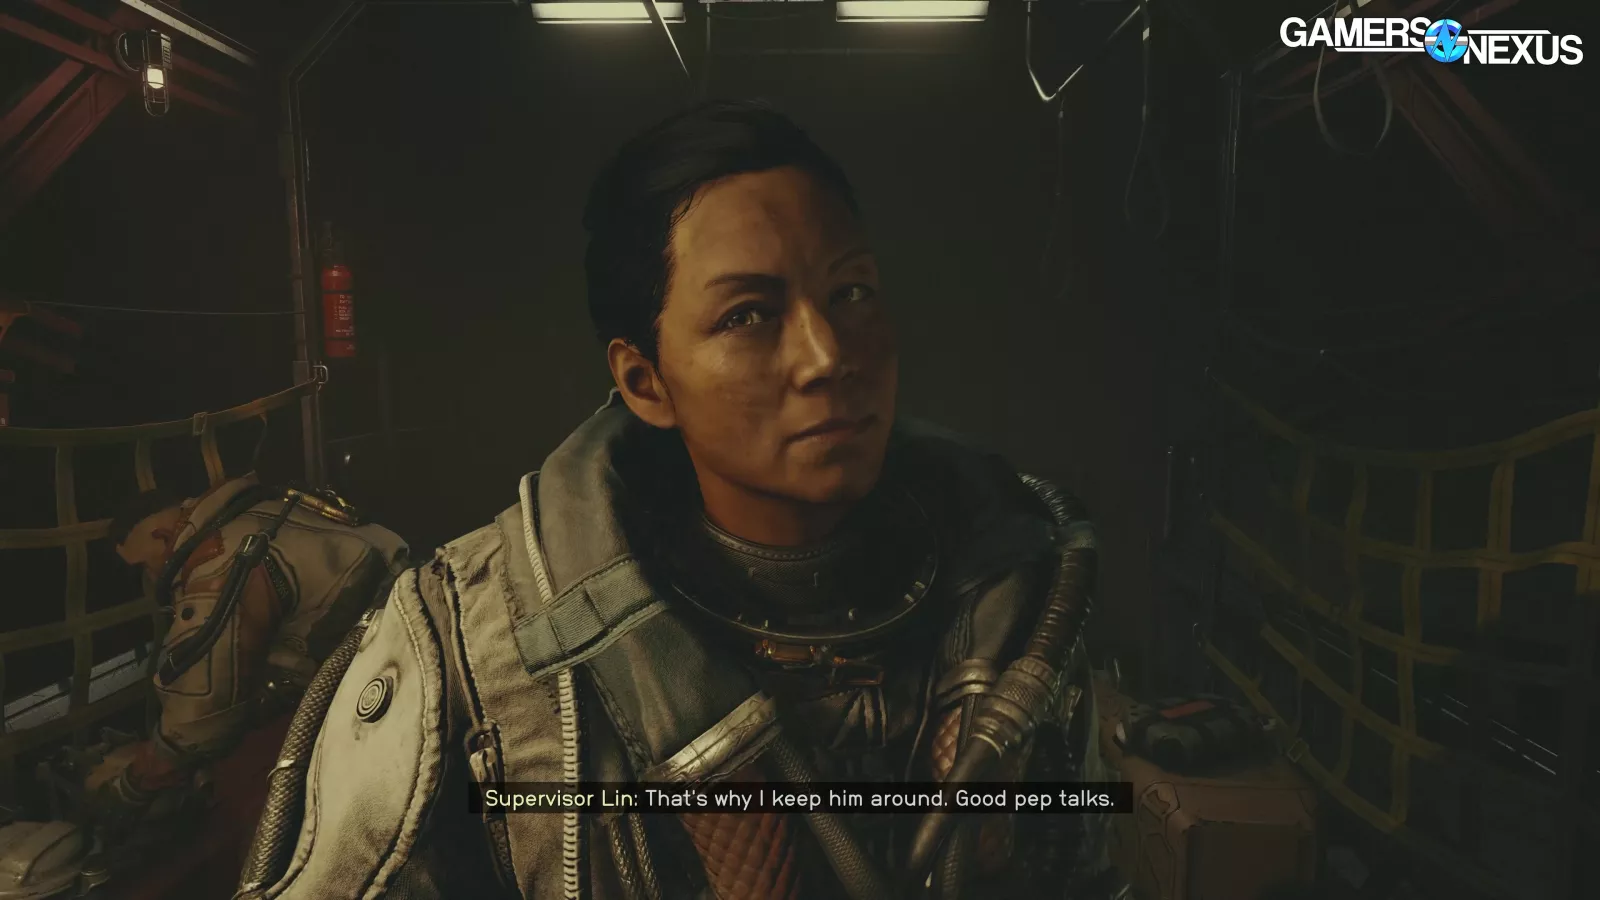
Starfield Screenshots Gallery
Below are some screenshots from our research areas. You can check the video embed above for more individual detail.


GN 2022-2023 GPU Test Bench Specs
| Part | Component | Provided By |
| CPU | Intel Core i7-12700KF Overclocked (4.9GHz P-Cores, 3.9GHz E-Cores) | Bought by GN |
| Motherboard | MSI Z690 Unify | MSI |
| RAM | DDR5-6000 G.Skill Trident Z (manually tightened timings) | G.Skill |
| Cooler | Arctic Liquid Freezer II 360 @ 100% Fan Speed | Bought by GN |
| PSU | EVGA 1600W T2 Supernova Corsair AX1600i | EVGA Corsair |
| OS | Windows 11 | Bought by GN |
This research was captured on a 4060 Ti at 1440p/high. We want to emphasize that the settings and card are basically totally irrelevant for the research other than one important thing: We need to make sure we’re GPU-bound so that we can determine an area that’ll show scaling. For this, we choose settings that should typically put us closer to 50-60FPS so we still have range above and below the research results.
Starfield Graphics Performance Testing
Here’s the chart. We have FSR, upscaling, dynamic resolution, and variable rate shading all disabled here.
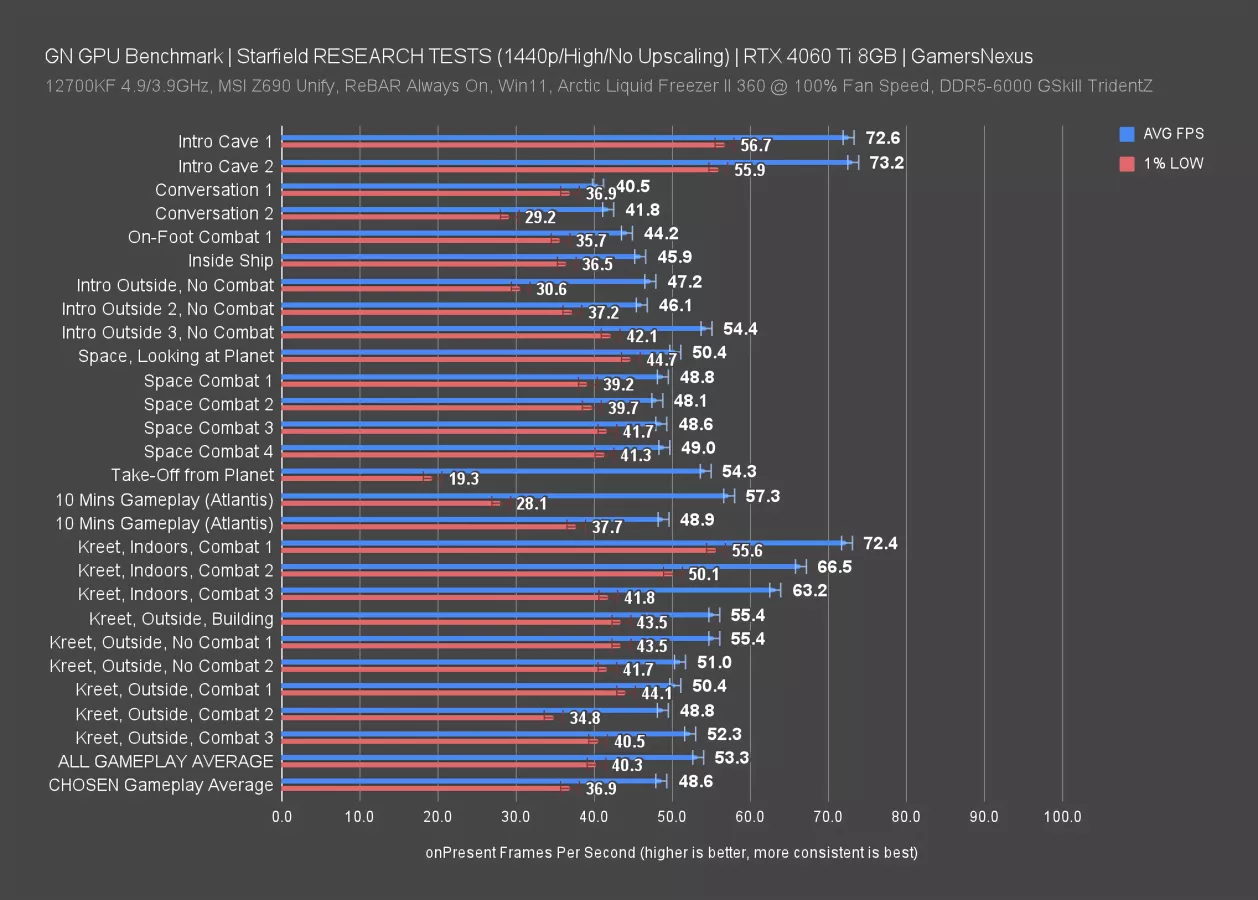
The 4060 Ti at 1440p/high held in the 70s in a few locations -- notably, inside one of the areas of the early cave and inside the lab on Kreet. We observed in the 40s FPS AVG for initial conversations where high poly detail is loaded-in. Outdoors roaming ranged, but we saw mostly in the 40s. Space combat and space flight had us typically around 50FPS, +/- a bit. Take-off had a severe frametime spike a couple of times, but as this is moved to a hands-off animation, that seems less relevant.
We also captured two sets of 10 minutes of gameplay in New Atlantis City. This is useful to give us a fuller picture of averaged frames across large parts of the city, with loading screens removed from the numbers. These should also be considered fairly representative to play.
Sparing you all the details of each of these numbers individually, you’ll notice two important ones at the bottom: ALL GAMEPLAY AVERAGE is the average FPS and 1% of each number above it, producing a common framerate of 53 across all scenarios, including averaging for the tests in the 70s. Once we had this number, we chose an area of New Atlantis City that was fairly close but leaned a little heavy, that way we have a representative sample of a higher load city scenario. The end result was a 48.6 FPS AVG here. Remember that it’s possible there are areas later in the game that are heavier, but given that we captured a few hours of play and came up with these numbers, we think the test area selected is a safe lower-end representation for high-density areas like cities.
We tested in the Residential District of the city and had a fixed walking path. We did a number of one-off tests in this area, but before we get into the comparative charts, let’s look at some quick settings research.
One-Off Settings Impact
As the next part of our research process, we tested each preset (but with FSR disabled, upscaling off, and variable rate shading off) in the same location, using the same test processes, on the 4060 Ti at 1080p. Again, we’ll get to all the cards -- but we needed this for a rapid understanding.

Here, we found that the RTX 4060 Ti at 1080p held an average framerate of 53FPS at ultra, improving by 17% by dropping to high, now at 61FPS AVG. Cutting that to medium gave us an additional 16% framerate, and cutting to low boosted us to 82.6FPS, or another 16%. Bethesda has remarkably consistent scaling from one preset to the next here, making it seem very intentional how they assigned the settings. It’s about a 10FPS improvement on this particular card for each graphics setting decrease.
FPS over Time (Gameplay Observations)
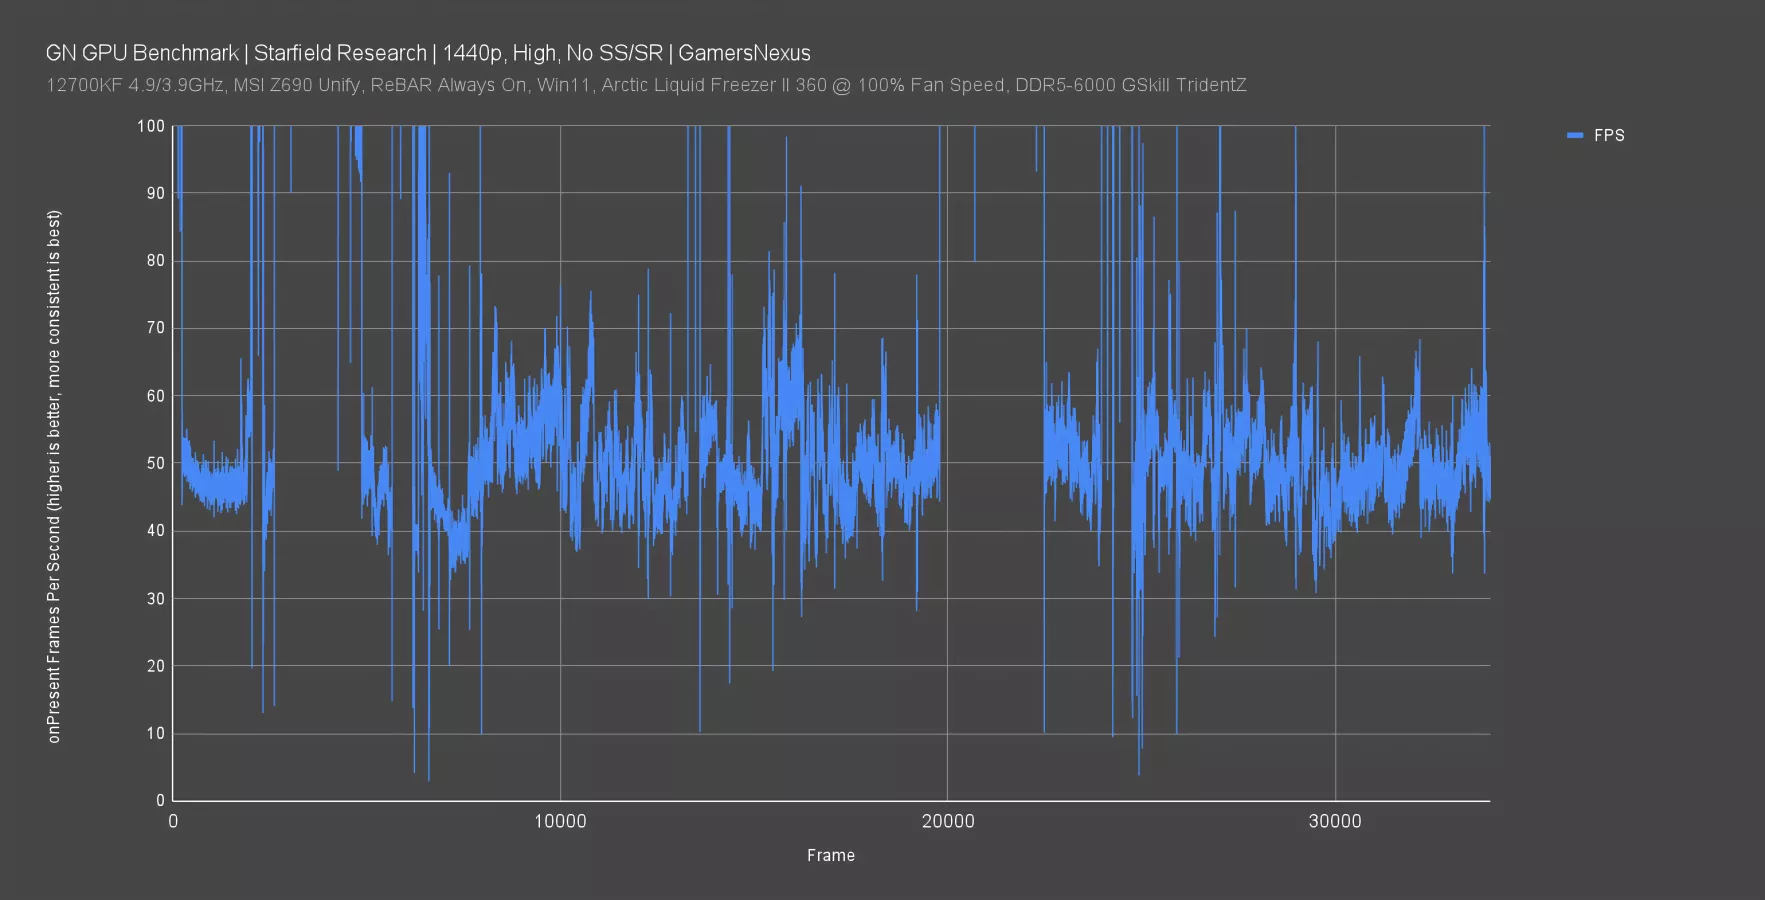
One final research chart: This isn’t a frametime chart, but rather just an FPS over time chart. We’re plotting the framerate as we played through various parts of the game. This is 34,000 frames of data. It’s about 10 minutes of gameplay. We truncated the chart to 100FPS -- the spikes above that go to over 200FPS and are just when we were in menus, inventory, or loading screens. For the rest, you can see the range was typically 40 to 70, with most of the numbers clustering around 50-60 FPS AVG on this device and with these settings. The game has some plunges, but is otherwise relatively consistent.
Standard Deviation
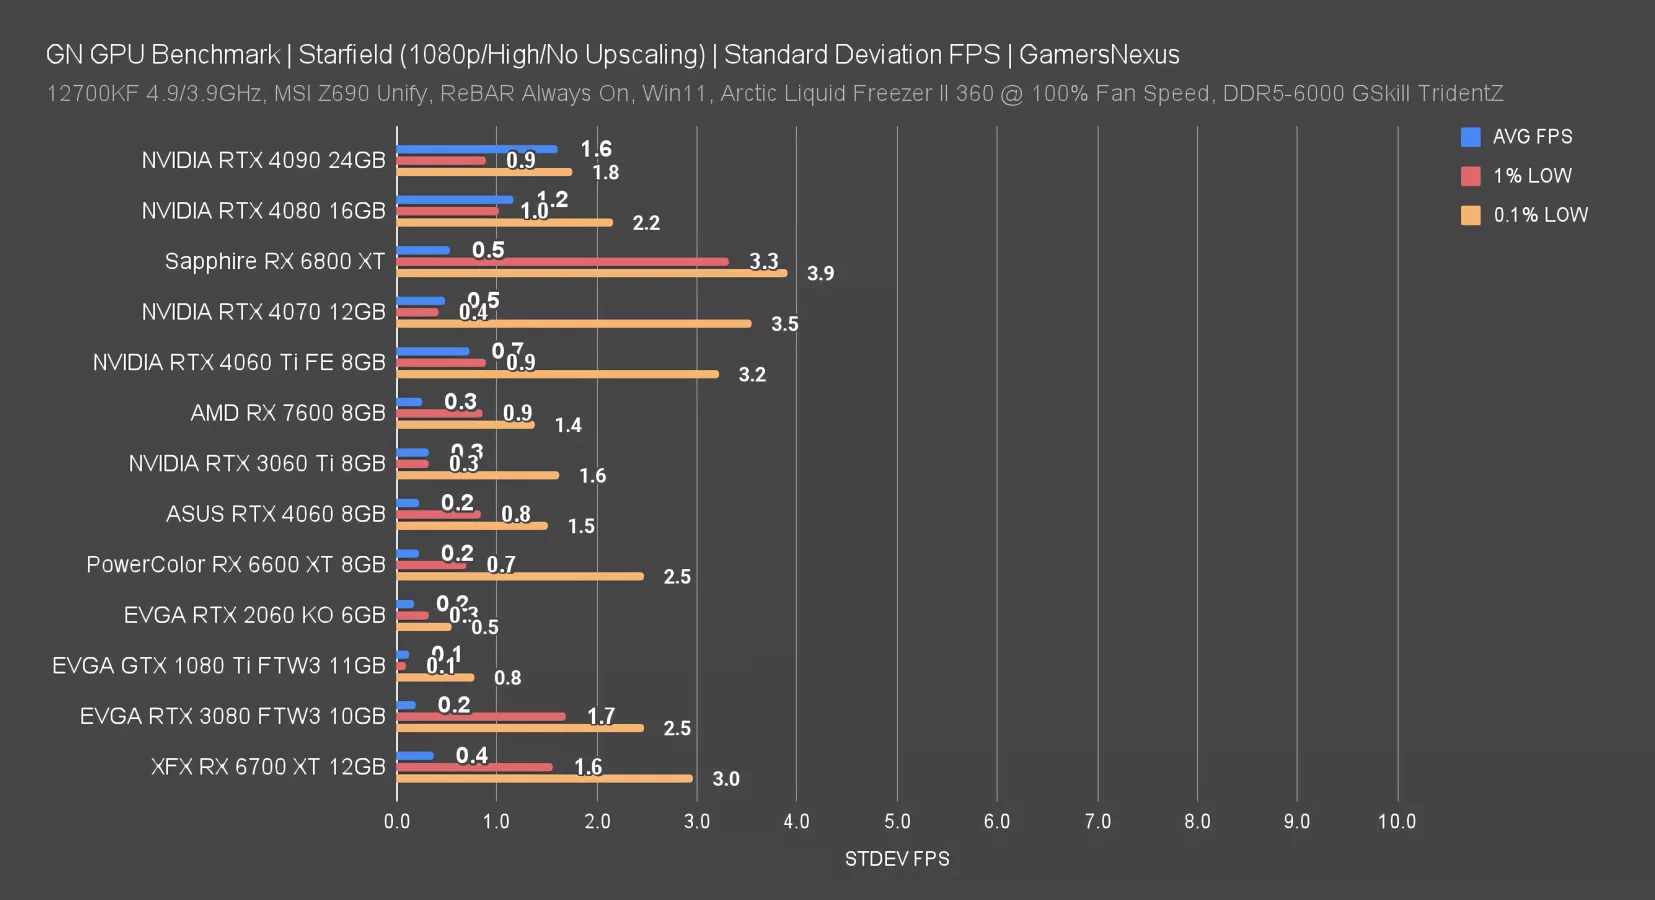
Finally, as we get into our first and densest chart, we’ll look at run-to-run consistency with standard deviation. This is not an indicator of the GPU quality, but rather the standard deviation for that card’s test passes. We have a minimum of 4 passes, sometimes more. Each pass is an average of thousands of frames of data.
Generally speaking, we were within about 1FPS standard deviation run-to-run. Lows are always wider here since there’s less data to work with by their nature. Averages are extremely consistent run-to-run, making this, overall, relatively easy to parse.
Starfield Graphics Card Benchmarks

Starfield 1080p High GPU Comparison
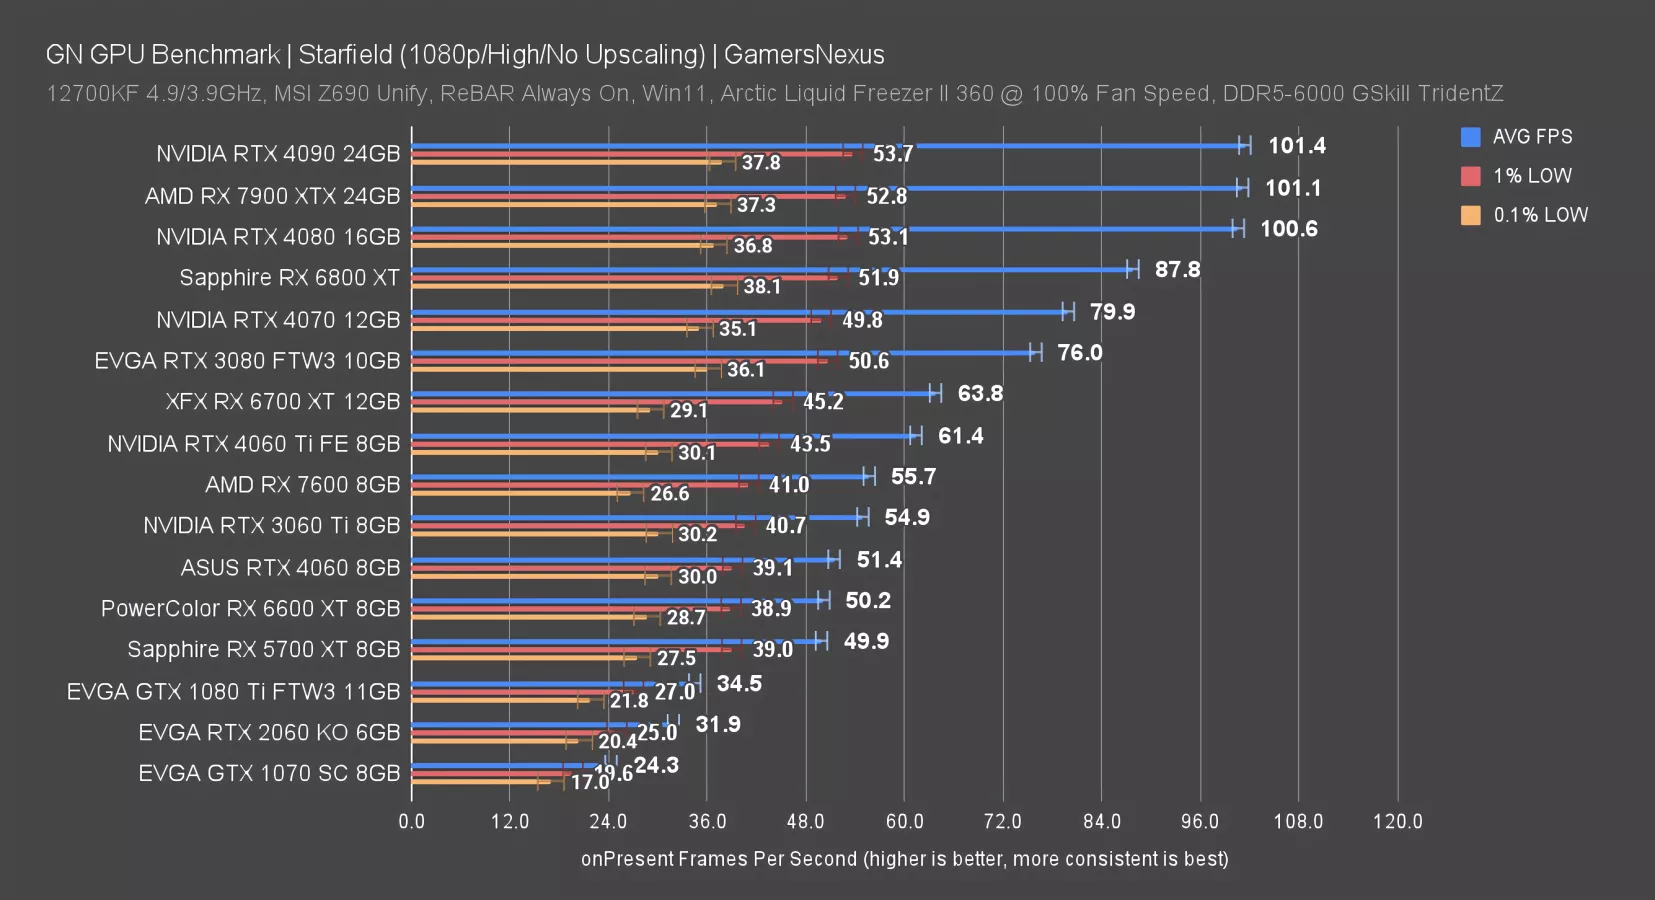
Up first, our 1080p/high chart. In this one, the RTX 4090, RX 7900 XTX, and RTX 4080 are all bottlenecked. We can ignore these results as they didn’t have enough scaling room -- we’d need a higher-end CPU or an area of the game with less CPU load.
Shifting attention to unbound comparisons, the 6800 XT remains a strong modern option and sits atop the 4070, with the 6700 XT technically leading the 4060 Ti, but being functionally equivalent. The RTX 3080 remains completely viable here as well. The 3060 Ti and 4060 Ti have more of a gap here than they have at higher resolutions, but that’s behavior we already saw in our 4060 Ti review -- they tend to converge, and the last-gen option can even surpass the 4060 Ti in some games at higher resolutions.
The RX 7600 and RTX 4060 are roughly tied in average framerate, with the 7600 having a technical lead -- and a price advantage right now.
As for older hardware, like the 1070 and 2060, we’d have to turn to lower settings.
Starfield 1080p Medium GPU Comparison
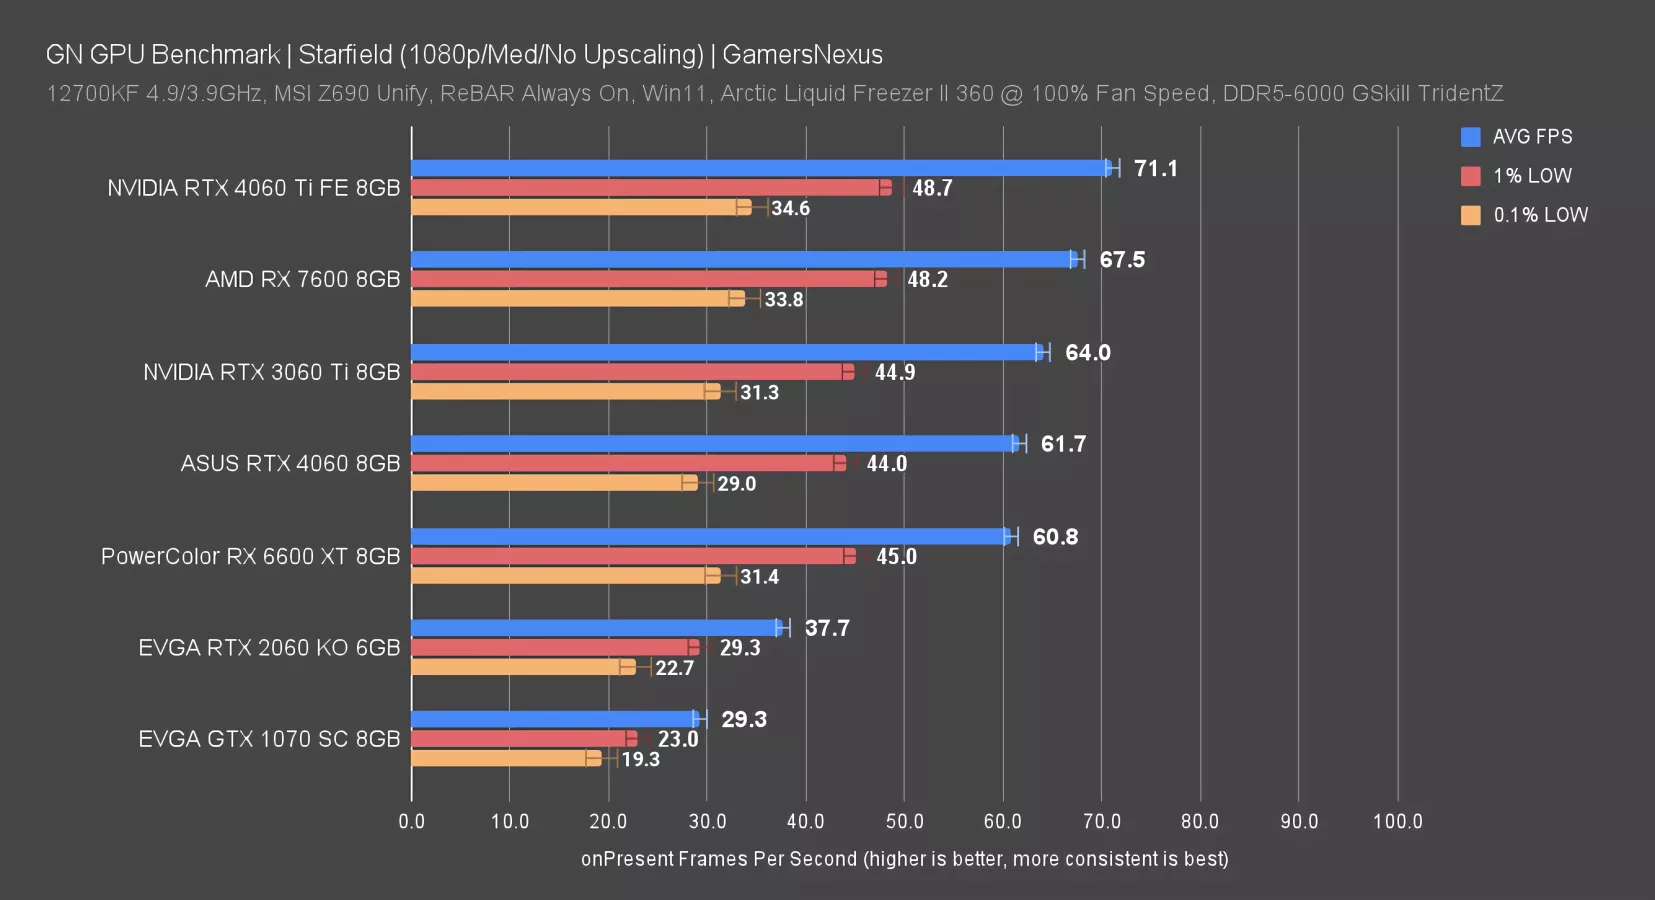
We didn’t test many cards at 1080p/medium, but here are the ones we did. The movement in absolute FPS isn’t much. The 1070 and 2060 are benefited, but not enough to move the needle without other settings reductions. The RX 7600 overall does well relative to the rest of this group, especially with its newer sub-$250 price we’ve been seeing around.
Starfield 1080p Low GPU Comparison
If you're wondering whether your lower-end video card can play Starfield and handle it, here are some low settings tests.
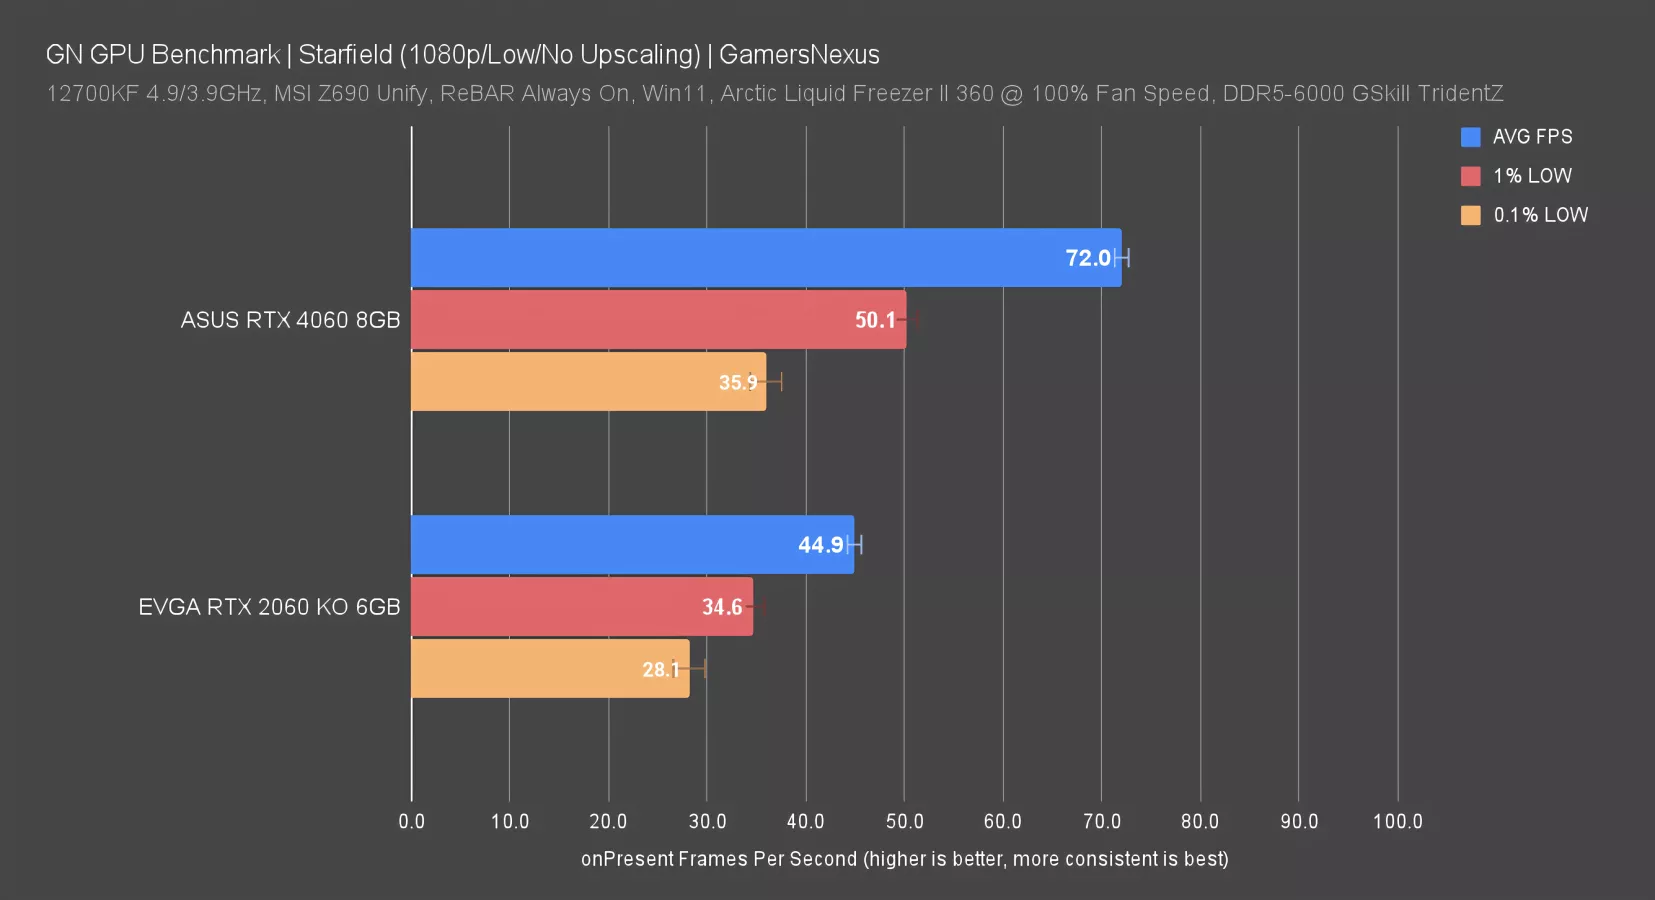
We only ran 2 cards at 1080p/Low. Here are the results. The 4060 gained about 10FPS against its test at medium settings, with the 2060 gaining a little less than that.
Starfield 1440p High GPU Comparison
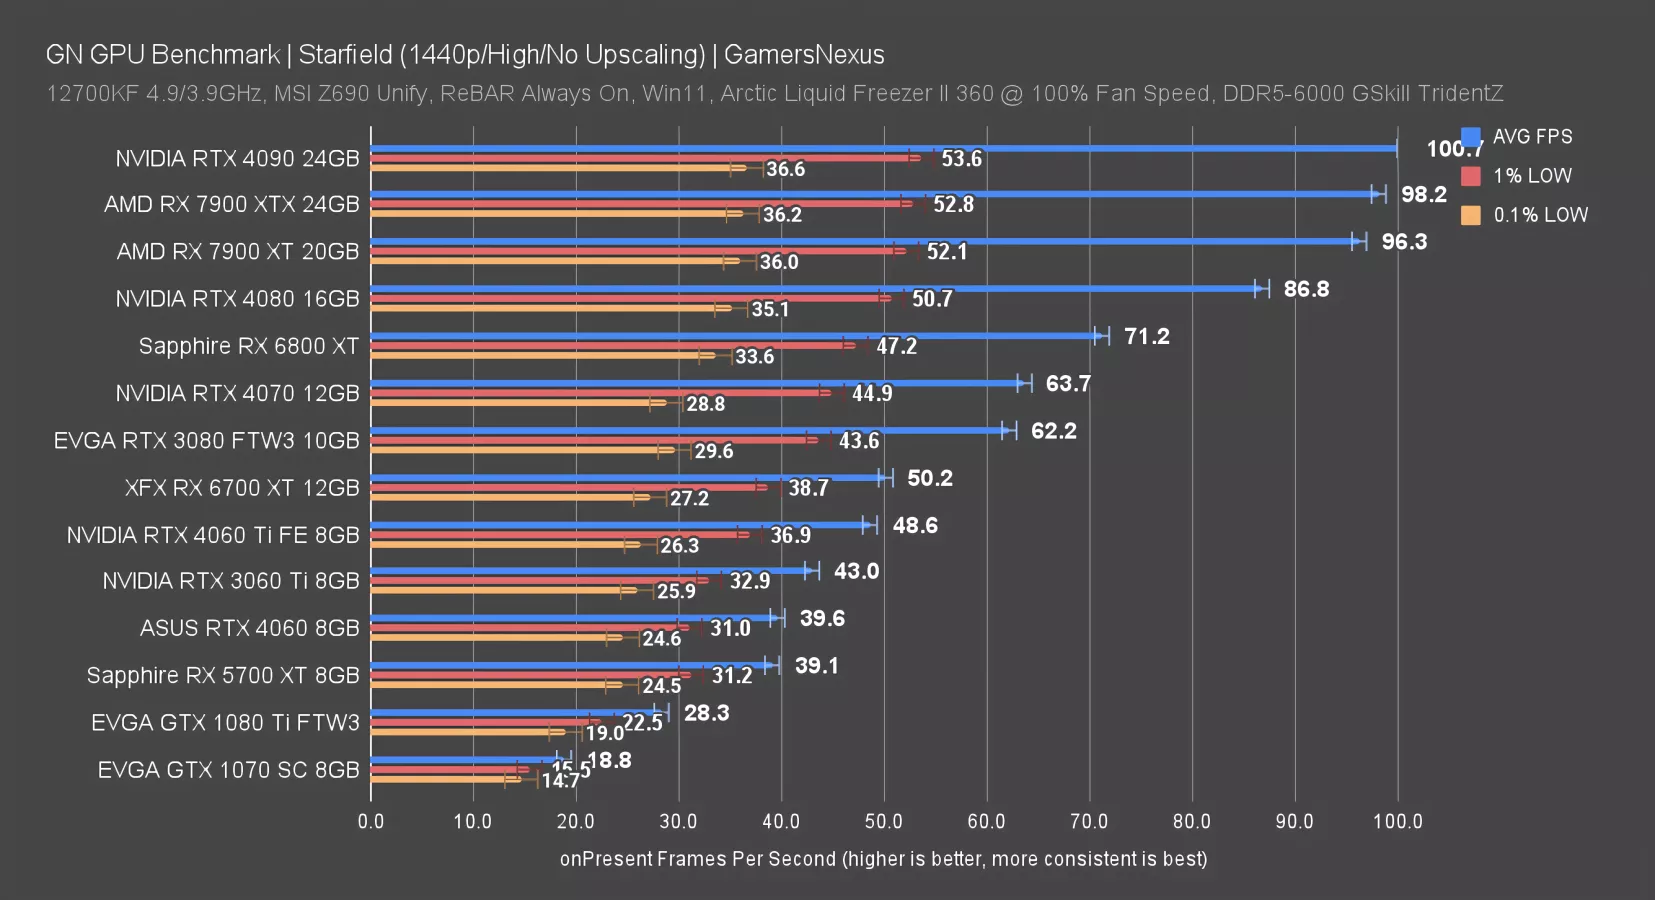
Moving to 1440p and high settings, the top remains bottlenecked -- although it’s reducing -- and the equivalent FPS between two resolutions for these top 3 cards indicates that bottleneck. The more relevant comparisons happen below the 95+ range.
The 4070 and 3080 are about equal here, with the 4060 Ti and 6700 XT also close in rank. None of the lows on this chart jump out to us as particularly bad. In general, they’re not keeping pace with the average as well as we’d like (and had seen in other tests), but they’re consistently low across all devices.
Starfield 4K High GPU Comparison
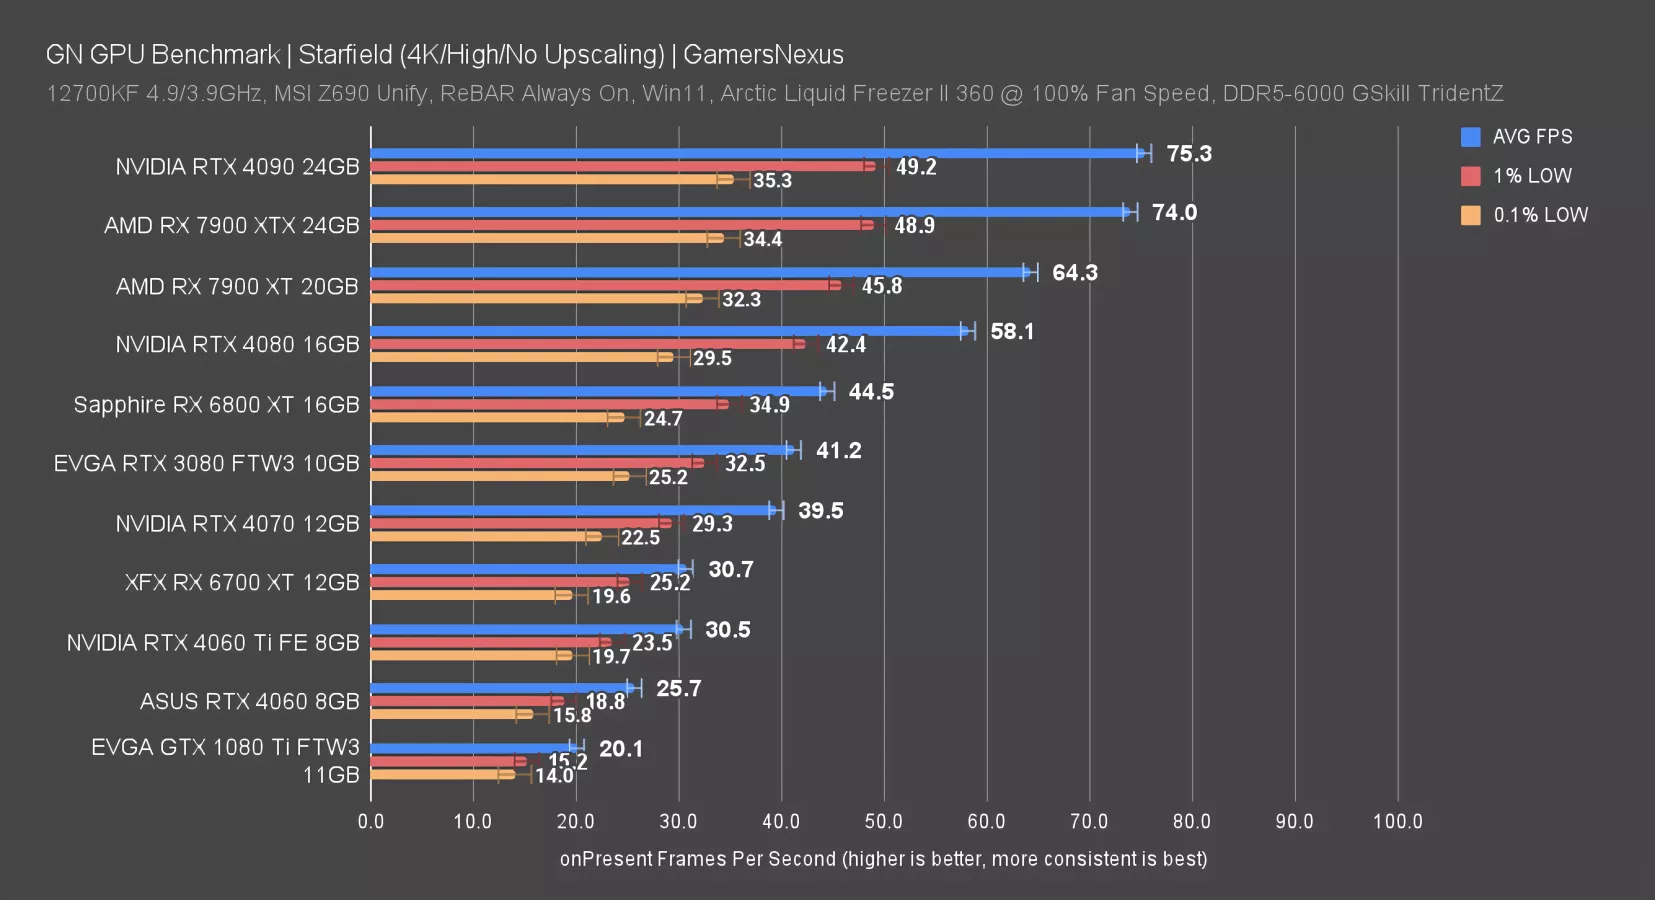
We’re on to 4K/high next. We didn’t do as many tests on this as the prior settings due to the intensity of the configuration.
The RTX 4090 leads the charts by a technicality, although in reality, it’s tied with the 7900 XTX. They’re within run-to-run variance of each other for average, 1%, and 0.1% lows. The 7900 XT manages 87% of the performance of the 7900 XTX, at 64FPS AVG. The RTX 4080 is just behind that, at 58FPS AVG. That means the gap between the 4080 and 4090 is 30% here. That’s about the same as we’ve seen in other games. The 3080 is also near its usual distance from the 4090, although a little higher than typically: It allows the 4090 a little over an 80% lead.
As for all these cards under the RTX 4080, remember that we’re (1) at 4K, and (2) establishing scaling in a relative sense. You could reduce settings or add upscaling and increase framerate to good playability on something like the 6800 XT or 3080 -- and with FSR -- even lower than that. But for testing purposes, we’re showing the ranking of the cards relative to each other.
The 1080 Ti was once among the few early cards that could really handle 4K games, but for this one, it’s just not able to do it without some external assistance.
Starfield 4K Ultra Settings GPU Benchmarks

4K ultra is pretty simple. We don’t have many cards that can run this well, so it’s a limited list. The RTX 4090 ran 4K/ultra without upscaling and in the city at 68 FPS AVG, with lows paced roughly proportionally behind. That has the 7900 XTX and 4090 about tied, with no meaningful difference between them in any of the 3 reported metrics.
The 7900 XT allows the 7900 XTX a lead of 14%, while the XT non-second-X leads the RTX 4080 by about 14%. The 4080 then leads the 6800 XT by 26%.
Even at the 6800 XT level, you could still run at 4K/ultra with some use of FSR and upscaling. That’s an option here. It’s not a particularly great experience at 40FPS, but dropping settings or adding FSR would get it the rest of the way there.
Conclusion: The Best Gaming GPUs for Starfield
Starfield is a demanding game, both from a GPU and CPU perspective. On the graphics side, AMD’s performance has been very competitive here in some cases. That’s not surprising given the “exclusive” partnership. Intel stated publicly that it’ll have drivers ready next week for the public launch, so we’ll have to revisit then. NVIDIA likely will also have driver updates.
We plan on retesting many of these cards on the public launch to see how things change.
As for the game itself, our higher-end cards were bottlenecked on the lower resolutions, but outside of the top cut of cards, we noticed older hardware struggling. This is an instance where you will want FSR -- unfortunately not version 3 -- for any help you can get on hardware predating the last generation or two.
Let's look into which video cards are best for Starfield at different price points and budgets:
Best $200-$300 graphics cards for Starfield
For something $200-$300 for Starfield, the AMD RX 7600 is a strong performer here. The RTX 4060 would be the NVIDIA alternative if you'd prefer NVIDIA features for other games; however, in our Starfield testing, the RX 7600 leads the 4060 by 8.4% and costs less.
Best $300-$400 graphics cards for Starfield
We’re targeting a native 60FPS as our north star (without any upscaling – check out our Starfield Graphics Optimization Guide for tips on that end) while taking into account price. Here, we recommend the RX 6700 XT. Our XFX RX 6700 XT card was able to garner 63.8 AVG FPS on the game’s high preset at 1080p. The most affordable variant we found online currently retails for $330. If you’re looking for an NVIDIA card because you prefer that ecosystem, then the NVIDIA RTX 4060 Ti is unfortunately the closest competitor -- but it has many of its own downsides (most of which are related to value). We generally recommend avoiding the 4060 Ti, but especially the 16GB variant. It won't gain you anything meaningful, as the card is too constrained on its core to benefit from the extra memory, and the price hike is huge by comparison. The $380 pricing of the 4060 Ti makes it untenable against alternatives here. If you're OK with used hardware, you should seriously consider an RTX 3080 or RX 6800 XT -- although those push up into the next price category. Assuming you want NVIDIA's solutions or might want to play NVIDIA-favored titles, like Cyberpunk 2077: Phantom Liberty, the RTX 4070 or RTX 4060 are more competitive options.
$500-$600 graphics card for Starfield
If you’re looking to game at 1440p, you'll most likely have to pony-up between $500-$600. The card that makes the most sense in this price range is the RX 6800 XT. Our Sapphire card managed to achieve a 71.2 AVG FPS on the high preset. Unfortunately, 6800 XT cards are becoming rare -- although there are still some well-priced RX 6800 non-XT cards on Newegg. At $500, the 6800 XT model slightly outperformed the NVIDIA RTX 4070 12GB for $50 less. The 4070 performed on par with our EVGA RTX 3080, so those would be a good second-hand option.
$800+ graphics card for Starfield
If you’re looking to game at native 4K, options are limited without FSR or DLSS. If you're open to either of those technologies, well, technically, it's not actually 4K anymore -- but they'd expand your options to cheaper cards.
Here, our recommendation for native is the AMD RX 7900 XT. It garnered a 64.3 FPS AVG on the high preset. At $800, the 7900 XT outperforms its closest rival, the RTX 4080. The AMD card was faster than it by 10.7%. It also costs $400 less at the time of writing. Even at 4K ultra, the card performs well, netting a 58.1 AVG. If you did want above 60FPS performance at 4K ultra, you’ll want to turn to either the RX 7900 XTX or the RTX 4090. Those cards got 66AVG FPS and 68.4 AVG FPS, respectively. The RX 7900 XTX is definitely the better value here at $950 compared to the 4090's steeper $1,730 price tag.