This first revisit to Ryzen’s performance comes earlier than most, given the tempestuous environment surrounding AMD’s latest uarch. In the past weeks, we’ve seen claims that Windows updates promise a significant boon to Ryzen performance, as has also been said of memory overclocking, and we were previously instructed that EFI updates alone should bolster performance. Perhaps not unrelated, game updates to major titles could have potentially impacted performance, amounting to a significant number of variables for a revisit.
Today’s content piece aims to isolate each of these items as much as reasonable – not all can be isolated, like game updates – to better determine the performance impact from the individual changes and updates. We’ll then progress cumulatively through charts as updates are applied. Our final set of charts will contain Windows version bxxx.970, version 1002 EFI on the CH6, and memory overclocking efforts.
Before Starting: Previous Ryzen Content
Just to catch everyone up to speed, here are our recent Ryzen content pieces:
- AMD R7 1700 Review: Ryzen’s Champion
- AMD R7 1700X Review: Odd One Out
- Just Research: Ryzen Clock Behavior in Performance vs. Balanced & Board FPS
- AMD’s Statements on Temperature, Windows Scheduler, & SMT
- AMD R7 1700 SMT Off + Overclock Benchmarks
- AMD R7 1800X Review
Today's video, if you prefer:
Testing Methods
For today, we’ll mostly be defining the test procedure within each benchmark section, as there are enough changes from one test to the next that it makes more sense from a readability / flow standpoint. Our focus here is on the 1700X, despite our firm belief that the 1700 is the best chip, but we also have R7 1700 benchmarking in the Windows Update section.
The reason for loading the 1700X with the burden of benchmarking is two-fold: One, it’s the most recent set of data (and most recent review) that we have for Ryzen, meaning it’s fresher in everyone’s minds. Two, and more importantly, it’s a more linear comparison given the memory clock limitations on our particular R7 1700 sample (could not exceed 2666MHz without overclocking the CPU, whereas the 1700X could sustain 2933MHz for all tests). This restricts the amount of changes we’re making further, but the results for the 1700 will still be in several of the charts.
Important: Not All CPUs Were Re-Tested
We did not retest every single CPU in the bench. The goal was to focus on Ryzen – particularly the R7 1700 and R7 1700X. The 1800X, therefore, was not retested and does not appear in about 90% of the charts we’re posting today. The Intel chips also do not appear in about 90% of the charts, and were also not retested. Further, the memory overclocking effort has not yet been applied to the FX, 1800X, or Intel CPUs on our bench. For comparisons between “best light” 1700X chips (mem+core OC & Windows/game updates) and other chips on the bench, we’d also have to run the same memOC effort on Intel, alongside the same game & Windows updates.
So, then, the first half of the charts will focus strictly on the R7 CPUs being revisited. Some charts in the final gaming section will contain Intel/FX/1800X data from b693 test passes, which could have experienced similar performance changes as found with the 1700X tests in today’s piece.
Average FPS, 1% low, and 0.1% low times are measured. We do not measure maximum or minimum FPS results as we consider these numbers to be pure outliers. Instead, we take an average of the lowest 1% of results (1% low) to show real-world, noticeable dips; we then take an average of the lowest 0.1% of results for severe spikes.
Hardware Used
Core Components (Unchanging)
- NZXT 1200W Hale90v2
- For DDR4 platforms: Corsair Vengeance LPX 32GB 3200MHz*
- For Ryzen DDR4: Corsair Vengeance LPX 3000MHz clocked to 2933MHz (See Page 2)
- Premiere & Blender tests do not exceed 8GB DRAM. Capacity is a non-issue for our testing, so long as it is >16GB
- For DDR3 platforms: HyperX Savage 32GB 2400MHz
- Intel 730 480GB SSD
- Open Air Test Bench
- Cooler #1 (Air): Be Quiet! Dark Rock 3
- Cooler #2 (Cheap liquid): Asetek 570LC w/ Gentle Typhoon fan
- Cooler #3 (High-end): Kraken X62
Note: fan and pump settings are configured on a per-test basis.
AM4 Platform:
Used for R7 1800X, R7 1700X, R7 1700.
Z270 Platforms:
- Gigabyte Aorus Gaming 7 (primary)
- MSI Gaming Pro Carbon (secondary - for thermal validation)
- i7-7700K (x2) samples from motherboard vendors
Both used for the 7700K.
Z170 Platform:
- MSI Gaming M7
- i7-6700K retail
Z97 Platform:
- Gigabyte Z97X G1 WIFI-BK
- i7-4790K
Z77 Platform:
- MSI GD65 Z77
- i7-2600K
GPU: GTX 1080 FTW1
Dx12 games are benchmarked using PresentMon onPresent, with further data analysis from GN-made tools.
Continue to the next page for synthetic tests.
Windows Update Impact on Synthetics
There was some talk of a Windows update potentially improving Ryzen performance, though most of the testing we’ve seen posted also included other changes simultaneously, thus obfuscating the root cause. For our first round of tests, we put the R7 1700 and R7 1700X back through the bench with all settings equal to what they were in our initial reviews. This includes the memory speeds of 2666MHz for the R7 1700, due to IMC limitations at stock frequency on our chip, and 2933MHz on the 1700X. We’ll tune memory later in this content. We’re also using EFI 5704 for this first test, but will roll into 1002 for the next round of tests (later in this article).
We’ll be testing the Windows build ending in 970 from March 22nd versus Windows 10 version 693 from January 10th.
This section will be limited. We’re only running Cinebench and Firestrike with the Windows update, moving from build 693 to build 970. The next page will feature the entire games benchmark suite for a fuller picture.
Windows Update 693 to 970 – R7 1700 with Cinebench
We run a few Cinebench passes and average them, with the tests generally showing a swing of a couple points from one to the next. We’re looking at 1420 vs. 1421, which is a statistically insignificant performance difference between Windows versions. 1T performance is identical, at 145 for each build. The Windows update does not appear to have impacted the R7 1700 numbers running on b693.
Windows Update 693 to 970 – R7 1700 with FireStrike
Above is the FPS chart for a Firestrike pass, showing differences of ~0.06FPS on the CPU portion of the test. This is, again, statistically insignificant. We are within test variance of the software more than the OS, and so it is fair to say that b693 and b970 are effectively equal in performance for FireStrike with this configuration.
The scores, for the curious, haven’t moved a whole lot.
Let’s move on to gaming.
Windows Update Impact on Ryzen Performance
As stated in the synthetic section on the previous page: We’ll be testing the Windows build ending in 970 from March 22nd versus Windows 10 version 693 from January 10th.
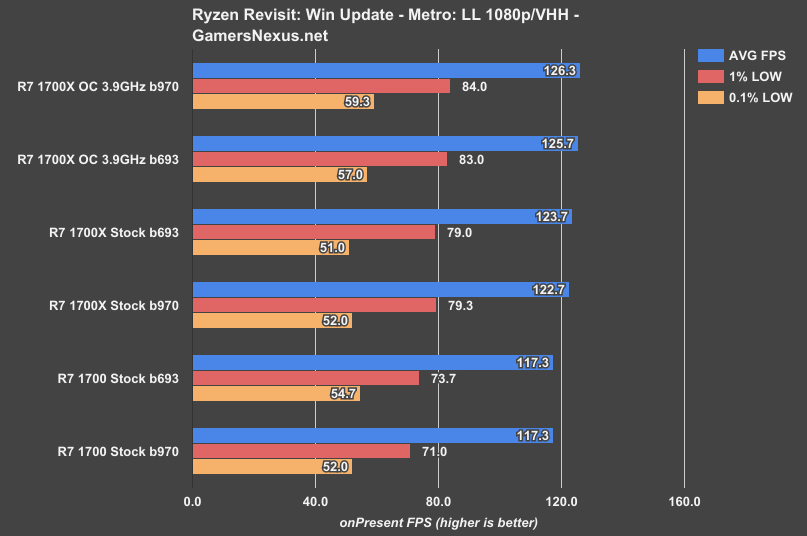
Windows Update Benchmark: Metro: Last Light & AMD Ryzen
Starting with Metro: Last Light – reliable, as it’s had no updates in years – we see that the R7 1700X performs effectively the same as the version that’s been accompanied with a Windows update. Overclocked, the R7 1700X is within test variance for this particular benchmark tool, producing less than a 1FPS difference in averages.
The same is true for the original R7 1700X stock test and the R7 1700X Win Update test, where we end up within about 1FPS AVG – so no change. The R7 1700 shows the same average FPS. For this title, the Jan 10 693 Windows 10 build posts no discernable deficit compared to the March 22 build.
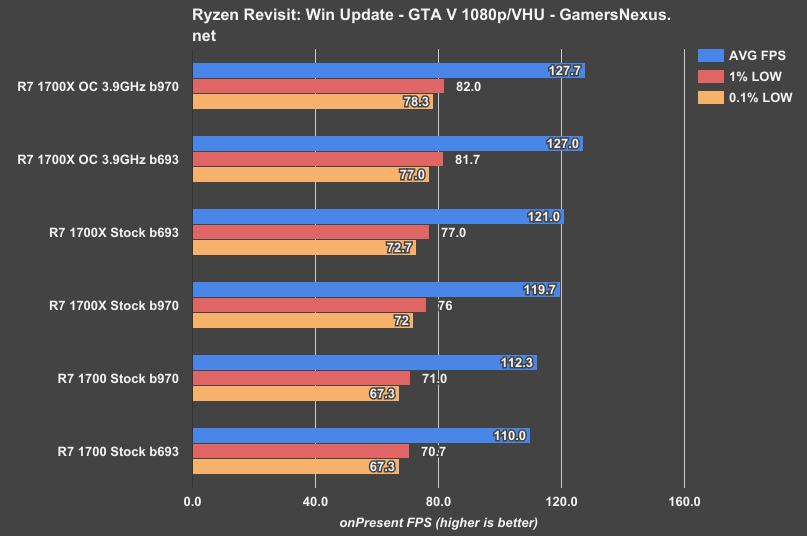
Windows Update Benchmark: GTA V & AMD Ryzen
Moving to GTA V, build 970 and build 693 produce effectively equal results between the overclocked R7 1700X CPUs, holding true also for the non-overclocked variants. The R7 1700 shows a 2% difference, favoring the Windows Update. At this point, we do not have enough data to definitively state whether this improvement is the result of Windows update. The next few tests should help solidify if this is the case.
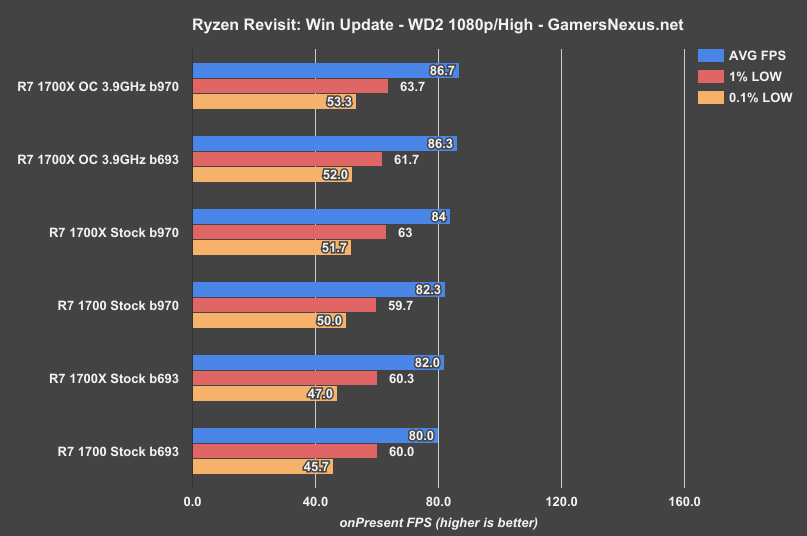
Windows Update Benchmark: Watch Dogs 2
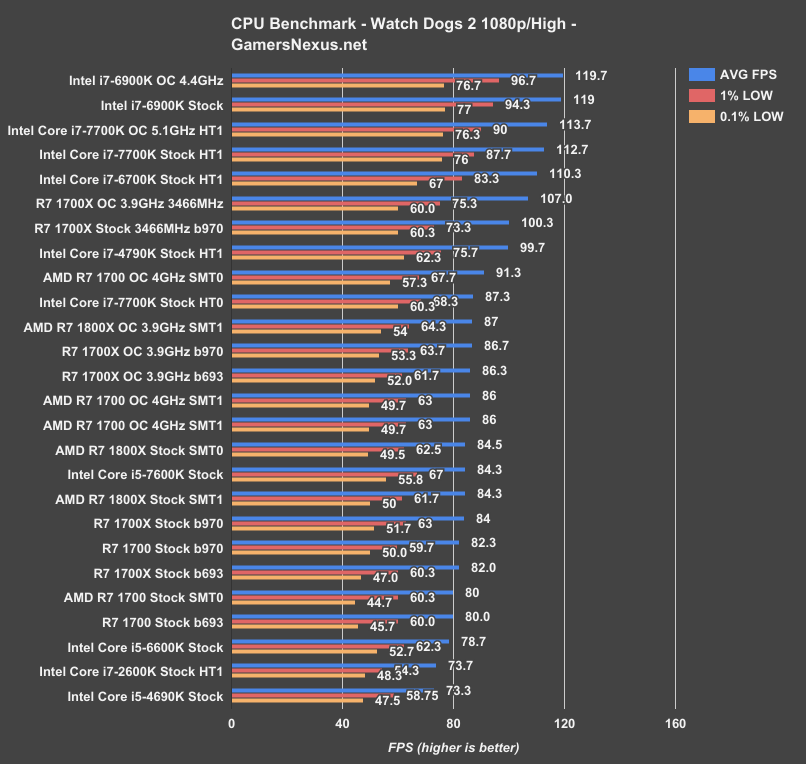
Watch Dogs 2 paints a similar picture: We have a statistically insignificant difference between builds 693 and 970 for the R7 1700X (when overclocked). The stock R7 1700X with b970 performs at 84FPS AVG, where the b693 performs at 82FPS AVG. Like with GTA V, this is enough to start resembling some sort of improvement – but the lack of statistical significance in the overclocked values give us pause. We would need more data to make a definitive statement as to whether the 2.4% improvement is caused by the Windows Update, but for now, this is at least consistent with GTA V.
The R7 1700 also posts a similar improvement of roughly 2.9% in averages with build 970. Again, ignoring the 1700X overclocked performance equivalence, these numbers are consistent in showing a potential improvement with the Windows Update, however minor. Our later tests will impact this in a bigger way.
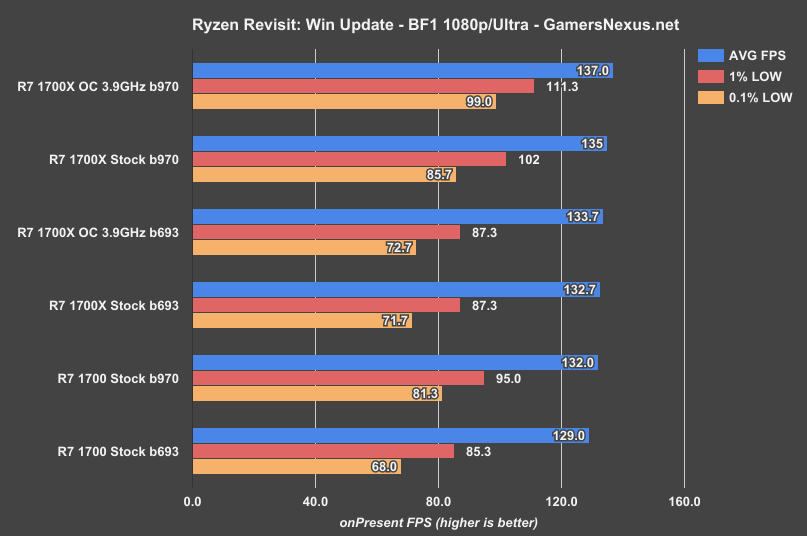
Windows Update Benchmark: BF1 & AMD Ryzen
Battlefield 1 (Dx11) starts showing some repeatable, statistically significant differences in our numbers. This builds on the story we’ve established with GTA V and Watch Dogs 2, but gives us greater confidence that the differences are more than just chance.
IMPORTANT: Quick note, here: DICE pushed update “They Shall Not Pass” for Battlefield 1 on March 14, along with version 1.08 of the game. Although the extensive patch notes do not indicate any performance improvements, it is possible that optimizations were made at a game level. This means that, for all the talk we’ve done of controlling variables, this one is out of our control. We were forced to update, and that means potentially seeing performance gains from BF1 rather than Windows.
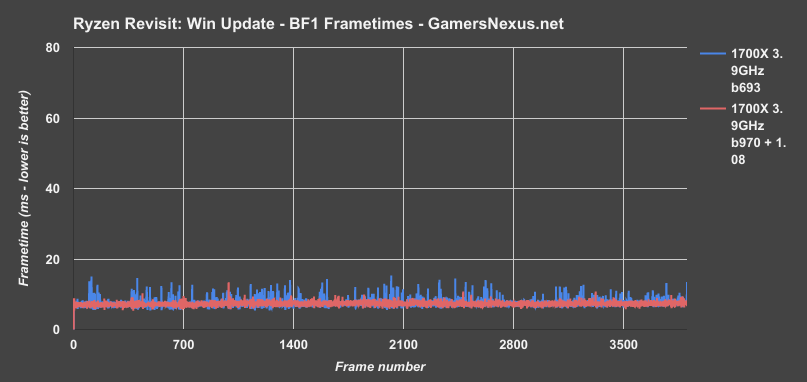
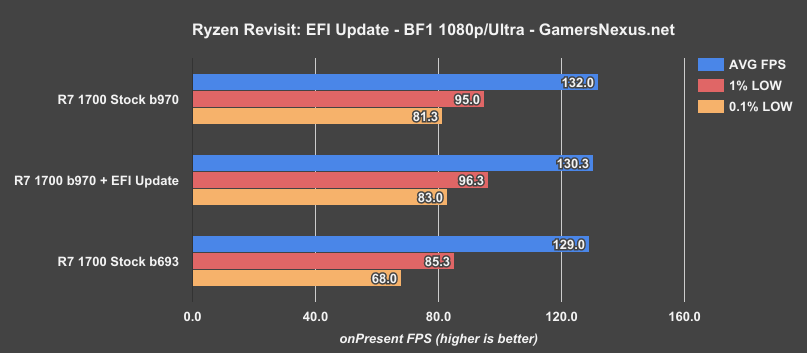
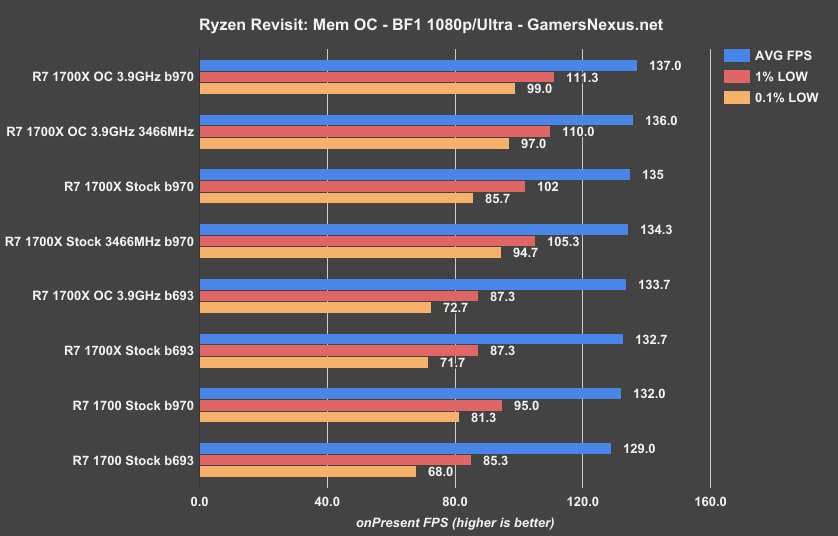
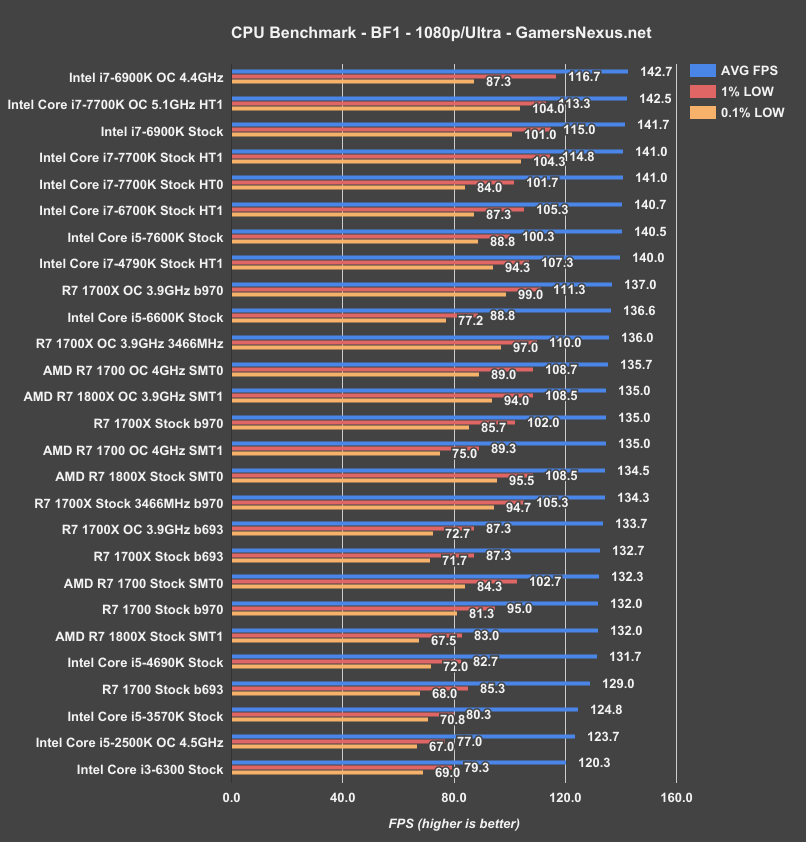
With build 970 & 1.08BF1, the overclocked 1700X performs at 137FPS AVG, where build 693 (and the older BF1 build) performs at 133.7FPS AVG. That’s a difference 2.5% -- so not that relevant, but frametimes are where it counts for these results. Because we measure frametimes and convert them into our 1% and 0.1% FPS numbers, we can see that build 970 posts 111FPS 1% lows, where build 693 – again, 2.5% behind in averages – posts a 1% low of 87.3. Finally, we’re seeing significant differences. It’s less in averages and more in frametimes for this particular game, with 0.1% lows also posting a gain from 72.7 to 99FPS.
The above frametime chart illustrates greater consistency in frametime delivery with the BF1+Windows updates applied.
The story holds for the stock 1700X, which runs 135FPS AVG, 102 1% low, and 88 0.1% low with build 970. Against build 693 from the original review, that’s an unimportant improvement in averages, but a measurable and repeated improvement in frametimes. This is consistent with our 1700X number. Although these improvements are not visibly appreciable to the end-user, they certainly show up in charts and are important to measure and update.
Windows Update Benchmark: Ashes of the Singularity
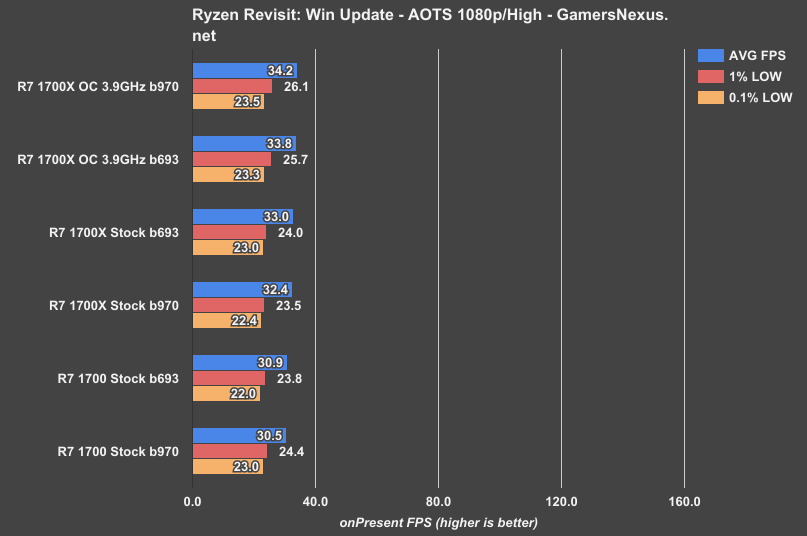
This chart is for Ashes of the Singularity, but without the Escalation update. Remember, we’re trying to test one thing at a time, here, not throw a whole bunch of updates into the bucket and call it an “better than launch.” That’s nice, but not useful for figuring out the source of the improvement or how the chips may progress going forward.
In AOTS, we’re back to what amounts primarily to statistical insignificance or very small differences. We’re seeing an improvement in the 1700X overclocked numbers in B970 over B693 of roughly 1.2% in averages, with almost zero difference in frametimes when considering 1% low and 0.1% low converted FPS values.
The 1700X stock with b693 shows, again, a statistically insignificant difference – this time favoring b693, which more or less indicates test variance between two tested values which are effectively identical in performance. There’s no relevant change to speak of, here, especially not when the gap is 0.6FPS.
The 1700 is the same story – no statistically significant difference, and frametimes are effectively identical.
Windows Update Benchmark: Total War: Warhammer & Ryzen
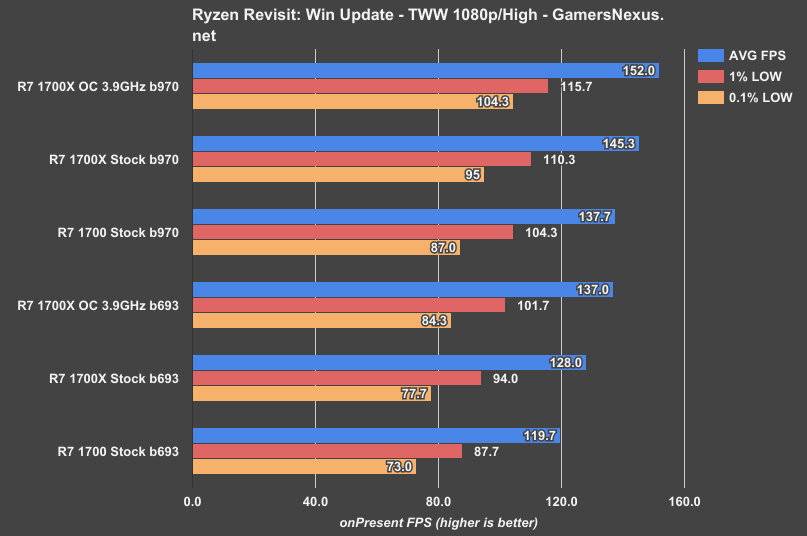
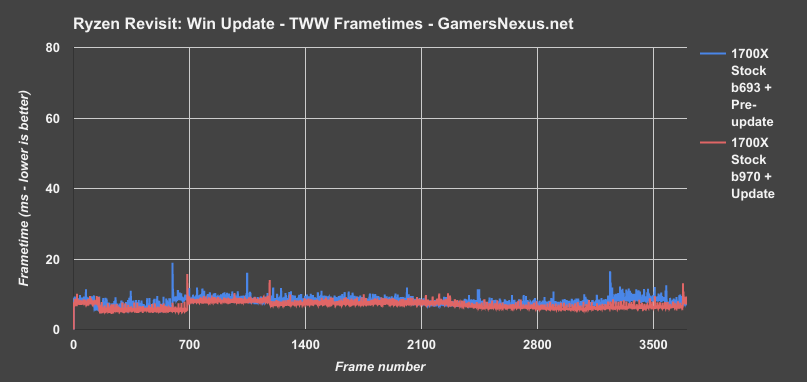
We’re on to Total War: Warhammer. Unfortunately, with all this talk of constraining variables, we were forced to update this title for our benchmark, and that means there will be changes at a game-level. We reached-out to our contacts at Creative Assembly to confirm if this update impacts CPU performance; we’ve heard back from the communications team and are waiting for confirmation of the update’s changes from the engineering team. If we receive word, we’ll update the article with Creative Assembly’s information. We suspect the differences above are a result of the game update more than the Windows update, but either one is critical to show.
The 1700X b970 benchmark outmatches the b693 benchmark in significant ways, with the overclocked 1700X posting a framerate approximately 11% higher (at 152FPS AVG versus 137FPS AVG). Frametimes don’t show a huge improvement in 1% lows, but 0.1% lows have us improved. The 1700X stock goes from 128FPS, 94FPS 1% lows, and 78FPS 0.1% lows to 145FPS AVG, 110FPS 1% low, and 95FPS 0.1% low. Another significant improvement.
We replicated this on the R7 1700, which moved from 120FPS AVG to 138FPS AVG, with lows also improved.
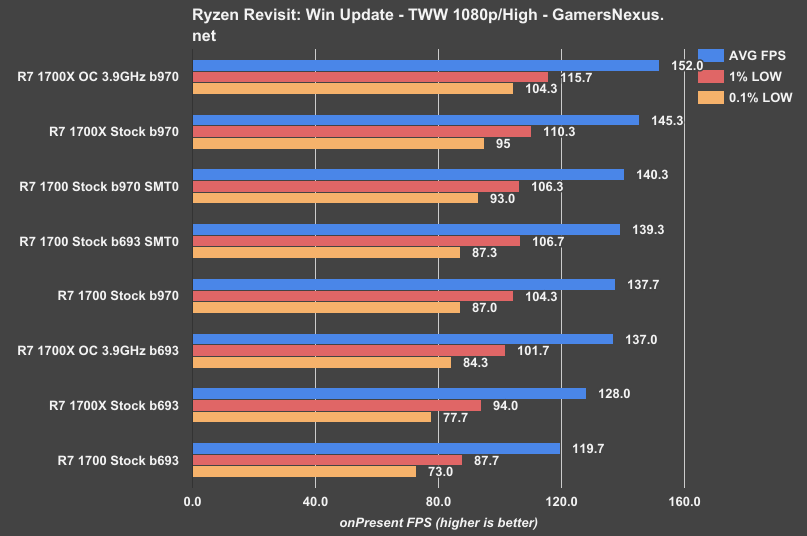
Here’s the interesting thing: Total War: Warhammer was the game that showed the biggest improvement by disabling SMT, so the next question is how these numbers compare to the SMT0 values.
The above chart contains the SMT0 values for the R7 1700. Here, we show that build 970 more or less makes up for the difference in SMT toggling, indicating that one of the two applied updates could have removed the SMT hamstring we previously observed. Now, of course, the question is still whether SMT toggling benefits in this title, even with these updates. The answer is “yes,” with the performance ceiling still about the same as previously at around 140FPS AVG (but frametimes improved). The R7 1700 is still better with SMT off, but the difference has minimized. The performance ceiling remains the same in Total War as previously, but we’re closer to it without the requirement of disabling SMT.
Continue to the next page for EFI update benchmarks.
We’re moving on to EFI updates now, which are cumulative with our Windows platform update. This will be a quick section, as the results were largely uninteresting. We’re moving from 5704 to 1002 on the ASUS Crosshair VI Hero motherboard, with the EFI provided directly by ASUS. After this, we’ll start the memory overclocking section.
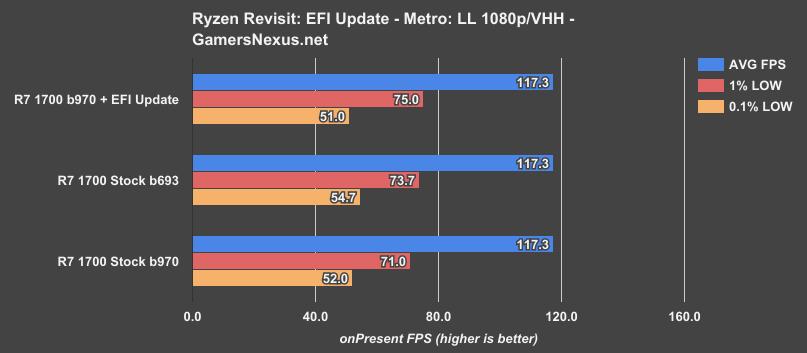
With the R7 1700, Metro: Last Light shows no benefit from strictly performing an EFI update on the Crosshair VI. We’d need to actually use updated features, as AGESA updates were not enough to impact performance here.
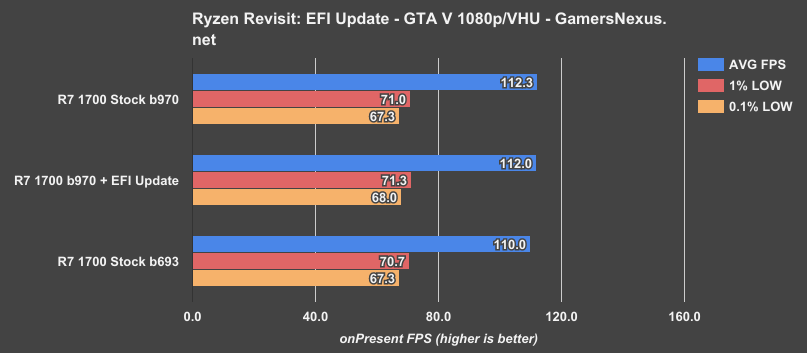
In GTA V, we’re seeing zero noteworthy change from b970 with 5704 to b970 with 1002.
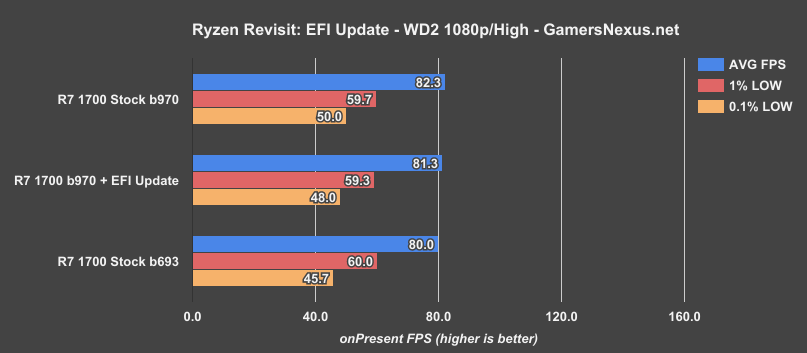
Moving on swiftly to Watch Dogs 2, we’re seeing no significant change from b970 with 5704 to b970 with 1002. We are within variance, at this point.
Battlefield 1, same story. The improvement is clear from Windows Update, but there’s no clear improvement from throwing an EFI update on there. Using the new features, sure – but not standalone.
This story continues for all of the other games and synthetic tests as well, and isn’t particularly interesting. So far, we’re seeing a potential improvement from either the Windows update or from the forced updates to the games, which are most important in Battlefield 1 and Total War: Warhammer. It appears that those games are around where performance was when SMT was disabled in our first round of tests, though the ceiling itself is not significantly higher.
Let’s move on to memory overclocking to see if there are some real gains.
Continue to the next page for memory overclocking.
Memory Overclocking & Ryzen – Not Necessarily Trivial
Memory overclocking and timings tuning isn’t necessarily trivial on Ryzen right now. It’s mostly time intensive, and if you’re used to just toggling an XMP switch on Intel and moving the frequency around, this is going to be a lot more involved.
After sorting through about 6 kits of memory, we found that our Trident Z 3200MHz CL14 kit had the best potential for overclocking in Ryzen. This is because it’s got Samsung B dies, whereas other kits – like those from HyperX – are running the Hynix dies that are proven to have issues with higher clocks on Ryzen.
We have since requested an even higher bin of memory from GSkill, and are awaiting that shipment. For now, our Trident Z B-die kit will work for establishing a premise of how much improvement we can expect from memory overclocking on Ryzen.
Thanks to EFI updates, direct support from Buildzoid and ASUS, and support from GSkill, we were able to walk through about 6 hours of memory training and tuning to establish a stable overclock of 3466MHz with CL14 timings. We were able to hit 3600MHz, but it was not stable for actual load usage with beneficial timings.
Our previous results (2933MHz) used the Corsair Vengeance LPX kit at CL16. Improvement to performance is from lower CL timings as much as it is from higher frequency – so far, we’ve seen that Ryzen cares about both.
A lot of the tuning is figuring out whether your R7 chip responds better to reference clock tuning or memory multiplier tuning, then figuring out if you want to operate from a base 24x, 26.66x, or 32x multiplier on the memory. This is mostly guess and check work and takes the majority of the time required. Working on that for a day gave us stability and timings we were happy with benchmarking.
We’re using the 1700X for this, since all of those tests were conducted most recently and were conducted on 2933MHz base. Note that we don’t particularly recommend the 1700X, given the deal that is the R7 1700 by comparison when overclocking, but we’re using it because it’ll allow for the most linear presentation of data.
Synthetics w/ MemOC
R7 1700X + 3466MHz Overclock – Metro: Last Light
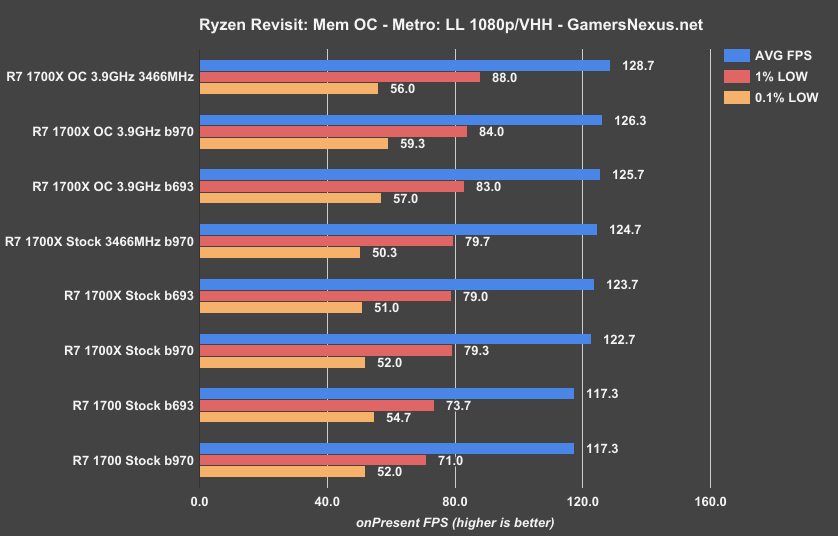
Starting again with Metro: Last Light, the 3466MHz 1700X with stock clocks sees a performance bump from 123FPS to 125FPS AVG, with lows effectively identical around 80FPS 1% and around 51FPS 0.1%. That’s an improvement of about 1.6% by going from 2933MHz to 3466MHz with the Windows update and EFI update included.
Looking next to overclocking, we see the 1700X at 3.9GHz with 3466MHz memory is placing at around 129FPS AVG, or roughly 1.9% ahead of the 1700X at 3.9GHz with 2933MHz memory. Compared to the original results, which had b693 and 2933MHz memory on the 3.9GHz OC, we have moved up about 2.4% from 125.7FPS AVG to 128.7FPS AVG.
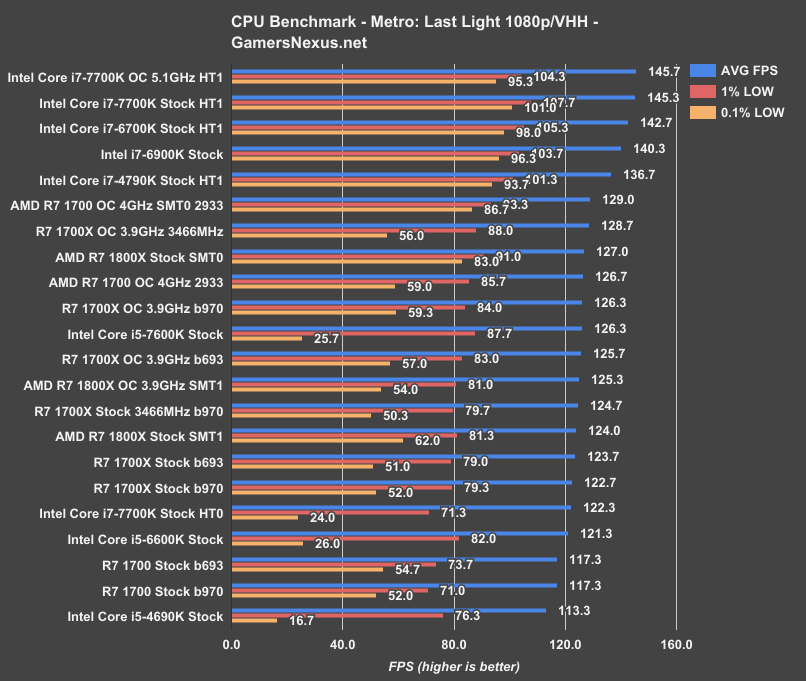
We might as well add these in to the original tables. Note that the Intel series and the 1800X haven’t been retested with the new updates, so anything which impacts Ryzen could theoretically also impact Intel (on the Windows or game update side). The same goes for memory: We haven’t done a memory OC effort on KBL yet, which would be necessary to better determine the max potential of each platform.
On this table, we’re seeing our best 1700X line-item with a core 3.9GHz OC and 3466MHz CL14 memory OC landing around where the original review’s R7 1700 4GHz OC with SMT off landed. We are below the i7-4790K stock CPU, which sits at 136.7FPS AVG with the 1% worst frametimes converting to an FPS of 101, and .1% worst to 94FPS. The 7700K modern flagship is at 146FPS AVG with 104 and 95FPS 1% and 0.1% lows representing the frametimes. The 1700X with its memory and core overclocks runs 88FPS 1% low and 56FPS 0.1% lows. Disabling SMT, as illustrated by previous tests, improves the frametimes in this particular title.
R7 1700X + 3466MHz Overclock – GTA V
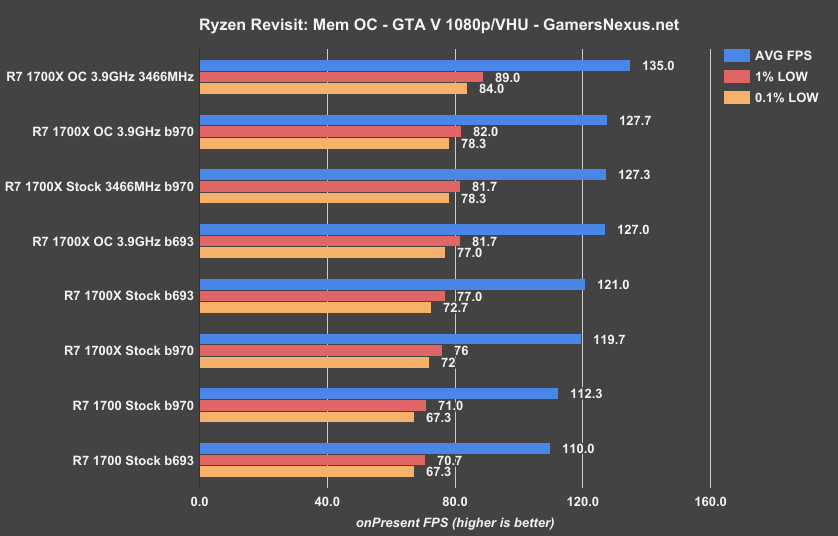
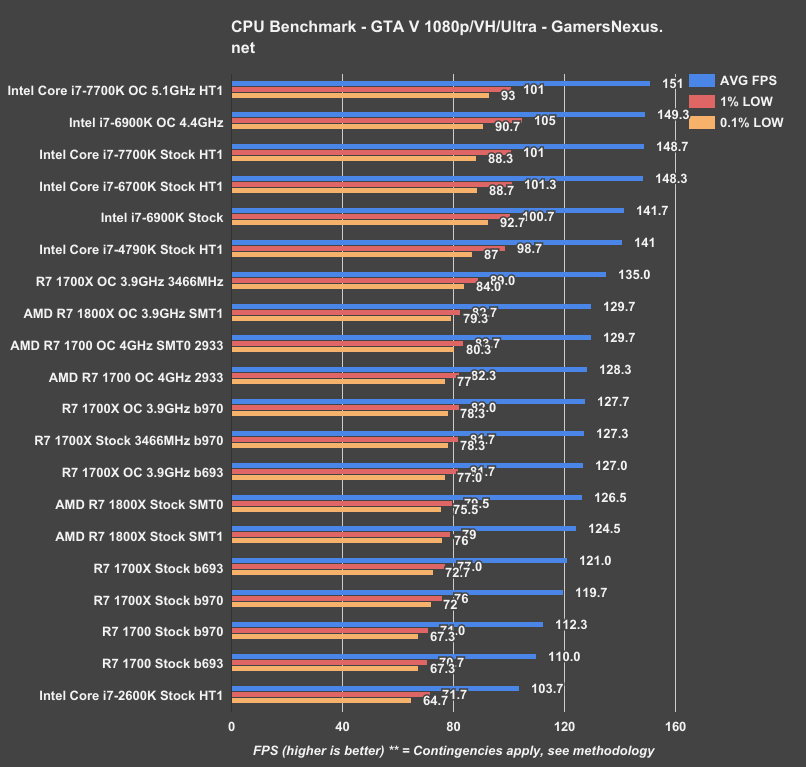
Back to GTA V for the next one. Here, we’re seeing our 1700X at 3.9GHz with 3466MHz CL14 memory performing at around 135FPS AVG, with an improvement in frametimes over base. The 1700X at 3.9GHz with 2933MHz CL16 is at around 128FPS AVG, showing an improvement of about 5.7% by overclocking the memory to 3466MHz. If we kill the core OC and just run the memory OC, we’re roughly at the same place: 127FPS AVG with lows around 80. Versus a stock 1700X with 2933MHz memory, the 3.9GHz version with 3466MHz memory improves performance by about 11%. Again, that’s by overclocking memory and core.
To compare to a simplified stack, that puts the 135FPS 1700X above the 1800X when it was overclocked with b693 and SMT0, or the 1800X’s best case. It is also below the i7-4790K in averages and frametimes, which leads by about 4.4% average.
The overclocked i7-7700K is next to be compared to the overclocked 1700X. The 7700K is similar in price to the 1700 and, for pure gaming builds, should be alongside the 1700 for head-to-head options. Keep in mind that the 1700 can support the same overclock and memory overclock as our compared 1700X, chance notwithstanding, which means performance is identical at the same clocks. The 7700K overclocked is at 151FPS AVG with 101 and 93FPS lows. The 7700K still holds a performance lead of about 11.9%, which is down from its previous performance lead of 18.9%. That said, we have not yet retested the 7700K with build 970 of Windows 10 or with memory overclocking of its own. The 7700K here is at 3200MHz CL16.
R7 1700X + 3466MHz Overclock – Watch Dogs 2
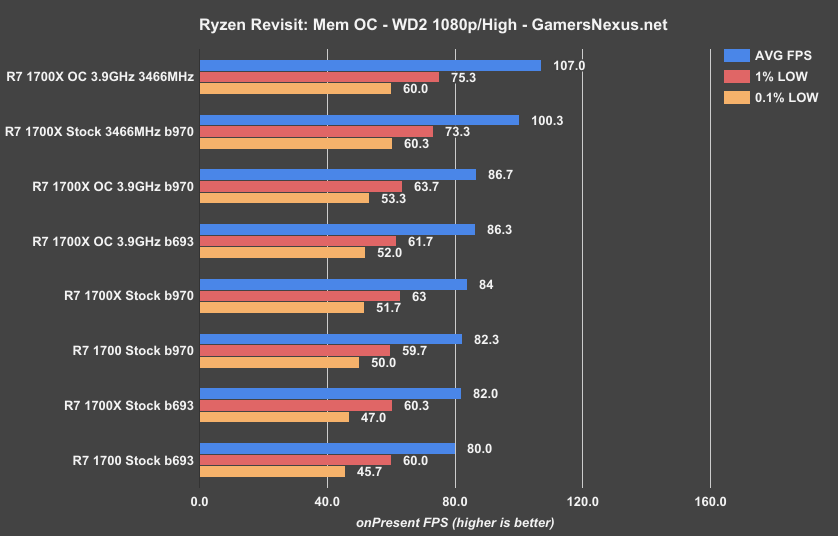
In Watch Dogs 2, the 1700X overclocked to 3466MHz CL14 with its stock CPU speed places at 100FPS AVG, lows in the 70s and 60s. Versus the 1700X stock with 2933MHz memory, this is a significant improvement of 19%. So far, all of our improvements in this same comparison have been in single digit percentages, making Watch Dogs 2 a bit of an interesting title. We also know that Watch Dogs 2 is particularly thread intensive, unlike the others, and so could be causing some sort of cross-CCX traffic that benefits from the faster memory.
Looking at the 3.9GHz 1700X at 2933MHz, we’re faced with an AVG FPS of about 87, which previously showed no noteworthy improvement over the stock 1700X with 2933MHz memory. Memory is clearly choking Ryzen in this specific title. Against Intel, the 7700K with its 5.1GHz overclock lands at 114FPS AVG, 90 1% low frametimes, and 76 0.1% lows. The 1700X with core and memory OC lands at 107FPS AVG, 75FPS 1% low, and 60FPS 0.1% low.
Again, we’d also have to overclock Intel’s memory for final validation of this title, but this gives an idea as to Ryzen’s memory overclocking performance.
R7 1700X + 3466MHz Overclock – Battlefield 1
Back to Battlefield 1, it appears that the most important item is the b970 Windows update and/or update to BF1 since previous testing, after which point overclocking becomes less significant. The 1700X with its 3.9GHz OC and 3466MHz memory posted no significant statistical difference versus the 1700X at 3.9GHz with 2933MHz memory. The difference here is effectively 0%. Battlefield 1, like Watch Dogs 2, has its own unique performance needs.
Looking at the stock 1700X versus the stock 1700X at 3466MHz memory, we also see an effectively equal average framemrate, albeit with improvements to the 0.1% low metrics from 86 to 95FPS.
Back on the bigger chart, this lands the new 1700X metrics around the i5-6600K at 137 AVG, 89 1% low, and 77 0.1% lows, where the 1700X has a lead in frametimes over the i5. Versus the nearest i7, the 1700X is again under the i7-4790K at 140FPS AVG.
R7 1700X + 3466MHz Overclock – Ashes of the Singularity
Again, we haven’t updated Ashes yet. That’s not the point of these tests.
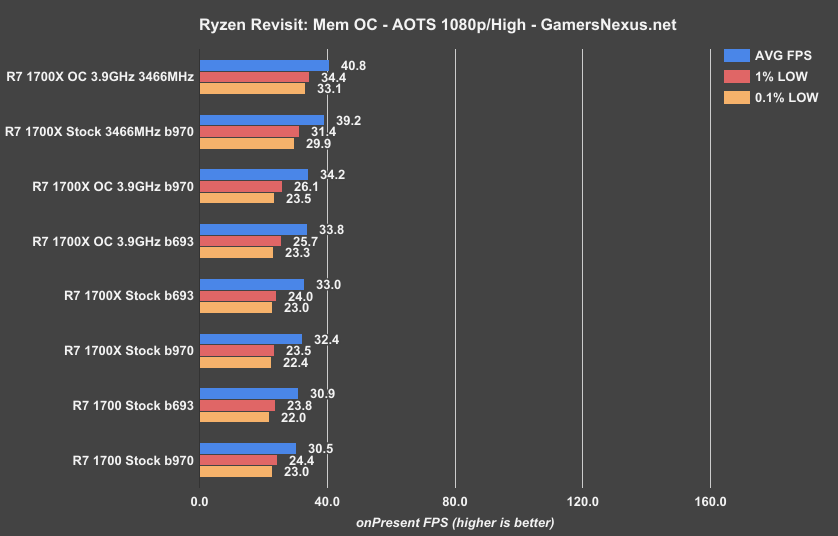
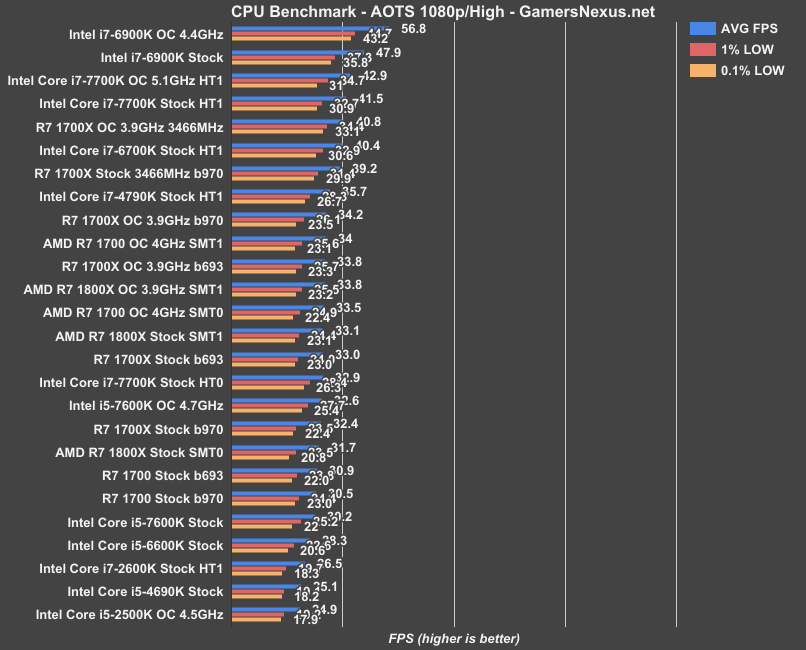
Ashes appears to care about the memory overclock more than the core overclock, in this test configuration. The 1700X at 3.9GHz with 3466MHz memory places at about 41FPS AVG, just ahead of the 39FPS AVG of the stock 1700X with 3466MHz memory. The latter of the two, with its 39FPS AVG, posts an improvement over the stock 1700X with 2933MHz memory of 18.8% versus our best-of b693 metrics. This is another title that seems to make use of the gains.
Also again, we haven’t rerun Intel yet or overclocked its memory, so mileage may vary until we get those results in. Comparatively, the 1700X is now price-competitive with the 7700K in this title, as the 7700K is running a 43FPS AVG with its core overclock, or 42 without. We are curious to see if a MemOC benefits Kaby Lake in this particular game, but for now, the 1700X with all our overclocking effort is starting to claw back some ground.
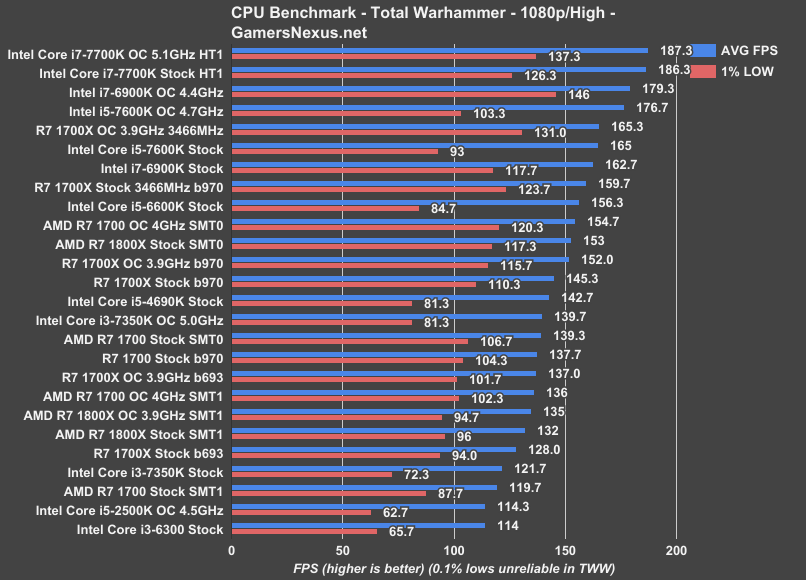
R7 1700X + 3466MHz Overclock – Total War: Warhammer
Finally, we have Total War: Warhammer. Again, keep in mind that this game just received a patch and we haven’t yet rerun the other tests. The Ryzen CPUs listed in this benchmark include the update, but not the later-listed Intel/FX/1800X CPUs, for clarity.
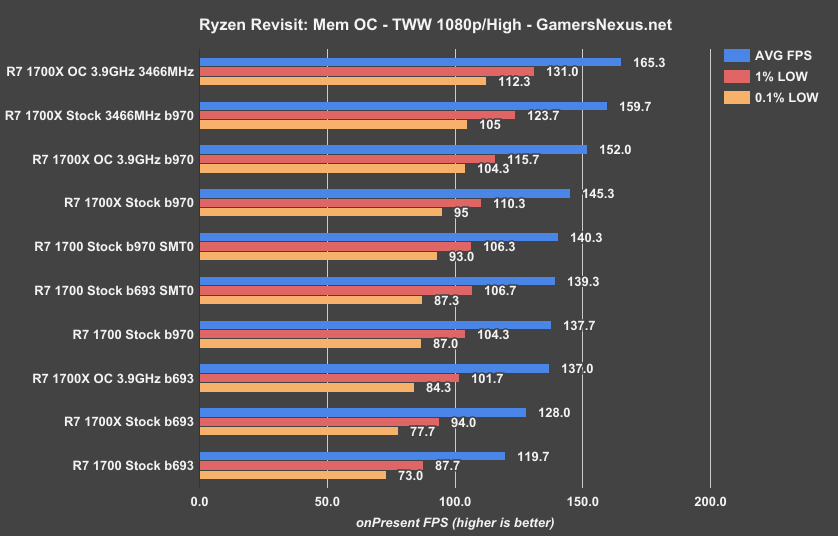
For the R7 1700X, overclocking memory to 3466MHz with a stock 1700X provides a performance boost to 160FPS AVG and 124FPS 1% lows. This is up from the stock 1700X with 2933MHz memory at 145FPS AVG, for a performance improvement of roughly 9.9%. Versus the 3.9GHz 1700X with 2933MHz memory and b970 Windows, we see an improvement of 5.1%.
The core OC and memory OC put us up to 165FPS AVG, for a gain of about 8.8% over the overclocked 1700X with 2933MHz memory.
Versus other items on the chart, the i7-7700K overclocked lands at 187FPS AVG, with the stock 7700K at 186FPS AVG. We are bumping up against other limits here (either engine constraints or non-CPU hardware constraints, as indicated by the 7600K + OC deltas), given the proximity of performance between these two line items. The overclocked i5-7600K runs at 177FPS AVG with poorer frametimes compared to the 7700K, more similar to the stock 1700X. In its best light with all the overclocks, the 1700X lands AMD ahead of the 6600K and behind the 7600K in averages, though lows are ahead at 112.
Next Steps
There’s a lot more to do, as always, but we’ll leave this here for now. We are currently sorting through still higher overclock options, thermal testing, and R5 chips. After the overclocking effort, we had to keep the Kraken X62 cooler on there to ensure the 1700X didn’t encounter thermal throttles for longer tests, which we showed to be a possibility in our previous review. More on thermals soon, though. For now, we’ve got the FPS numbers updated for you to sift through, as seen in this content.
Editor-in-Chief, Test Lead: Steve Burke
Sr. Editor, Tester: Patrick Lathan
Video Producer: Andrew Coleman


