Implementation of liquid coolers on GPUs makes far more sense than on the standard CPU. We've shown in testing that actual performance can improve as a result of a better cooling solution on a GPU, particularly when replacing weak blower fan or reference cooler configurations. With nVidia cards, Boost 3.0 dictates clock-rate based upon a few parameters, one of which is remedied with more efficient GPU cooling solutions. On the AMD side of things, our RX 480 Hybrid mod garnered some additional overclocking headroom (~50MHz), but primarily reduced noise output.
Clock-rate also stabilizes with better cooling solutions (and that includes well-designed air cooling), which helps sustain more consistent frametimes and tighten frame latency. We call these 1% and 0.1% lows, though that presentation of the data is still looking at frametimes at the 99th and 99.9th percentile.
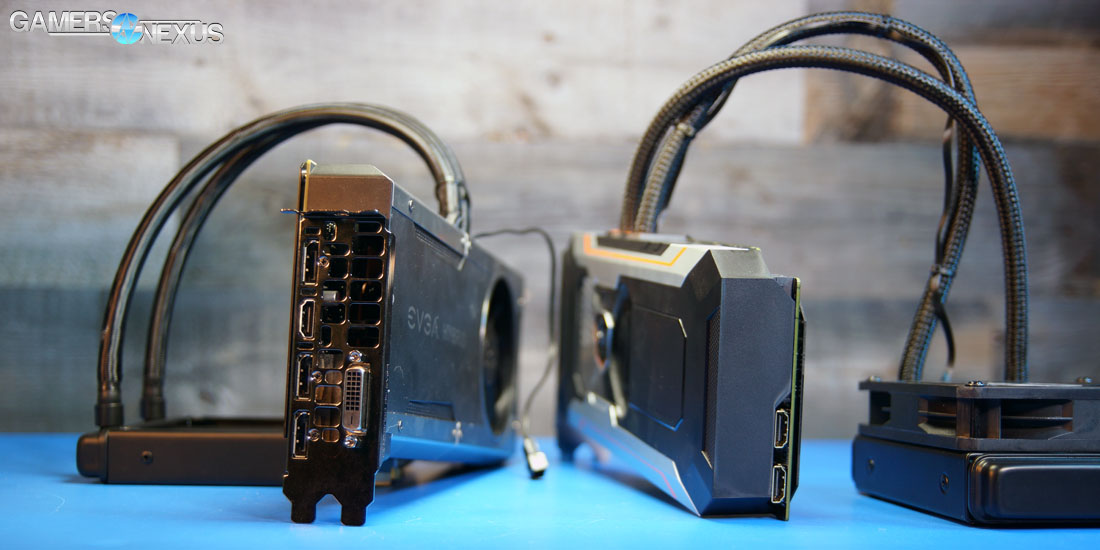
The EVGA GTX 1080 Hybrid has thus far had the most interesting cooling solution we've torn down on an AIO cooled GPU this generation, but Gigabyte's Xtreme Waterforce card threatens to take that title. In this review, we'll benchmark the Gigabyte GTX 1080 Xtreme Water Force card vs. the EVGA 1080 FTW Hybrid and MSI/Corsair 1080 Sea Hawk. Testing is focused on thermals and noise primarily, with FPS and overclocking thrown into the mix.
A quick thanks to viewer and reader Sean for loaning us this card, since Gigabyte doesn't respond to our sample requests.
NVIDIA GeForce GTX 1060 Specs vs. GTX 1070, GTX 1080, GTX 960
| NVIDIA Pascal vs. Maxwell Specs Comparison | ||||||
| GTX 1080 | GTX 1070 | GTX 1060 | GTX 980 Ti | GTX 980 | GTX 960 | |
| GPU | GP104-400 Pascal | GP104-200 Pascal | GP106 Pascal | GM200 Maxwell | GM204 Maxwell | GM204 |
| Transistor Count | 7.2B | 7.2B | 4.4B | 8B | 5.2B | 2.94B |
| Fab Process | 16nm FinFET | 16nm FinFET | 16nm FinFET | 28nm | 28nm | 28nm |
| CUDA Cores | 2560 | 1920 | 1280 | 2816 | 2048 | 1024 |
| GPCs | 4 | 3 | 2 | 6 | 4 | 2 |
| SMs | 20 | 15 | 10 | 22 | 16 | 8 |
| TPCs | 20 | 15 | 10 | - | - | - |
| TMUs | 160 | 120 | 80 | 176 | 128 | 64 |
| ROPs | 64 | 64 | 48 | 96 | 64 | 32 |
| Core Clock | 1607MHz | 1506MHz | 1506MHz | 1000MHz | 1126MHz | 1126MHz |
| Boost Clock | 1733MHz | 1683MHz | 1708MHz | 1075MHz | 1216MHz | 1178MHz |
| FP32 TFLOPs | 9TFLOPs | 6.5TFLOPs | 3.85TFLOPs | 5.63TFLOPs | 5TFLOPs | 2.4TFLOPs |
| Memory Type | GDDR5X | GDDR5 | GDDR5 | GDDR5 | GDDR5 | GDDR5 |
| Memory Capacity | 8GB | 8GB | 6GB | 6GB | 4GB | 2GB, 4GB |
| Memory Clock | 10Gbps GDDR5X | 4006MHz | 8Gbps | 7Gbps GDDR5 | 7Gbps GDDR5 | 7Gbps |
| Memory Interface | 256-bit | 256-bit | 192-bit | 384-bit | 256-bit | 128-bit |
| Memory Bandwidth | 320.32GB/s | 256GB/s | 192GB/s | 336GB/s | 224GB/s | 115GB/s |
| TDP | 180W | 150W | 120W | 250W | 165W | 120W |
| Power Connectors | 1x 8-pin | 1x 8-pin | 1x 6-pin | 1x 8-pin 1x 6-pin | 2x 6-pin | 1x 6-pin |
| Release Date | 5/27/2016 | 6/10/2016 | 7/19/2016 | 6/01/2015 | 9/18/2014 | 01/22/15 |
| Release Price | Reference: $700 MSRP: $600 | Reference: $450 MSRP: $380 | Reference: $300 MSRP: $250 | $650 | $550 | $200 |
The Gigabyte GTX 1080 Xtreme liquid cooled card runs the highest stock clock-rate of the AIO GTX 1080s we've tested thus far, though normal Boost functionality muddies that higher clock-rate. It's this same Boost function that pushes GPUs to nearly the 2GHz mark, despite an advertised clock-rate in the 1700-1800MHz range. If there's no thermal limit, the GPU will push its clock-rate higher (without requiring manual overclocking) until another limit is reached – usually power or voltage. With the higher-end cards, like the FTW Hybrid and the Xtreme Water Force, enough power is available that Boost will often hit about 1999-2012MHz with no user-applied changes to the clock-rate.
The point isn't to say that a higher stock clock-rate is less significant, but is to illustrate that some of these devices may perform nearly identically to one another regardless of the paper spec. This same Boost functionality includes some variance from one GPU to the next, resulting in occasional swings in leaders on FPS charts (within about 1-2FPS). Ultimately, though, those swings won't much matter at this level of the playing field. We'll see that more later.
Gigabyte Xtreme Water Force Tear-Down & PCB
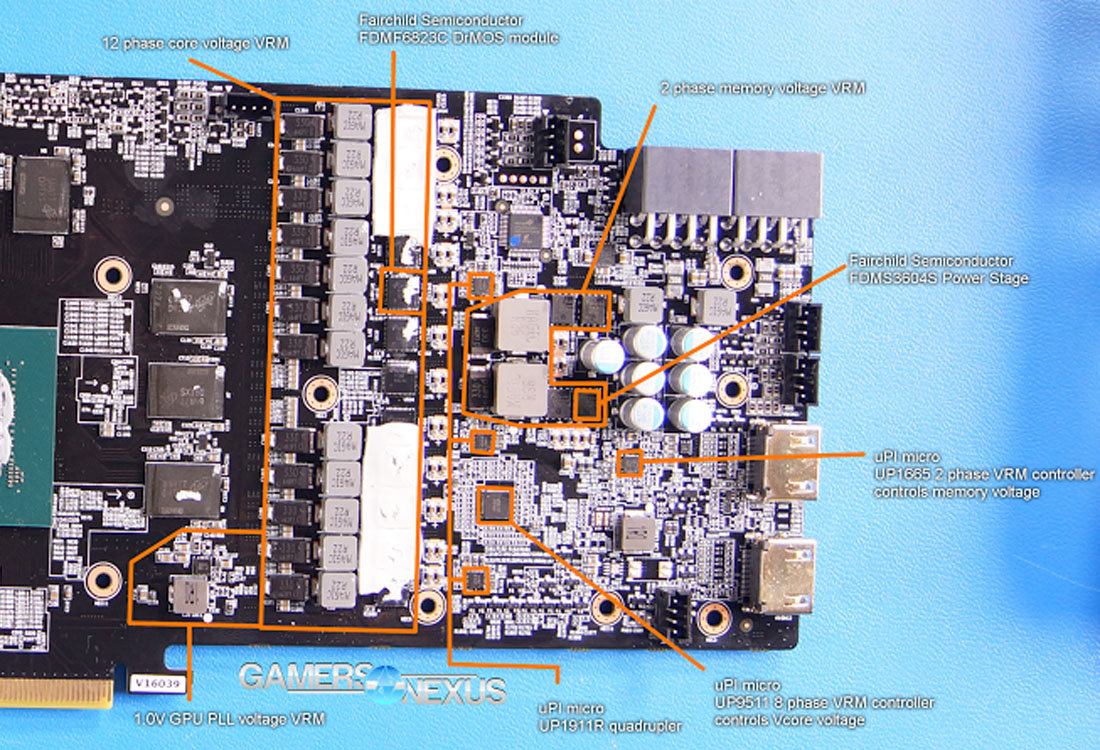
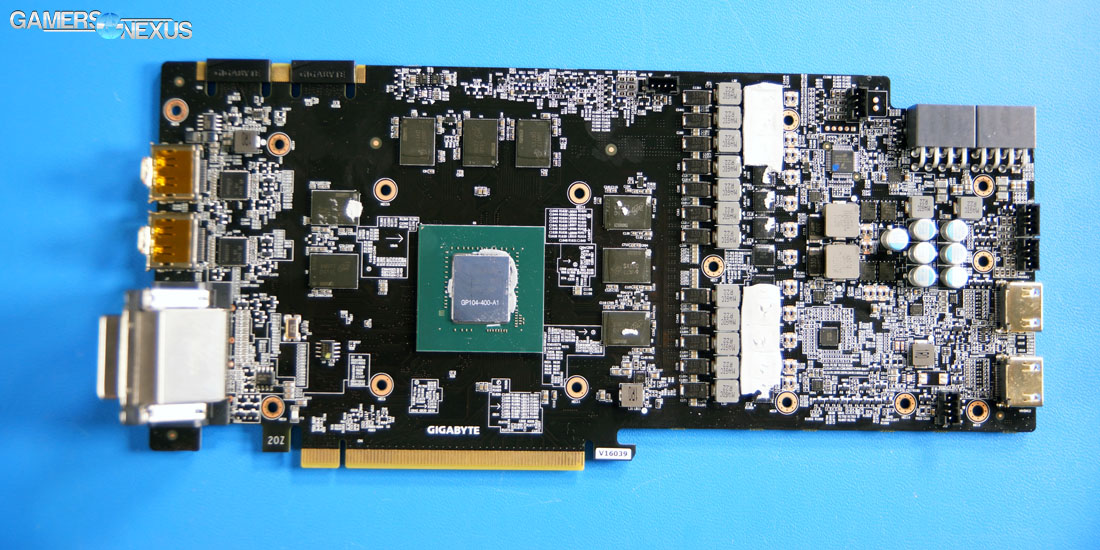
Our tear-down video provides a walk-through of the disassembly process, and an upcoming PCB analysis (featuring overclocker 'Buildzoid') will go live shortly on the YouTube channel. In the meantime, here's a short version of the PCB analysis:
We believe that Gigabyte is pulling 3 PWM signals from the UP9511 and using quadruplers to create its 12-phase VRM, potentially because the card's routing of video outputs to the front of the board (consuming more PCB layers).
Regardless, the cooling solution is the most interesting for today.
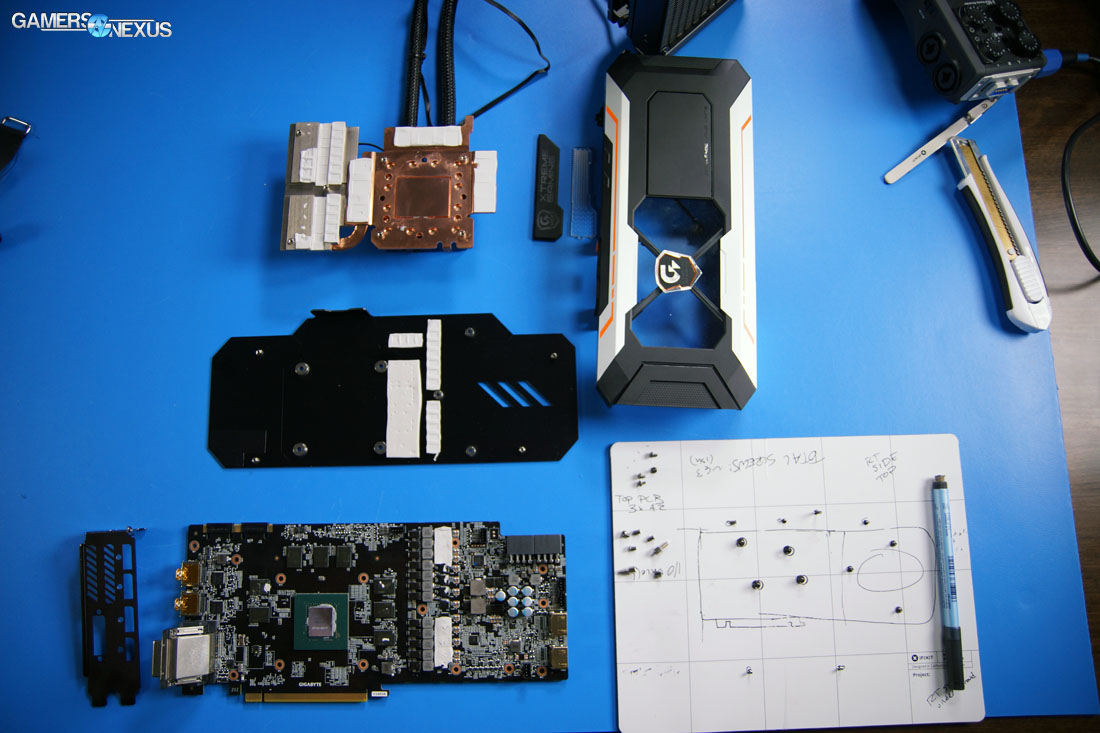
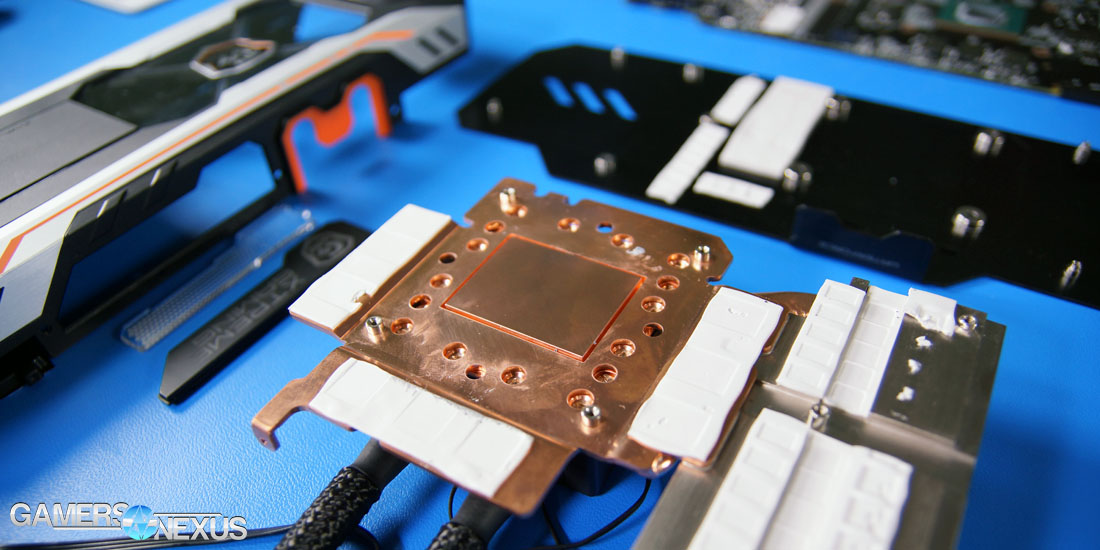
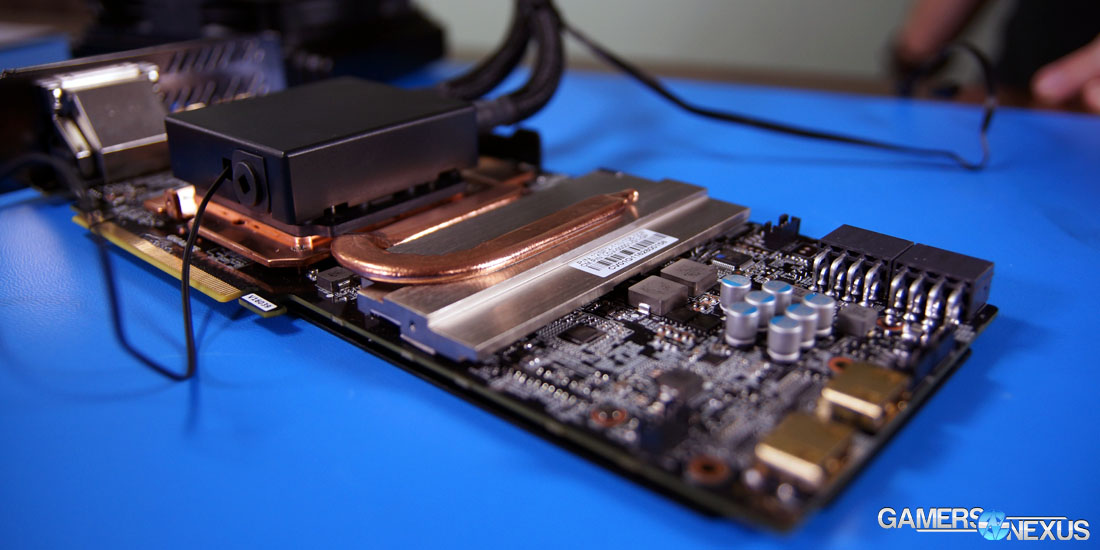
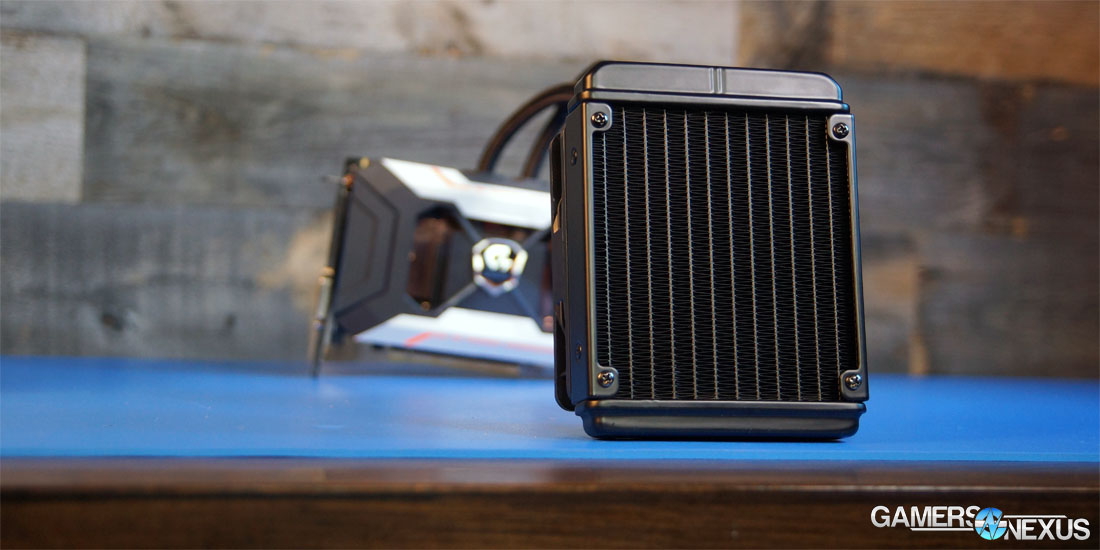
Gigabyte is cooling the GPU, VRAM, and VRM with its solution. The VRM cooling is somewhat unique, preceded in recent years only by the Fury X cooling design. We believe Cooler Master to be the OEM for Gigabyte; Gigabyte's Xtreme card is the only AIO cooled GPU we've looked at this generation that does not use an Asetek CLC. The CM solution uses a wide pump block with a larger coldplate surface area, and an isolated copper protrusion in the center. This protrusion contacts the GPU directly, and is able to keep the GPU diode temperature lower by isolating itself from the VRAM & VRM cooling plate.
The copper plate extending outwardly from the CLC coldplate is in direct contact with the VRAM, sinking heat there and sharing thermal dissipation with the GPU through the liquid cooler. Strictly looking at GPU diode readings, this will increase the liquid temperature and saturation of the cooling solution and increase diode readings. That's not necessarily a bad thing, since the end result is significantly cooler VRAM and a cooler VRM.
Above: Gigabyte VRAM + coldplate + VRM cooling solution.
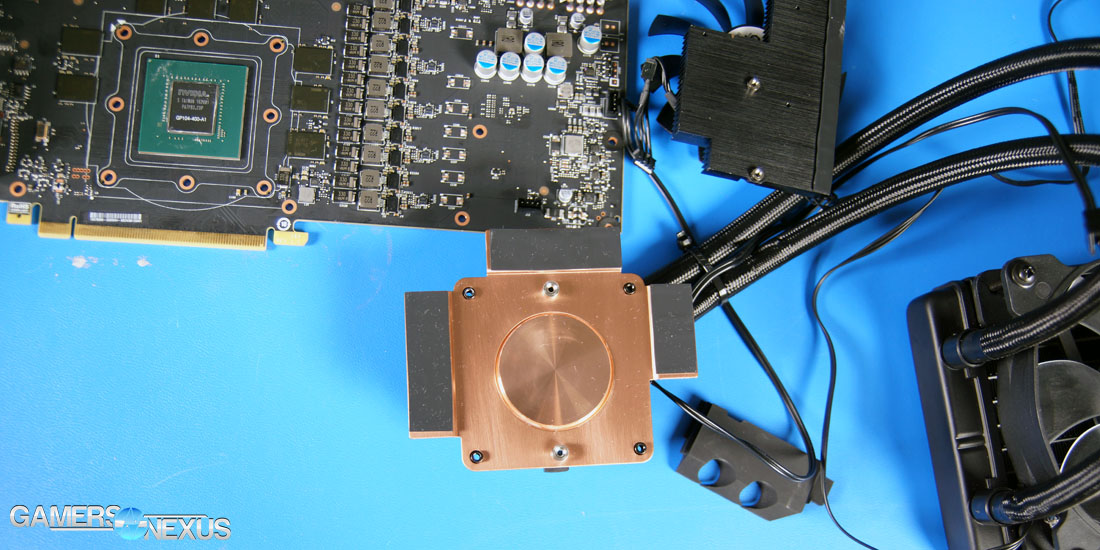
Below: EVGA Hybrid, for comparison.
Again, the above is EVGA's cooler.
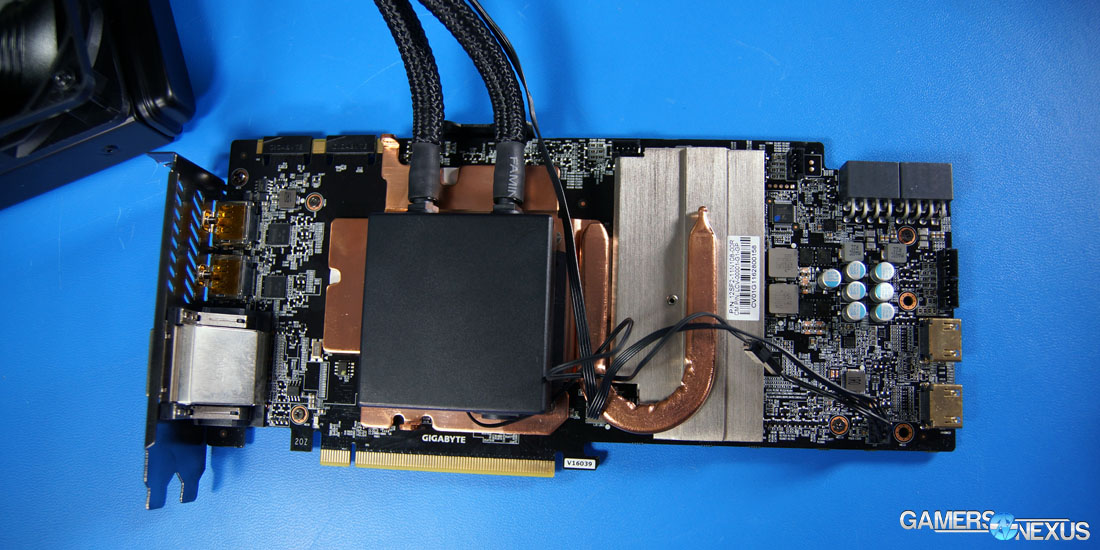
Speaking of, the VRM is also cooled by this solution. The copper plate attached to the VRAM is connected via heatpipe (soldered) to an aluminum heatsink, attached to the MOSFETs, inductors, and capacitor bank. That heatsink pulls heat away from the VRM components and transfers the heat to the heatpipe, which transfers to the copper VRAM plate, which terminates in the CLC coldplate and gets wicked away through normal liquid cooler functionality.
We believe that the outflow barb is the one located closest to the VRM, important only insofar as mitigating the impact on GPU temperature by the VRM components. It is also possible that CM is doing some flow-routing under the hood that helps strategically guide cooler liquid (“new” coolant) through the GPU first, but that seems less likely. We were unable to dismantle the cooler as this is a reader's card on loan, but maybe in the future.
The fan pushes a pretty high RPM – upwards of 3000 – because no VRM/VRAM blower fan is present on this board. Gigabyte has opted to reduce total fan count in favor of a complete liquid solution; in that regard, the Xtreme Water Force is the closest to the full coverage blocks used with open loop coolers. Noise overall is theoretically reduced by using just one fan and liquid cooling everything, but we'll talk about that more later.
PET tubing is used on the cooler, making it more rigid and similar to a bendy straw in its movement. This type of tubing has an inner coating along the plastic that helps insulate the coolant, aiding in reducing permeation and keeping lower temperatures. The downside is that PET coatings can be easily cracked if the tube is bent too much, increasing permeation and liquid loss down the line. This is contrary to the other common tubing material, a low-permeation rubber used for the EVGA and Sea Hawk coolers by Asetek. Both are commonly used materials at this point, and play the primary role of extending life of the unit by reducing permeation.
Continue to Page 2 for testing methodology.
Test Methodology
Game Test Methodology
We tested using our GPU test bench, detailed in the table below. Our thanks to supporting hardware vendors for supplying some of the test components.
AMD 16.8.1 drivers were used for the RX 470 & 460 graphics cards. 16.7.2 were used for testing GTA V & DOOM (incl. Vulkan patch) on the RX 480. Drivers 16.6.2 were used for all other devices or games. NVidia's 372.54 drivers were used for game (FPS) testing on the GTX 1080 and 1060. The 368.69 drivers were used for other devices. Game settings were manually controlled for the DUT. All games were run at presets defined in their respective charts. We disable brand-supported technologies in games, like The Witcher 3's HairWorks and HBAO. All other game settings are defined in respective game benchmarks, which we publish separately from GPU reviews. Our test courses, in the event manual testing is executed, are also uploaded within that content. This allows others to replicate our results by studying our bench courses. In AMD Radeon Settings, we disable all AMD "optimization" of graphics settings, e.g. filtration, tessellation, and AA techniques. This is to ensure that games are compared as "apples to apples" graphics output. We leave the application in control of its graphics, rather than the IHV. In NVIDIA's control panel, we disable G-Sync for testing (and disable FreeSync for AMD).
Windows 10-64 build 10586 was used for testing.
Each game was tested for 30 seconds in an identical scenario, then repeated three times for parity.
Average FPS, 1% low, and 0.1% low times are measured. We do not measure maximum or minimum FPS results as we consider these numbers to be pure outliers. Instead, we take an average of the lowest 1% of results (1% low) to show real-world, noticeable dips; we then take an average of the lowest 0.1% of results for severe spikes.
| GN Test Bench 2015 | Name | Courtesy Of | Cost |
| Video Card | This is what we're testing! | - | - |
| CPU | Intel i7-5930K CPU | iBUYPOWER | $580 |
| Memory | Corsair Dominator 32GB 3200MHz | Corsair | $210 |
| Motherboard | EVGA X99 Classified | GamersNexus | $365 |
| Power Supply | NZXT 1200W HALE90 V2 | NZXT | $300 |
| SSD | HyperX Savage SSD | Kingston Tech. | $130 |
| Case | Top Deck Tech Station | GamersNexus | $250 |
| CPU Cooler | NZXT Kraken X41 CLC | NZXT | $110 |
For Dx12 and Vulkan API testing, we use built-in benchmark tools and rely upon log generation for our metrics. That data is reported at the engine level.
Video Cards Tested
- Corsair Hydro GFX GTX 1080 ($750)
- Sapphire RX 470 Platinum (~$180?)
- MSI RX 480 Gaming X
- MSI GTX 1060 Gaming X ($290)
- NVIDIA GTX 1060 FE ($300)
- AMD RX 480 8GB ($240)
- NVIDIA GTX 1080 Founders Edition ($700)
- NVIDIA GTX 980 Ti Reference ($650)
- NVIDIA GTX 980 Reference ($460)
- NVIDIA GTX 980 2x SLI Reference ($920)
- AMD R9 Fury X 4GB HBM ($630)
- AMD MSI R9 390X 8GB ($460)
- And more
Thermal Test Methodology
We strongly believe that our thermal testing methodology is among the best on this side of the tech-media industry. We've validated our testing methodology with thermal chambers and have proven near-perfect accuracy of results.
Conducting thermal tests requires careful measurement of temperatures in the surrounding environment. We control for ambient by constantly measuring temperatures with K-Type thermocouples and infrared readers. We then produce charts using a Delta T(emperature) over Ambient value. This value subtracts the thermo-logged ambient value from the measured diode temperatures, producing a delta report of thermals. AIDA64 is used for logging thermals of silicon components, including the GPU diode. We additionally log core utilization and frequencies to ensure all components are firing as expected. Voltage levels are measured in addition to fan speeds, frequencies, and thermals. GPU-Z is deployed for redundancy and validation against AIDA64.
All open bench fans are configured to their maximum speed and connected straight to the PSU. This ensures minimal variance when testing, as automatically controlled fan speeds will reduce reliability of benchmarking. The CPU fan is set to use a custom fan curve that was devised in-house after a series of testing. We use a custom-built open air bench that mounts the CPU radiator out of the way of the airflow channels influencing the GPU, so the CPU heat is dumped where it will have no measurable impact on GPU temperatures.
We use an AMPROBE multi-diode thermocouple reader to log ambient actively. This ambient measurement is used to monitor fluctuations and is subtracted from absolute GPU diode readings to produce a delta value. For these tests, we configured the thermocouple reader's logging interval to 1s, matching the logging interval of GPU-Z and AIDA64. Data is calculated using a custom, in-house spreadsheet and software solution.
Endurance tests are conducted for new architectures or devices of particular interest, like the GTX 1080, R9 Fury X, or GTX 980 Ti Hybrid from EVGA. These endurance tests report temperature versus frequency (sometimes versus FPS), providing a look at how cards interact in real-world gaming scenarios over extended periods of time. Because benchmarks do not inherently burn-in a card for a reasonable play period, we use this test method as a net to isolate and discover issues of thermal throttling or frequency tolerance to temperature.
Our test starts with a two-minute idle period to gauge non-gaming performance. A script automatically triggers the beginning of a GPU-intensive benchmark running MSI Kombustor – Titan Lakes for 1080s. Because we use an in-house script, we are able to perfectly execute and align our tests between passes.
Noise Testing Methodology
Our noise testing methodology is new and still being revised, but has been kept consistent across all tests contained herein. We test noise in a real-world environment and do not presently use an anechoic chamber. The results align with what consumers will encounter in their own rooms.
We use a REED logging dB meter mounted to a tripod, whose mic is positioned 20” from the face of the GPU (mounted in an open bench). The REED meter is approximately 6” above the bench. All open bench fans are disabled. The Kraken X41 CPU cooling fan is configured to its “silent” mode, minimizing its noise output to be effectively imperceptible.
A noise floor measurement is taken prior to each test's execution to determine ambient without any systems running in the room. We then take an idle measurement (GPU & CPU at idle). Our noise floor has a fluctuation of approximately +/-0.6dB.
Noise levels are logarithmic, and are therefore not as simple to perform delta calculations as thermals or framerates. Noise percent differences are calculated using dB=20*log(V2/V1) (where V is amplitude). You cannot perform a simple percent difference calculation to determine the delta. For an example, a 10dB range (50dB vs. 40dB) is not equal to a 22% delta.
After the noise floor is determined, we log idle fan dB, 50% speed dB, and 100% speed dB (configured in Afterburner). We also measure auto fan dB at an identical stepping for every test; we do this by running Kombustor for exactly 5 minutes prior to beginning dB logging, which is useful for fans which use two push fans. Some dual-push fan cards will only trigger the second fan if the VRM is under load.
Power Testing Methodology
Power consumption is measured at the system level. You can read a full power consumption guide and watt requirements here. When reading power consumption charts, do not read them as a GPU-specific requirements – this is a system-level power draw.
Power draw is measured during a FireStrike Extreme - GFX2 run. We are currently rebuilding our power benchmark.
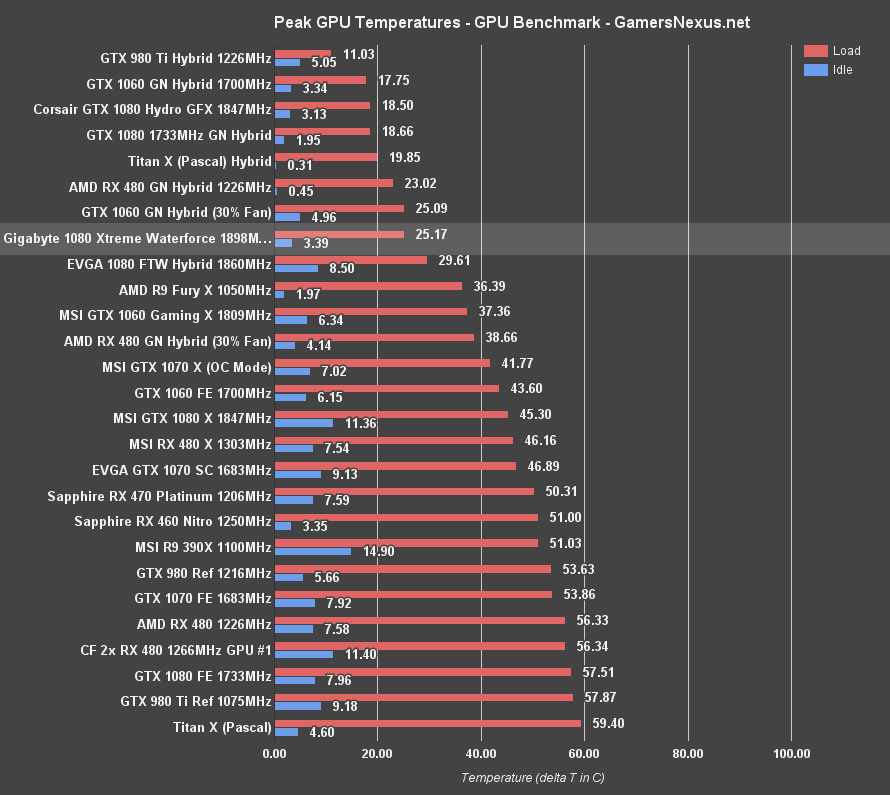
Gigabyte GTX 1080 Xtreme WF Temperatures at Peak Load
Looking at average temperature during peak load, the Gigabyte 1080 Xtreme WaterForce card manages to run at about 25.17C delta T over ambient, with an idle of 3.39C. That places Gigabyte's solution between the Corsair/MSI Sea Hawk, at 18.5C, and the EVGA 1080 FTW, at 29.61C. Pump RPM likely plays a role, the fan choice plays a big role – as we explored in the EVGA 1080 FTW vs. Sea Hawk content – and voltage has some impact.
Gigabyte's card runs at a higher voltage than EVGA's, at 1.05v, and EVGA's runs higher than Corsair's. Gigabyte's clock-rate is also higher, which leads us to believe that the Cooler Master solution is likely running a higher pump RPM, better isolates the GPU portion of the coldplate, and the fan has some impact on temperature performance, too.
Gigabyte GTX 1080 Xtreme WF Temperature over Time
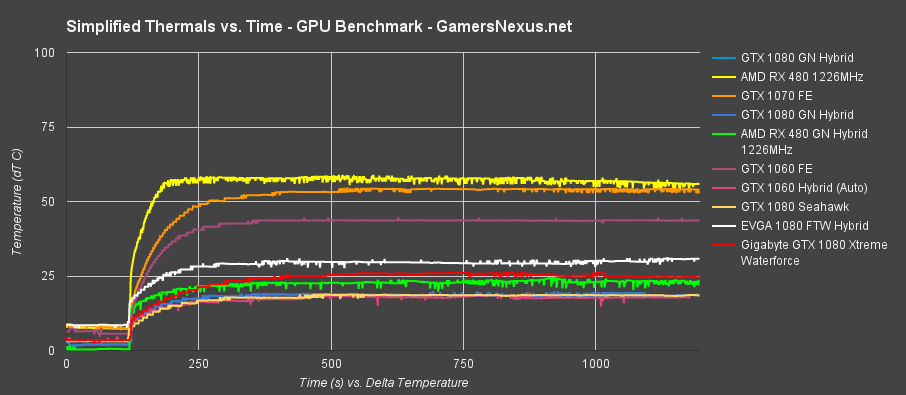
Here's a look at the over time charts. It's the same data, just plotted against time on the X-axis. This shows our test automation kicking off at the same point for all cards, which reveals ramp-up time:
Gigabyte GTX 1080 Xtreme WF Endurance Test
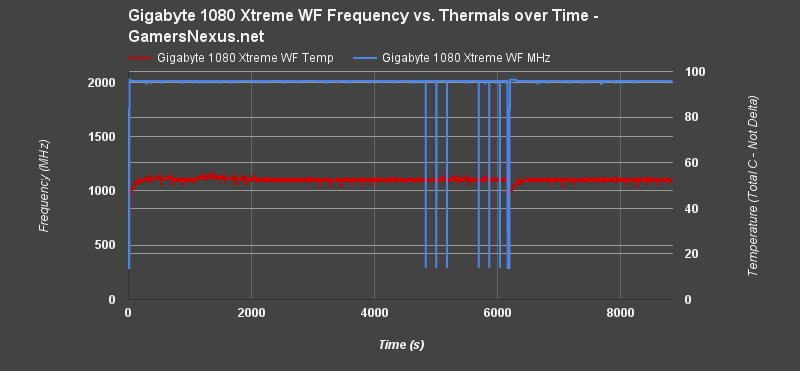
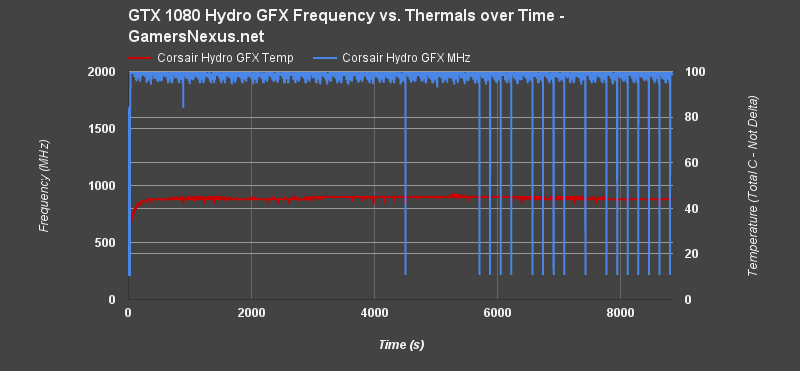
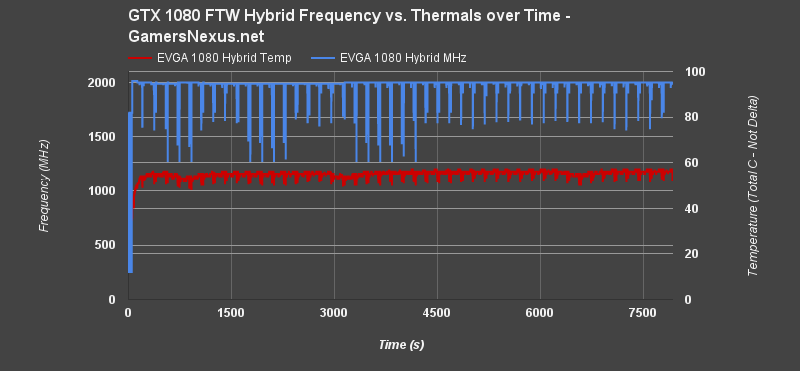
This endurance chart shows the Gigabyte GTX 1080 Xtreme WaterForce card's performance over a two-hour endurance run. As we've seen with numerous nVidia GPUs this generation, the card is clock-dropping several times after the 80-minute area of testing. Clock drops fall to about 235MHz with this card and normally last for 1 second during some GPU Boost functionality; in one instance, though, we had a 30-second period of reduced clock-rates that caused a visual “freeze” in our Metro: Last Light loop. This is something we're still exploring with this architecture. NVidia believes the one-second drops to be part of normal GPU Boost 3.0 functionality, as GPU Boost will find any possible time to reduce its clock-rate in favor of power and thermals. If the card thinks it can get away with such a reduction, it'll do it. We have a lot more work to do on this research, though.
In the meantime, what we can see is generally comparable performance to the other cards, except with a nearly perfectly flat clock-rate. That's what you want, and is a testament to Gigabyte's thermal and power solutions. GPU Boost is able to sustain its high clock-rate of about 2012MHz for the entire test, and that's because thermal isn't an issue and voltage runs at 1.05v. In this regard, the card outperforms its other liquid-cooled competition. The Sea Hawk X and EVGA FTW cards have far spikier clock-rates during normal operation.
Here are the endurance charts for the Sea Hawk and Hybrid solutions:
Gigabyte Xtreme vs. EVGA Hybrid vs. Sea Hawk Noise
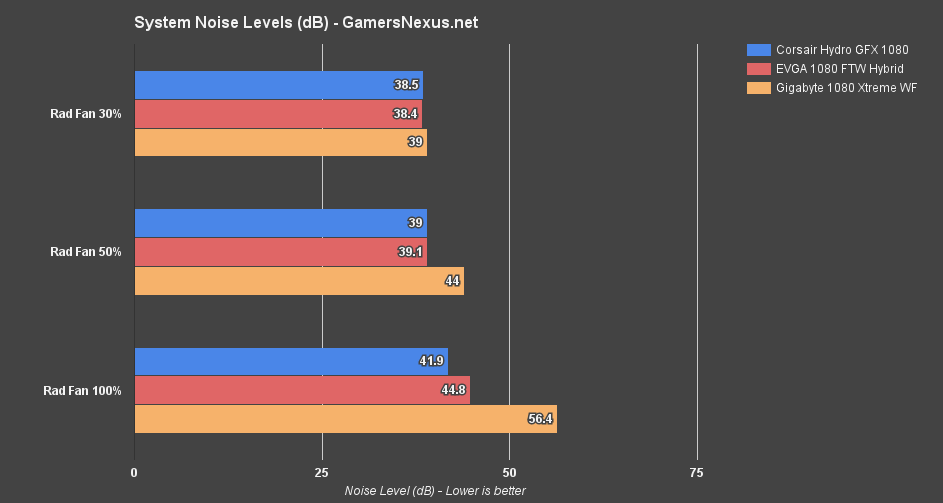
This chart shows total system noise. The noise floor and other test information is described on Page 2: Test Methodology.
The fan speeds above are strictly representing radiator fan configuration. EVGA and Corsair must be manually configured to their speeds by the motherboard (though EVGA does auto control its fan via connection to the PCB, if preferred). Gigabyte's fan can be controlled through MSI Afterburner or other OC software, as it's the only fan present in the system and plugs straight into the PWM board header.
Note that each fan could be run at about 30% and still achieve a temperature that is comparable to (or lower than, in some cases) the higher end air-cooled card performance. That is why we've included the 30% fan speed test.
Until hitting 100% radiator fan speed, we're seeing fairly comparable performance. EVGA and MSI are effectively identical to one another, even with the vastly different VRM fans. Gigabyte's ~3000RPM solution has a higher RPM ceiling to handle the heat of an entire PCB, and thus can run louder.
One thing that doesn't show up in the tests is the pump gurgling. Over an extended period of usage, the Gigabyte pump will occasionally gurgle and 'burp,' as if it's routinely sucking air through the system. This occurs even with the tubes mounted per manufacturer spec to reduce noise. On our loaner test unit, the issue was not constant, but did occur frequently enough to notice. This card is actually the reader's second unit, because the first made loud enough noise to warrant an RMA by Sean.
DOOM Benchmark (Vulkan & OpenGL) – Gigabyte Xtreme vs. EVGA FTW Hybrid
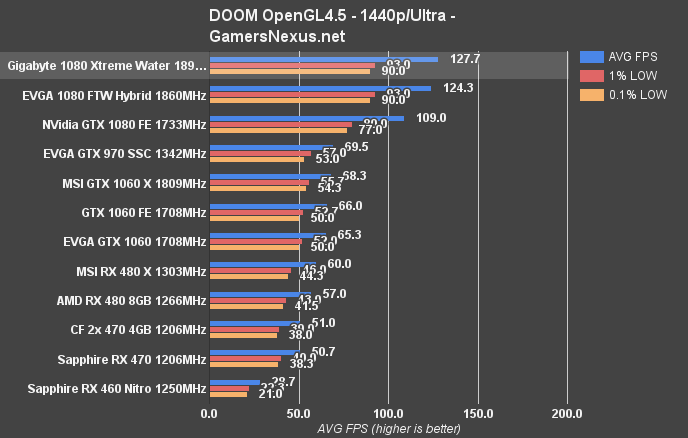
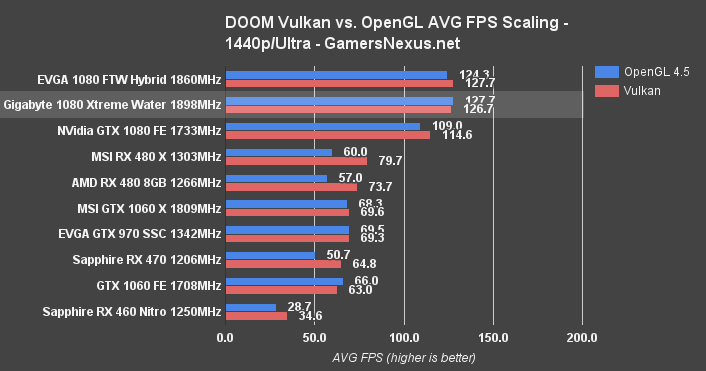
DOOM at 1440p/Ultra positions the Gigabyte Xtreme WaterForce card just above the EVGA solution for OpenGL tests, with Gigabyte at 127.7FPS AVG and identical 1% and 0.1% lows to the EVGA FTW Hybrid. The Hybrid runs a 124.3FPS AVG. The two cards are, for the most part, identical in OpenGL performance for DOOM. This remains true when we switch over to Vulkan, positioning the cards within reasonable Boost variance of one another when considering current DOOM Vulkan and nVidia performance.
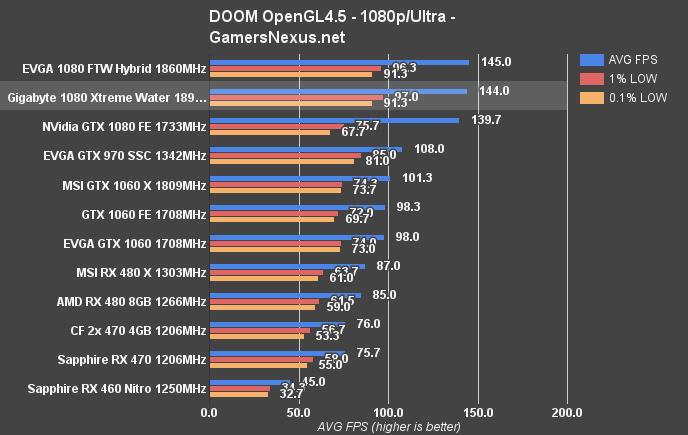
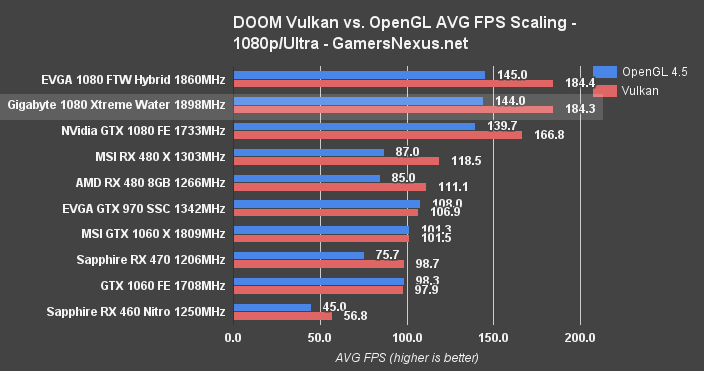
At 1080p/Ultra, the cards are effectively identical in Vulkan performance. The 0.1FPS difference is within variance, and can be ignored as equal. OpenGL performance is also mostly the same, with the two barely trading blows in averages and in 1% lows. There is no significant difference between these cards in the DOOM benchmark.
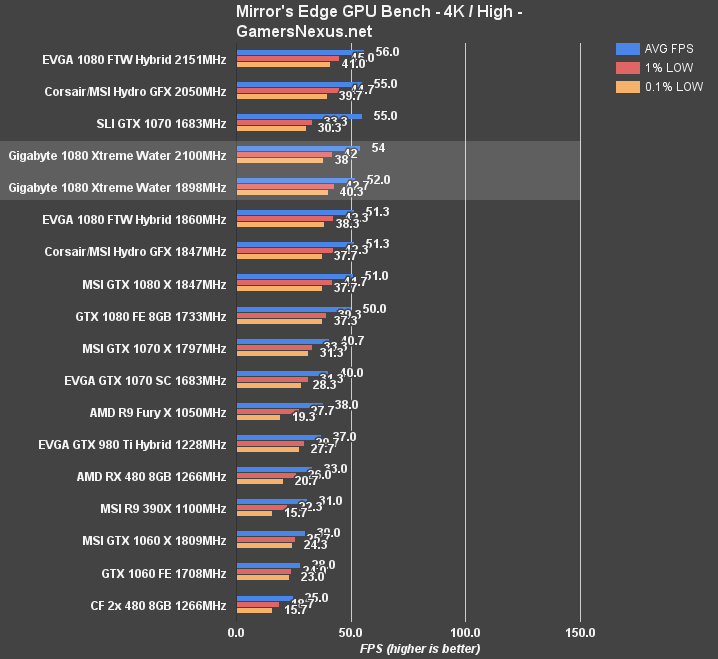
Mirror's Edge Catalyst – Gigabyte 1080 Xtreme vs. Twin Frozr, Sea Hawk
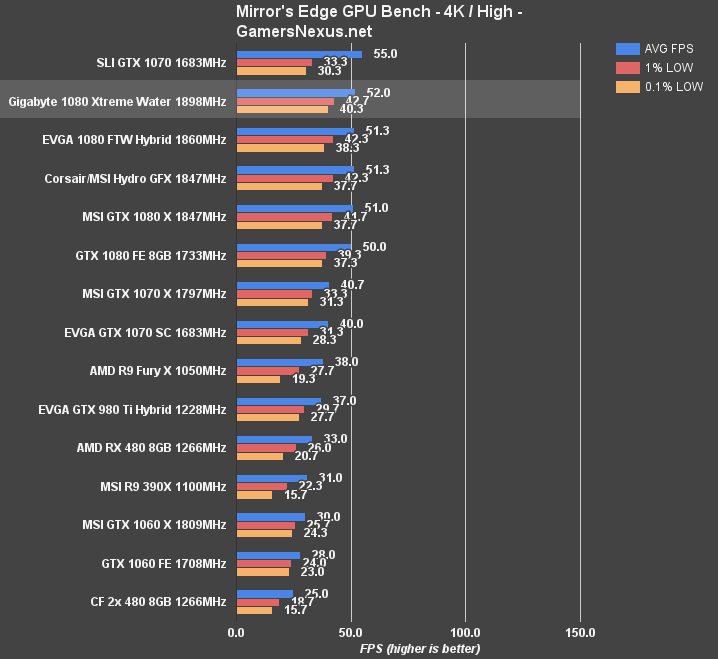
4K/High settings in Mirror's Edge: Catalyst positions the Gigabyte card marginally ahead of the tied EVGA Hybrid and MSI Sea Hawk cards, with 52FPS AVG and 42.7FPS 1% lows. All three liquid-cooled GTX 1080s, and the MSI Twin Frozr air-cooled 1080, are performing mostly identically.
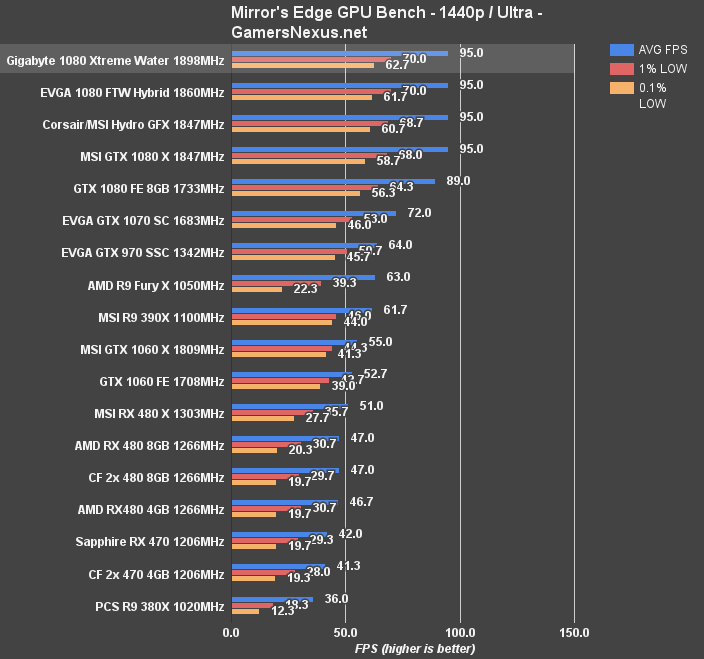
1440p also shows this, with a 95FPS average across the three liquid-cooled cards and the one Twin Frozr card.
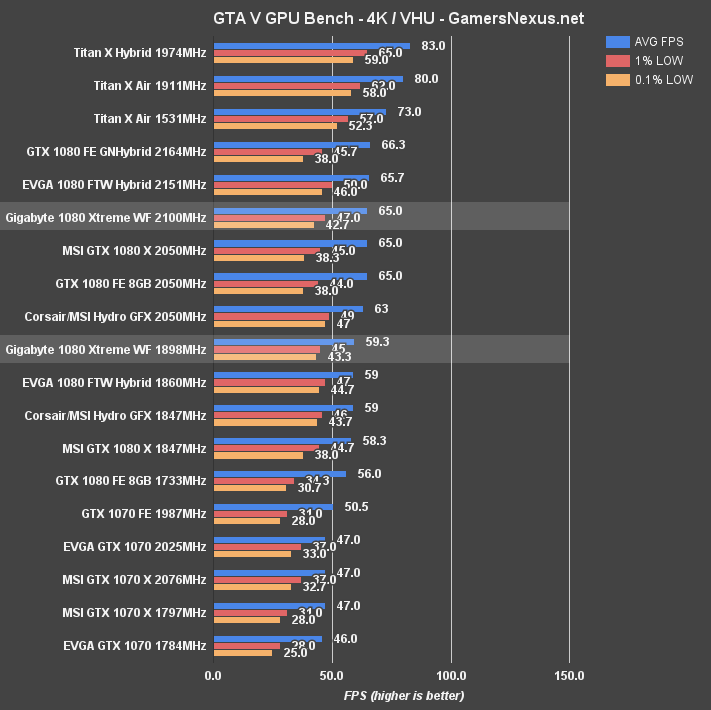
GTA V – Gigabyte 1080 Xtreme WF vs. Sea Hawk, Hybrid
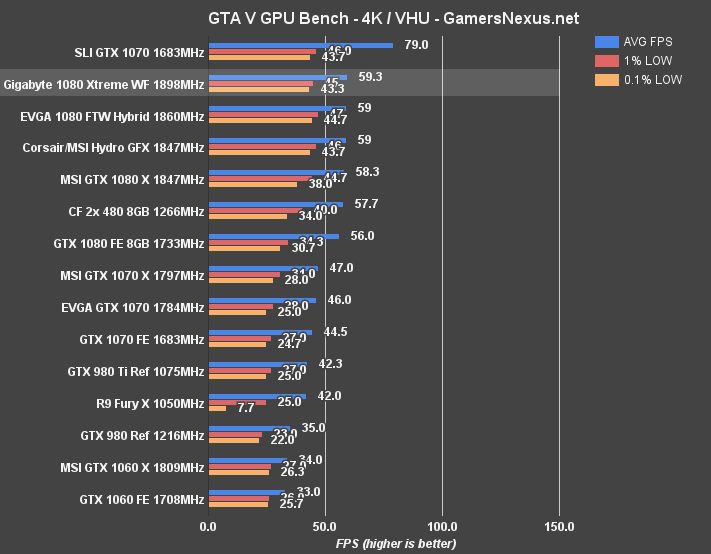
As with the previous two games, we're seeing basically equal performance on the Gigabyte 1080 Xtreme WaterForce card as with the Hybrid and Hydro GFX solutions for GTA V. Around the boards, AVG FPS is about ~59 and 1% lows are 45-47FPS. Nothing exciting with these FPS benchmarks, but that's what you expect when testing three cards with the same GPU.
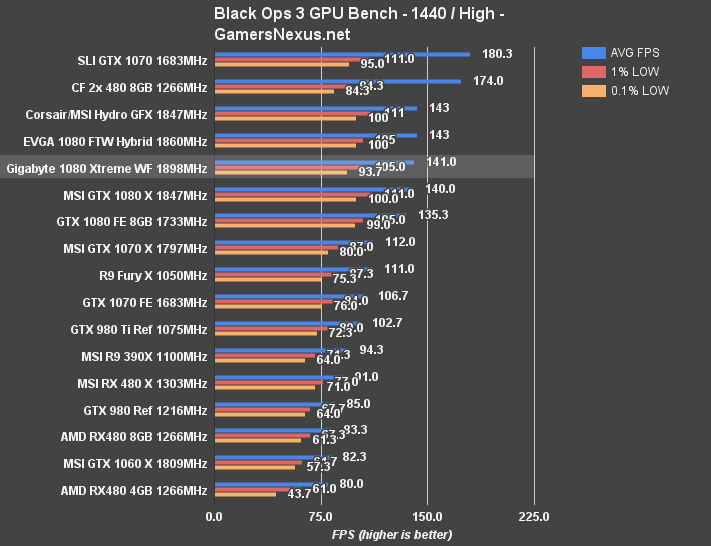
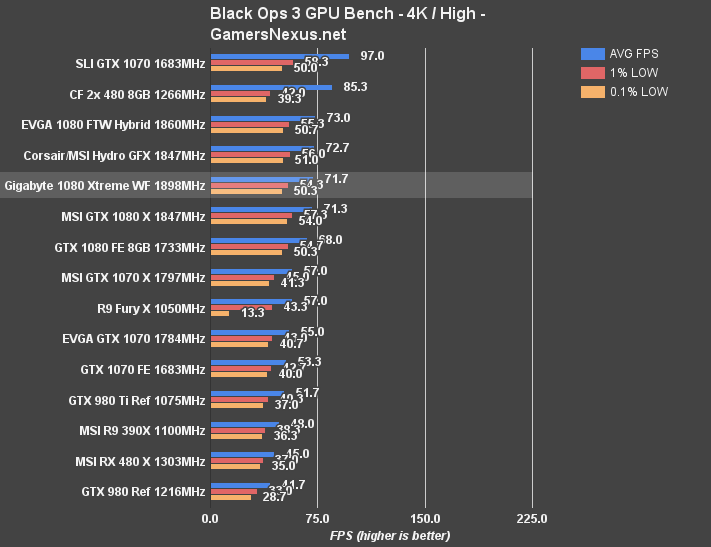
Black Ops III - Gigabyte 1080 Xtreme Water Force Benchmark
Continue to the next page for overclocking.
Overclocking the Gigabyte GTX 1080 Xtreme Water Force
Our maximum achieved overclock on the Gigabyte GTX 1080 Xtreme liquid-cooled card was stable at 2100.5MHz, peaking at 2151.5MHz on occasion. That had the card operating with an offset of 100MHz on core, 400MHz on memory, and the maximum +50% power. The card's memory clock settled at 11GHz effective.
With a 100% voltage offset, we lost stability within a few minutes of testing, though the action did allow momentary increases in core offset. This offset was reduced and removed in later validation, as we found the OC performed better without it. A voltage offset eats into TDP, anyway.
Gigabyte GTX 1080 Xtreme Water Force OC Results
| Peak Core CLK | Core Clock (MHz) | Core Offset (MHz) | Mem CLK (MHz) | Mem Offset (MHz) | Power Target (%) | Peak vCore (V) | Fan Target (%) | 5m Test | 60m Endurance |
| 2037.5 | 2012 | 0 | 1275.8 | 0 | 100 | 1.062 | 25 | P | P |
| 2037.5 | 2012 | 0 | 1275.8 | 0 | 150 | 1.062 | 25 | P | P |
| 2037.5 | 2012 | 0 | 1275.8 | 0 | 150 | 1.093 (+ Offset) | 25 | P | - |
| 2126 | 2113.5 | 100 | 1275.8 | 0 | 150 | 1.093 | 30 | P | - |
| - | - | 150 | 1275.8 | 0 | 150 | 1.093 | 30 | F Instant driver crash | - |
| 2164 | 2134 | 125 | 1275.8 | 0 | 150 | 1.093 | 30 | F Driver crash | - |
| 2164 | 2126 | 125 | 1275.8 | 0 | 150 | 1.062-1.093 (Reduce offset) | 30 | P | - |
| 2164 | 2126 | 150 | 1275.8 | 0 | 150 | 1.062-1.093 (Reduce offset) | 30 | F | - |
| 2164 | 2126 | 125 | 1400.6 | 500 | 150 | 1.062-1.093 (Reduce offset) | 30 | F | - |
| 2164 | 2126 | 125 | 1275.8 | 300 | 150 | 1.062-1.093 (Reduce offset) | 30 | F | - |
| 2164 | 2126 | 125 | 1275.8 | 0 | 150 | 1.062-1.093 (Reduce offset) | 30 | P | F |
| 2164 | 2126 | 125 | 1275.8 | 0 | 150 | 1.093 | 30 | F | - |
| 2151.5 | 2126 | 115 | 1275.8 | 0 | 150 | 1.062-1.093 (Reduce offset) | 30 | P | F |
| 2151.5 | 2100.5 | 100 | 1275.8 | 0 | 150 | 1.062-1.093 (Reduce offset) | 30 | P | P |
| 2151.5 | 2100.5 | 100 | 1400.8 | 500 | 150 | 1.062-1.093 (Reduce offset) | 30 | P | F |
| 2151.5 | 2100.5 | 100 | 1363.5 | 350 | 150 | 1.062-1.093 (Reduce offset) | 30 | P | P |
| 2151.5 | 2100.5 | 100 | 1375 | 400 | 150 | 1.062-1.093 (Reduce offset) | 30 | P | P |
Here's the OC stepping table.
Our own 1080 Founders Edition Hybrid custom mod is still the best overclocker we've tested from this generation, but all the board partner cards seem to be lucky if capable of achieving a 2100MHz clock-rate.
As shown in the other OC stepping tables, the EVGA card managed a higher stable overclock at 2151.5MHz with a peak at 2164MHz. MSI's Sea Hawk maxed out at a 2050MHz stable core clock, with peaks at 2126MHz in our test. The MSI card runs a reference board, though, and is more simplistic in its power and thermal design than the Gigabyte and EVGA solutions.
EVGA GTX 1080 FTW Hybrid OC Stepping
| Peak Core CLK | Core Clock (MHz) | Core Offset (MHz) | Mem CLK (MHz) | Mem Offset (MHz) | Power Target (%) | Peak vCore (V) | Fan Target (%) | 5m Test | 60m Endurance |
| 1999.5 | 1987 | 0 | 1251.5 | 0 | 100 | 1.062 | 60 (Auto) | P | P |
| 1999.5 | 1999.5 | 0 | 1251.5 | 0 | 130 | 1.062 | 63 (Auto) | P | P |
| 2088 | 2088 | 100 | 1251.5 | 0 | 130 | 1.062 | 63 (Auto) | P | - |
| 2113.5 | 2113.5 | 125 | 1251.5 | 0 | 130 | 1.062 | 66 (Auto) | P | - |
| 2164 | - | 175 | 1251.5 | 0 | 130 | 1.062 | 66 (Auto) | F | - |
| 2164 | 2138.5 | 150 | 1251.5 | 0 | 130 | 1.062 | 66 (Auto) | P | - |
| 2164 | 2151.5 | 160 | 1251.5 | 0 | 130 | 1.062 | 66 (Auto) | F | - |
| 2164 | 2138.5 | 150 | 1251.5 | 0 | 130 | 1.062 | 66 (Auto) | P | - |
| 2164 | 2138.5 | 150 | 1377 | 500 | 130 | 1.062 | 100 (Move to mobo) | P | - |
| 2164 | 2151.5 | 150 | 1425.6 | 700 | 130 | 1.081 | 100 (Move to mobo) | F Black Flickering | - |
| 2164 | 2151.5 | 150 | - | 650 | 130 | 1.081 | 100 (Move to mobo) | F Black Flickering | - |
| 2164 | 2151.5 | 150 | 1405.7 | 625 | 130 | 1.081 | 100 (Move to mobo) | P | P |
MSI GTX 1080 Sea Hawk OC Stepping
| Peak Core CLK | Core Clock (MHz) | Core Offset (MHz) | Mem CLK (MHz) | Mem Offset (MHz) | Power Target (%) | Peak vCore (V) | Fan Target (%) | 5m Test | 60m Endurance |
| 1949 | 1898 | 0 | 1251.5 | 0 | 100 | 1 | 33 (Auto) | P | P |
| 1949 | 1911 | 0 | 1251.5 | 0 | 105 | 1 | 33 (Auto) | P | P |
| 1974 | 1936 | 50 | 1251.5 | 0 | 105 | 1.012 | 33 (Auto) | P | P |
| 2012 | 1961.5 | 100 | 1251.5 | 0 | 105 | 1.012 | 33 (Auto) | P | - |
| 2037.5 | 1987 | 125 | 1251.5 | 0 | 105 | 1.012 | 48 (Auto) | P | - |
| 2062.5 | 2012 | 175 | 1251.5 | 0 | 105 | 1.012 | 50 (Auto) | P | - |
| 2075.5 | 2012 | 200 | 1251.5 | 0 | 105 | 1.012 | 54 (Auto) | F Artifacts | - |
| 2176.5 | 2012 | 200 | 1251.5 | 0 | 105 | 1.05 | 54 (Auto) | F Instant system crash | - |
| 2126 | 2050 | 175 | 1410.8 | 650 | 105 | 1.05 | 54 (Auto) | P | P |
Overclocking FPS Impact
The FPS charts post similar results to previous OC attempts with the EVGA FTW Hybrid and MSI Sea Hawk X. We're not seeing any major differentiation between the cards with FPS from overclocking, something of a trend of late with this generation of high-end GPUs.
Continue to the final page for the conclusion.
Conclusion: Gigabyte GTX 1080 Xtreme Water Force vs. EVGA Hybrid, MSI Sea Hawk
The Gigabyte GTX 1080 Xtreme WaterForce card was bought by Sean for $770 from Newegg, making it the most expensive GTX 1080 we've worked with yet. EVGA's Hybrid is priced at $730 and Corsair's Hydro GFX is normally $750, though seems to have fallen to $740. The Hydro GFX / Sea Hawk is the least impressive of the bunch, purely from the cooling and PCB standpoint, and should be reduced in price. EVGA's Hybrid is closer to an agreeable price, but Gigabyte is way out in orbit on pricing. If the card falls to $730-$750, it'd be more agreeable.
The removal of one fan and an overall improved cooling solution does mean that, theoretically, Gigabyte is capable of running a lower fan RPM (manually configured and locked) and lower overall noise level. Unfortunately, because of the pump gurgling, that advantage is mostly eliminated. The cards tend to rest around the same volume levels, all things considered, and are only differentiated meaningfully when the Gigabyte card is pushed to 100% RPM.
The PCB and liquid cooling solution are both of high-quality make on the Gigabyte board. The real-world gain in overclocking is effectively non-existent, unfortunately, so don't expect any significant additional headroom out of this card than out of the FTW Hybrid. Stock clocks do have the Gigabyte unit operating at a higher and more consistent frequency (other than the endurance clock-drops that we're seeing on most Pascal cards), but again, the level of these cards does make the differences less significant.
As it stands right now, EVGA's Hybrid is tough to beat for the price, and cools largely the same components other than the VRM. Overclocking differences favor the Hybrid, but that can be pointed at as manufacturing differences more than anything. We would suggest ruling out the MSI/Corsair card until price is more competitive with the Hybrid and, if it falls closer to $730-$750, the Water Force card.
One item that we've not yet discussed is the benefit of a single fan cooler, aside from noise. Gigabyte's solution eliminates the need to clean a difficult-to-access VRM fan, so if preventative maintenance and dust management are important to your build, Gigabyte does have the best solution on the market for that. On the whole, Gigabyte's cooler is far more sophisticated than its competition, and we hope other vendors consider following suit with the VRM cooling. The isolation of the coldplate and use of a heatpipe help reduce the impact of VRM heat on the GPU diode readings, something that EVGA was unable to avoid with its own shared VRAM + GPU cooling solution.
If Gigabyte's card hits the ~$750 price and EVGA's remains about $730, it becomes a question of dust management, aesthetics, and noise. We'd generally recommend the EVGA unit right now for its value and reduced / mostly non-existent pump noise, but have to give credit to Gigabyte for a well-designed cooler.
Editorial, Test Lead: Steve “Lelldorianx” Burke
Video: Andrew “ColossalCake” Coleman
Test Technician: Andie “Draguelian” Burke
Test Technician: Carter Harris
PCB Analyst: Buildzoid
