AMD's RX 470 has been on our time table since May, when the pre-Computex press event informed us of a “mid-July” release. Well, it's mid-July – wait.
August 4th. It's August 4th. The RX 470 is available effective today, coinciding with embargo lift on reviews, and we've had time to thoroughly analyze the card's performance. The RX 470 is a partner card and will not be available as a reference model, though some partner cards may as well be reference models; they're using the reference RX 480 cooler, just with new colors, back-plates, or LEDs.
AMD has positioned its RX 470 in the sub-$200 market, listing its MSRP as $180. AIB partners will price their cards according to any custom coolers or pre-overclocks applied, though the floor has been set, more or less. That plants the 470 in a presently unchallenged market position: AMD's biggest current-gen competition in this price-range is its own RX 480 4GB card, the GTX 1060 being nVidia's lowest tier offering.
Before our deep-dive review on the Sapphire RX 470 Platinum, card architecture, thermal & endurance throttles, power, and FPS, let's run through the specs.
Current Gen GPU Reviews
AMD RX 460, RX 470, & RX 480 Specs
| AMD RX 480 | AMD RX 470 | AMD RX 460 | |
| Architecture | Polaris 10 | Polaris 10 | Polaris 11 |
| Compute Units (CUs) | 36 | 32 | 14 |
| Stream Processors | 2304 | 2048 | 864 |
| Base / Boost Clock | 1120MHz / 1266MHz | 926MHz / 1206MHz | 1090MHz / 1200MHz |
| COMPUTE Performance | >5 TFLOPS | Up to 4.9TFLOPs | Up to 2.2TFLOPs |
| Graphics Command Processor (GCP) | 1 | 1 | 1 |
| ACEs | 4 | 4 | 2 |
| HWS | 2 | 2 | 2 |
| TMUs | 144 | 128 | 56 |
| ROPs | 32 | 32 | 16 |
| Geometry Processors | 4 | 4 | 2 |
| Peak Texture Filter Rate | 182.3GT/s | 154.4GT/s | 57.6GT/s |
| Peak Pixel Filter Rate | 40.5GP/s | 38.6GP/s | 19.2GP/s |
| L2 Cache | 2MB | ? | 1MB |
| LSU | 576x32b | ? | 256x32b |
| VRAM Capacity | 4GB GDDR5 @ 7Gbps 8GB GDDR5 @ 8Gbps | 4GB GDDR5 | 2GB GDDR5 |
| Memory Interface | 256-bit | 256-bit | 128-bit |
| Memory Speed | 7Gbps (4GB model) 8Gbps (8GB model) | 6.6Gbps | 7Gbps |
| Memory Bandwidth | 224GB/s (4GB model) 256GB/s (8GB model) | 211GB/s | 112GB/s |
| TDP | 150W | 120W* | 75W |
| Power Connectors | 6-pin | 6-pin | None (Slot only) |
| Display Port | 1.3 HBR / 1.4 HDR | 1.3/1.4 HDR | 1.3/1.4 HDR |
| Release Date | June 29 | August 4 | August 8 |
Polaris 10 vs. Polaris 11 Specs & Architecture
| Polaris 10 | Polaris 11 | |
| Compute Units (CUs) | 36 | 16 |
| COMPUTE Performance | “>5 TFLOPS” | “>2 TFLOPS” |
| Memory Interface | 256-bit | 128-bit |
| Architecture | Gen 4 GCN | Gen 4 GCN |
| Playback Support | 4K encode/decode | 4K encode/decode |
| Output Standard | DP1.3/1.4 HDR | DP1.3/1.4 HDR |
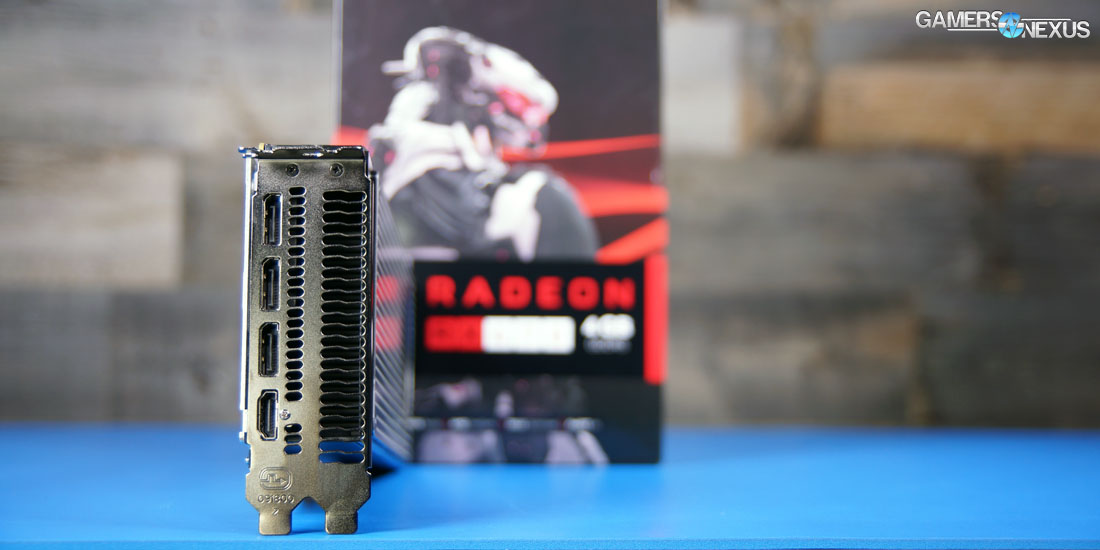
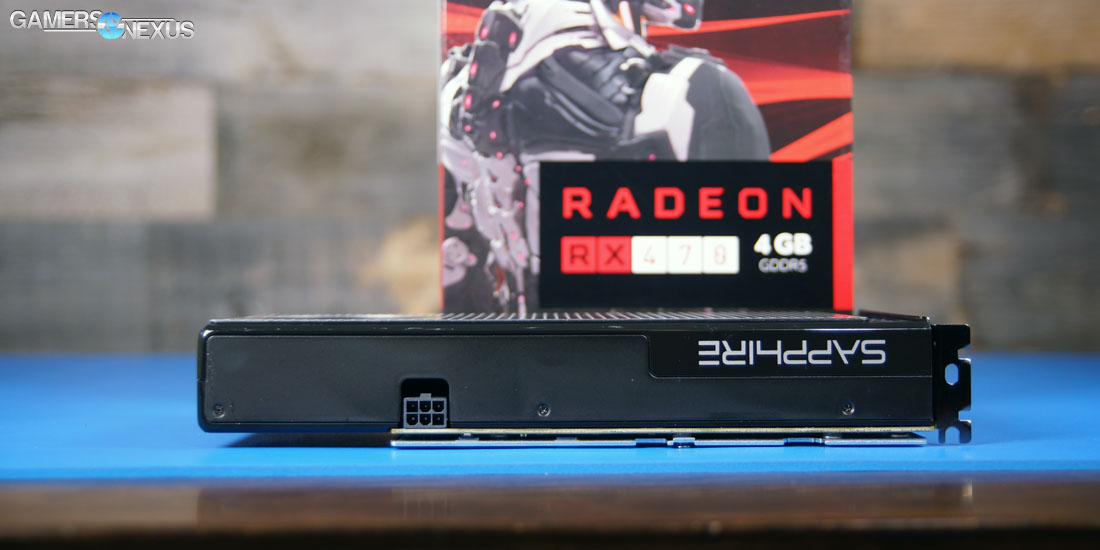
The AMD Radeon RX 470 and RX 460 graphics cards are considered “partner cards,” meaning reference variants will not exist for the low-end. We received the Sapphire RX 470 Platinum Edition for review, which we'll discuss with greater specificity below.
The RX 470 is on the Polaris 10 GPU architecture, as is the RX 480, and so low-level functions will remain mostly identical to what we described in our RX 480 review. The RX 470 is a slightly trimmed-down version of the RX 480 GPU, running 32 CUs (Compute Units) rather than the 36 CUs found on the RX 480. The Polaris 10 architecture runs 64 Stream Processors per CU, resulting in a chip with 2048 SPs for the RX 470. For reference, the RX 480 hosts 2304 Stream Processors.
AMD's core clock is listed as 926MHz base / 1206MHz boost for the RX 470, but partner models will have room to increase that clock-rate with pre-overclocks. We'll test overclocking later in the review. COMPUTE performance scales up to about 4.9TFLOPs on the RX 470.
The memory subsystem and data compression algorithms function as described in our original Polaris / RX 480 write-up, but at a slower speed. The RX 470 has a variable memory speed range of ~6.6~7.0Gbps (our card runs at 1750MHz actual), but is still on a 256-bit bus and capable of producing bandwidth upwards of 211GB/s. The RX 470 is available only as a 4GB card, with no 8GB models available; memory is GDDR5 for this platform, as it has been for the rest of Polaris.
The 4GB VRAM capacity means that AMD's closest current-gen competition is its own RX 480 4GB card, something we'll show in benchmarks later.
TDP for the RX 470 sits at 120W; interestingly, we were originally told to expect a 110W TDP at the May press event – but specs were unfinalized at the time. As a reminder, TDP is not a measure of actual power draw by the graphics card, but a measurement of cooling requirements for the chip. To this end, AMD and nVidia products are not comparable in their TDP values. You will need to look at actual power draw and thermal benchmarks to learn about comparative performance between manufacturers. A single 6-pin header and the PCI-e bus are responsible for powering the RX 470, though partners may modify this if desired.
Launch Day RX 470 Prices & Models
(Update - Here's a list of available card, as of this post going live:)
| Brand | Model | Price |
| PowerColor | PCS Red DEVIL RX 470 | $180 |
| XFX | RX 470 RS Triple X | $210 |
| XFX | RX 470 RS Black Edition True OC | $220 |
| Gigabyte | RX 470 G1 Gaming | $200 |
| Sapphire | RX 470 Nitro+ 8GB | $240 |
| Sapphire | RX 470 Nitro+ 4GB | $210 |
| Sapphire | RX 470 Platinum | $200 |
Polaris 10 Architecture Refresh
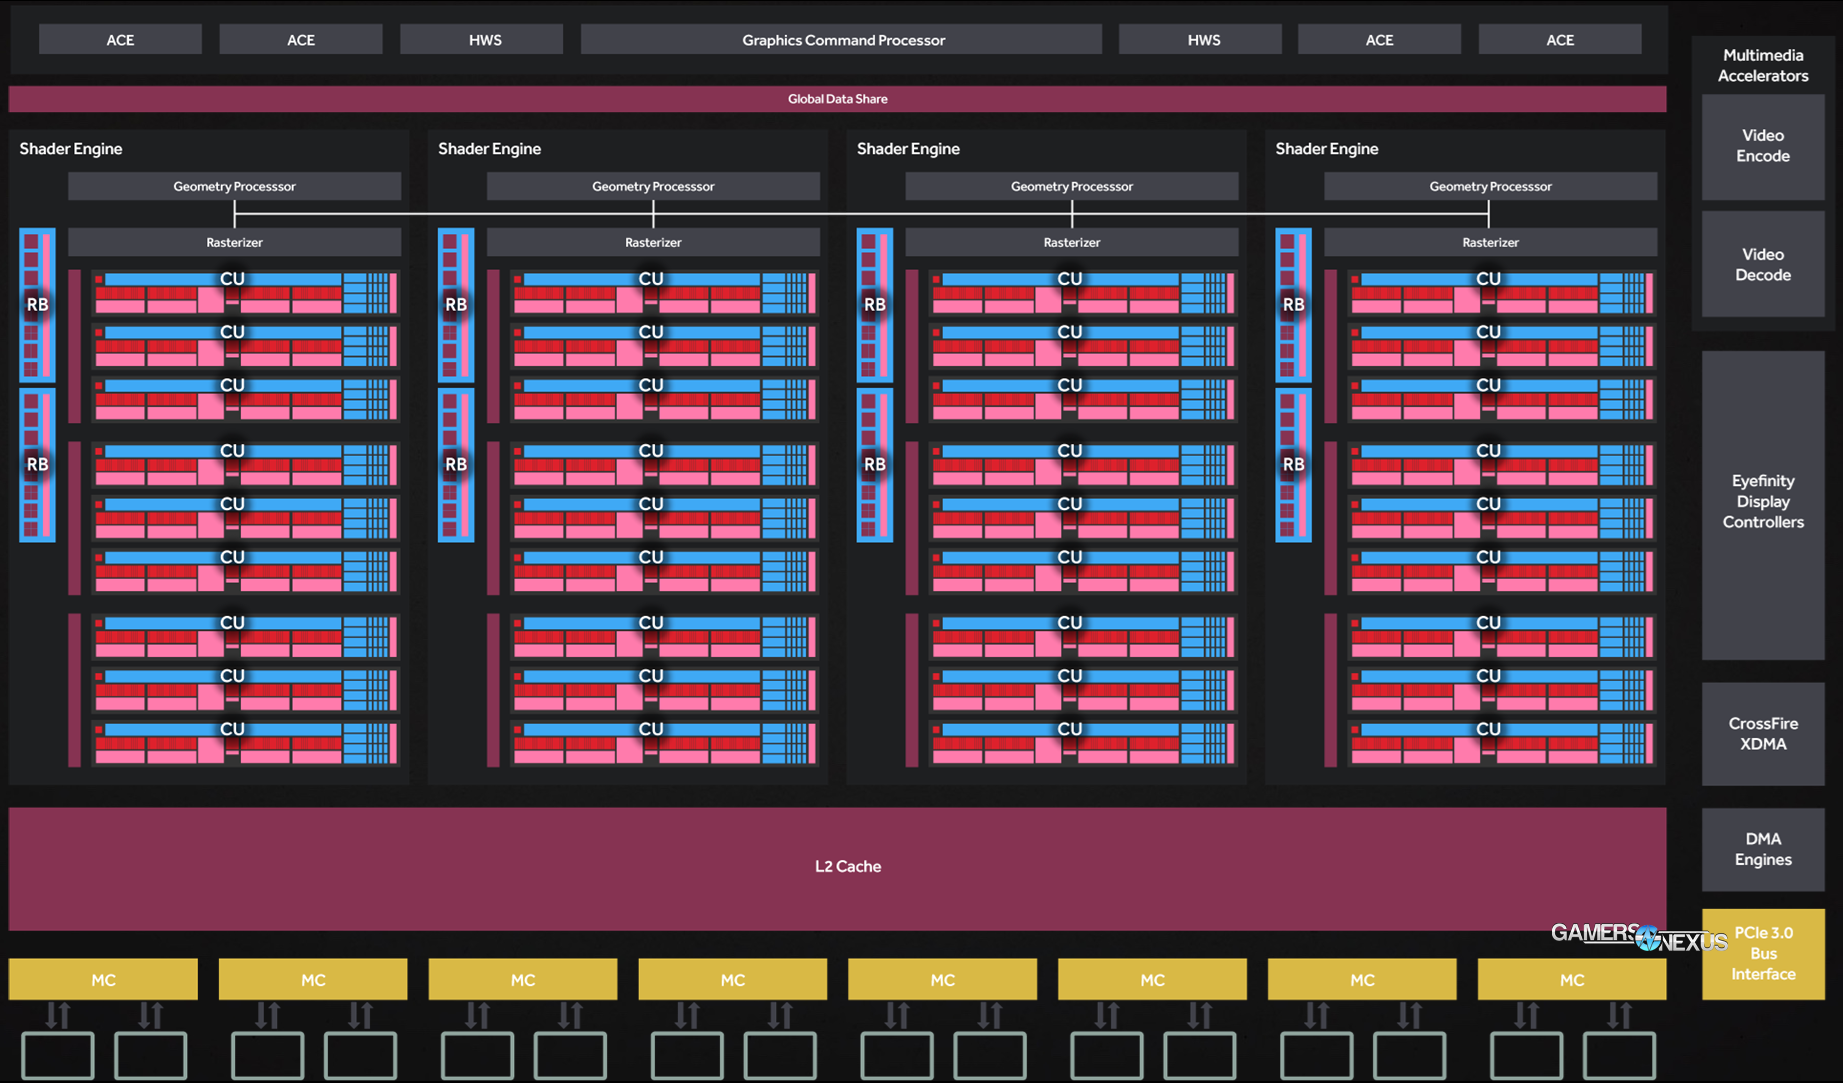
Architecturally, the RX 470 & 480 block diagrams will look largely the same – just with fewer CUs on the RX 470:
Above is the Polaris 10 block diagram that was provided for the RX 480. Mentally remove four CUs to create the RX 470 block diagram.
Polaris focused heavily on power efficiency improvements, working to leverage the new Global Foundries FinFET process in accompaniment with low-level optimizations. FinFET transistors, as we've explained a few times, use a three-dimensional design that extrudes a fin to form the drain and source of the transistor. The gate surrounds the fins, reducing power leakage at an infinitesimal level for cumulative efficiency improvement across the board.
AMD also optimized its datapath and data compression, both reducing bits transmitted and, as a result, power consumption. Memory uses a non-trivial amount of power and has seen reductions upwards of 40% in energy consumption per transacted bit. This is why AMD and nVidia spend each launch hyping up their new implementations of delta color compression, or the process of analyzing a scene for nearby comparable colors and compressing them into fewer colors. Calculations can then be applied to the compressed colors to extract the original value, hence “delta” color compression: Only a delta value is needed (the difference between, for instance, a compressed, neutral blue and the original light blue – like #0079f0). This reduces time crunching colors significantly, as color can be reduced on a scale of 8:1 maximally. A skybox is the easiest example of potential 4:1 or 8:1 delta color compression (DCC).
With memory energy consumption reduced, more power is potentially made available to the cores (but a net reduction in energy consumption is still the target scenario). Like the RX 480 – and every other known Polaris chip – the RX 470 uses 7 DPM states that scale from “sleep” (DPM1) to fully unlocked (DPM7). In between, the card adjusts along a volt-frequency curve to manage its power consumption for each frequency level, pursuant to the active DPM state.
Additional reductions to energy consumption were made by clock gating and power gating any under-utilized circuits, which cooperate with a heuristic pre-fetch routine to occupy all available cycles with instructions.
A single graphics command processor oversees instructions inbound from the CPU and dispatches those instructions, almost as a “forward,” to the new-ish Hardware Schedulers (HWS). We explain this process in our original RX 480 review, pasted here:
“The back-end of the render pipeline (GCP → Setup Engine → Scheduler / CEs) begins tasking incoming resources appropriately to low-level GPU components (some virtualized, some physical – ACEs, for instance, are a physical compute resources on the silicon). The Graphics Command Processor takes instruction from the CPU and sends it to the scheduler, which is a GPU component. The scheduler then begins the process of managing a familiar graphics pipeline (discussed here), e.g. drawing primitives and geometry, performing light/shading passes, eventually fetching textures, applying transforms, and preparing to rasterize the output. Post-processing, as always, happens at the end of the pipeline.”
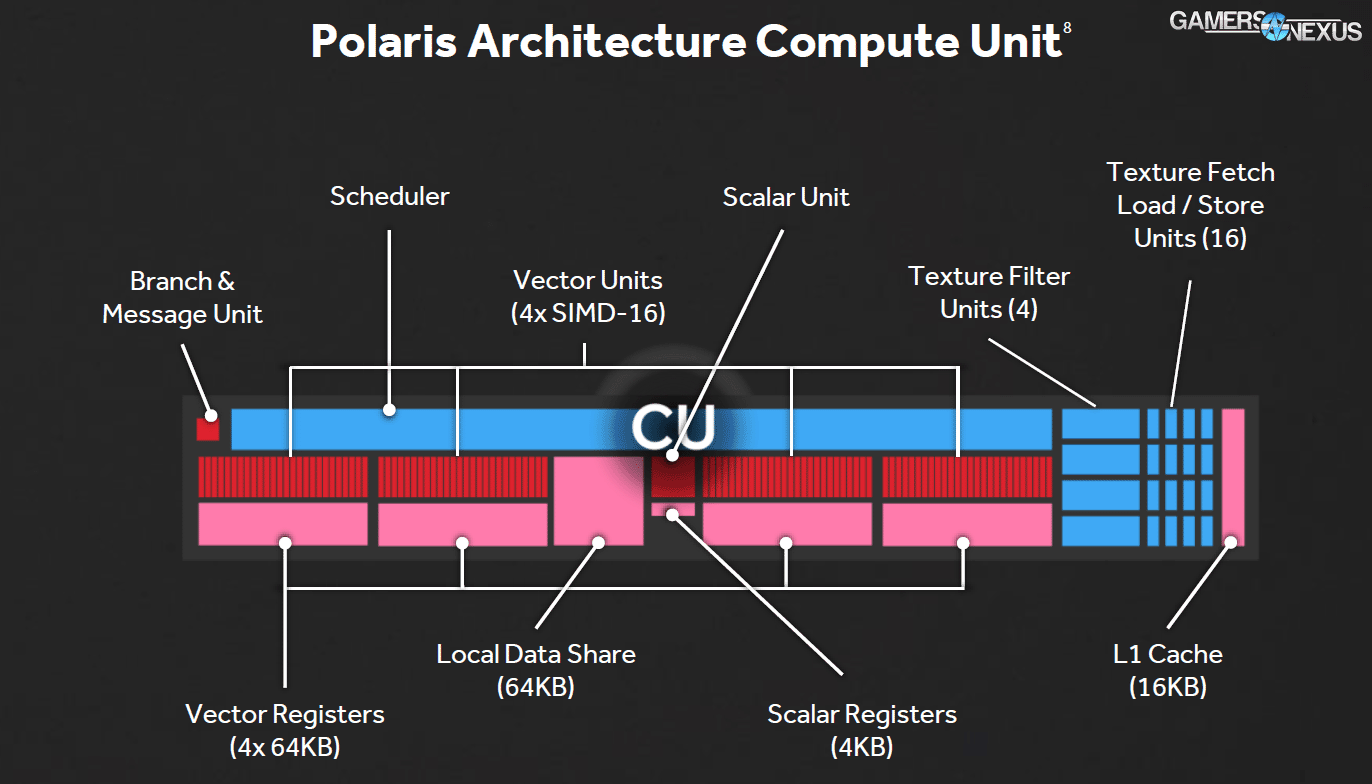
And here's a look at the Polaris Compute Unit block diagram:
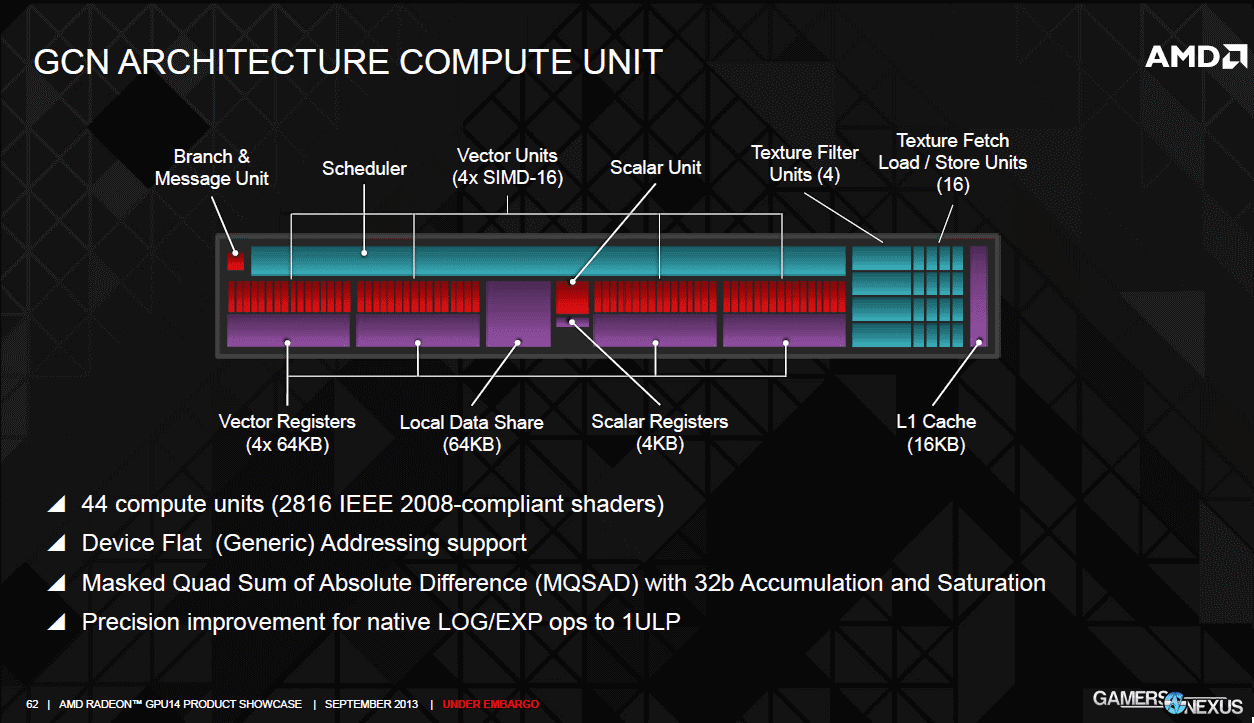
Basically the same in CU layout as the previous generation of GCN. See Gen 3 below:
Sapphire RX 470 Platinum Edition Specs
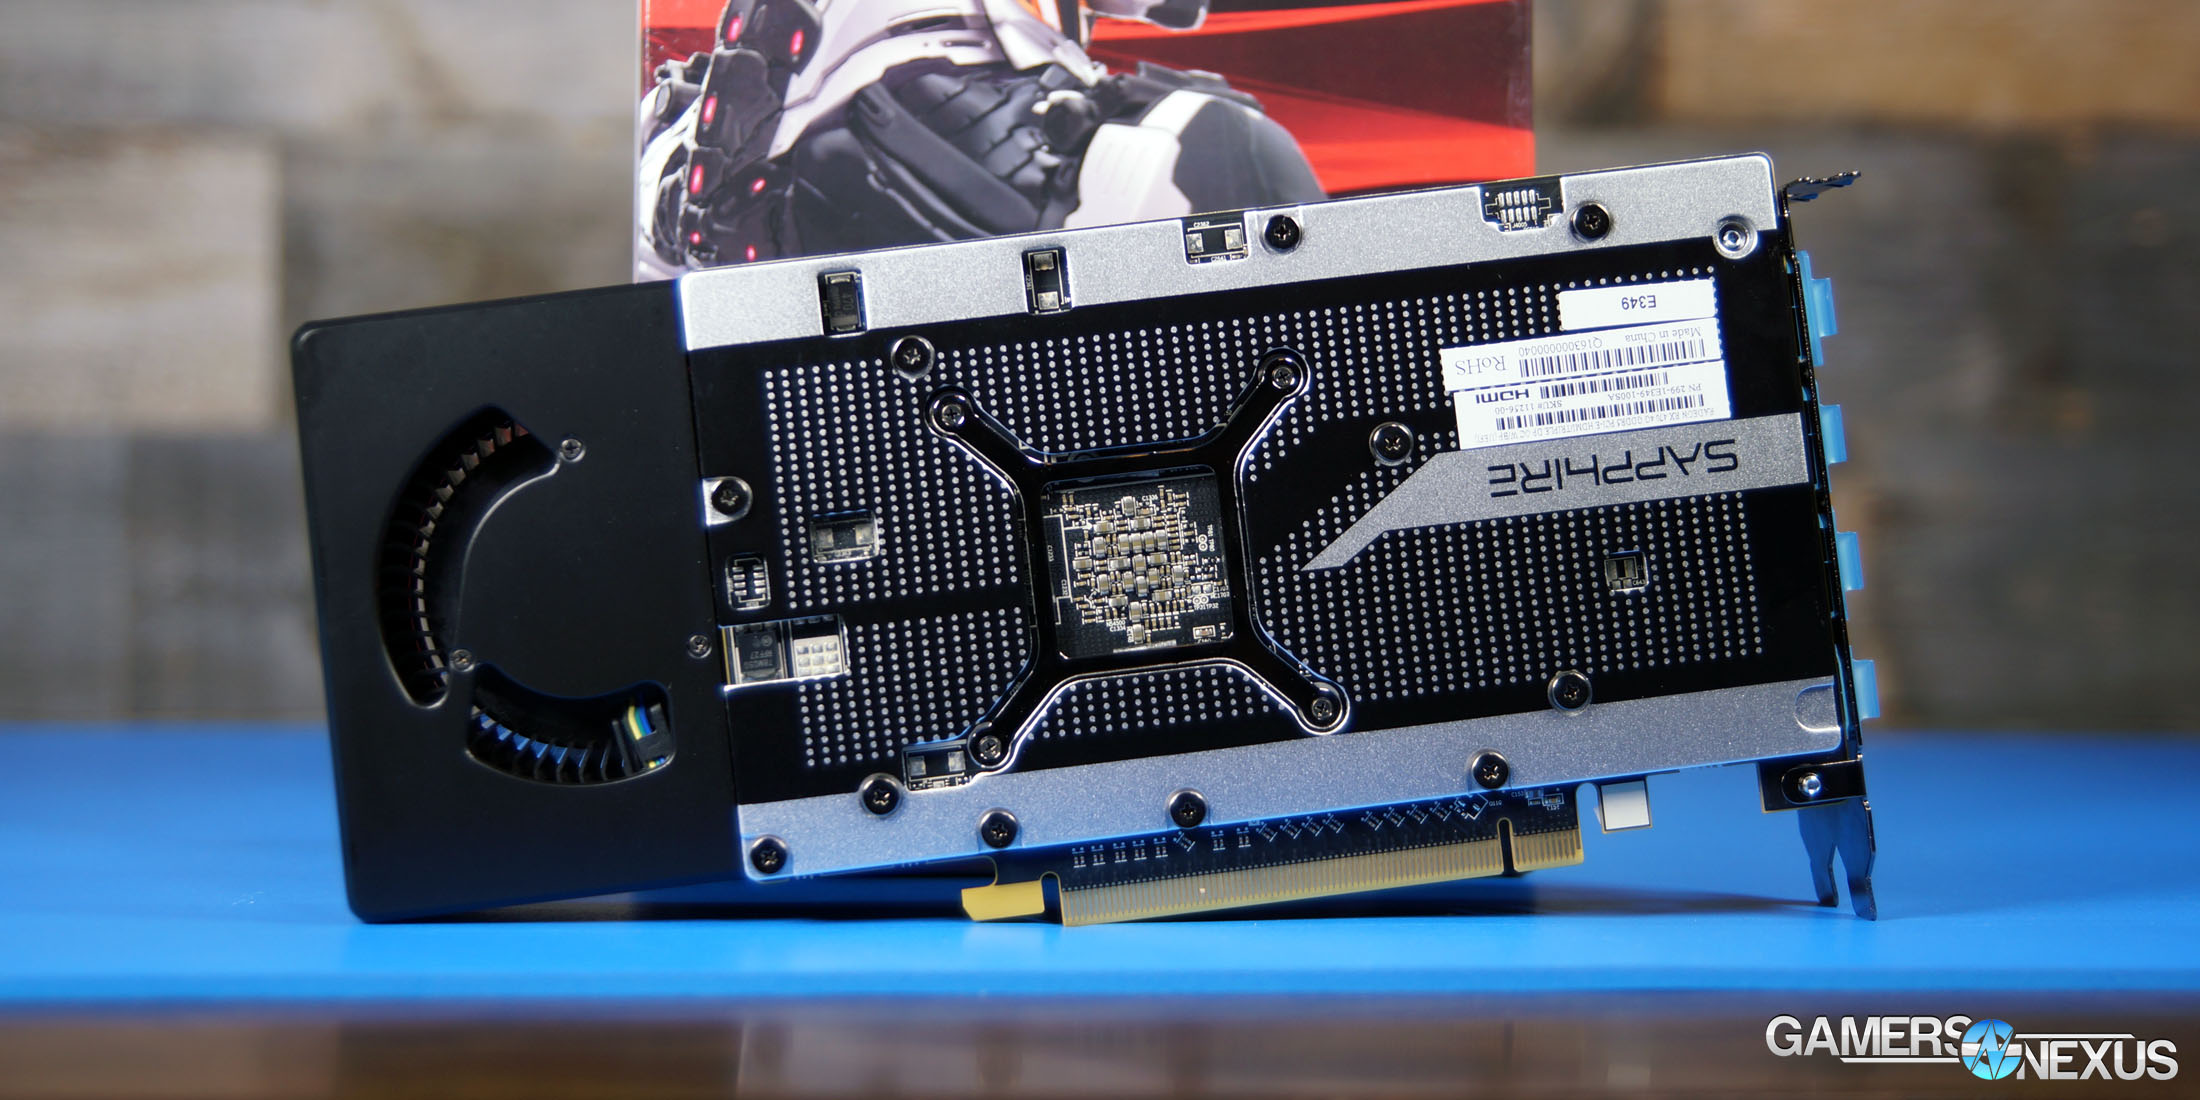
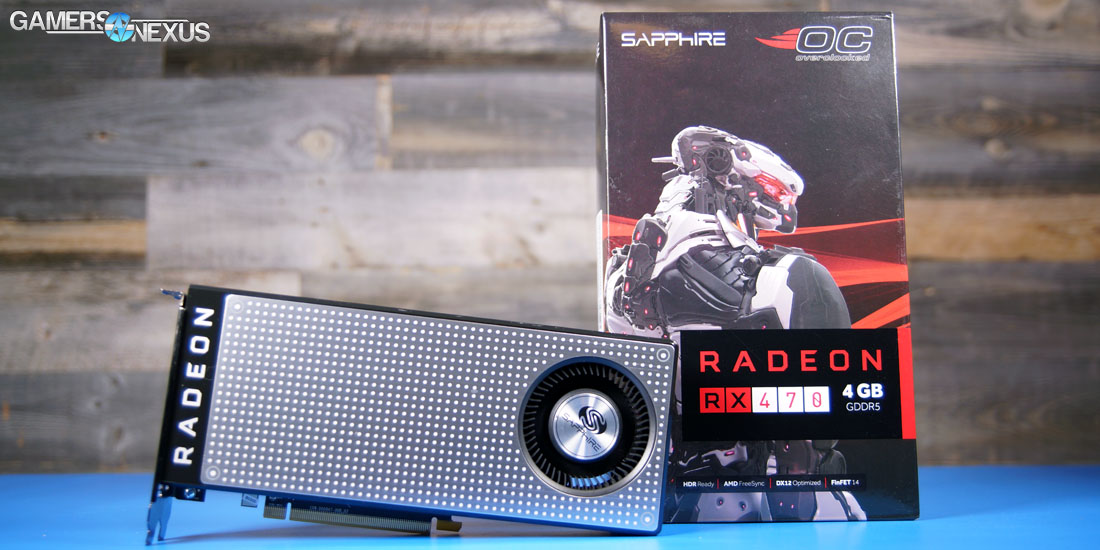
Sapphire's RX 470 Platinum Edition uses the reference RX 480 cooler, which we exposed and detailed in our tear-down of the 480. It's painted silver, hence “platinum,” but is otherwise the same as the reference cooler. Aside from a difference of paint, the RX 470 Platinum Edition also includes a back-plate and ~10MHz pre-overclock, though we rarely hit the 1216MHz “up to” rate advertised. Most of our logged testing still sat around 1206MHz, depending on the game.
So, then, the RX 470 Platinum Edition is about as close to a true “reference” RX 470 as we'll get, since AMD won't be making any. Even the board is effectively the same, which we'll look at in a video shortly.
Now, that stated, the RX 470 Platinum Edition does have a few differences in its fan configuration and programming. Our model maxes out at around 4000 RPM, a good deal lower than the 5200RPM screaming max of the RX 480 Reference card.
Let's move on. Enough theory and design discussion. Continue to page 2 for testing methodology.
Game Test Methodology
We tested using our GPU test bench, detailed in the table below. Our thanks to supporting hardware vendors for supplying some of the test components.
The AMD 16.7.3 drivers were skipped for testing, following serious stability issues. We used 16.8.1 for the RX 470 graphics card, which were unreleased review drivers at time of writing. 16.7.2 were used for testing GTA V & DOOM (incl. Vulkan patch) on the RX 480. Drivers 16.6.2 were used for all other devices or games. NVidia's unreleased 368.64 drivers were used for game (FPS) testing on the GTX 1060. The 368.69 drivers were used for other devices. Game settings were manually controlled for the DUT. All games were run at presets defined in their respective charts. We disable brand-supported technologies in games, like The Witcher 3's HairWorks and HBAO. All other game settings are defined in respective game benchmarks, which we publish separately from GPU reviews. Our test courses, in the event manual testing is executed, are also uploaded within that content. This allows others to replicate our results by studying our bench courses. In AMD Radeon Settings, we disable all AMD "optimization" of graphics settings, e.g. filtration, tessellation, and AA techniques. This is to ensure that games are compared as "apples to apples" graphics output. We leave the application in control of its graphics, rather than the IHV. In NVIDIA's control panel, we disable G-Sync for testing (and disable FreeSync for AMD).
Windows 10-64 build 10586 was used for testing.
Each game was tested for 30 seconds in an identical scenario, then repeated three times for parity.
Average FPS, 1% low, and 0.1% low times are measured. We do not measure maximum or minimum FPS results as we consider these numbers to be pure outliers. Instead, we take an average of the lowest 1% of results (1% low) to show real-world, noticeable dips; we then take an average of the lowest 0.1% of results for severe spikes.
| GN Test Bench 2015 | Name | Courtesy Of | Cost |
| Video Card | This is what we're testing! | - | - |
| CPU | Intel i7-5930K CPU | iBUYPOWER | $580 |
| Memory | Corsair Dominator 32GB 3200MHz | Corsair | $210 |
| Motherboard | EVGA X99 Classified | GamersNexus | $365 |
| Power Supply | NZXT 1200W HALE90 V2 | NZXT | $300 |
| SSD | HyperX Savage SSD | Kingston Tech. | $130 |
| Case | Top Deck Tech Station | GamersNexus | $250 |
| CPU Cooler | NZXT Kraken X41 CLC | NZXT | $110 |
For Dx12 and Vulkan API testing, we use built-in benchmark tools and rely upon log generation for our metrics. That data is reported at the engine level.
Video Cards Tested
- Sapphire RX 470 Platinum (~$180?)
- MSI RX 480 Gaming X
- MSI GTX 1060 Gaming X ($290)
- NVIDIA GTX 1060 FE ($300)
- AMD RX 480 8GB ($240)
- NVIDIA GTX 1080 Founders Edition ($700)
- NVIDIA GTX 980 Ti Reference ($650)
- NVIDIA GTX 980 Reference ($460)
- NVIDIA GTX 980 2x SLI Reference ($920)
- AMD R9 Fury X 4GB HBM ($630)
- AMD MSI R9 390X 8GB ($460)
- And more
Thermal Test Methodology
We strongly believe that our thermal testing methodology is among the best on this side of the tech-media industry. We've validated our testing methodology with thermal chambers and have proven near-perfect accuracy of results.
Conducting thermal tests requires careful measurement of temperatures in the surrounding environment. We control for ambient by constantly measuring temperatures with K-Type thermocouples and infrared readers. We then produce charts using a Delta T(emperature) over Ambient value. This value subtracts the thermo-logged ambient value from the measured diode temperatures, producing a delta report of thermals. AIDA64 is used for logging thermals of silicon components, including the GPU diode. We additionally log core utilization and frequencies to ensure all components are firing as expected. Voltage levels are measured in addition to fan speeds, frequencies, and thermals. GPU-Z is deployed for redundancy and validation against AIDA64.
All open bench fans are configured to their maximum speed and connected straight to the PSU. This ensures minimal variance when testing, as automatically controlled fan speeds will reduce reliability of benchmarking. The CPU fan is set to use a custom fan curve that was devised in-house after a series of testing. We use a custom-built open air bench that mounts the CPU radiator out of the way of the airflow channels influencing the GPU, so the CPU heat is dumped where it will have no measurable impact on GPU temperatures.
We use an AMPROBE multi-diode thermocouple reader to log ambient actively. This ambient measurement is used to monitor fluctuations and is subtracted from absolute GPU diode readings to produce a delta value. For these tests, we configured the thermocouple reader's logging interval to 1s, matching the logging interval of GPU-Z and AIDA64. Data is calculated using a custom, in-house spreadsheet and software solution.
Endurance tests are conducted for new architectures or devices of particular interest, like the GTX 1080, R9 Fury X, or GTX 980 Ti Hybrid from EVGA. These endurance tests report temperature versus frequency (sometimes versus FPS), providing a look at how cards interact in real-world gaming scenarios over extended periods of time. Because benchmarks do not inherently burn-in a card for a reasonable play period, we use this test method as a net to isolate and discover issues of thermal throttling or frequency tolerance to temperature.
Our test starts with a two-minute idle period to gauge non-gaming performance. A script automatically triggers the beginning of a GPU-intensive benchmark running MSI Kombustor – Titan Lakes for 1080s. Because we use an in-house script, we are able to perfectly execute and align our tests between passes.
Power Testing Methodology
Power consumption is measured at the system level. You can read a full power consumption guide and watt requirements here. When reading power consumption charts, do not read them as a GPU-specific requirements – this is a system-level power draw.
Power draw is measured during a FireStrike Extreme - GFX2 run. We are currently rebuilding our power benchmark.
Continue to page 3 for thermals, throttling, and power.
AMD RX 470 Thermal Benchmark vs. RX 480, GTX 1060, More
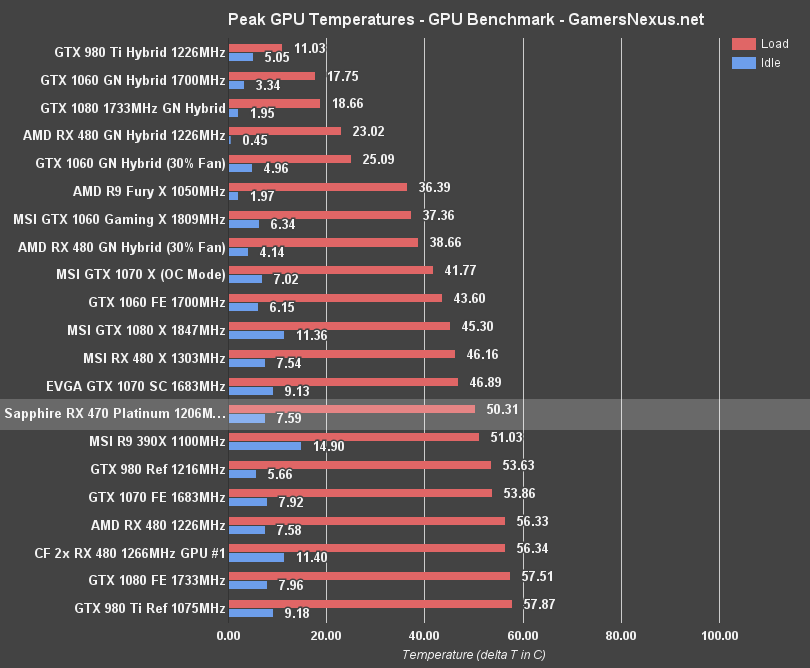
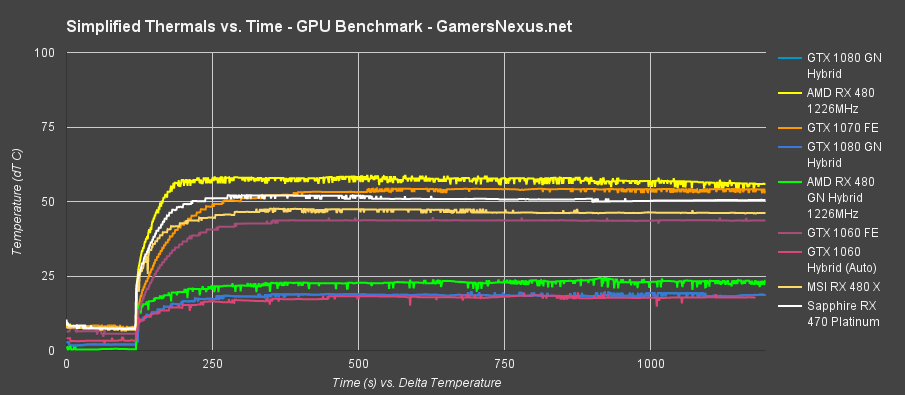
Our “Averaged Peak Thermals” chart plots temperature as a Delta T over Ambient value, explained on Page 2, if you're unfamiliar with what that means. Our testing methods are also described in these “What is Delta T?” and this “Why Our Thermal Tests Are So Accurate – Thermal Chamber” videos. The short thermal test is also presented as an over-time value, which is mostly used for internal data validation, but also useful to view ramp-up times and “saturation” of the thermal solution.
For the endurance tests, we're looking at non-delta values – the unmodified value of the GPU Diode read-out. This is primarily useful for determining throttle points and for aligning against frequency modulation, whether that's from DPM stepping or from throttling within the card.
Let's start with the averaged peak thermals, as that's the easiest chart to quickly read:
Sapphire's RX 470 Platinum Edition (~$180) isn't impressive with thermal; given the reference RX 480 heatsink, that much should have been obvious. The card operates at 50.3C delta T over ambient and 7.59C idle, a fair bit reduced from the RX 480 reference as a result of the lower TDP GPU. The reference RX 480, just as a note, sits at 56.3C load and an idle temperature that is effectively equivalent (within our 0.1C thermocouple resolution). The 50.3C max isn't dismal, all told, but we'll explain why a lower temperature will impact clock-rate in a moment.
Sapphire RX 470 Thermals Over Time
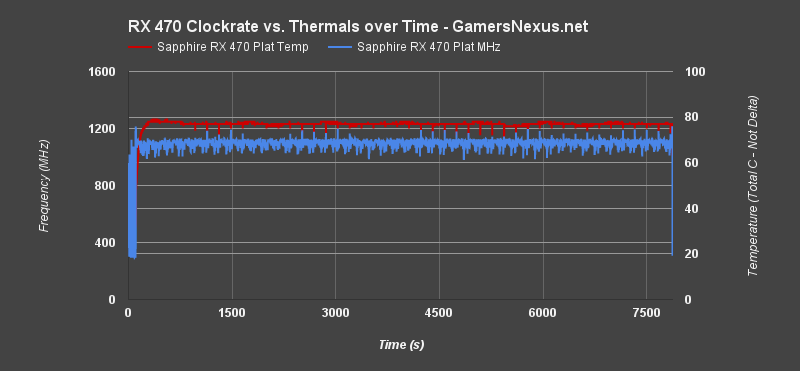
Here's the Thermals Over Time chart – simplified, with a few devices removed for legibility – for a depiction of the data as presented against our automated test execution:
RX 470 Thermals vs. Frequency (And Thermal Throttling)
Switching over to our unique endurance charts, we see a better look at real-world performance with frequency versus temperature, plotted against a two-hour burn-in. The RX 470 exhibits almost identical endurance performance to the RX 480 reference card: we're seeing a fluctuating frequency as a means to restrict the temperature, this time to a 77C ceiling. Each time temperature hits 78C on the GPU Diode, the clock-rate is throttled until the card returns to a 76-77C value. That's what's producing this choppiness.
Because the fluctuations are never more than 100MHz, the impact to gameplay is mostly undetectable – but 1% lows and 0.1% lows will be improved by more effective cooling solutions, as we just saw with the MSI RX 480 Gaming X and Hybrid 480 that we built.
Here's a look at the raw data from one of these dips:
| Time (s) | GPU Clock | Memory Clock | GPU Diode | Fan % |
| 2615 | 1106.1 | 1750 | 78 | 45 |
| 2616 | 1097.5 | 1750 | 77 | 45 |
| 2617 | 1096.8 | 1750 | 77 | 45 |
| 2618 | 1096.8 | 1750 | 77 | 45 |
| 2619 | 1022.4 | 1750 | 77 | 45 |
| 2620 | 1028.6 | 1750 | 77 | 45 |
| 2621 | 1061 | 1750 | 77 | 45 |
| 2622 | 1054.6 | 1750 | 77 | 45 |
| 2623 | 1060.1 | 1750 | 77 | 45 |
| 2624 | 1068.3 | 1750 | 77 | 45 |
| 2625 | 1094.9 | 1750 | 77 | 45 |
| 2626 | 1089.5 | 1750 | 77 | 45 |
| 2627 | 1073.7 | 1750 | 77 | 45 |
| 2628 | 1078.3 | 1750 | 77 | 45 |
| 2629 | 1072.3 | 1750 | 77 | 45 |
| 2630 | 1027.2 | 1750 | 77 | 45 |
| 2631 | 1065.5 | 1750 | 77 | 45 |
| 2632 | 1112.5 | 1750 | 77 | 45 |
| 2633 | 1121.2 | 1750 | 78 | 45 |
| 2634 | 1100.8 | 1750 | 77 | 45 |
| 2635 | 1072.3 | 1750 | 77 | 45 |
| 2636 | 1089.2 | 1750 | 77 | 45 |
| 2637 | 1086 | 1750 | 77 | 45 |
| 2638 | 1119 | 1750 | 77 | 45 |
| 2639 | 1108.9 | 1750 | 77 | 45 |
| 2640 | 1115.2 | 1750 | 77 | 45 |
Sapphire RX 470 Platinum Fan RPM Over Time
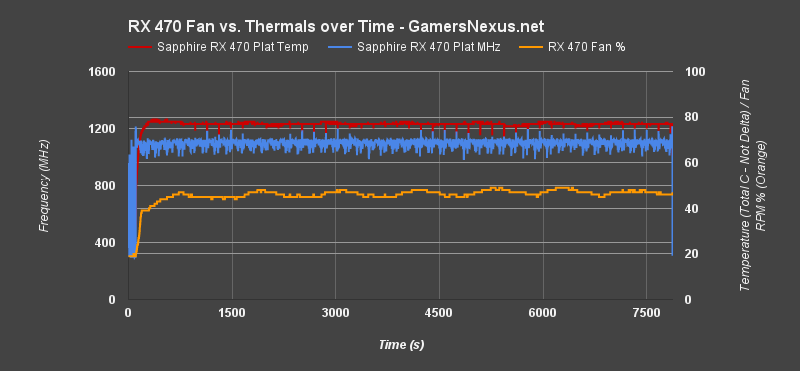
Here's a look at a similar chart, but with the fan RPM % plotted. The fan sticks around 46% in its out-of-box configuration, making for a tolerable mix of noise and performance. The blower fan of the RX 470 Platinum Edition maxes out closer to 4000RPM, rather than hitting the 5200RPM of the RX 480 reference card.
Sapphire AMD RX 470 Power Consumption & System Apparent Watt Draw (VA)
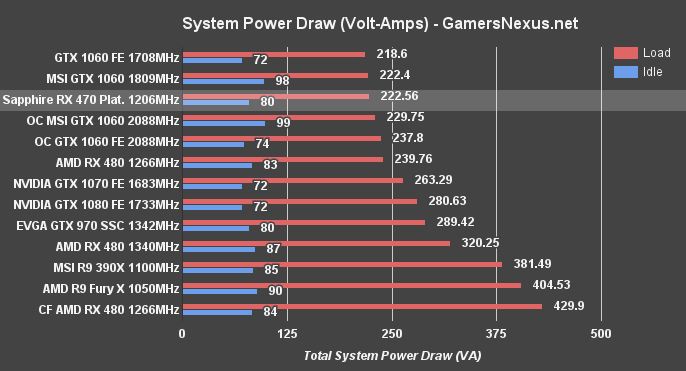
This next chart is a measurement of apparent power draw in volt-amps. Note that this is a measurement of total system draw, not individual card draw – so we're mostly comparing deltas.
With the RX 470 in the test bench, we see about 222VA drawn load and about 80VA idle. The RX 480 version of the bench sits at about 240VA load, for reference, with the GTX 1060 at about 218-219VA.
Continue to page 4 for Dx12 & Vulkan testing.
OpenGL DOOM – RX 470 vs. GTX 1060, RX 480, More
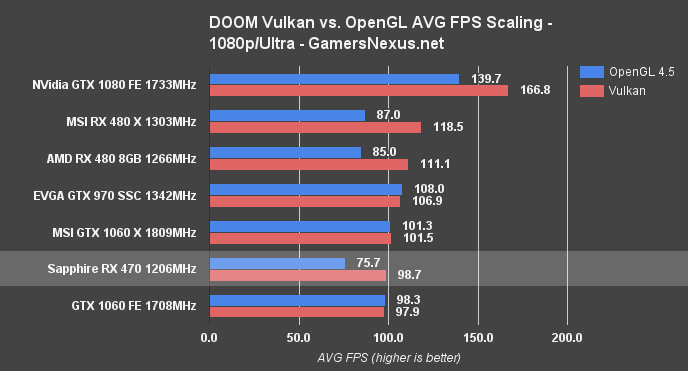
Doom recently received its anticipated Vulkan patch, touted at both the recent nVidia and AMD press conferences, and we've been working on building up a new test database with the game. Our original launch tests are not comparable to these results, as the game optimization and drivers have changed substantially. Note that we're hoping to revisit Doom Vulkan testing with exploration of additional settings, like TSSAA, but we're still working through content.
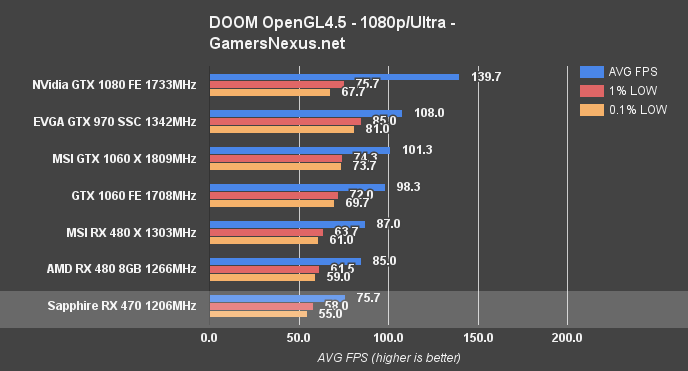
Let's start with OpenGL only tests. With OpenGL and the game at 1080p with Ultra settings, we're seeing a performance output of 75.7FPS AVG on the RX 470, sustaining lows of 58FPS and 55FPS. The RX 480 runs at 85FPS AVG, a difference of 11.6% between the RX 470 and 480. The two cards have comparable lows. With these same settings, the GTX 1060 FE performs at 98.3FPS AVG, a difference of 26% between the 1060 and the RX 470.
That changes with Vulkan enabled. The RX 470 now operates at 98.7FPS AVG, effectively tied with the GTX 1060 FE and a few FPS behind the MSI GTX 1060 Gaming X. The RX 480 runs a little more than 10FPS faster than the RX 470, ahead of the GTX 1060 Gaming X.
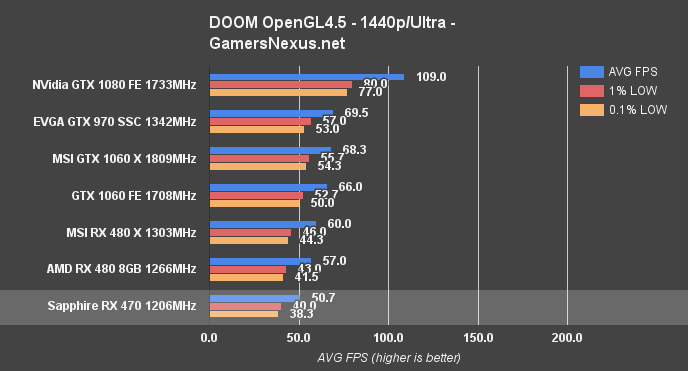
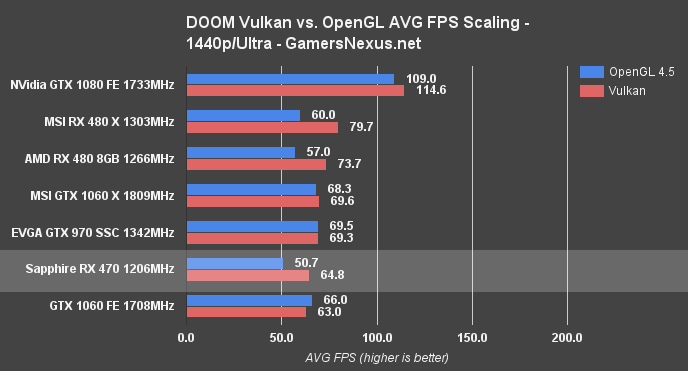
Here's 1440p with OpenGL. We're seeing a 50.7FPS output on the RX 470, with the RX 480 8GB at 57FPS AVG. The GTX 1060 FE is at 66FPS AVG. When we switch over to Vulkan, the performance swings the RX 470 to 64.8FPS AVG, a difference of 24.4% compared to the RX 480. The GTX 1060 FE is now slightly lower in the hierarchy than the RX 470, at 63FPS AVG.
Dx12 vs. Dx11 FPS in Ashes of Singularity – RX 470 vs. RX 480 4GB, 8GB, 1060
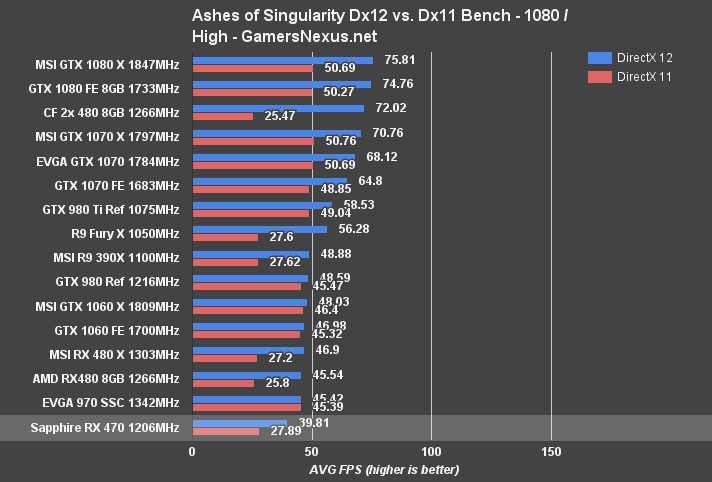
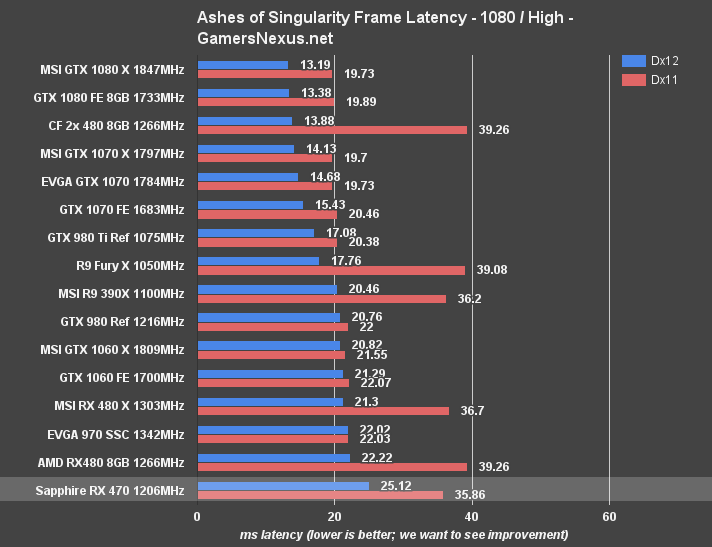
Ashes of the Singularity outputs similar performance on the RX 470 as seen on the previous AMD cards: Exceptionally poor Dx11 framerates with large improvements from Dx12. The RX 470 outputs ~28FPS AVG on Dx11 with 1080/high settings in AoS, jaunting to ~40FPS with DirectX 12 used instead. That plants the RX 470 behind the GTX 970 SSC by a few percentage points, gapped similarly as to the RX 480 8GB reference card with a 13.4% difference. The GTX 1060 FE performs similarly, though just ahead of the RX 480 reference card and MSI RX 480 Gaming X.
The above represents average latency output between frames in the Satellite Shot 2 scene, which we use for our benchmark numbers in AoS. This is presented as a millisecond value, not an FPS value, so lower is better.
GTA V Benchmark on RX 470 vs. RX 480, GTX 1060, 960, 390X
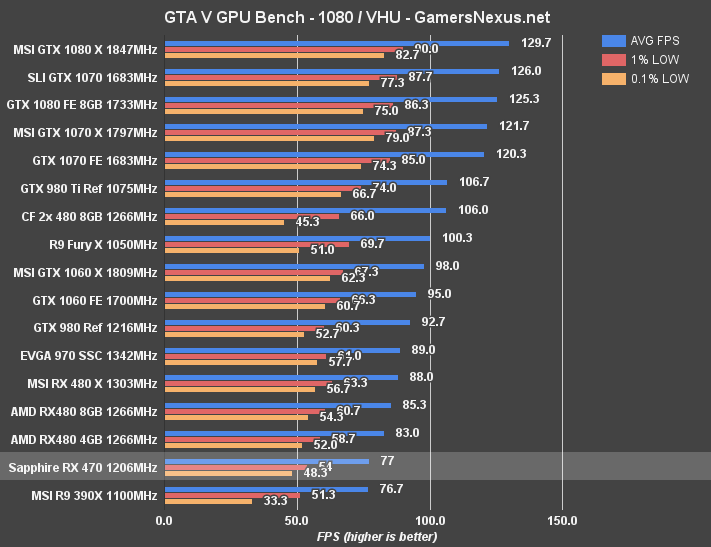
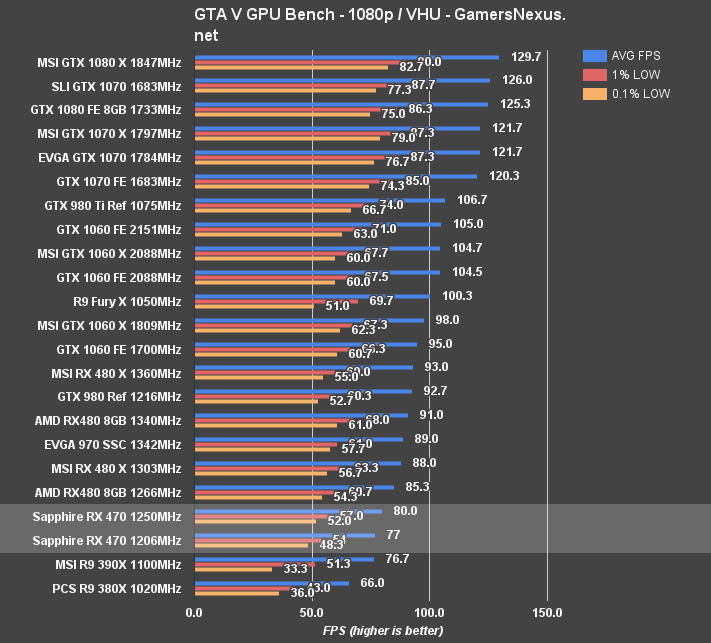
GTA V performs at 77FPS AVG on the RX 470 when run at 1080p with Very High and Ultra settings – effectively maxing out the graphics tab. The RX 480 ($240) runs at 85FPS AVG for the 8GB model, or a difference of 10.2%. Low framerates are acceptable between both cards now that AMD has resolved GTA stuttering with its driver updates. The GTX 1060 FE runs at 95FPS average, a percent difference of 20.9% with the RX 470. The GTX 970 SSC also places ahead of the RX 470 at 89FPS AVG. The 390X will need to be retested once the newest drivers go public, as it was still exhibiting stutters that dragged down the average.
Just for point of reference, the RX 470 was pushing 53.7FPS AVG at 1440p – more-or-less playable in GTA V – though its 0.1% low metrics were at 31FPS, and 36.3FPS for the 1% lows.
Mirror's Edge Catalyst Benchmark on RX 470 vs. RX 480, 1060, 960, 1070, 390X
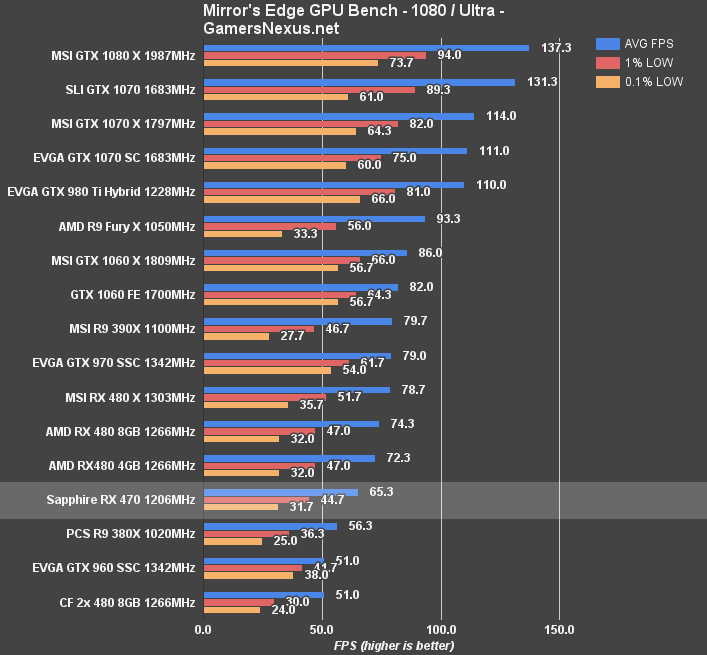
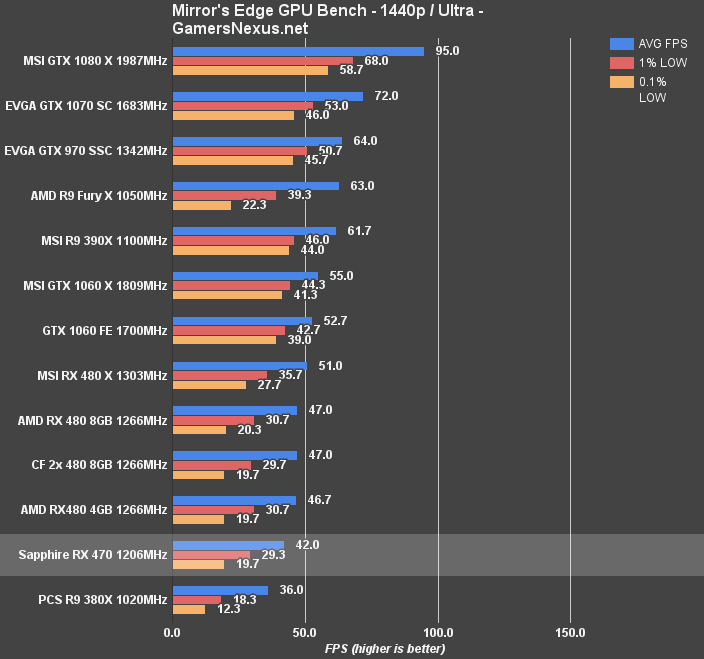
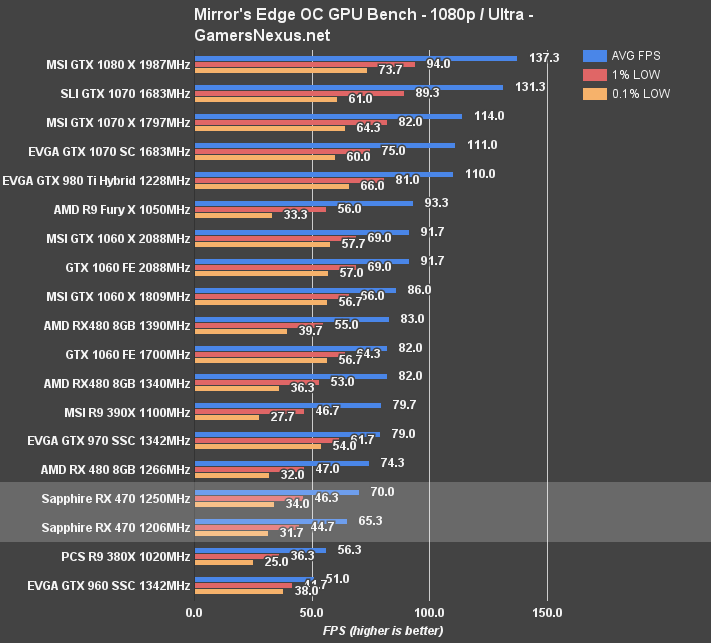
Mirror's Edge Catalyst at 1080p Ultra has the RX 470 exceeding 60FPS AVG, delivering on AMD's marketing claims, with a 65.3FPS AVG. Against the RX 480 8GB Reference, there's a difference of nearly 13%. Still, both cards have issues with low 0.1% frametimes, landing around 30FPS. The GTX 960 SSC runs slightly faster 0.1% lows, but an overall lower average. The GTX 1060, for comparison, sits at 82FPS AVG and 56.7FPS 0.1% low, but is obviously a more expensive card than the RX 470.
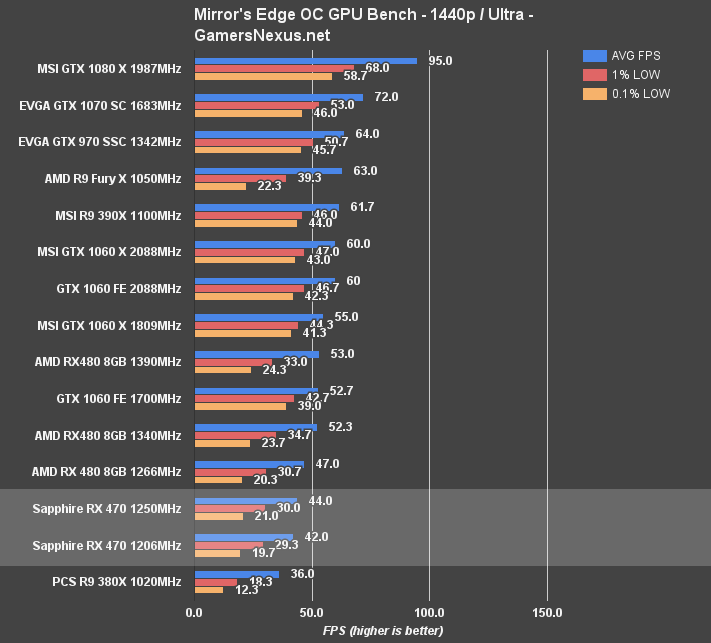
1440p posts similar results, with the RX 470 struggling to sustain a playable framerate. The 0.1% lows are below 20FPS, producing noticeable choppiness and stutters during gameplay and making for an overall unplayable experience. But, again, the card was built for 1080p – not for 1440p.
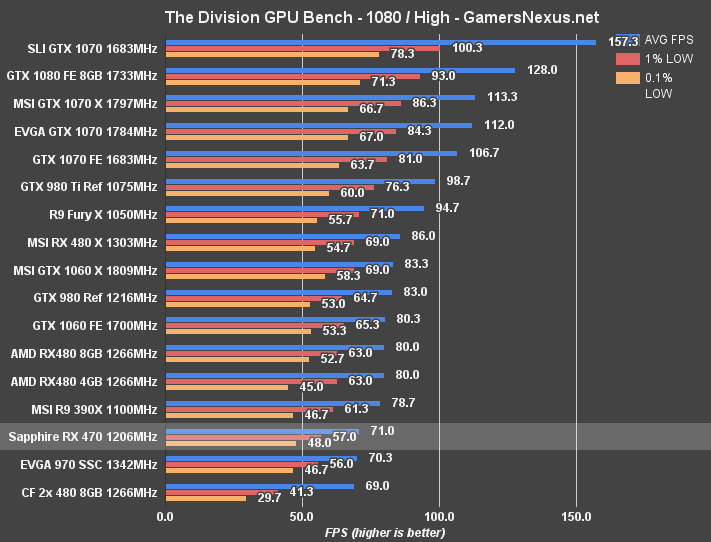
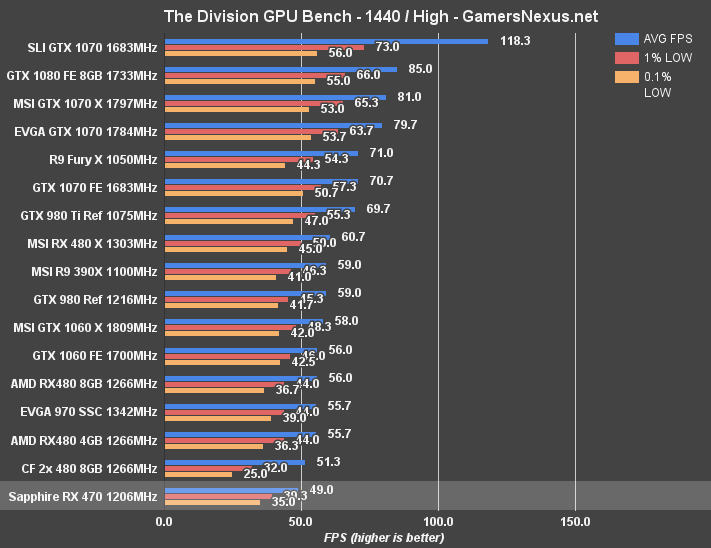
The Division Benchmark – RX 470 vs. RX 480, 1060, More
The above benchmark shows The Division with High settings. We're seeing an output of 71FPS AVG on the RX 470 Platinum Edition from Sapphire, with the GTX 970 SSC tailing tightly at 70.3FPS AVG. The CrossFire RX 480s negatively scale in The Division, something we explained here. The new generation GTX 1060 FE posts 80.3 FPS AVG, effectively equivalent (even in lows) to the new generation RX 480 8GB card. The 4GB card has some issues in its 0.1% lows, resultant of limited VRAM availability and lower speed.
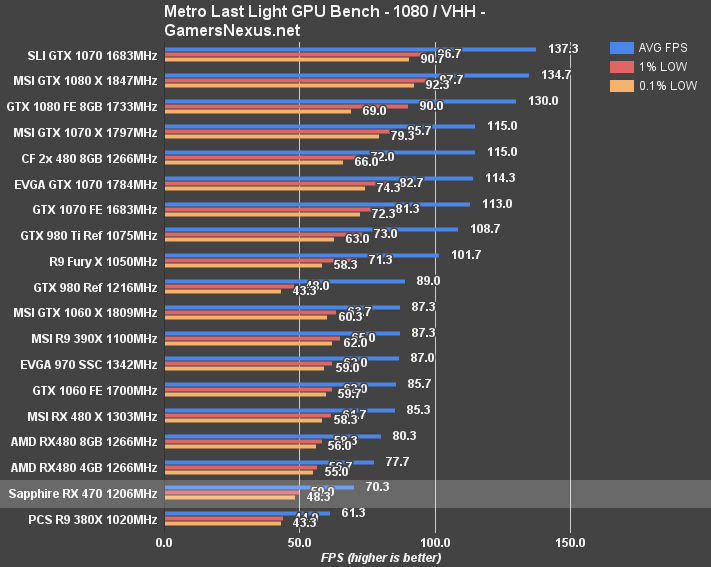
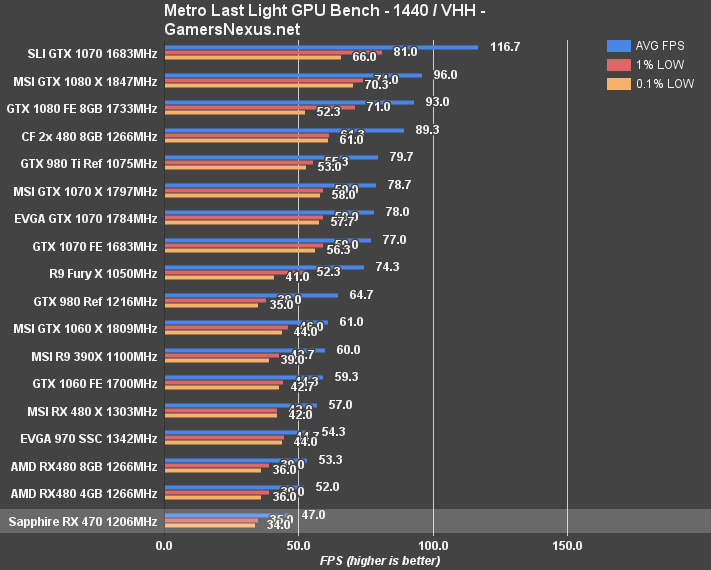
Metro: Last Light Benchmark – RX 470 vs. RX 480, GTX 1070, GTX 1060
Using Metro: Last Light as an intensive benchmark (Very High quality, High tessellation), we're seeing a 1080p performance output of 70.3FPS AVG on the RX 470 Platinum Edition card, with the RX 480 4GB model at 77.7FPS AVG and 8GB model at 80.3FPS AVG. That's a percent difference of 13.3% between the 8GB 480 and 10% between the 480 4GB and the 470. The GTX 1060 FE card operates at ~85.7FPS AVG with proportionately higher low metrics, or a difference of 19.7% with the RX 470.
1440p struggles on the RX 470, evidenced by its 47FPS AVG output.
Shadow of Mordor Benchmark – RX 470 vs. GTX 1070, RX 480 at 4K, 1440, & 1080
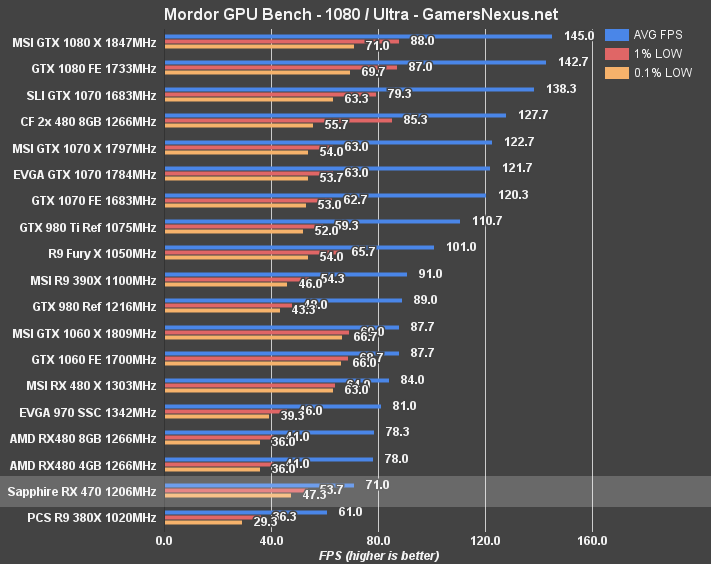
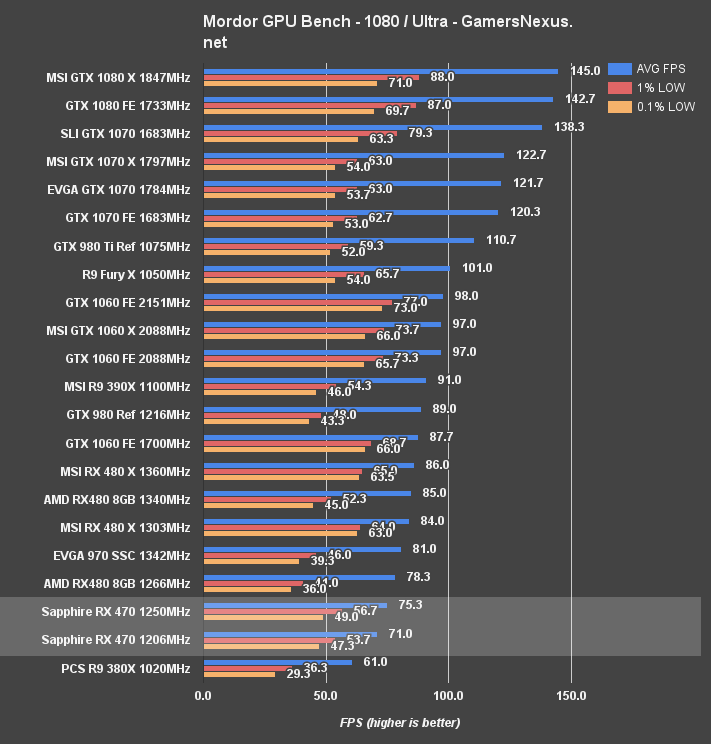
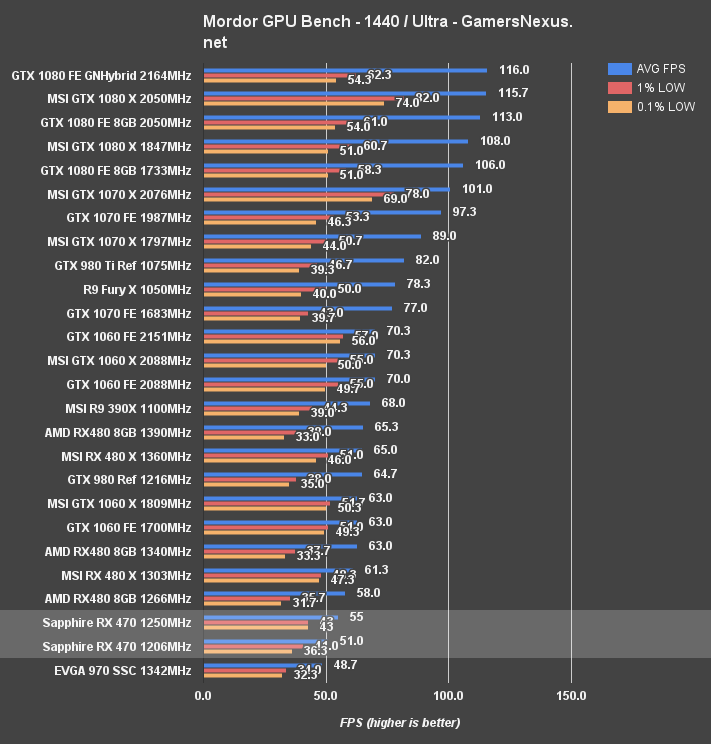
Shadow of Mordor at 1080p/Ultra produces a 71FPS AVG output on the RX 470 Platinum Edition card, sustaining better lows than what we originally saw on the RX 480. This is not a difference of drivers, either; the MSI RX 480 Gaming X was tested on the same drivers as the reference card, leaving us with a thermal-frequency impact (as plotted on page 3). Shadow of Mordor is a clock-sensitive game, so this makes sense as impacting 0.1% low metrics.
The GTX 970 SSC is outperforming the RX 470 in these charts, landing at 81FPS AVG to the RX 470's 71FPS average – but the 470 does maintain better 1% and 0.1% lows. The R9 380X is thoroughly outperformed in its 0.1% low values by the RX 470, and is now an obsolete card. The RX 470 and RX 480 4GB cards are separated by a difference of 9.4%, the same (mostly) for the 8GB variant; Mordor did not prove to be too sensitive to VRAM, though other games certainly did.
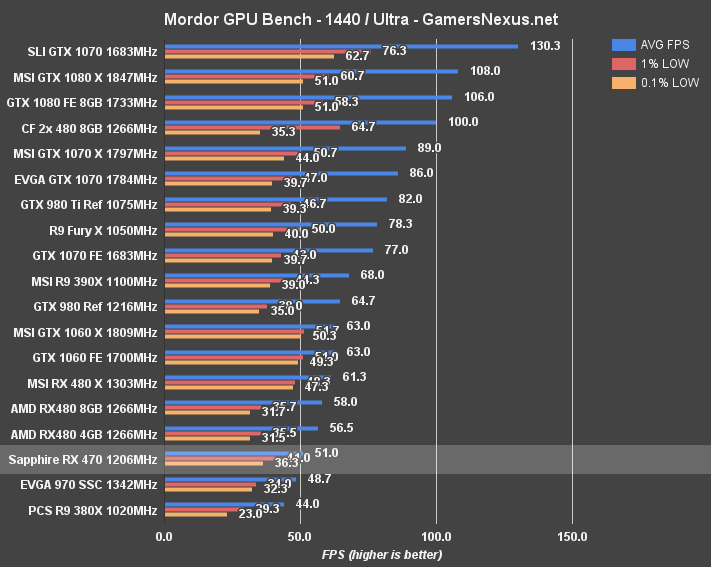
Perhaps surprisingly, you could actually play this Mordor at 1440p with the RX 470. It is an older title, though.
Call of Duty: Black Ops III Benchmark – RX 470 vs. RX 480, R9 390X, 1080, 970
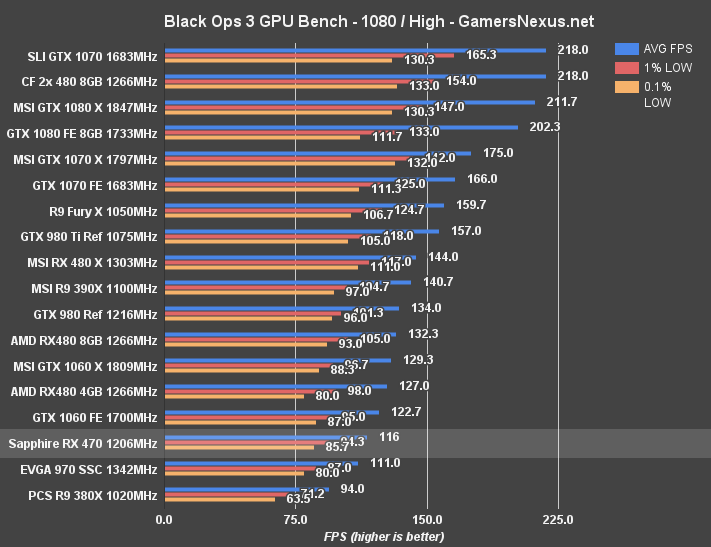
Black Ops III is optimized well for its level of visual fidelity, and also generally posts results that are favorable toward AMD. This reinforces the fact that graphics cards are very development-dependent when it comes to extracting performance.
At 1080p High, the RX 470 is capable of hitting 116FPS AVG, retaining fairly tightly timed 1% low and 0.1% low values at 94FPS and 85.7FPS, respectively. That places the RX 470 above the pre-overclocked GTX 970 SSC by a couple of frames, and just under the GTX 1060 Founders Edition. The RX 480 reference card performs at 132FPS AVG, with the MSI variant at 144FPS AVG. BLOPS3 proves to be somewhat clock-sensitive with these cards, shown with the AIB partner models against reference.
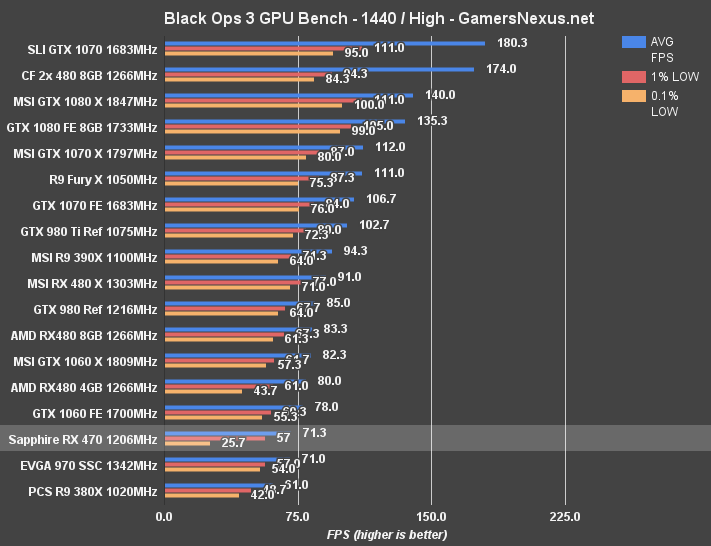
Because performance in BLOPS3 is optimized for high graphics, we decided to test 1440p playability on the RX 470. The card pushes a high average at 71.3FPS, about even with the GTX 970 SSC and not far from the GTX 1060 FE, but falls on its 0.1% low values. This is precisely why we measure these numbers: If you were to simply take the average, the fact that the game stutters to a point of being unplayable – especially in multiplayer – would be overlooked. Watch our “What are 1% & 0.1% Lows” video for more on this testing methodology.
Continue to page 6 for overclocking results.
How to Overclock the RX 470
Moving on to overclocking, the process is exactly the same as what we described in our RX 480 overclocking guide – just follow that guide if you want to learn how to OC Polaris. Here's a paste of our original text:
“Overclocking the RX 480 is only possible through AMD's WattMan software right now. Keep in mind that this testing was conducted pre-launch, but it is likely that the usual crew of AIB partner utilities will update as the RX 480 rolls out to market. For now, Afterburner is not compatible, leaving us to rely on AMD's software.
“This time, though, that's an OK thing to rely on. WattMan is a massive improvement over OverDrive (now dead, thankfully), and allows enthusiast-level fine-tuning over most normal OC functions. Something like Afterburner may remove a few restrictions, but there don't seem to be many in place with the Radeon Settings utility.
“WattMan allows dynamic or fixed clock speed modulation, controlled through a toggle and then through sliders (or manually input numbers). We switched to manual control and then configured the numbers to be equal across all 7 DPM states, since we don't much care for power savings when running OC testing. vCore can be tuned per state or left to automated control. Manually tuning vCore allows movement up to 1150mV. Power percent target increases to +50%, which grants us an additional 50% of base power to increase the clock and voltage. Memory overclocking is done with memory MHz offsets and memory voltage control (can be left to 'auto'). Thermal targets and fan RPM targets are relatively self-explanatory.”
Sapphire RX 470 Platinum Overclocking Results
This table shows our active stepping validation as we tweaked the card:
| Core Clock (MHz) | Mem CLK (MHz) | Mem Offset (MHz) | Power Target (%) | WattMan mV | Max Voltage (V) | GPU Power (W) | Fan (%) | 5m Test | 60m Endurance |
| 1172.4 | 1750 | 0 | 0 | varies | 1.1 | 110.3 | 41 | P | P |
| 1240 | 1750 | 0 | 50 | 1130 | 1.1125 | 159.8 | 66 | P | - |
| 1260 | 1750 | 0 | 50 | 1130 | 1.1125 | 159.8 | 66 | P | - |
| 1280 | 1750 | 0 | 50 | 1130 | 1.125 | 159.8 | 66 | F Driver Crash | - |
| 1280 | 1750 | 0 | 50 | 1150 | 1.125 | 159.8 | 66 | F Driver Crash | - |
| 1270 | 1750 | 0 | 50 | 1160 | 1.1563 | 168 | 95 | P | - |
| 1280 | 1750 | 0 | 50 | 1170 | 1.175 | 174.7 | 95 | F Driver Crash | - |
| 1270 | 1750 | 0 | 50 | 1170 | 1.175 | 174.7 | 95 | P | F Frame Drops |
| 1265 | 1750 | 0 | 50 | 1170 | 1.175 | 174.7 | 67 | P | F 15min Flickers |
| 1260 | 1750 | 0 | 50 | 1170 | 1.175 | 174.7 | 67-95 | P | F 30min black screen |
| 1250 | 1750 | 0 | 50 | 1160 | 1.1625 | 164.2 | 67 | P | P |
| 1250 | 1800 | 0 | 50 | 1160 | 1.1625 | 164.2 | 67 | P | P |
We settled with an OC of 1250MHz core and 1800MHz on the memory, which is the memory clock limit in WattMan. This limit seems to coincide with recent drive restrictions made by AMD, affecting the RX 480's memory OC previously. We were able to dial voltage back to 1160mV, and produced a peak GPU power draw of 164W – compared to the stock clock's 110W GPU power draw, that's a big jump, but is one that's expected with the extra 50% power target.
Stock / Reference RX 480 Overclocking Results
For reference, here's what we got on a stock (reference) RX 480:
| Core Clock (MHz) | Mem CLK (MHz) | Mem Offset (MHz) | Power Target (%) | Voltage | vCore Offset | 5m Test | 60m Endurance | Fan target |
| 1266 | 2000 | 0 | 100 | 1.05 | 0 | P | P | Auto |
| 1280 | 2000 | 0 | 150 | 1.075 | 1100 | P | - | 3500 |
| 1300 | 2000 | 0 | 150 | 1.0813 | 1110 | P | - | 3500 |
| 1320 | 2000 | 0 | 150 | 1.0875 | 1110 | P | - | 3500 |
| 1350 | 2000 | 0 | 150 | 1.0875 | 1110 | F | - | 3500 |
| 1340 | 2000 | 0 | 150 | 1.1 | 1130 | F | - | 3500 |
| 1340 | 2000 | 0 | 150 | 1.1 | 1130 | F | - | 3800 |
| 1340 | 2000 | 0 | 150 | 1.1 | 1130 | F | - | 3800 |
| 1340 | 2000 | 0 | 150 | 1.1187 | 1140 | F | - | 3800 |
| 1340 | 2000 | 0 | 150 | 1.125 | 1150 Max | P | - | 3800 |
| 1340 | 2100 | 100 | 150 | 1.125 | 1150 | P | P | 4100 |
| 1350 Max | 2100 | 100 | 150 | 1.125 | 1150 | P | F | 4100 |
| 1340 | 2150 | 150 | 150 | 1.125 | 1150 | P | P | 4100 |
| 1340 | 2200 | 200 | 150 | 1.125 | 1150 | P | P | 4100 |
| 1340 | 2250 | 250 | 150 | 1.125 | 1150 | F Flickering | - | 4100 |
Sapphire RX 470 Platinum Overclocked FPS Results
Find out how the OC impacts FPS below:
We're seeing swings of a couple percentage points maximally, somewhat expected from an OC less than 50MHz on the core. Overclocking stability is not a strong point with this particular RX 470 – it's not worth overclocking, honestly, as the extra few frames costs a lot in active power draw.
Continue to the final page for the conclusion.
The RX 470's MSRP is $180 from AMD, but we're not yet sure of the AIB partner pricing. Anything higher than that will enter territory of “just buy an RX 480” – not a bad thing to AMD, certainly. We've yet to see what nVidia's GTX 1050 or equivalent offering will be, making their closest option ~$250 for partner models. That is, if prices and availability ever align.
But at $180, we're looking at a card that posts about a 10% difference on average from the RX 480 4GB card ($200). In GTA V at 1080p, it's a 10% difference; the same is true for Mirror's Edge Catalyst, and the same is true again for Black Ops III. Only when attempting to push 1440p do we sometimes see serious detriment for the RX 470 in its 0.1% low frametimes – but it's not a card that's marketed toward 1440p. That said, some games we tested would readily play at 1440p on the RX 470 with appropriate settings tweaks. You'd want to bring down VRAM-intensive values in Black Ops III, for instance, but it's otherwise ready for the 470.
The RX 470 4GB presently faces no competition in its price bracket, assuming it can indeed be had for $180. For 1080p gaming, if you're considering an RX 480 4GB card (~$240+), we'd actually suggest that you buy an RX 470 4GB or RX 480 8GB instead, or the GTX 1060, and skip the 4GB card almost entirely. If you want the extra few frames for 1440p, then an RX 480 would make more sense – but some games will show significant 1% and 0.1% low improvements with the 8GB model. It just depends on the game, and you can check our RX 480 4GB vs. 8GB coverage for that.
(Update - Here's a list of available card, as of this post going live; note that the Platinum Edition is listed as $200. Don't buy that. The $180 models make far more sense.)
| Brand | Model | Price |
| PowerColor | PCS Red DEVIL RX 470 | $180 |
| XFX | RX 470 RS Triple X | $210 |
| XFX | RX 470 RS Black Edition True OC | $220 |
| Gigabyte | RX 470 G1 Gaming | $200 |
| Sapphire | RX 470 Nitro+ 8GB | $240 |
| Sapphire | RX 470 Nitro+ 4GB | $210 |
| Sapphire | RX 470 Platinum | $200 |
As for Sapphire's “Platinum Edition” of the card, we're really not big on this heatsink. This is the same cooler that shipped on the reference RX 480, and so we'd advise against its purchase. The heatsink is about as cheap as it gets, and thermal thresholds trigger around 78C – frequently achieved – that result in spurious frequency output. MSI, ASUS, XFX, PowerColor, and even Sapphire will have other RX 470 cards, but we haven't yet received them – we do have some on the way, though.
As a platform, the RX 470 is one of the best price-to-performance options on the market today, especially in the sub-$200 pricing. It outperforms the 380X and the GTX 960, which is all the RX 470 really has to do. The closest current gen competition is another price point up, so AMD's biggest competition comes from its own oddly positioned 4GB RX 480 and from the used market – but we don't take used card prices into account during reviews for a number of reasons, mostly the volatility of the pricing and mixed bag of options.
We can comfortably recommend the RX 470 as a strong value proposition if it's actually around ~$180. Once AIB partners start stepping out of that range, it's time to look at the low-end variants of the RX 480 (or GTX 1060, if you stretch to ~$250+). The market is mostly mature at this point, with regard to actual offerings, it's now just a matter of getting those in-stock and awaiting nVidia's competition for the low-end.
Editorial, Team Lead: Steve “Lelldorianx” Burke
Video Producer: Andrew “ColossalCake” Coleman
Sr. Test Technician: Mike “Budekai?” Gaglione
Test Technician: Andie “Draguelian” Burke
