AMD R9 Fury X Press Drivers vs. Release Drivers on Retail Hardware | Benchmark
Posted on
Our R9 Fury X analysis is still forthcoming, but we interrupted other tests to quickly analyze driver performance between the pre-release press drivers and launch day consumer drivers.
All testing was conducted using a retail Fury X, as we were unable to obtain press sampling. This benchmark specifically tests performance of the R9 Fury X using the B8, B9, and release (15.15.1004) drivers against one another.
The purpose for this test is to demystify some rumors that the Fury X would exhibit improved performance with the launch day drivers (15.15.1004), with some speculation indicating that the press drivers were less performant.
AMD R9 Fury X Specs
| AMD R9 Fury X | |
| Fab Process | 28nm |
| Stream Processors | 4096 |
| Base Clock (GPU) | 1050MHz |
| COMPUTE | 8.6 TFLOPs |
| TMUs | 256 |
| Texture Fill-Rate | 268.8GT/s |
| ROPs | 64 |
| Pixel Fill-Rate | 67.2GP/s |
| Z/Stencil | 256 |
| Memory Config | 4GB HBM |
| Memory Interface | 4096-bit |
| Memory Speed | 500MHz / 1Gbps |
| Power | 2x8-pin 275W TDP |
| Others | PCI-e 3.0 Dx12, Vulkan, Mantle support |
| Price | $650 |
With thanks to one of our readers, we are presently equipped with two loaner R9 Fury X video cards for CrossFire testing, cooling analysis, acoustic analysis (of the coil whine issue, for one), and game performance. This test is incredibly straight-forward and requires little discussion before the results.
The R9 Fury X (~$650) we're using is sold under Sapphire's banner, but is effectively identical (reference) to any other R9 Fury X presently available. This launch follows the R9 300 series cards, of which we tested the R9 390 and R9 380 just weeks ago.
Today's article isn't looking at competitive performance against alternatives – like the 980 Ti or R9 390X – but will strictly compare the R9 Fury X against itself using different drivers.
Note that direct comparison of these framerate results to our previous tests is not possible, as our previous tests were conducted using an entirely different bench. Our high-end video card reviews are migrating to an X99 configuration, and this is the first card for which we are publishing those results.
The Question of Drivers
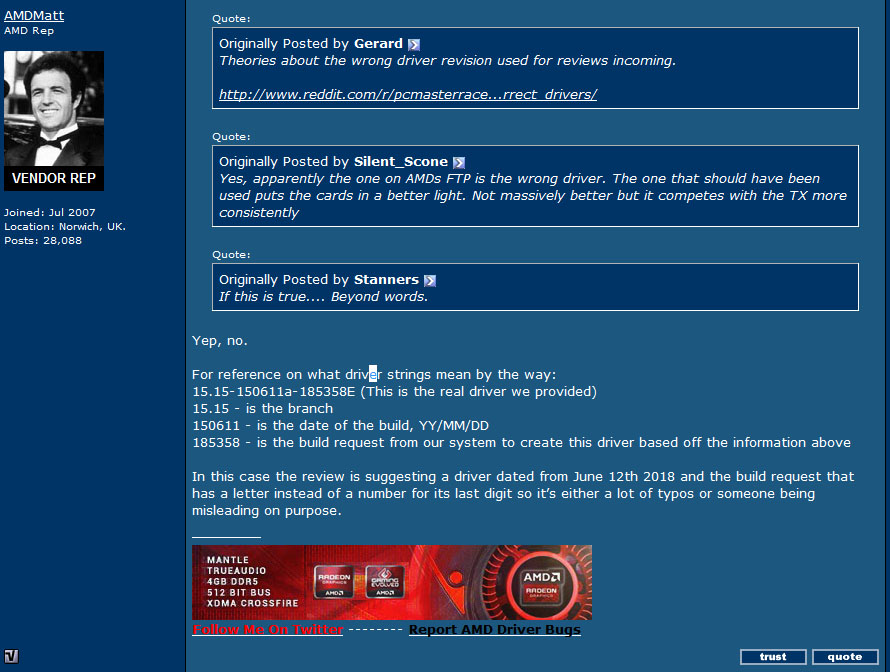
Four days ago, a post online suggested that AMD could have distributed less optimized drivers to the media for reviews, making for less-than-favorable results for the Fury X. An AMD representative later posted on the Overclockers forums, stating that the drivers distributed were correct and no performance disparity should exist. Here's the quote:
Even with word from AMD, we decided to validate the driver performance for our own testing, as we made the move between drivers and wanted to show the R9 Fury X in the most real-world use case. It is critical to our own review that we fully understand – with absolute certainty – if there is any disparity between the three driver versions that exist. The three drivers tested are:
- B8 Press Drivers (AMD FTP / third parties).
- B9 Press Drivers (AMD FTP / third parties).
- 15.15.1004 Drivers (AMD website for public download).
Test Methodology
We tested using our updated 2015 Multi-GPU test bench, detailed in the table below. Our thanks to supporting hardware vendors for supplying some of the test components.
The latest AMD Catalyst drivers were used for testing. Game settings were manually controlled for the DUT. All games were run at 'ultra' presets, with the exception of The Witcher 3, where we disabled HairWorks completely, disabled AA, and left SSAO on. GRID: Autosport saw custom settings with all lighting enabled.
Each game was tested for 30 seconds in an identical scenario, then repeated three times for parity.
| GN Test Bench 2015 | Name | Courtesy Of | Cost |
| Video Card | GamersNexus Reader [Loaner] | $650 | |
| CPU | Intel i7-5930K CPU | iBUYPOWER | $580 |
| Memory | Kingston 16GB DDR4 Predator | Kingston Tech. | $245 |
| Motherboard | EVGA X99 Classified | GamersNexus | $365 |
| Power Supply | NZXT 1200W HALE90 V2 | NZXT | $300 |
| SSD | HyperX Savage SSD | Kingston Tech. | $130 |
| Case | Top Deck Tech Station | GamersNexus | $250 |
| CPU Cooler | Asetek 550LC Liquid | Asetek | - |
Average FPS, 1% low, and 0.1% low times are measured. We do not measure maximum or minimum FPS results as we consider these numbers to be pure outliers. Instead, we take an average of the lowest 1% of results (1% low) to show real-world, noticeable dips; we then take an average of the lowest 0.1% of results for severe spikes.
We conducted a large suite of real-world tests, logging VRAM consumption in most of them for comparative analysis. The games and software tested include:
- GRID: Autosport (Ultra 1440, Ultra 4K).
- Shadow of Mordor (Very High, 1080p).
- The Witcher 3
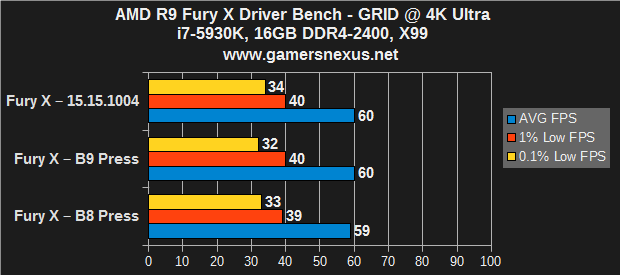
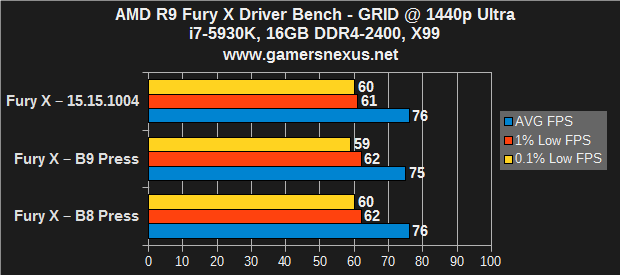
GRID: Autosport 4K & 1440p – AMD R9 Fury X Benchmark
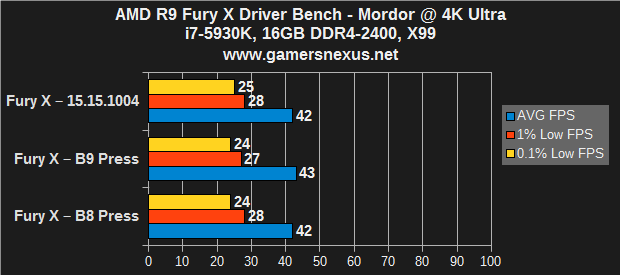
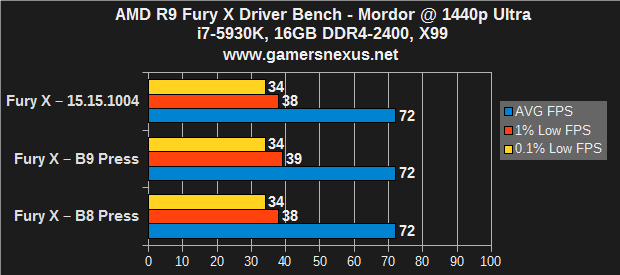
Shadow of Mordor 4K & 1440p – AMD R9 Fury X Benchmarks
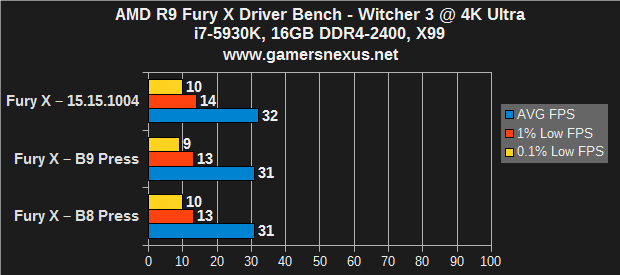
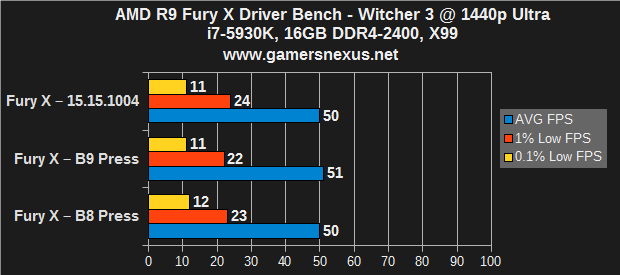
The Witcher 3 4K & 1440p – AMD R9 Fury X Benchmarks
Conclusion: No Difference
As shown in the charts above, all differences are within margin of error. There is effectively no difference from one driver revision to the next when considering only the existing Fury X options. For these purposes, reviews which were conducted using press drivers – assuming no other test error – can be considered effectively as accurate as reviews conducted using official launch drivers.
Our full comparative analysis of the Fury X (~$650), 980 Ti (~$650), and other high-end solutions – including SLI and CrossFire and the Hybrid Ti – will be published in short order.
- Steve “Lelldorianx” Burke.
