AMD Radeon R9 390 & R9 380 Overclocking Benchmark - 1% to 7% Performance Gains
Posted on
Following our initial review of AMD's new R9 390 ($330) and R9 380 ($220) video cards, we took the final opportunity prior to loaner returns to overclock the devices. Overclocking the AMD 300 series graphics cards is a slightly different experience from nVidia overclocking, but remains methodologically the same in approach: We tune the clockrate, power, and memory speeds, then test for stability.
The R9 390 and R9 380 are already pushed pretty close to their limits. The architectural refresh added about 50MHz to the operating frequency of each card, with some power changes and memory clock changes tacked-on. The end result is that the GPU is nearly maxed-out as it is, but there's still a small amount of room for overclocking play. This overclocking guide and benchmark for the R9 390 & R9 380 looks at the maximum clockrate achievable through tweaking.
All these tests were performed with Sapphire's “Nitro” series of AMD 300 cards, specifically using the Sapphire Nitro R9 390 Tri-X and Sapphire Nitro R9 380 Dual-X cards. Results will be different for other hardware.
AMD Radeon R9 390 & R9 380 Specs
| AMD R9 390X | AMD R9 390 | AMD R9 380 | AMD R9 290 | AMD R9 280 | |
| Process | 28nm | 28nm | 28nm | 28nm | 28nm |
| Stream Processors | 2816 | 2560 | 1792 | 2560 | 1792 |
| Boosted Clock | 1050MHz | 1000MHz | 970MHz | 947MHz | 933MHz |
| COMPUTE | 5.9TFLOPs | 5.1TFLOPs | 3.84TFLOPs | 4.89TFLOPs | 2.96TFLOPs |
| TMUs | 176 | 160 | 112 | 160 | 112 |
| Texture Fill-Rate | 184.8GT/s | 160GT/s | 108.64GT/s | 152GT/s | 92.6GT/s |
| ROPs | 64 | 64 | 32 | 64 | 32 |
| Pixel Fill-Rate | 67.2GP/s | 64GP/s | 31.04GP/s | 64GP/s | 26.5GP/s |
| Z/Stencil | 256 | 256 | 128 | 256 | 128 |
| Memory Configuration | 8GB GDDR5 | 8GB GDDR5 | 2 & 4GB GDDR5 | 4GB GDDR5 | 3GB |
| Memory Interface | 512-bit | 512-bit | 256-bit | 512-bit | 384-bit |
| Memory Speed | 6Gbps | 6Gbps | 5.5-5.7Gbps | 6Gbps | 5Gbps |
| Memory Bandwidth | 384GB/s | 384GB/s | 182.4GB/s | 320GB/s | 240GB/s |
| Power | 1x8-pin 1x6-pin | 1x8-pin 1x6-pin | 2x6-pin | 1x8-pin 1x6-pin | 2x6-pin |
| TDP | 275W | 275W | 190W | 275W | 200W |
| API Support | DX12, Vulkan, Mantle | DX12, Vulkan, Mantle | DX12, Vulkan, Mantle | DX12, Vulkan, Mantle | DX12, Vulkan, Mantle |
| Price | $430.00 | $330.00 | $200.00 | $264.00 | $170.00 |
As discussed in the review, the R9 390 and R9 380 are effectively identical to their preceding components (the R9 290 and R9 285, respectively). The table above reflects this. Core counts, TMUs, ROPs, even the GPU itself are all the same – it's the memory capacity and clockrate that have changed, with some “tuning” to the power management engine. Astute readers will also notice that the pixel and texel rates have increased on the R9 300 series cards – this is a function of the 50MHz clock increment, as texel rate is calculated as a product of the clockrate and TMUs.
Beyond the memory and clock jumps, there are no changes of note for buyers. Owners of the 200 series have little business upgrading, though new buyers may be in the running for a 300 series device. The Fury devices, which will ship with the new Fiji architecture, are presently priced out of the range of these 300 devices, making them non-competitors to AMD's own lower-end products. The only direct competition to the R9 380 is the GTX 960 4GB ($239), and the R9 390 faces competition from the GTX 970 ($350).
AMD R9 300 Series Overclocking
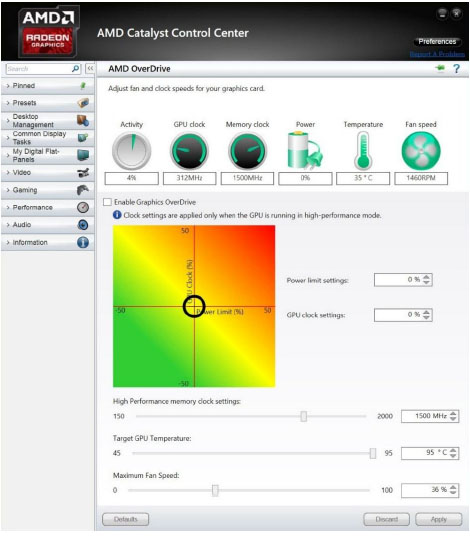
Although AMD overclocking can be forced down through MSI Afterburner, the software doesn't have full access to all the tuning settings. AMD's Catalyst drivers have a built-in overclocking utility that allows for increases to power in percentages, similar to the Maxwell overclocking we've already discussed.
Through usage of AMD's targeting reticle, we're able to manipulate the power percentage over (or under) reference as supplied to the GPU. This directly impacts the amount of power the GPU will drink through its PSU connectors, and directly impacts the resulting clockrates and stability of the overclock. Attempting to OC just the core clocks and memory clocks without change to the power allotment, for instance, will result in a stifled OC that is throttled by power availability. Too little power, and the GPU will ignore your overclock frequency, instead pushing it as high as is sustainable with the power available. Power is, like on Maxwell, split between voltage and the clock.
Memory overclocking is done on the slider that rests beneath the green-red OC gradient. The Sapphire R9 390 we used is limited to 2000MHz on the memory clock (theoretical max) and +50% on the power target. Sapphire's loaned R9 380 is limited to ~1700-1800MHz on the memory clock (theoretical max) with a +20% power target limit.
For clarity, increasing the power by X% over 100% means that we're increasing the power over reference. Whenever overclocks, overvoltage attempts, and over-power attempts are applied to a GPU, there is an inherent risk of destroying the silicon. Overclocking increases thermals and threatens stability, and should only be performed to levels with which the user feels comfortable. In our case, we're generally working with review hardware, so it's our job to try and find a breaking point. We'd encourage greater caution when pushing upper limits for consumer devices.
Test Methodology
We tested using our updated 2015 GPU test bench, detailed in the table below. Our thanks to supporting hardware vendors for supplying some of the test components. Thanks to Jon Peddie Research for GTX 970 & R9 280X support.
The latest GeForce 353.06 drivers were used during testing. AMD Catalyst 15.15 was used for the 300 series cards, with 15.5 used for 200 series cards due to incompatibility. Game settings were manually controlled for the DUT.
VRAM utilization was measured using in-game tools and then validated with MSI's Afterburner and AIDA64, a custom version of the Riva Tuner software. Parity checking was performed with GPU-Z. FPS measurements were taken using FRAPS and then analyzed in a spreadsheet.
Each game was tested for 30 seconds in an identical scenario on the two cards, then repeated for parity.
| GN Test Bench 2015 | Name | Courtesy Of | Cost |
| Video Card | Sapphire | $330 $220 | |
| CPU | Intel i7-4790K CPU | CyberPower | $340 |
| Memory | 32GB 2133MHz HyperX Savage RAM | Kingston Tech. | $300 |
| Motherboard | Gigabyte Z97X Gaming G1 | GamersNexus | $285 |
| Power Supply | NZXT 1200W HALE90 V2 | NZXT | $300 |
| SSD | HyperX Predator PCI-e SSD | Kingston Tech. | TBD |
| Case | Top Deck Tech Station | GamersNexus | $250 |
| CPU Cooler | Be Quiet! Dark Rock 3 | Be Quiet! | ~$60 |
Average FPS, 1% low, and 0.1% low times are measured. We do not measure maximum or minimum FPS results as we consider these numbers to be pure outliers. Instead, we take an average of the lowest 1% of results (1% low) to show real-world, noticeable dips; we then take an average of the lowest 0.1% of results for severe spikes.
We conducted a large suite of real-world tests, logging VRAM consumption in most of them for comparative analysis. The games and software tested include:
- Far Cry 4 (Ultra 1080, Very High 1080).
- GRID: Autosport (Ultra 1440, Ultra 4K).
- Metro: Last Light (Very High + Very High tessellation at 1080; High / High at 1440).
- GTA V (Very High / Ultra at 1080p).
- Shadow of Mordor (Very High, 1080p).
- 3DMark Firestrike Benchmark
- GTA V
- The Witcher 3
We already know GTA V and Far Cry 4 consume massive amounts of video memory, often in excess of the 2GB limits of some cards. GRID: Autosport and Metro: Last Light provide highly-optimized benchmarking titles to ensure stability on the bench. Shadow of Mordor, GTA V, & The Witcher 3 are new enough that they heavily eat VRAM. 3DMark offers a synthetic benchmark that is predictable in its results, something of great importance in benchmarking.
Overclocked tests were conducted using EVGA Precision for application of settings to nVidia devices. AMD OverPower was used for AMD overclocking. All devices were tested for performance, stability, and thermals prior to overclocking to ensure clean results. On the OC bench, devices were set to maximize their voltage ceiling with incremental gains applied to the core clock (GPU) frequency. 3DMark Firestrike was used on infinite loop to determine stability in a relatively real-world scenario. Once stability was compromised -- either from crashing or artifacting -- we attempted to resolve the issue by fine-tuning other OC settings; if stability could not be achieved, we backed-down the core clock frequency until we were confident of stability. At this point, the device was placed on a burn-in test using 3DMark Firestrike for 25 minutes. If the settings survived this test without logged fault, we recorded the OC settings and logged them to our spreadsheet.
Final OCs were applied and tested on games for comparison.
Thermals were reported using Delta T over ambient throughout a 25-minute burn-in period using 3DMark FireStrike - Extreme on infinite loop, which renders graphics at 1440p resolution. This test loads the VRAM heavily, something Kombustor skips, and keeps the GPU under high load that is comparable to gaming demands. Temperatures were logged using AIDA64.
Continue to Page 2 for the AMD 300 overclocking results.
AMD R9 380 Overclocking Results
The below table shows our overclock stepping when working with the devices. Each clock and power boost is applied in increments, briefly checked for stability, and then incremented further. The process halts when a failure is discovered, generally exhibited in the form of visual artifacting (heat or clock stability limit) or driver failures. Once this point is found, we begin the process of executing long-term endurance tests (20 to 30 minutes in length) using 3DMark's Firestrike Extreme on infinite loop. This test, although synthetic, is fairly representative of a real gaming scenario and will stress all aspects of the video card, including memory; some synthetic software leaves VRAM alone, like FurMark, and will not adequately stress memory overclocks.
| CLK Offset | Max Clock | Mem Offset | Mem CLK | Power % | Initial Test | Endurance? |
| +2.6% | 1011 | +0 | 1450MHz | +20% | Pass | N/A |
| +6.8% | 1052MHz | +0 | 1450MHz | +20% | Pass | N/A |
| +12.4% | 1080MHz | +0 | 1450MHz | +20% | Fail | N/A |
| +10.4% | 1087MHz | +0 | 1450MHz | +20% | Fail | N/A |
| +8% | 1064MHz | +0 | 1450MHz | +15% | Pass | N/A |
| +9% | 1074MHz | +0 | 1450MHz | +15% | Pass | Fail |
| +9% | 1074MHz | +0 | 1450MHz | +20% | Pass | Fail |
| +8.4% | 1068MHz | +50MHz | 1500MHz | +20% | Pass | Fail |
| +8.4% | 1068MHz | +75MHz | 1525MHz | +20% | Pass | N/A |
| +8.4% | 1068MHz | +125MHz | 1575MHz | +20% | Pass | Pass |
| +8.4% | 1068MHz | +200MHz | 1625MHz | +20% | Fail | N/A |
| +8.4% | 1068MHz | +175MHz | 1600MHz | +20% | Pass | Pass |
If the card and clockrate survive the endruance test without visual artifacting or driver failures, we begin FPS testing with that clockrate.
In the case of the R9 380, that stability was located at 1068MHz core (+8.4% OC) and 1625MHz memory (+175MHz OC), with a maximum allowable +20% power configured.
AMD R9 390 Overclocking Results
The R9 390 has slightly higher allowances for memory and a significantly higher power allowance.
| CLK Offset | Max Clock | Mem Offset | Mem CLK | Power % | Initial Test | Endurance? |
| +5.2% | 1063MHz | +130MHz | 1630MHz | +50% | Pass | N/A |
| +8% | 1091MHz | +130MHz | 1630MHz | +50% | Pass | N/A |
| +10% | 1111MHz | +130MHz | 1630MHz | +50% | Fail | N/A |
| +9% | 1101MHz | +200MHz | 1700MHz | +50% | Pass | Fail |
| +8.5% | 1096MHz | +250MHz | 1750MHz | +50% | Pass | Pass |
Our end result for the 390 was a 1096MHz core clock (+8.5% OC) and 1750MHz memory (+250MHz OC) clock, with a maximum allowable +50% power target configured.
Any higher than this – even at, say, 9% OC – and we started seeing red flickering, visual artifacting, and driver crashes when under intense load (as generated by The Witcher 3).
Firestrike AMD R9 300 Series Results
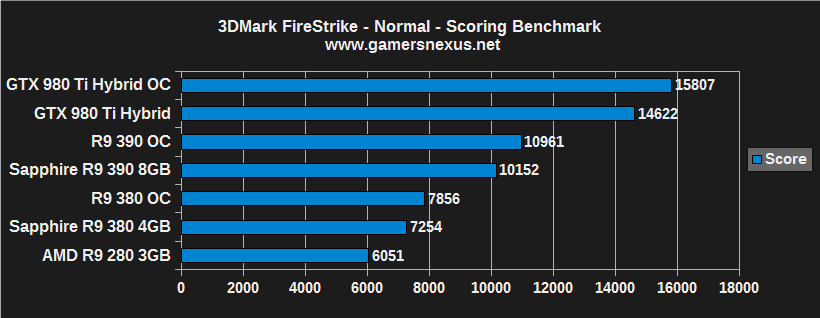
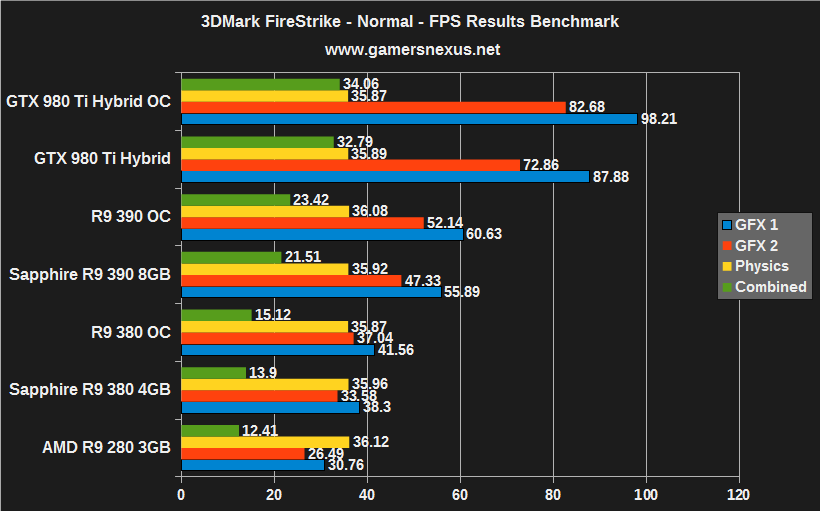
Firestrike isn't always perfectly representative of card performance, but it provides a solid baseline from which we can organize our testing approach (and ensure validity of an OC). The framerate yield from the overclocked cards is within the ~3FPS range (see: GFX tests) on average – nothing revolutionary, but not a bad start. For reference, we've listed the GTX 980 Ti Hybrid and its overclocked counterpart, which saw closer to a ~10FPS gain.
AMD R9 390 & R9 380 Overclocked – GRID: Autosport
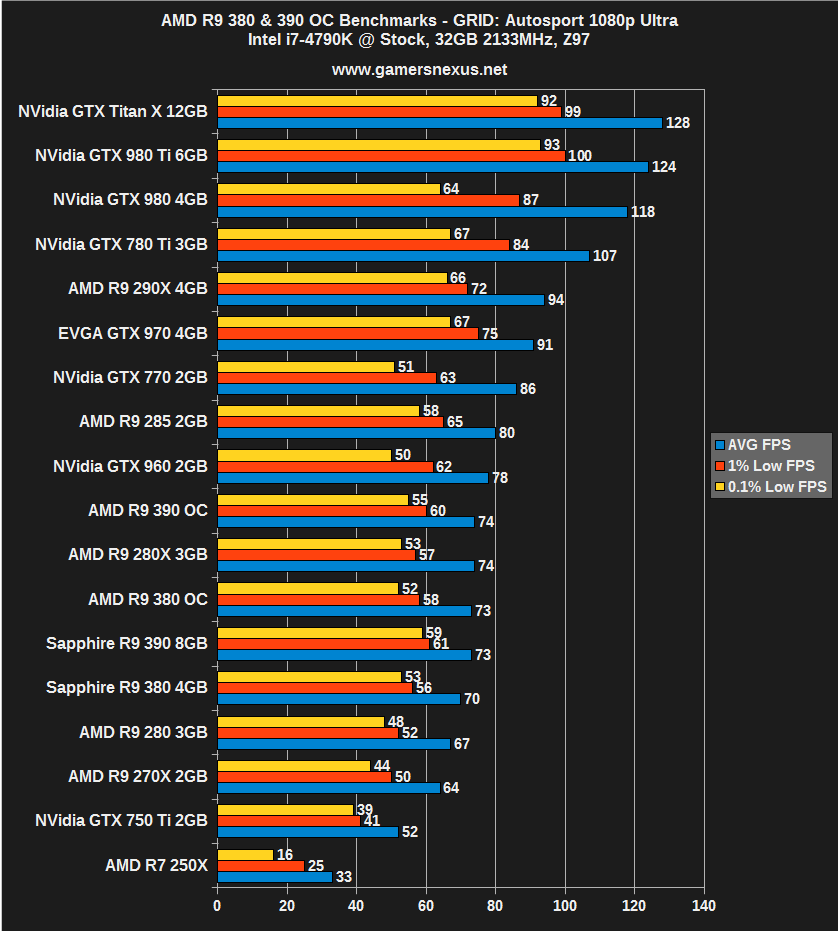
Our R9 390 8.5% core clock OC yielded just over 1% of performance gained in GRID: Autosport – almost within margin of test error. Not terribly exciting. The R9 380 saw a 4.2% gain, putting it nearly on par with th eR9 390 (slightly behind in 1% and 0.1% lows). GRID's optimization is so great that there is likely another hang-up in the pipe causing the proximity of these two cards. Let's go to the next test.
AMD R9 390 & R9 380 Overclocked – Metro: Last Light
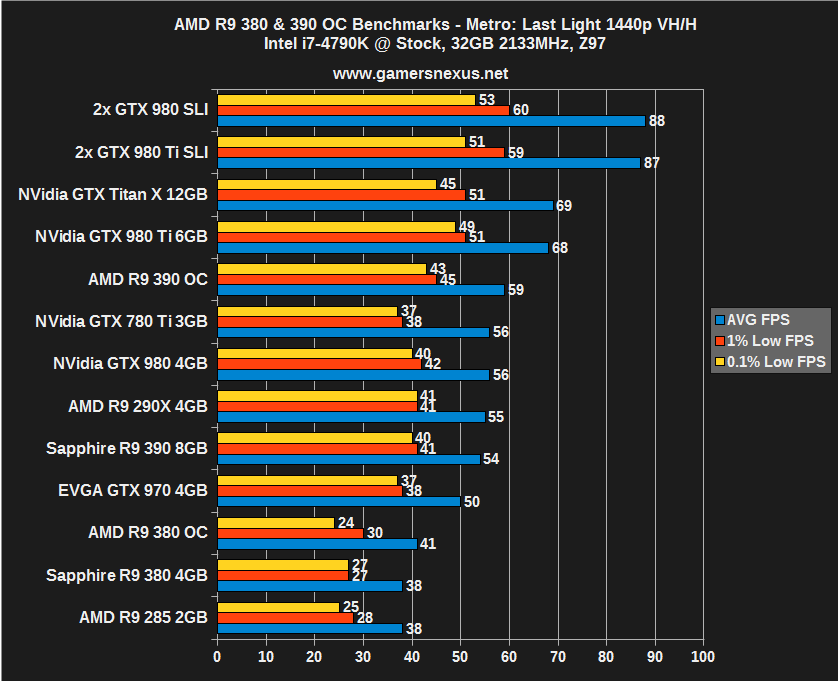
These results feel a little more substantial. The R9 380 sees a +5FPS gain (average) once overclocked, landing an ~8.7% performance gain from a similar overclock. The R9 390 gained 6FPS, or a ~7% gain. At 1440p, the R9 380 chokes hard enough on processing that we only gain 2FPS – fairly insubstantial, since the game is effectively 'unplayable' at Ultra / 1440p with an R9 380. The 390 gains ~4FPS, which is a bit more noticeable and consistent at ~7% gained.
AMD R9 390 & R9 380 Overclocked – The Witcher 3
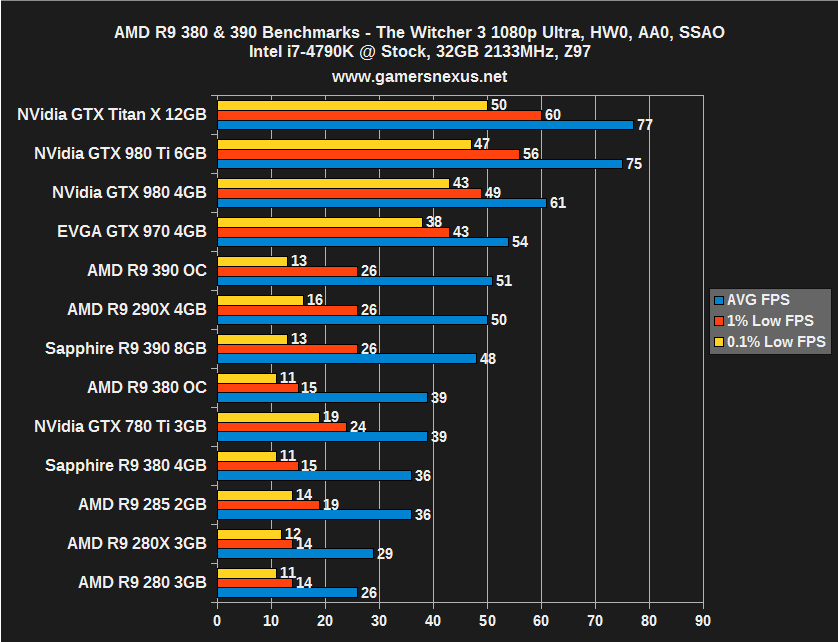
Nothing major here – we see a 3FPS gain in the R9 390, which isn't enough to push it into the desired 60FPS range. The 380 does not gain enough – at 39FPS vs. 36FPS – to become “playable” using Ultra / 1080p settings, and would still require a dip in settings for fluidity.
AMD R9 390 & R9 380 Overclocked – Shadow of Mordor
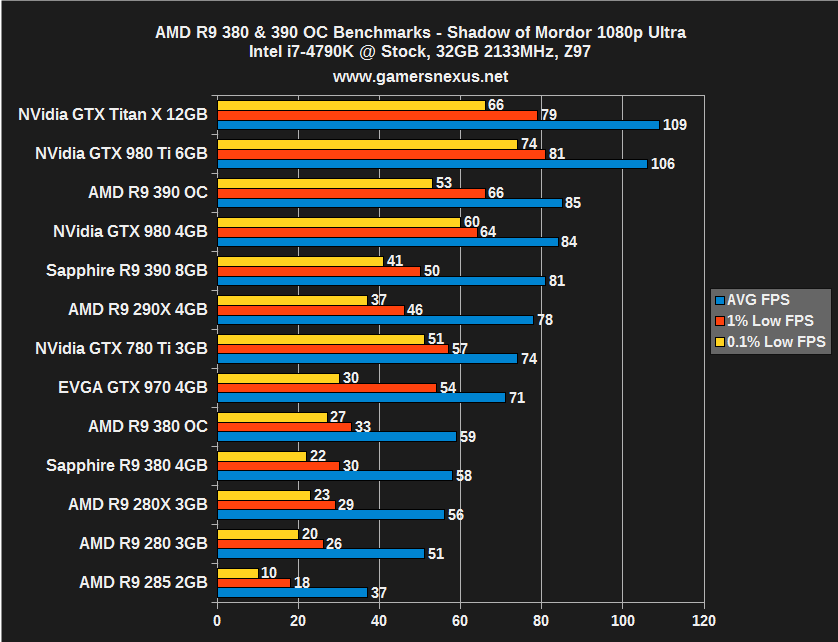
Shadow of Mordor saw a marginal performance gain in the R9 390, but an inconsequential one from the R9 380. Nothing exciting, unfortunately, and not worth the effort and risk of overclocking.
AMD R9 390 & R9 380 OC Temperatures
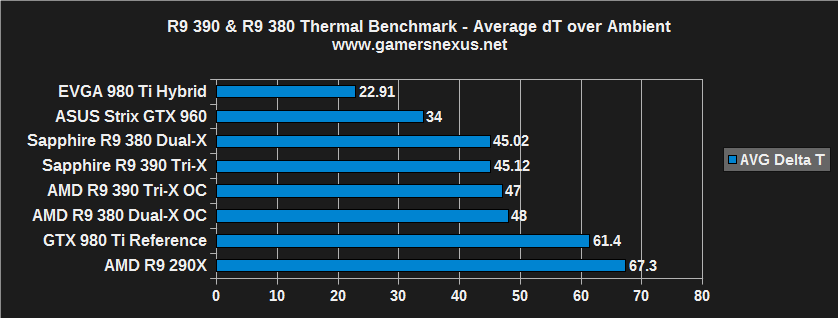
As mentioned in our review, Sapphire's Dual-X and Tri-X coolers are impressive in their dissipation potential. We saw a marginal thermal gain of a couple degrees Celsius, but nothing that would produce dangerous levels of heat. That's not too surprising, giving the fierce overclocking restrictions imposed by limited stability.
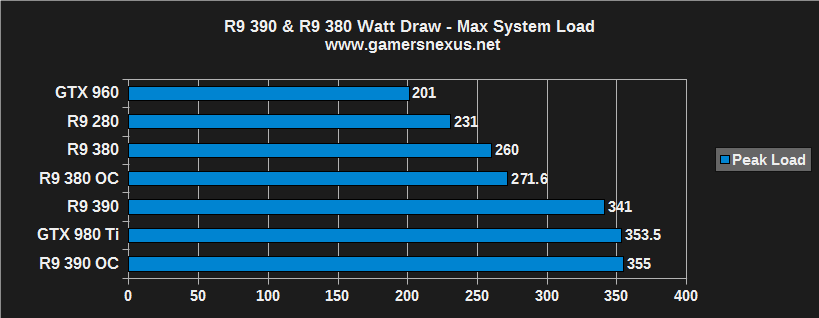
AMD R9 390 & R9 380 OC Power Draw
The above chart shows averaged max power consumption for all components in the system.
An Update to the Review: Driver Notes
In our review, I remarked that AMD's drivers were a massive obstruction to my recommendation of an R9 390 purchase. After significant difficulty struggling with black flickering on the R9 390 – but not the R9 380 – we were finally able to resolve the issue with some manual effort. The steps to fix the flickering were as follows (for us, anyway):
- Completely remove all existing drivers, something we'd already tried.
- Restart.
- If on a multiplexed board, you will have to resolve the failure of the PCI-e downstream switch port (PLX / PEX multiplexing functionality) by following this guide.
- Reinstall the 15.15 drivers.
- Restart.
- Ensure the screen resolution is native.
- Disable VSR in the Catalyst Drivers.
This seems to have resolved our issues, at least for now. Further validation is not yet possible due to our extremely limited time with the cards. It is possible that the issue still exists, but was not evoked prior to loaner return.
Conclusion: Minimal Room to OC, but Slight Gains
With gains spanning between 1% and 8% – but never exceeding an 8% FPS boost – it's not necessarily easy to justify the overclock. Overclocking doesn't increase thermals too much in this instance, so we feel more comfortable suggesting OC endeavors as an option for marginal FPS gain, but its value remains questionable for the majority of users.
If you're just a few frames shy of some experience-defining “playable FPS” number, the slight OC can push the 300 series into that range. This won't be enough to break into a higher class of settings, though, nor will it impact playability of higher resolutions.
Even though thermals aren't significantly impacted on our Sapphire cards, the same may not be true for other designs. Always perform your own tests to ensure the GPU isn't being roasted from an OC attempt. Note that there is still an inherent risk to overclocking even when thermals are as well-controlled as they were here, and that attempting an OC could permanently damage the video card.
- Steve “Lelldorianx” Burke.
