NVidia GeForce GTX 980 Ti SLI Benchmark & Review vs. GTX 980 SLI, Titan X
Posted on
Multi-GPU configurations have grown in reliability over the past few generations. Today's benchmark tests the new GeForce GTX 980 Ti in two-way SLI, pitting the card against the GTX 980 in SLI, Titan X, and other options on the bench. At the time of writing, a 295X2 is not present for testing, though it is something we hope to test once provided.
SLI and CrossFire have both seen a redoubled effort to improve compatibility and performance in modern games. There are still times when multi-GPU configurations won't execute properly, something we discovered when testing the Titan X against 2x GTX 980s in SLI, but it's improved tremendously with each driver update.
Previous GTX 980 Ti Review Content
- GTX 980 Ti benchmark & review.
- GTX 980 Ti video review.
- GTX 980 Ti overclocking performance a 19% gain.
- GTX 980 Ti OC video.
NVidia GeForce GTX 980 Ti Specs
| GTX 980 Ti | GTX Titan X | GTX 980 | GTX 780 Ti | |
| GPU | GM200 | GM200 | GM204 | GK-110 |
| Fab Process | 28nm | 28nm | 28nm | 28nm |
| Texture Filter Rate (Bilinear) | 176GT/s | 192GT/s | 144.1GT/s | 210GT/s |
| TjMax | 92C | 91C | 95C | 95C |
| Transistor Count | 8B | 8B | 5.2B | 7.1B |
| ROPs | 96 | 96 | 64 | 48 |
| TMUs | 176 | 192 | 128 | 240 |
| CUDA Cores | 2816 | 3072 | 2048 | 2880 |
| Base Clock (GPU) | 1000MHz | 1000MHz | 1126MHz | 875MHz |
| Boost Clock (GPU) | 1075MHz | 1075MHz | 1216MHz | 928MHz |
| GDDR5 Memory / Memory Interface | 6GB / 384-bit | 12GB / 384-bit | 4GB / 256-bit | 3GB / 384-bit |
| Memory Bandwidth (GPU) | 336.5GB/s | 336.5GB/s | 224GB/s | 336GB/s |
| Mem Speed | 7Gbps | 7Gbps | 7Gbps (9Gbps effective - read below) | 7Gbps |
| Power | 1x8-pin 1x6-pin | 1x8-pin 1x6-pin | 2x6-pin | 1x6-pin 1x8-pin |
| TDP | 250W | 250W | 165W | 250W |
| Output | 3xDisplayPort 1xHDMI 2.0 DVI | 3xDisplayPort 1xHDMI 2.0 1xDual-Link DVI | DL-DVI HDMI 2.0 3xDisplayPort 1.2 | 1xDVI-D 1xDVI-I 1xDisplayPort 1xHDMI |
| MSRP | $650 | $1000 | $550 now $500 | $600 |
A Word About How SLI Works
None of what's in this section is news. SLI has been around for a long time now – Wikipedia says 2004 – and the functionality has remained the same. Just for a quick refresher, we'll go over how SLI works at a top-level as a means to prep for the next section.
Scalable Link Interfaces allow the bridging of two or more same-model nVidia GPUs in a system. By using an SLI bridge, multiple video cards can be connected to share workload in the form of pixel processing and graphics computations, but using just one pool of VRAM from the primary card. AMD's version of this is called "CrossFire."
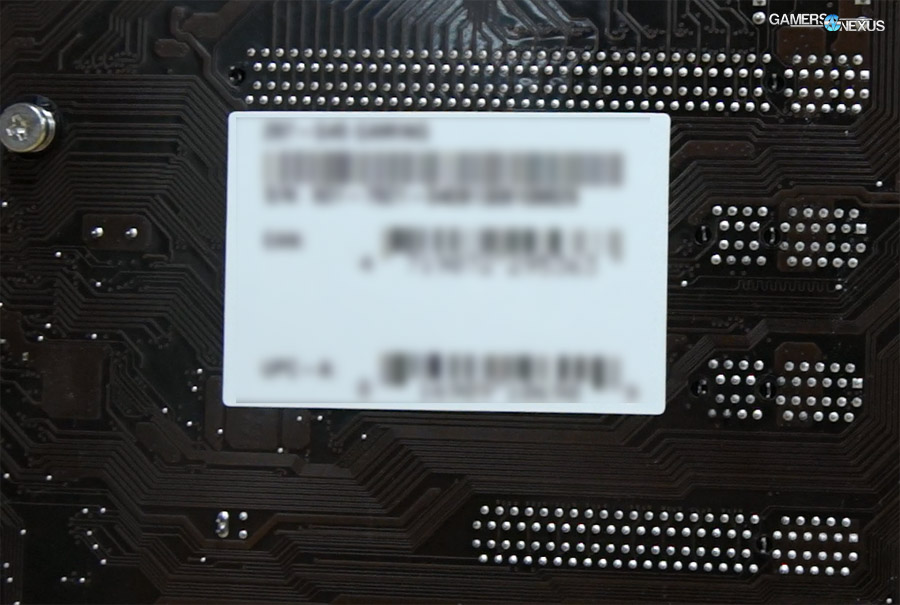
By using SLI, it is an inherent fact that more PCI-e lanes will be consumed from the PCH or CPU. Each video card uses a number of PCI-e lanes made available to it through the motherboard's PCI express slots and the platform's lane availability, generally in the form of x16/x16 or x8/x8, depending on the CPU and board. By looking at the pins present within the PCI-e socket (or by flipping the motherboard over - above), the maximum lane count supplied to that slot is revealed at a hardware level. If there are traces split to eight physical, metal pins filling half of the slot's pin-out, it's an x8 slot. The same is true for any other count. This stated, just because a slot offers sixteen pins does not ensure x16 support of a video card.
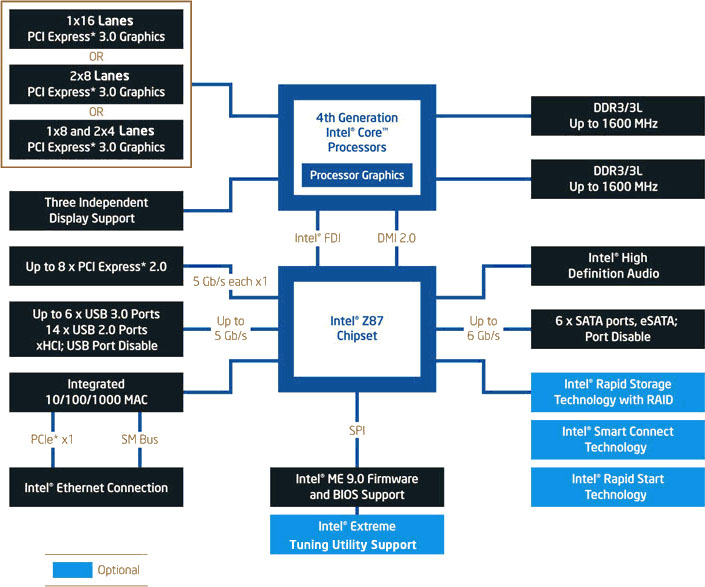
Even if a magical Z97 motherboard existed that offered four real PCI-e x16 slots – and there isn't one – Haswell is limited to just 16 PCI-e lanes on the CPU and 8 PCI-e lanes on the Z97 & H97 chipsets. Add 'em up, and that's just 24 total lanes – enough for an x8/x8 or x16/x8 setup, but not x16/x16. How, then, do some boards offer "x16/x16" SLI compatibility on LGA115X socket boards?
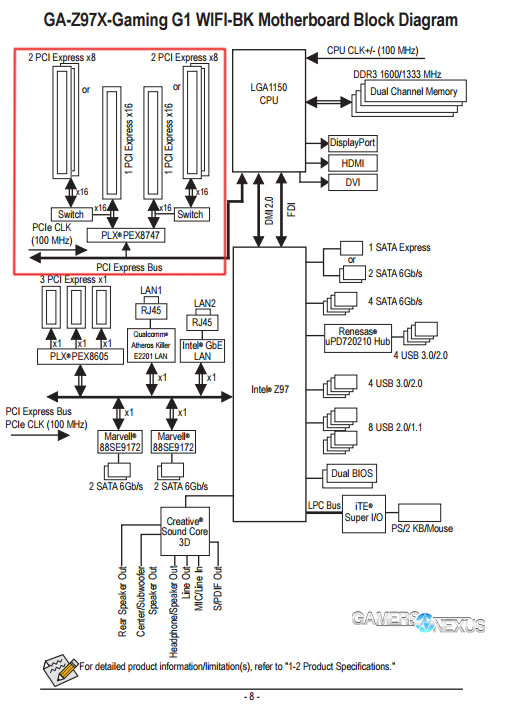
Some motherboards, like our test board from Gigabyte, will multiplex lanes to produce optimized (switching) lane availability through aftermarket PLX/PEX chips. Signal multiplexing receives multiple analogue signals and merges them into a single signal output, which is de-muxed on the receiving side when retrieiving the original data. It's not a perfect solution, but we can effectively simulate a higher lane count by multiplexing the signal to divert lane availability to straining devices as demand fluctuates. If all present devices are pushing maximum throughput, multiplexing doesn't resolve the issue of limited lane availability; normally, though, gaming use cases place greater load on one device and don't distribute load evenly between all present GPUs. For these instances, multiplexing can accelerate throughput by modulating the signal's strength (effective lane count) to each PCI-e slot.
DirectX 12 Changes the Memory Game
The new DirectX 12 API has already fallen upon our test bench, primarily when performing an API overhead test between Dx11, Dx12, and Mantle (soon Vulkan). DirectX 12 aims to resolve a number of CPU-binding issues, namely those pertaining to draw calls heavily loading the CPU, but it's also making changes to the ways GPUs and IGPs interact.
Dx12's Multiadapter feature will, when deployed by developers, enable communication between IGPs hosted on the CPU die and the dGPU (hosted on the video card). This puts Intel IGPs to use in dGPU systems and will hopefully make more scalable utilization of APU graphics than AMD's own dual graphics solution.
Dx12 also looks like it will allow VRAM pooling on multi-GPU configurations, bypassing the long-standing limitation that only the primary card would utilize its VRAM. Moving forward, this means multiple VGAs can be installed in an array to increase available VRAM – a desirable feature for users relegated to 2GB or 3GB devices. We're not yet entirely sure how this will work in games – obviously they've got to support Dx12 first – but it's a promising direction.
Continue to page 2 for benchmark results & charts.
Test Methodology
We tested using our updated 2015 GPU test bench, detailed in the table below. Our thanks to supporting hardware vendors for supplying some of the test components. Thanks to Jon Peddie Research for GTX 970 & R9 280X support.
The latest GeForce press drivers were used during testing. AMD Catalyst 15.5 was used. Game settings were manually controlled for the DUT. Stock overclocks were left untouched for stock tests.
VRAM utilization was measured using in-game tools and then validated with MSI's Afterburner, a custom version of the Riva Tuner software. Parity checking was performed with GPU-Z. FPS measurements were taken using FRAPS and then analyzed in a spreadsheet.
Each game was tested for 30 seconds in an identical scenario on the two cards, then repeated for parity.
| GN Test Bench 2015 | Name | Courtesy Of | Cost |
| Video Card | NVIDIA | $650 | |
| CPU | Intel i7-4790K CPU | CyberPower | $340 |
| Memory | 32GB 2133MHz HyperX Savage RAM | Kingston Tech. | $300 |
| Motherboard | Gigabyte Z97X Gaming G1 | GamersNexus | $285 |
| Power Supply | NZXT 1200W HALE90 V2 | NZXT | $300 |
| SSD | HyperX Predator PCI-e SSD | Kingston Tech. | TBD |
| Case | Top Deck Tech Station | GamersNexus | $250 |
| CPU Cooler | Be Quiet! Dark Rock 3 | Be Quiet! | ~$60 |
Average FPS, 1% low, and 0.1% low times are measured. We do not measure maximum or minimum FPS results as we consider these numbers to be pure outliers. Instead, we take an average of the lowest 1% of results (1% low) to show real-world, noticeable dips; we then take an average of the lowest 0.1% of results for severe spikes.
We conducted a large suite of real-world tests, logging VRAM consumption in most of them for comparative analysis. The games and software tested include:
- Far Cry 4 (Ultra 1080, Very High 1080).
- GRID: Autosport (Ultra 1440, Ultra 4K).
- Metro: Last Light (Very High + Very High tessellation at 1080; High / High at 1440).
- GTA V (Very High / Ultra at 1080p).
- Shadow of Mordor (Very High, 1080p).
- 3DMark Firestrike Benchmark
- GTA V
- The Witcher 3
We already know GTA V and Far Cry 4 consume massive amounts of video memory, often in excess of the 2GB limits of some cards. GRID: Autosport and Metro: Last Light provide highly-optimized benchmarking titles to ensure stability on the bench. Shadow of Mordor, GTA V, & The Witcher 3 are new enough that they heavily eat VRAM. 3DMark offers a synthetic benchmark that is predictable in its results, something of great importance in benchmarking.
Games with greater asset sizes will spike during peak load times, resulting in the most noticeable dips in performance on the 2GB card as memory caches out. Our hypothesis going into testing was that although the two video cards may not show massive performance differences in average FPS, they would potentially show disparity in the 1% low and 0.1% low (effective minimum) framerates. These are the numbers that most directly reflect jarring user experiences during “lag spikes,” and are important to pay attention to when assessing overall fluidity of gameplay.
Overclocked tests were conducted using MSI Afterburner for application of settings. All devices were tested for performance, stability, and thermals prior to overclocking to ensure clean results. On the OC bench, devices were set to maximize their voltage ceiling with incremental gains applied to the core clock (GPU) frequency. MSI Kombustor, which loads the GPU 100%, was running in the background. Once stability was compromised -- either from crashing or artifacting -- we attempted to resolve the issue by fine-tuning other OC settings; if stability could not be achieved, we backed-down the core clock frequency until we were confident of stability. At this point, the device was placed on a burn-in test using Kombustor and 100% load for 30 minutes. If the settings survived this test without logged fault, we recorded the OC settings and logged them to our spreadsheet.
Final OCs were applied and tested on games for comparison.
Thermals were reported using Delta T over ambient throughout a 30-minute burn-in period using 3DMark FireStrike - Extreme, which renders graphics at 1440p resolution. This test loads the VRAM heavily, something Kombustor skips, and keeps the GPU under high load that is comparable to gaming demands. Temperatures were logged using MSI Afterburner.
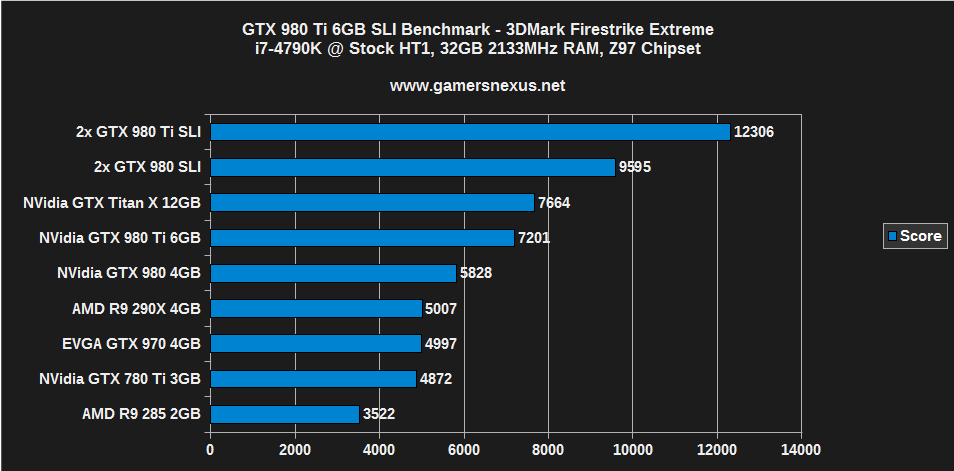
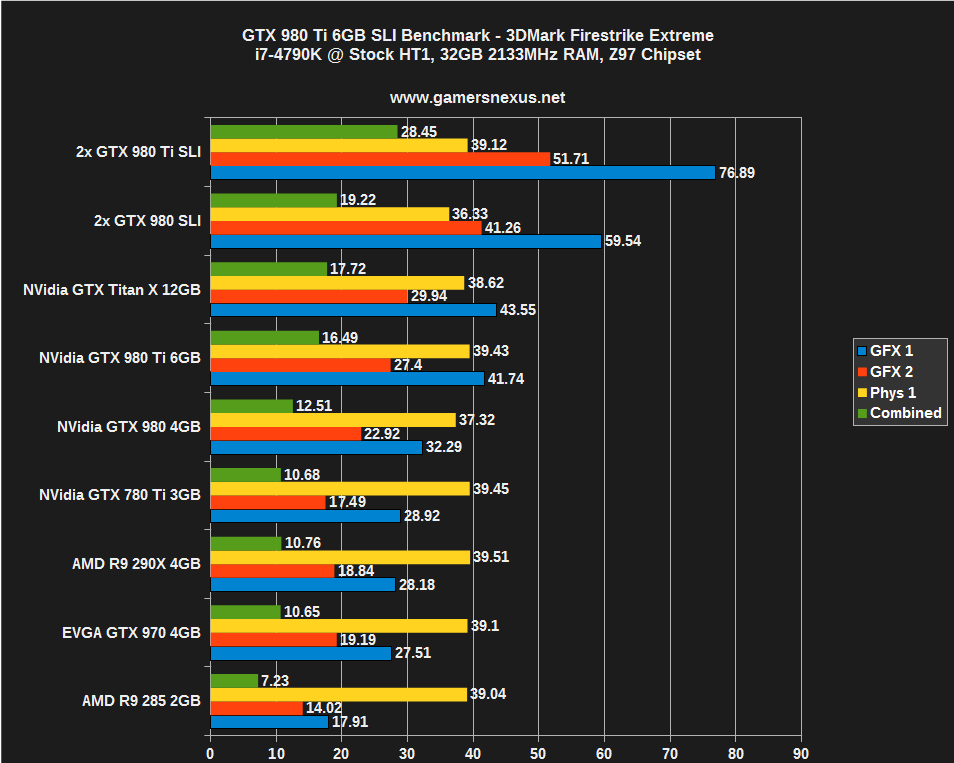
3DMark Firestrike Extreme – GTX 980 Ti SLI vs. GTX 980 SLI
3DMark's Firestrike benchmark provides a baseline for analysis, but is a synthetic tool that simulates real-world use cases. Because Firestrike is synthetic, we sometimes see greater differences between devices than are present in gaming scenarios. Still, it's worth running the test as a means to see a clean ranking of product performance on the benchmark.
We used Firestrike Extreme, which renders graphics at 1440p instead of the 1080p of the base version.
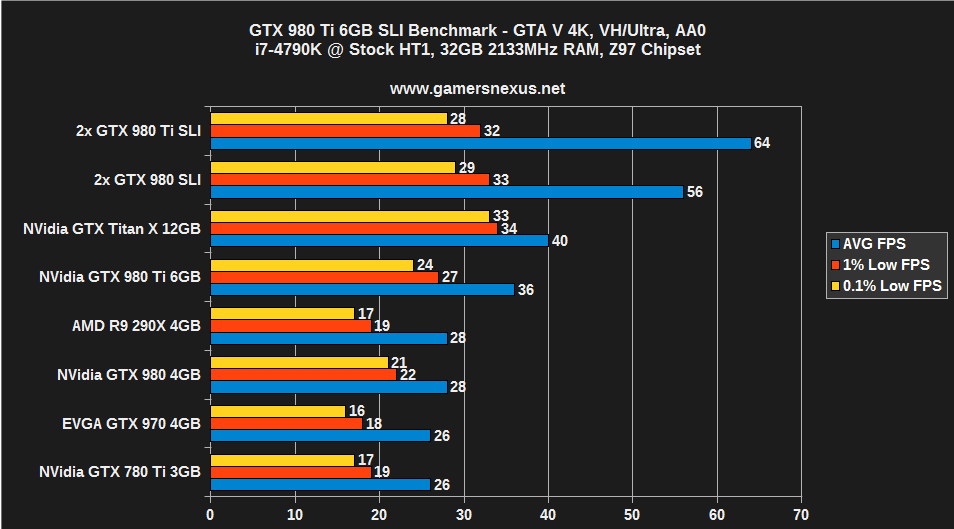
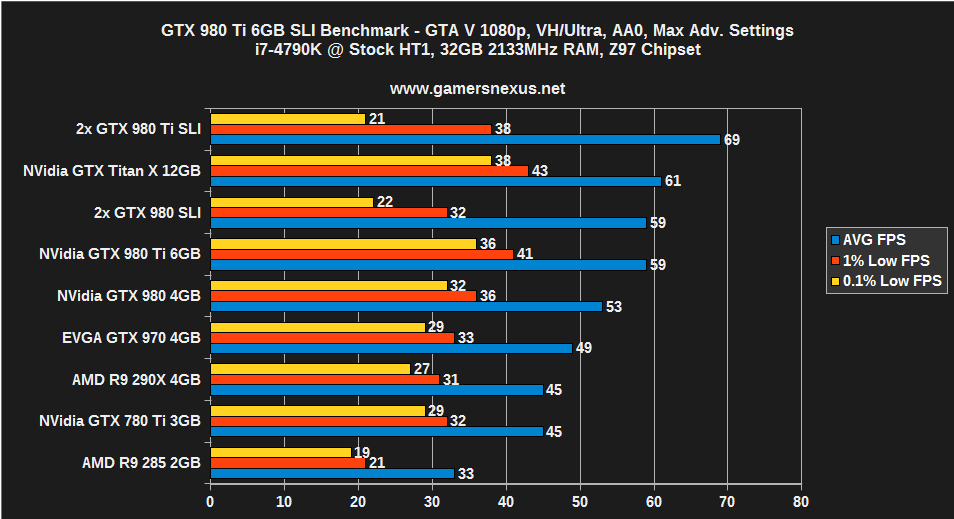
GTA V Benchmark – GTX 980 Ti SLI vs. 980 SLI, Titan X
GTA V, although optimized in many regards, doesn't do so well on SLI configurations with advanced settings. Despite boasting the highest average FPS, the SLI GTX 980 Ti cards suffer from profoundly low 0.1% FPS (99.9 percentile frames); these are the 'drops' that users will visually see as 'stutter' when gaming, and create a jarring and unpleasant experience. Note that these were the worst when using 'advanced settings' options (as we do at 1080p for alternate load testing), and that disabling advanced graphics options (as shown in the 4K chart) produce more reasonable lows.
As for performance, the 980 Ti in SLI outranks the 980 in SLI, understandably, but only by ~8 FPS average. This 13% boost costs $300 more than the new GTX 980 price ($500, though that is still propagating), making for a rough value argument.
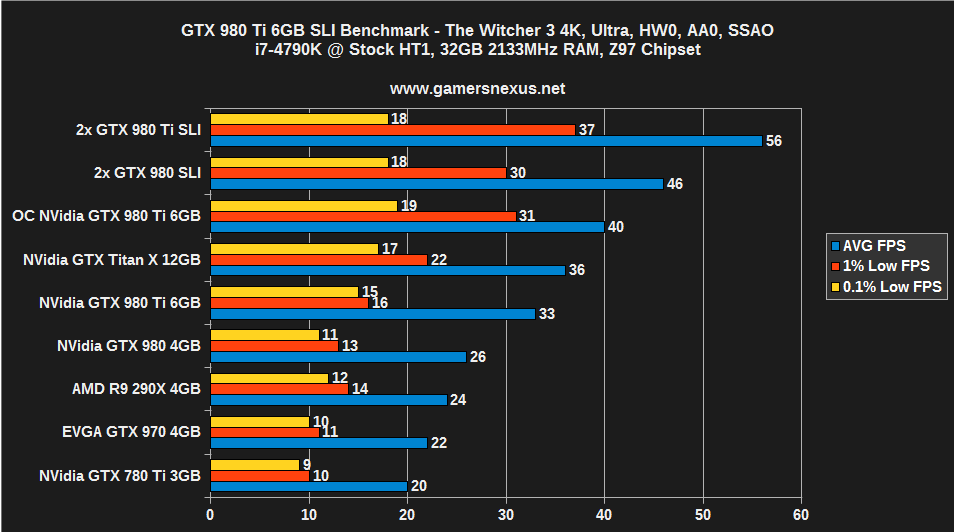
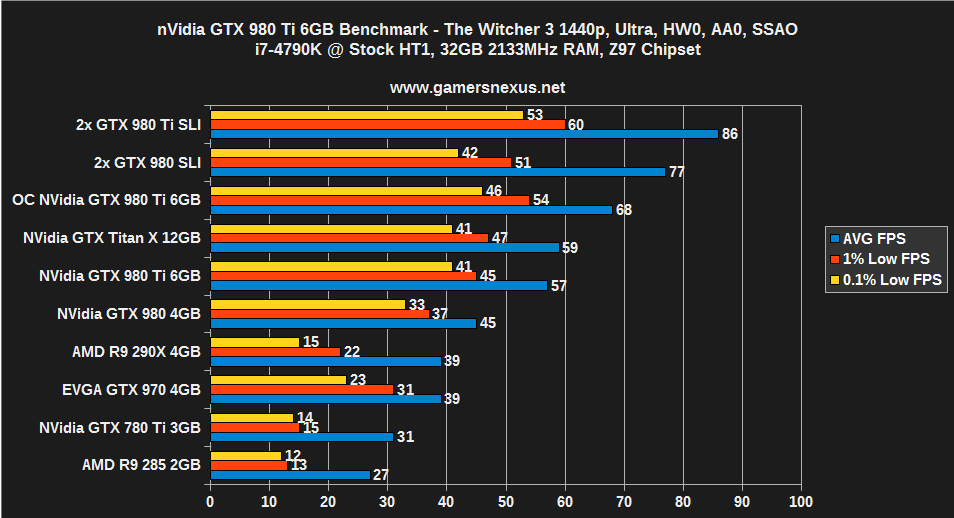
The Witcher 3 Benchmark – GTX 980 Ti SLI vs. 980 SLI, Titan X, 780 Ti
We wrote about the Witcher 3's performance in our day-1 benchmark, remarking about the game's poor optimization and disappointing performance. In our updated graphics optimization guide for The Witcher 3, we found that the game's 1.03 and 1.04 patches significantly bolstered performance, making for a more playable experience.
980 Ti cards in SLI offer another ~19~20% performance gain over SLI GTX 980s, a more sizable difference favoring the Ti cards. Part of this is likely due to driver optimization for the Witcher 3 made by nVidia.
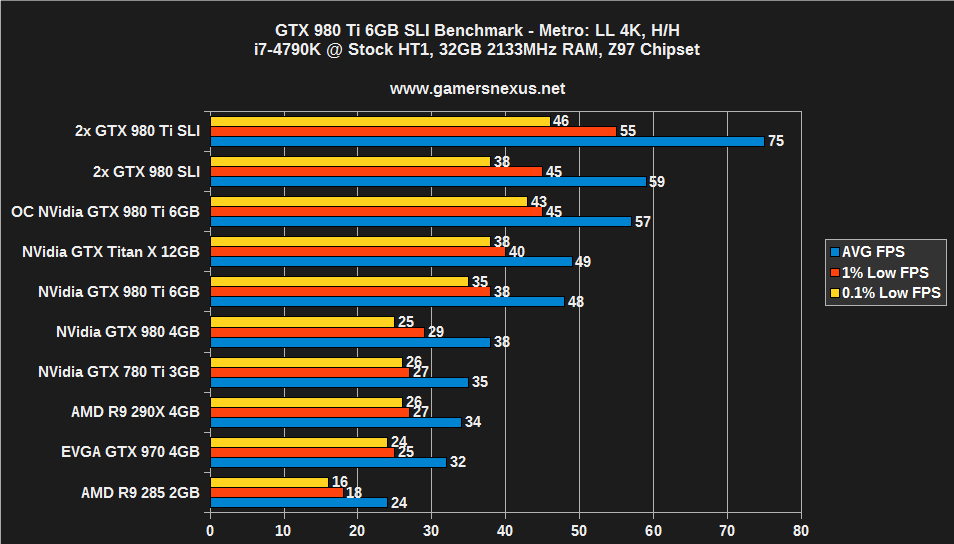
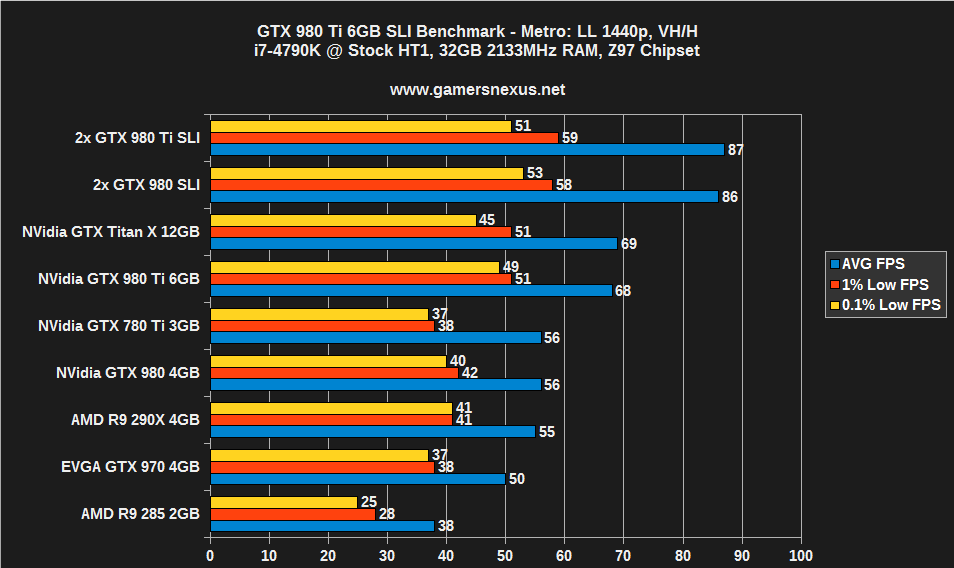
Metro: Last Light – GTX 980 Ti SLI 4K & 1440p Benchmark
Metro: Last Light shows a larger performance disparity at 4K than the previous titles – a ~24% gain – but present almost no difference at 1440p (within margin of error). We're unsure of why this is happening or where the bottleneck is, though it's likely a driver or software side issue. The 4790K could also be choking with such powerful GPU throughput.
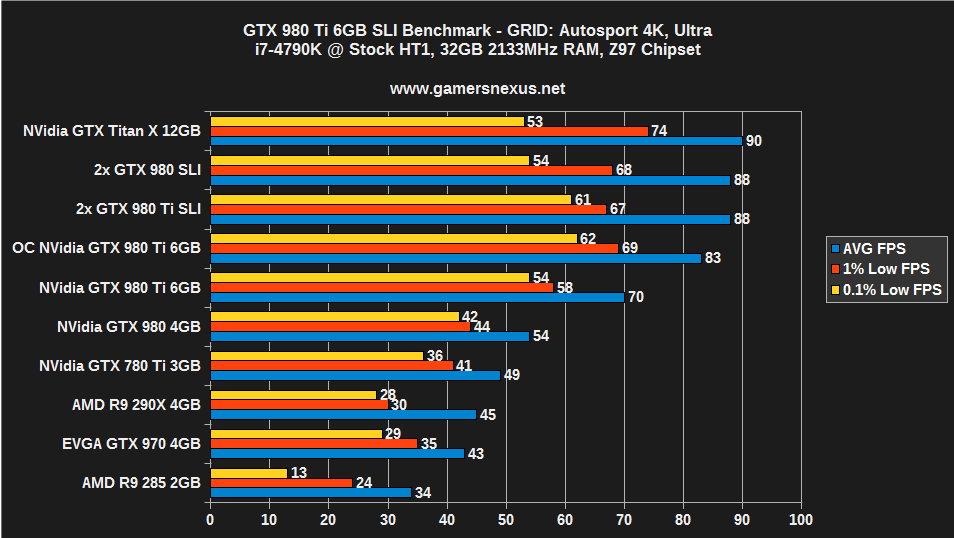
GRID: Autosport – GTX 980 Ti SLI 4K
GRID is another such title. As with Metro at 1440p, it appears GRID: Autosport is choking elsewhere in the pipe, as the SLI performance is effectively identical and within reach of the Titan X performance. In our 980 Ti review, we made a note that GRID: Autosport was the only title where the TiX drastically outperformed the GTX 980 Ti.
Shadow of Mordor – GTX 980 Ti SLI 4K & 1440p
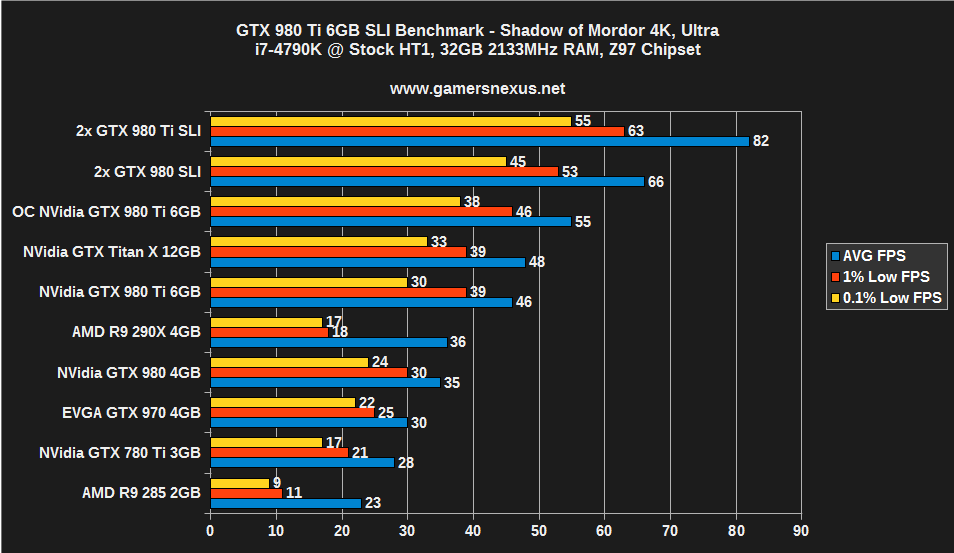
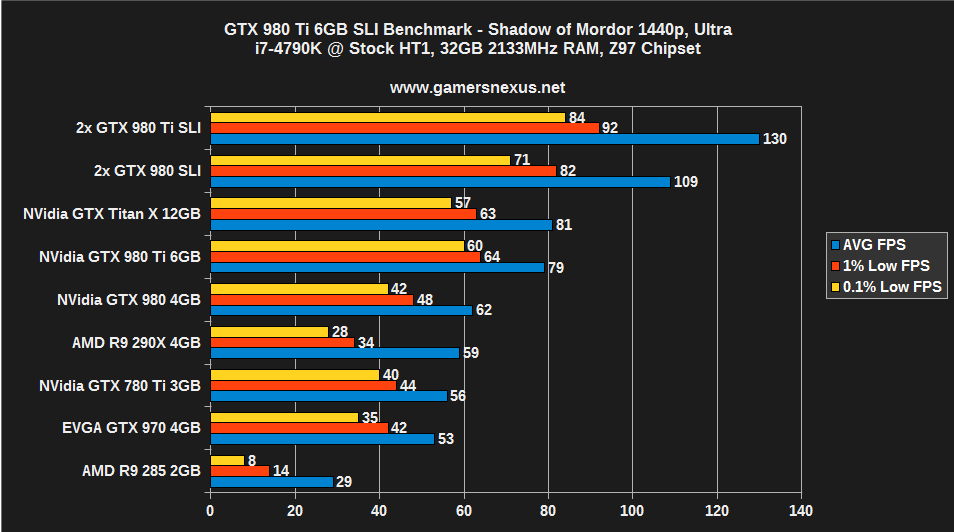
Shadow of Mordor produces a 21.6% performance gain at 4K for the 980 Ti in SLI over the GTX 980. For point of comparison, the lone GTX 980 Ti performs 27% better than the lone GTX 980; the gap thins with SLI, but is still noteworthy. Shadow of Mordor is actually playable at 4K with SLI 980 Ti cards using Ultra settings.
Far Cry 4 – GTX 980 Ti SLI Benchmark
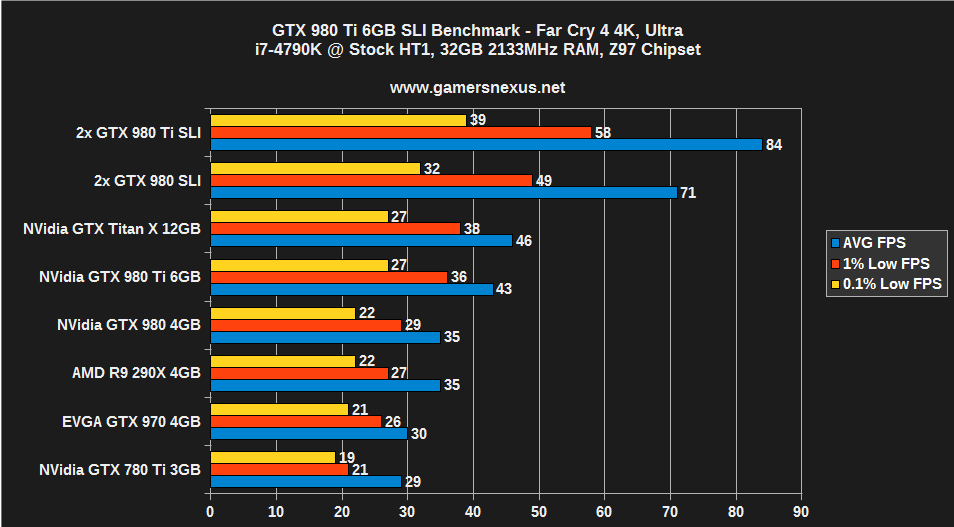
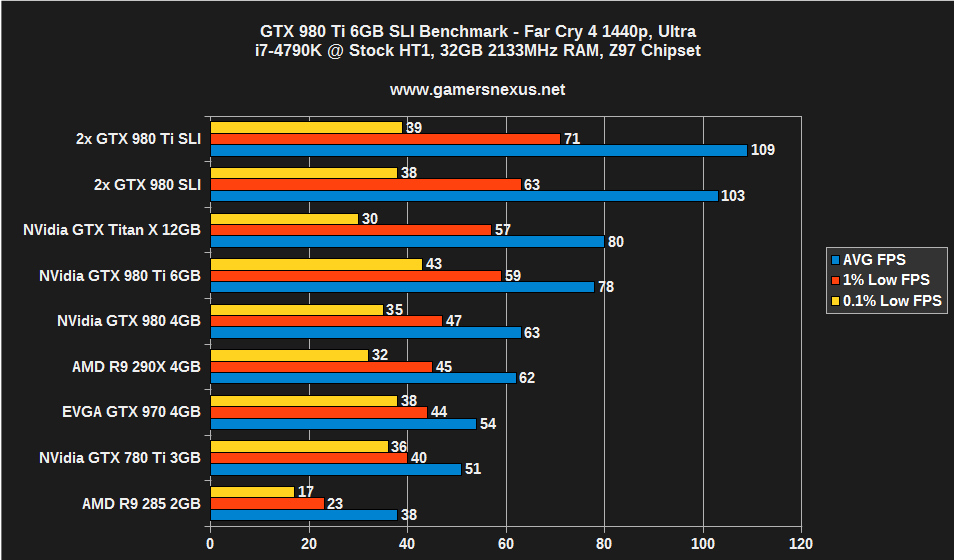
Far Cry 4 produces a ~16.7% performance delta over the GTX 980 SLI when using the 980 Ti cards in SLI. The gain against single GPUs is massive – nearly two-fold over the TiX – and produces playable 4K framerates. For the first time in my history testing Far Cry 4, I saw fluidity of frame output and playability without awkward choppiness.
Conclusion: Value is Tough, but Performance Excels
For the most part – aside from a few games that appear to choke in the pipeline when running SLI – the 980 Ti SLI configuration outputs exceptional framerates. Unfortunately, it's tough to argue 15 to 20% performance gains over the GTX 980 for an extra $300; granted, the framebuffer is larger on the Ti – 6GB vs. 4GB – and that could be advantageous in the near future.
Throwing the 980 Ti into SLI only offers value in the games where a more reasonable framerate advantage is shown, and is almost entirely relegated to higher resolution gaming. At 1080, which is largely unshown here, the framerates are already so absurdly high even with a single GPU that it just isn't worth SLI 980 Ti cards. At least, not unless you're trying for 1080p with 120FPS output, in which case it's arguable that the GTX 980s in SLI would be worth consideration.
At 1440p and 4K, there's an argument to be made in favor of the GTX 980 Ti SLI configuration for Mordor and The Witcher 3, which see >~20% performance gains for the two cards together.
Still, at $1300 for two, that's a tough sell. The one thing that is certain is the questionable nature of the Titan X's value right now; the $1000 card (currently $1100) is immediately outclassed by both the 980 SLI configuration (at $1000) and the 980 Ti configuration (a 30% price hike over MSRP). The GTX 980 Ti single solution, at $650 MSRP, performs effectively identically to the TiX sans GRID performance, further torpedoing the TiX for most use cases. Unless someone's planning a tri- or quad-SLI configuration with Titan Xs, at which point value is sort of a moot point, it's difficult to justify the purchase when nVidia's neighboring solutions perform so well.
We're hoping to try AMD's new GPUs in the near future and will revisit this topic at that time.
- Steve “Lelldorianx” Burke.
