Overclocking NVIDIA's GTX 980 Ti Graphics Card - A 19% Performance Gain
Posted on
Our initial review of the $650 GTX 980 Ti, published just over twelve hours prior to this post, mentioned an additional posting focusing on the card's overclocking headroom. The GTX 980 Ti runs GM200, the same GPU found in nVidia's Titan X video card, and is driven by Maxwell's new overclocking ruleset.
Maxwell, as we've written in a how-to guide before, overclocks differently from other architectures. NVidia's newest design institutes a power percent target (“Power % Target”) that increments power provisioning to the die to grant OC headroom. Unfortunately, this metric can't be exceeded beyond what the BIOS natively allows (without a hack, anyway), and means that we're sharing watts between the core clock, memory clock, and voltage increase. Overclocking on Maxwell offers some granularity without making things too complicated, though it's not until we get hands-on with board partner video cards that we'll know the true OC ceiling of the 980 Ti.
This post showcases our GTX 980 Ti initial overclock on the reference cooler, yielding a considerable framerate gain in game benchmarks.
NVidia GTX 980 Ti Specs
| GTX 980 Ti | GTX Titan X | GTX 980 | GTX 780 Ti | |
| GPU | GM200 | GM200 | GM204 | GK-110 |
| Fab Process | 28nm | 28nm | 28nm | 28nm |
| Texture Filter Rate (Bilinear) | 176GT/s | 192GT/s | 144.1GT/s | 210GT/s |
| TjMax | 92C | 91C | 95C | 95C |
| Transistor Count | 8B | 8B | 5.2B | 7.1B |
| ROPs | 96 | 96 | 64 | 48 |
| TMUs | 176 | 192 | 128 | 240 |
| CUDA Cores | 2816 | 3072 | 2048 | 2880 |
| Base Clock (GPU) | 1000MHz | 1000MHz | 1126MHz | 875MHz |
| Boost Clock (GPU) | 1075MHz | 1075MHz | 1216MHz | 928MHz |
| GDDR5 Memory / Memory Interface | 6GB / 384-bit | 12GB / 384-bit | 4GB / 256-bit | 3GB / 384-bit |
| Memory Bandwidth (GPU) | 336.5GB/s | 336.5GB/s | 224GB/s | 336GB/s |
| Mem Speed | 7Gbps | 7Gbps | 7Gbps (9Gbps effective - read below) | 7Gbps |
| Power | 1x8-pin 1x6-pin | 1x8-pin 1x6-pin | 2x6-pin | 1x6-pin 1x8-pin |
| TDP | 250W | 250W | 165W | 250W |
| Output | 3xDisplayPort 1xHDMI 2.0 DVI | 3xDisplayPort 1xHDMI 2.0 1xDual-Link DVI | DL-DVI HDMI 2.0 3xDisplayPort 1.2 | 1xDVI-D 1xDVI-I 1xDisplayPort 1xHDMI |
| MSRP | $650 | $1000 | $550 now $500 | $600 |
Test Methodology
We tested using our updated 2015 GPU test bench, detailed in the table below. Our thanks to supporting hardware vendors for supplying some of the test components. Thanks to Jon Peddie Research for GTX 970 & R9 280X support.
The latest GeForce press drivers were used during testing. AMD Catalyst 15.5 was used. Game settings were manually controlled for the DUT. Stock overclocks were left untouched for stock tests.
VRAM utilization was measured using in-game tools and then validated with MSI's Afterburner, a custom version of the Riva Tuner software. Parity checking was performed with GPU-Z. FPS measurements were taken using FRAPS and then analyzed in a spreadsheet.
Each game was tested for 30 seconds in an identical scenario on the two cards, then repeated for parity.
| GN Test Bench 2015 | Name | Courtesy Of | Cost |
| Video Card | NVIDIA | $650 | |
| CPU | Intel i7-4790K CPU | CyberPower | $340 |
| Memory | 32GB 2133MHz HyperX Savage RAM | Kingston Tech. | $300 |
| Motherboard | Gigabyte Z97X Gaming G1 | GamersNexus | $285 |
| Power Supply | NZXT 1200W HALE90 V2 | NZXT | $300 |
| SSD | HyperX Predator PCI-e SSD | Kingston Tech. | TBD |
| Case | Top Deck Tech Station | GamersNexus | $250 |
| CPU Cooler | Be Quiet! Dark Rock 3 | Be Quiet! | ~$60 |
Average FPS, 1% low, and 0.1% low times are measured. We do not measure maximum or minimum FPS results as we consider these numbers to be pure outliers. Instead, we take an average of the lowest 1% of results (1% low) to show real-world, noticeable dips; we then take an average of the lowest 0.1% of results for severe spikes.
We conducted a large suite of real-world tests, logging VRAM consumption in most of them for comparative analysis. The games and software tested include:
- Far Cry 4 (Ultra 1080, Very High 1080).
- GRID: Autosport (Ultra 1440, Ultra 4K).
- Metro: Last Light (Very High + Very High tessellation at 1080; High / High at 1440).
- GTA V (Very High / Ultra at 1080p).
- Shadow of Mordor (Very High, 1080p).
- 3DMark Firestrike Benchmark
- GTA V
- The Witcher 3
We already know ACU and Far Cry 4 consume massive amounts of video memory, often in excess of the 2GB limits of some cards. GRID: Autosport and Metro: Last Light provide highly-optimized benchmarking titles to ensure stability on the bench. Shadow of Mordor, GTA V, & Battlefield Hardline (not shown here) are new enough that they heavily eat RAM. 3DMark offers a synthetic benchmark that is predictable in its results, something of great importance in benchmarking.
Games with greater asset sizes will spike during peak load times, resulting in the most noticeable dips in performance on the 2GB card as memory caches out. Our hypothesis going into testing was that although the two video cards may not show massive performance differences in average FPS, they would potentially show disparity in the 1% low and 0.1% low (effective minimum) framerates. These are the numbers that most directly reflect jarring user experiences during “lag spikes,” and are important to pay attention to when assessing overall fluidity of gameplay.
Overclocked tests were conducted using MSI Afterburner for application of settings. All devices were tested for performance, stability, and thermals prior to overclocking to ensure clean results. On the OC bench, devices were set to maximize their voltage ceiling with incremental gains applied to the core clock (GPU) frequency. MSI Kombustor, which loads the GPU 100%, was running in the background. Once stability was compromised -- either from crashing or artifacting -- we attempted to resolve the issue by fine-tuning other OC settings; if stability could not be achieved, we backed-down the core clock frequency until we were confident of stability. At this point, the device was placed on a burn-in test using Kombustor and 100% load for 30 minutes. If the settings survived this test without logged fault, we recorded the OC settings and logged them to our spreadsheet.
Final OCs were applied and tested on games for comparison.
Thermals were reported using Delta T over ambient throughout a 30-minute burn-in period using 3DMark FireStrike - Extreme, which renders graphics at 1440p resolution. This test loads the VRAM heavily, something Kombustor skips, and keeps the GPU under high load that is comparable to gaming demands. Temperatures were logged using MSI Afterburner.
Overclocking Results
| CLK Offset | Max Clock | Mem Offset | Mem CLK | Voltage | Initial Test | Endurance? |
| +68MHz | 1245MHz | +500MHz | 4001MHz | 1.187V | Pass | N/A |
| +100MHz | 1289MHz | +500MHz | 4001MHz | 1.187V | Pass | N/A |
| +150MHz | 1339MHz | +500MHz | 4001MHz | 1.187V | Pass | N/A |
| +175MHz | 1364MHz | +500MHz | 4001MHz | 1.187V | Pass | N/A |
| +200MHz | 1389MHz | +500MHz | 4001MHz | 1.187V | Pass | N/A |
| +225MHz | 1414MHz | +500MHz | 4001MHz | 1.187V | Pass | N/A |
| +250MHz | 1439MHz | +500MHz | 4001MHz | 1.187V | Pass | N/A |
| +275MHz | 1464MHz | +500MHz | 4001MHz | 1.187V | Fail | Fail |
| +250MHz | 1427MHz | +500MHz | 4001MHz | 1.187V | Pass | Pass |
| +255MHz | 1444MHz | +500MHz | 4001MHz | 1.187V | Pass | Pass |
| +260MHz | 1450MHz | +500MHz | 4001MHz | 1.187V | Pass | Fail |
For overclocking, we configure the power percent target to its maximum value before adjusting voltage to its own max setting. The 980 Ti allows 110% of base power to be supplied to the GPU for overclocking and seems to hover around 1.187V after overvolting. We then slowly increment clockrate, observing for visual artifacting or catastrophic failures throughout the process. Each increment is left only for a few minutes before moving to the next step. We're eventually confronted with a driver failure, at which point the clockrate is backed-down and then endurance tested for 20-minutes using Kombustor.
Kombustor, an MSI-branded Furmark, is used for burn-in testing and stability. Running Kombustor forces the GPU to see 100% utilization, which evokes the highest boost clock possible under the current clock settings. We left the memory clock to +500MHz, though it could assuredly be pushed further.
The results are above.
We were able to achieve a stable frequency at +255MHz over base (1000MHz), achieving an output of 1444MHz max boost clock. Voltage throughput was logged at 1.187V.
Let's look at the performance difference after overclocking.
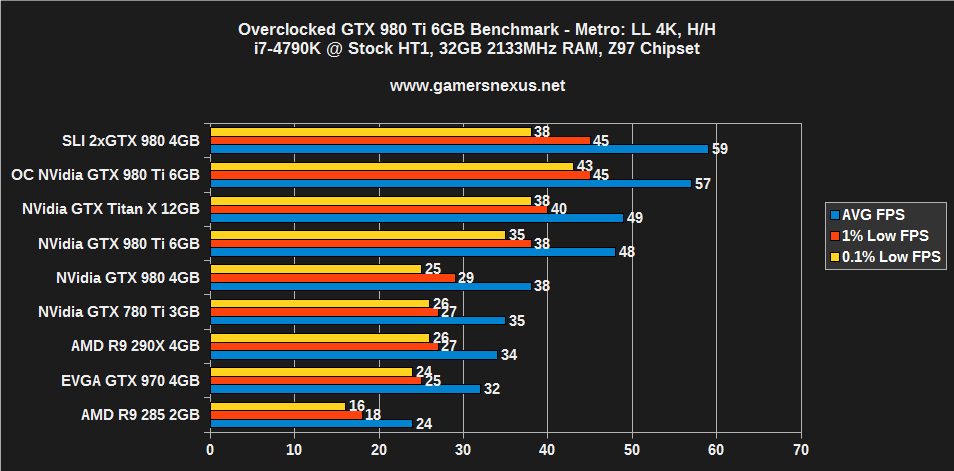
GTX 980 Ti Overclocking Benchmark
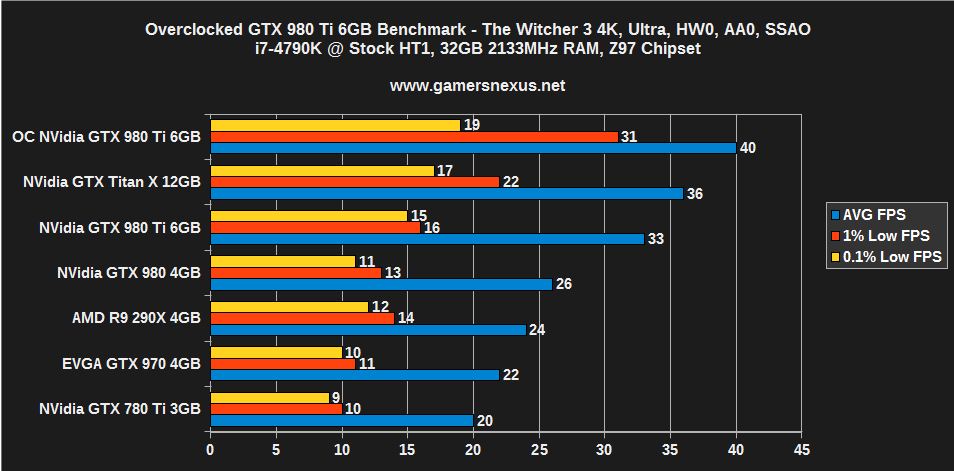
The GTX 980 Ti pushed an impressive clockrate over base, resulting in great gains in some games. The Witcher 3 at 4K sees a jump from 33FPS average to 40FPS average, with a massive 2x gain in 1% low FPS. At this point, the game becomes truly playable at 4K after lowering foliage viewing distance, bringing the framerate closer to 50FPS.
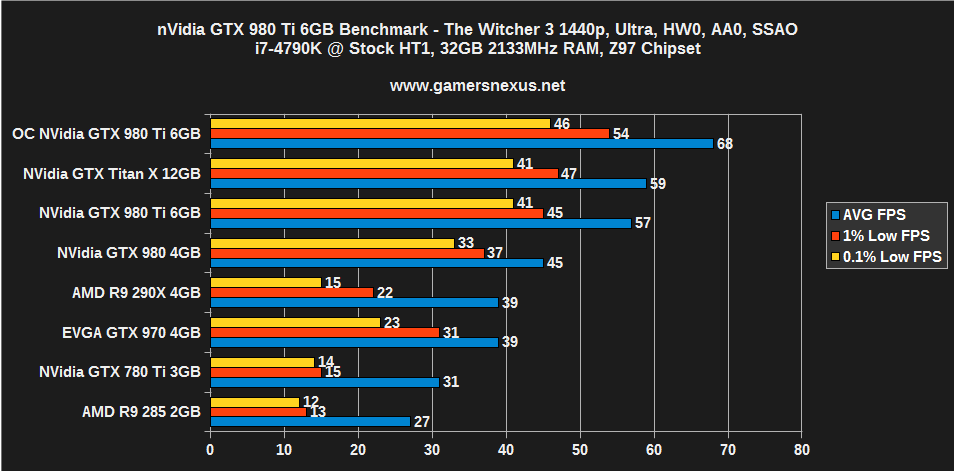
1440p sees a similar jaunt for the GTX 980 Ti. The card moves to 68FPS, ranked against the Titan X at 59FPS and 980 Ti base at 57FPS.
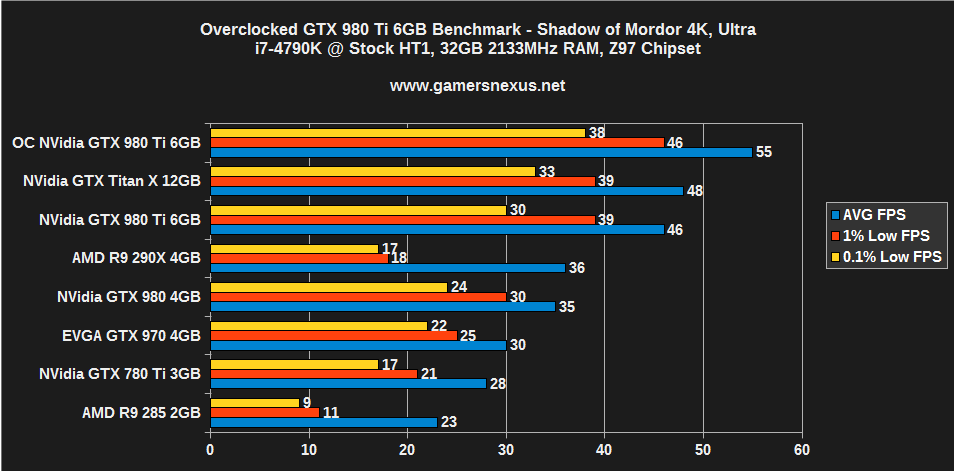
Shadow of Mordor also produces a ~10FPS gain over base and noteworthy gain over the TiX base at 4K.
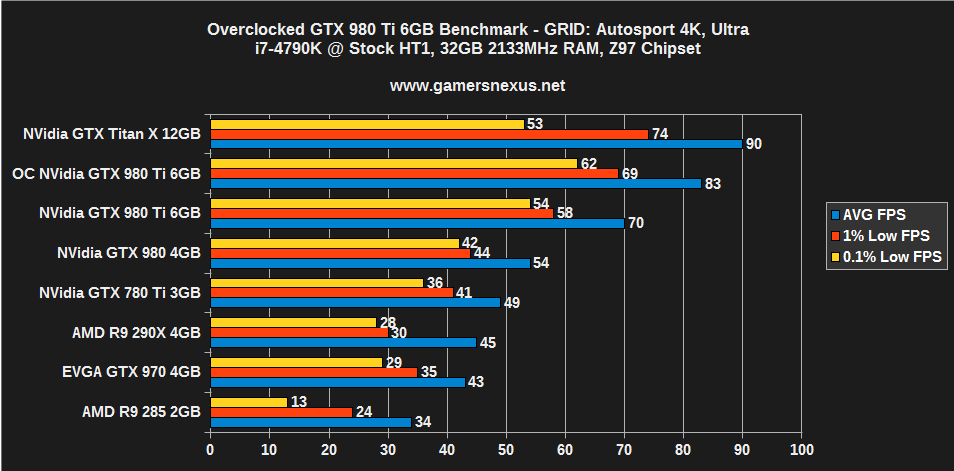
GRID: Autosport is a bit of an anomaly with the 980 Ti, and I'm not entirely sure why. This is the one game where we see a large disparity in framerate between the Titan X and 980 Ti, and that continues here; gains are still noteworthy after overclocking, though.
The overall performance gain sits at about +19% for the GTX 980 Ti, a marked improvement with minimal effort. Note that the reference cooler is throttling us at this +255 configuration and could become a concern for longevity of the GPU. We haven't received any yet, but aftermarket GPU coolers designed by board partners should greatly improve overclocking potential. EVGA's liquid-cooled 980 Ti looks particularly promising.
Read the full GTX 980 Ti review here.
