Blizzard announced in January that Overwatch had surpassed the 25 million player milestone, but despite being nearly a year old, there’s still no standardized way to benchmark the game. We’ve developed our own method instead, which we’re debuting with this GPU optimization guide.
Overwatch is an unusual title for us to benchmark. As a first person shooter, the priority for many players is on sustained high framerates rather than on overall graphical quality. Although Overwatch isn’t incredibly demanding (original recommended specs were a GTX 660 or a Radeon HD 7950), users with mid-range hardware might have a hard time staying above 60FPS at the highest presets. This Overwatch GPU optimization guide is for those users, with some graphics settings explanations straight from Blizzard to GN.
Overwatch Testing Methodology
Hardware Used
| Component | Courtesy Of | Price | |
| Video Card | MSI GTX 1080 Gaming X (OC Mode) | MSI | $640 |
| CPU | Intel i7-6700K @ 4.4GHz | GamersNexus | $300 |
| CPU Cooler | MSI Core Frozr L | MSI | TBD |
| Motherboard | MSI Z170A Gaming M7 | MSI | $180 |
| Memory | Corsair Vengeance LED 32GB 3200MHz | Corsair | $200 |
| SSD | Samsung 850 EVO 120GB | Samsung | N/A |
| PSU | Corsair RM650x | Corsair | $100 |
| Case | Fractal Define C | - | - |
Drivers used were 378.92 and 17.3.1.
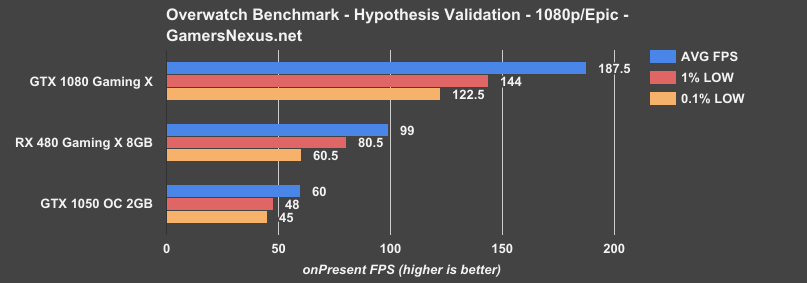
In order to kill two birds with one stone, we used our standard case testing system installed in the Fractal Define C (reviewed). Normally, this system has an MSI GTX 1080 Gaming X installed in it, and we used this to establish a baseline “best possible” scenario. After a couple of matches against real players at all epic settings on Oasis, the ingame framerate averaged out at 187.5 FPS (just a coincidence, not the GTA V Curse). The other two cards chosen were an MSI GTX 1050 ($115) and an MSI RX 480 Gaming X. This gives us fairly wide coverage of the GPU stack, without multiplying workload by insane amounts. Here’s a preview of how they fared, establishing our launching point for content:
GPU Bottlenecks in Overwatch
Clearly, there’s some room for optimization. This isn’t a strict apples-to-apples comparison, since the 480 and the 1050 were tested according to a strictly standard procedure whereas the 1080 was not, but it’s enough to show that the GPU is clearly a bottleneck in the case of the two lower-end cards. Most of our preliminary tests were performed on the 1050, since it performed worse and had more room for improvement. This meant we could more clearly see the settings that impacted GPU-bound performance.
Overwatch Settings Explained
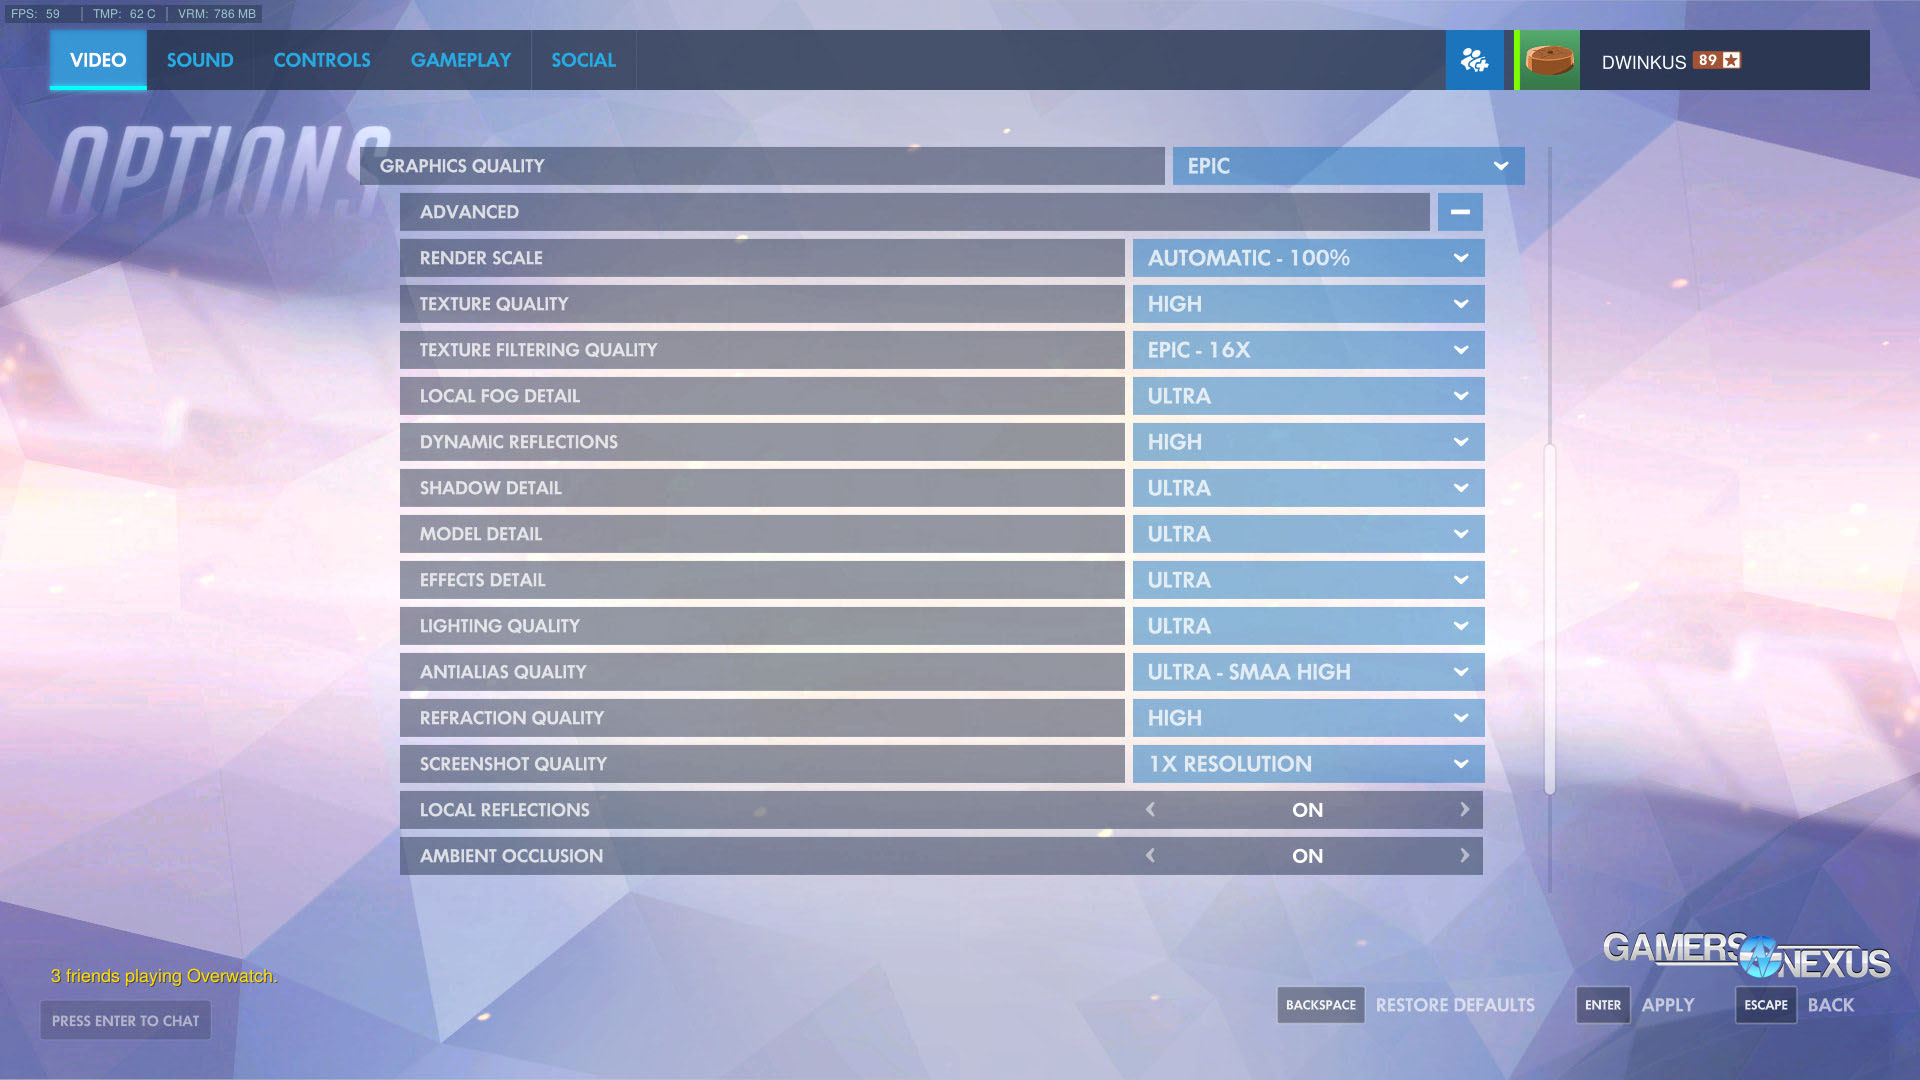
When we refer to the “maximum settings” in this article, it means individually setting each graphics option to its maximum value and vice versa with the minimum. The “Epic” and “Low” presets don’t actually do this for every setting, and things like texture quality and anti-aliasing may not get pushed all the way up or down by the presets. It also seems that presets will sometimes scale with the hardware used, meaning they don’t necessarily have a hard definition.
Maximum settings
All testing was done at 1920x1080, a reasonable resolution for an average Overwatch player trying to squeeze some extra performance out of their GTX 1050. Render scale was set to 100% for all tests (this has a tendency to be changed for mysterious reasons), and the framerate cap was set to 300, the highest possible. Field of view was configured to the maximum 103 degrees.
For a thorough explanation of individual graphics settings, please refer to our earlier article from the Overwatch beta. After publication of this article, the Overwatch dev team reached out to GamersNexus to clarify some individual settings, and we’re relaying those clarifications here, keeping in mind that these explanations are nearly a year old and have had some names updated since.
“Local Fog Detail” – we have several different layers of fog in Overwatch. Local fog is the volumetric effect of light scattering around the camera – the fog that causes crepuscular rays. The other layers of fog we count as distance fog, which is more in line with traditional fog in other games. The local fog detail settings controls the amount of time the engine will spend computing local fog – the higher the setting, the more detailed (and costly) the local fog will be. In general, most hero abilities don’t interact with the local fog, but there are several that do.
Model detail caused some issues with the landmark we were using in the practice range
“Model Detail” – this pushes the LOD of all meshes, _except_ the first person models. At lower settings, this also removes cosmetic only meshes. Reducing the triangle throughput improves the performance of the game on low end GPUs but reduces visual quality and physics detail. Unfortunately, many of the top players like to play with low settings, to reduce clutter. Kind of makes me sad, but I understand why they do it.
“Local Reflections” and “Dynamic Reflections” – we have multiple layers of reflections in Overwatch. These two settings allow the user to disable / enable them, and in the case of dynamic reflections, select the desired quality. Local reflections use cube maps we’ve baked offline, so the cost for that layer is fairly small, although on non-discrete GPUs we need every bit of performance, so they are good to turn off there. Dynamic reflections use the rendered scene to compute real-time reflections. This effect can be expensive depending on the quality selected.
“Translucent Shadow Detail” – controls the casting of colored shadows from translucent objects (ie, glass) and effects (smoke). It’s hard to see this in action, but you can see it in Numbani from the windows on the bus if you look closely.
“Dynamic Ambient” – this is poorly named, and I need to think up another name. [Ed. note: this setting is now gone] This controls the ability of lights to dynamically update the ambient light in a map. This is mostly a CPU side cost, so it’s best to turn off when you are running on limited core / slow CPU.
“Anti-Aliasing Quality” – For the different levels of SMAA, this controls the effort the SMAA shader will put in to find / smooth edges. We don’t do any of the SMAA 2x/4x modes. For super-sampling, we use render scale.
“Simple Ambient Light” – this controls the quality of ambient light on larger objects like trees. [Ed. note: this setting is also gone]
Overwatch Synthetic Graphics Tests - Initial Research
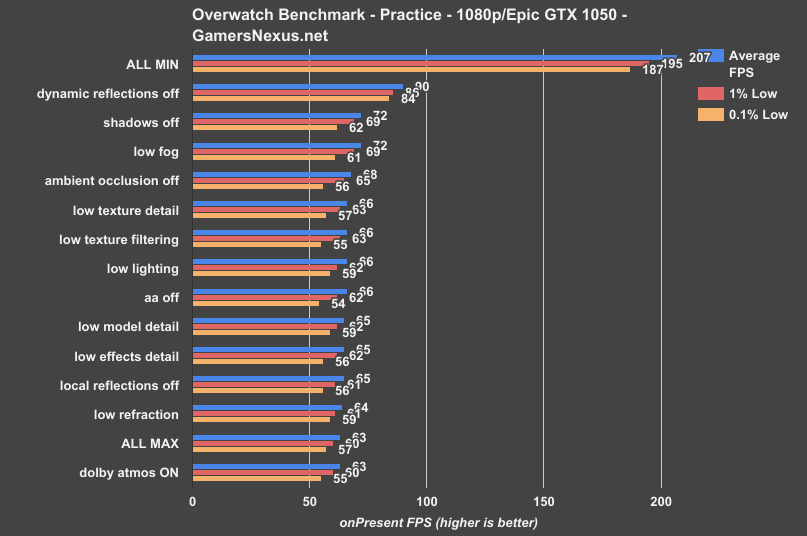
In order to design a standard test procedure, we first went to the practice range. Overwatch’s practice range is a small map filled with generic dummy robots, and although it’s extremely reliable in terms of repeatable performance, we didn’t believe it could represent actual gameplay performance. Instead, using the GTX 1050 and starting at the maximum settings, we turned down each feature one by one and determined which ones had a real impact on performance. Tests were performed by selecting Tracer on the Practice Range map. This establishes a baseline, but is by no means a complete test procedure. We’re only doing something so simple to get an immediate, rapid understanding of what the game’s settings do. Our next set of tests will compare performance of the settings in bot matches.
Here are those results, sorted by framerate:
Overwatch Graphics Setting Benchmark Comparison
Obviously dynamic reflections, shadows, and local fog detail are worthy of attention. Graphics settings are a matter of personal preference with regard to visuals, but texture and model detail are two of the most vital options for appearance, and thankfully neither one immediately appears to affect the framerate. Texture quality is also the most dependent on VRAM, given that higher quality textures (of higher resolutions) will require more video card memory.
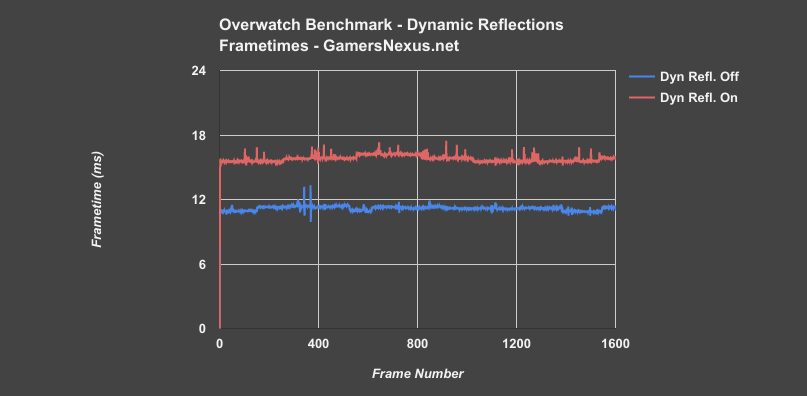
Of note, toggling Dynamic Reflections results in a 43% improvement from baseline, toggling Shadows results in a 14% improvement over baseline, same for fog, and disabling AO gives us 8% back.
VRAM request size at maximum settings never reached 2GB, and it won’t be a concern for most modern cards. Dolby Atmos (surround sound for headphone users) isn’t a graphics option and was left off for all tests, since it didn’t have any noticeable effect on framerate. Finally, at minimum settings, a theoretical maximum of 207 FPS was established (indicating a constraint elsewhere). This was encouraging because of the 300 FPS framerate cap: if the 1050 wasn’t hitting the cap in the practice range at minimum settings, then it would probably never do so during our real tests.
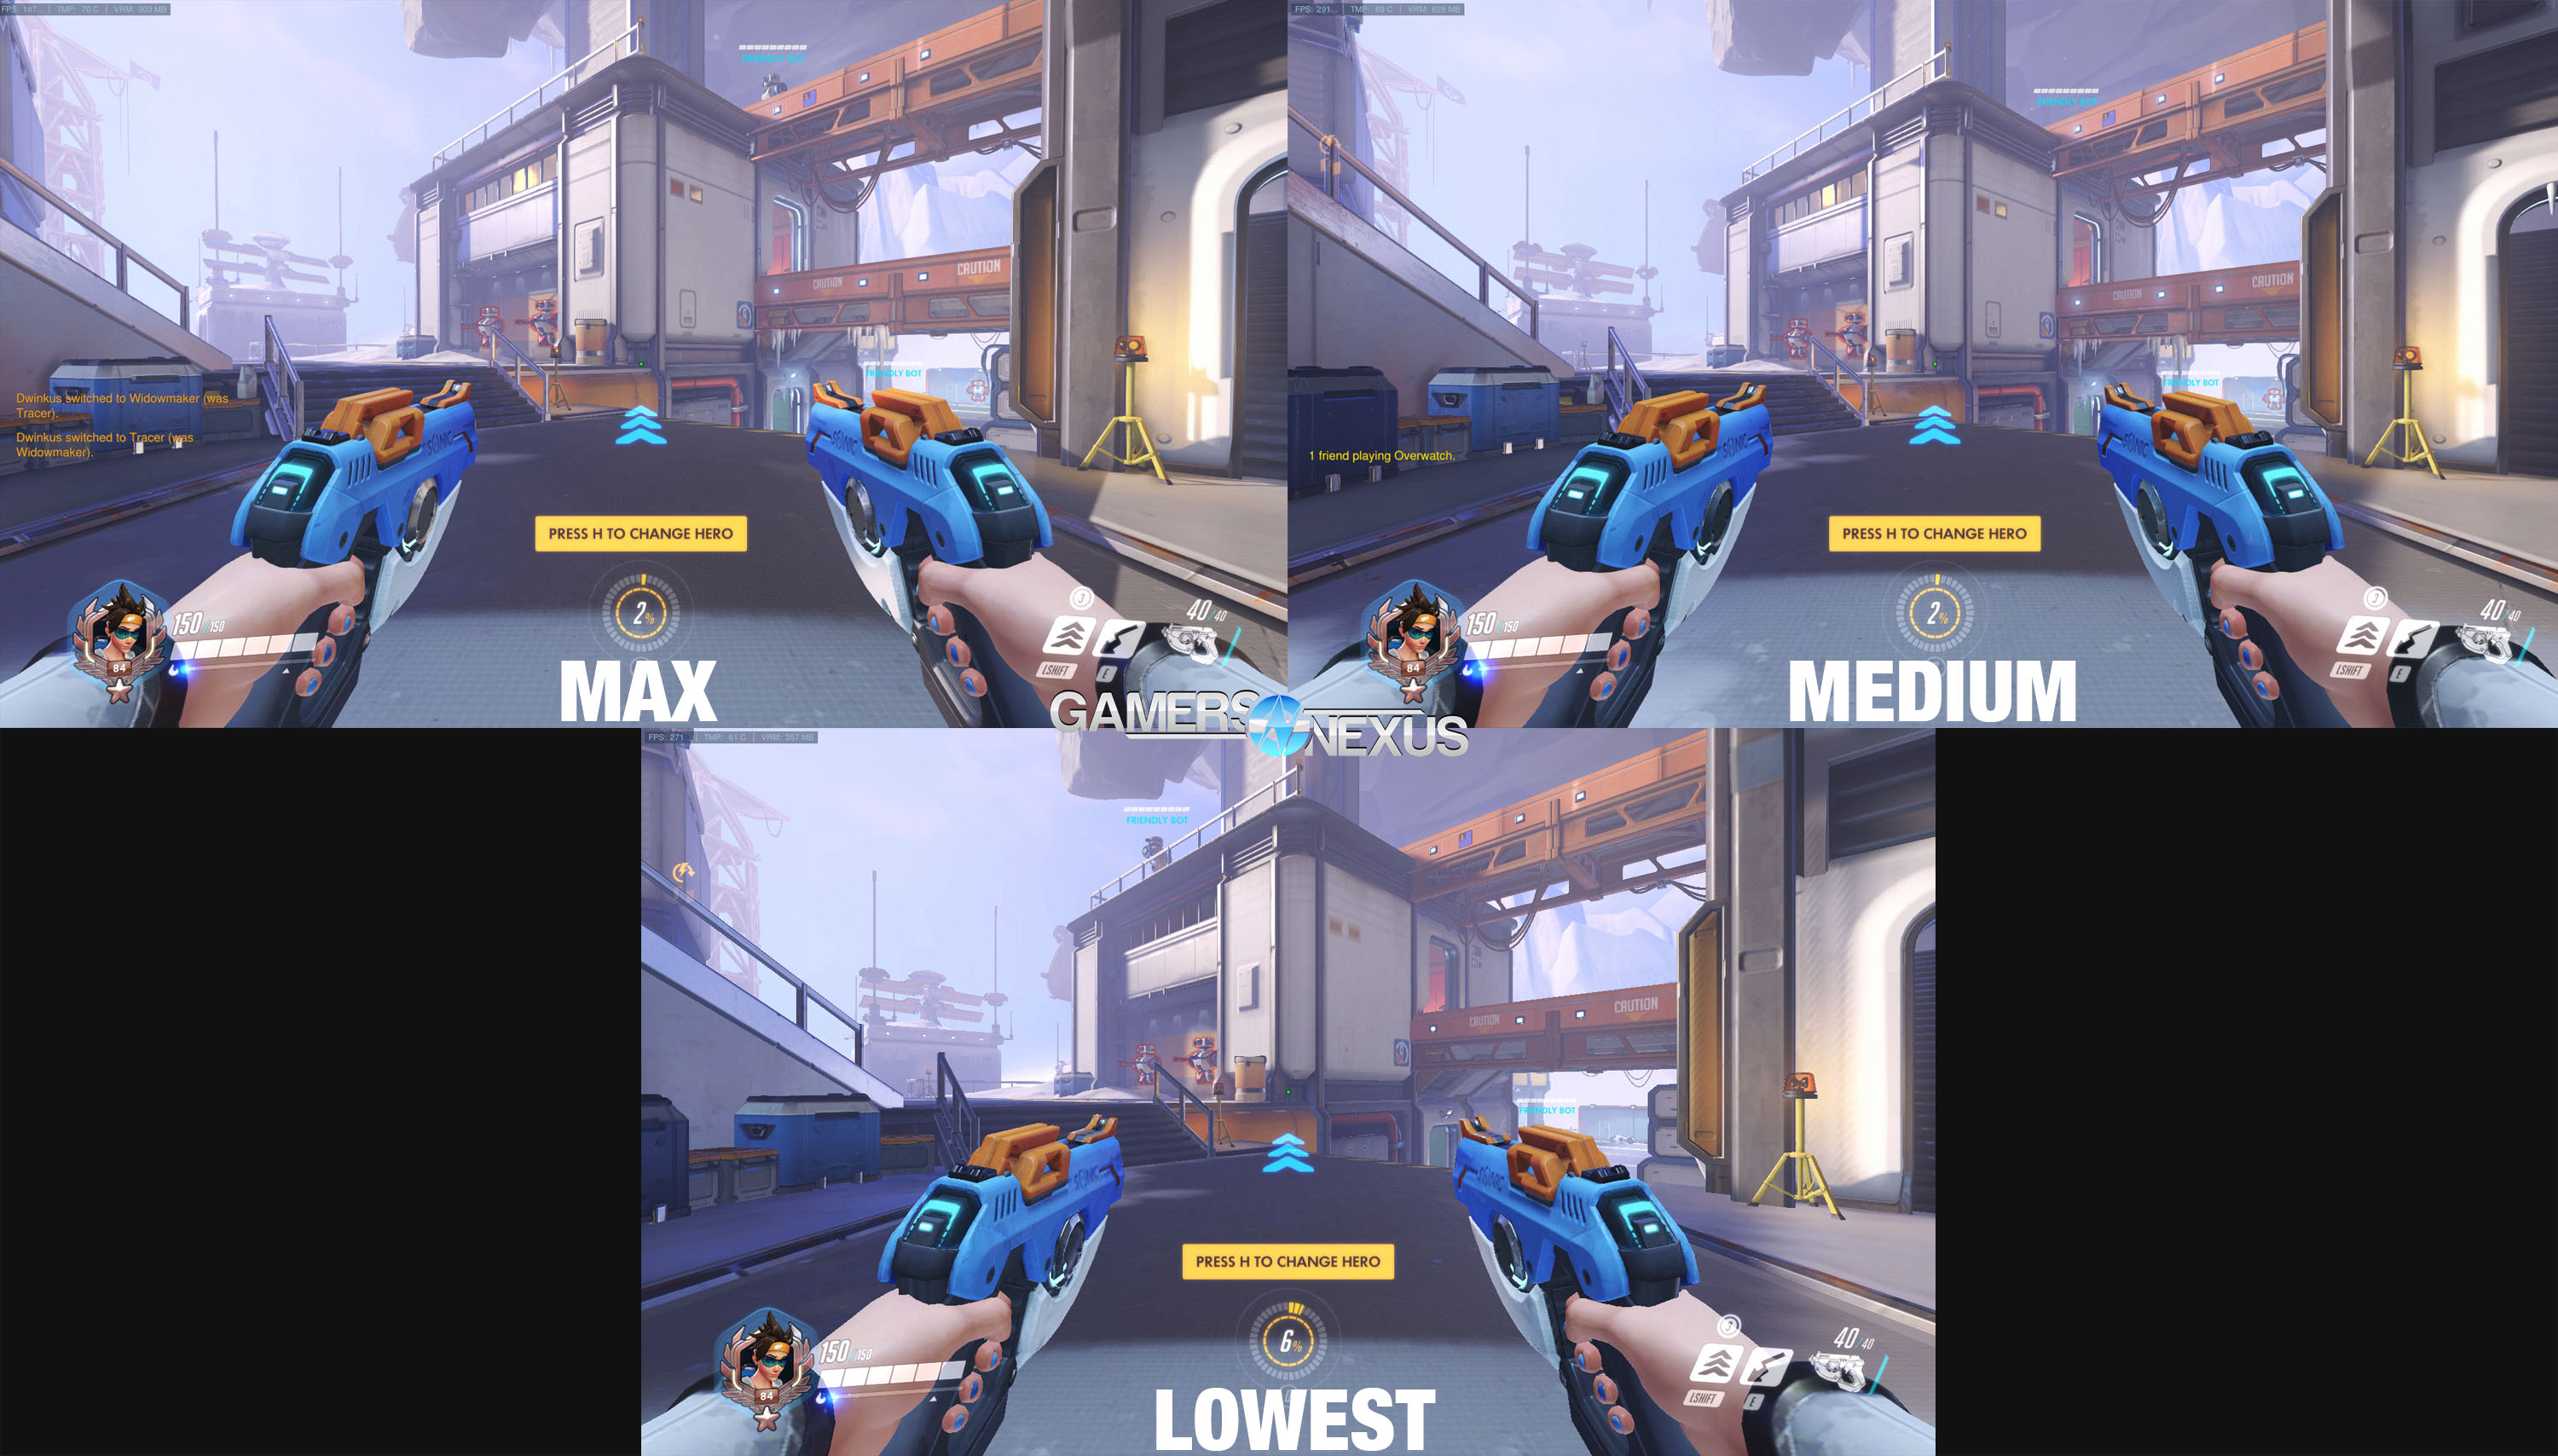
Highest vs medium vs lowest settings in the practice range
Overwatch GPU Performance in Competitive Matches
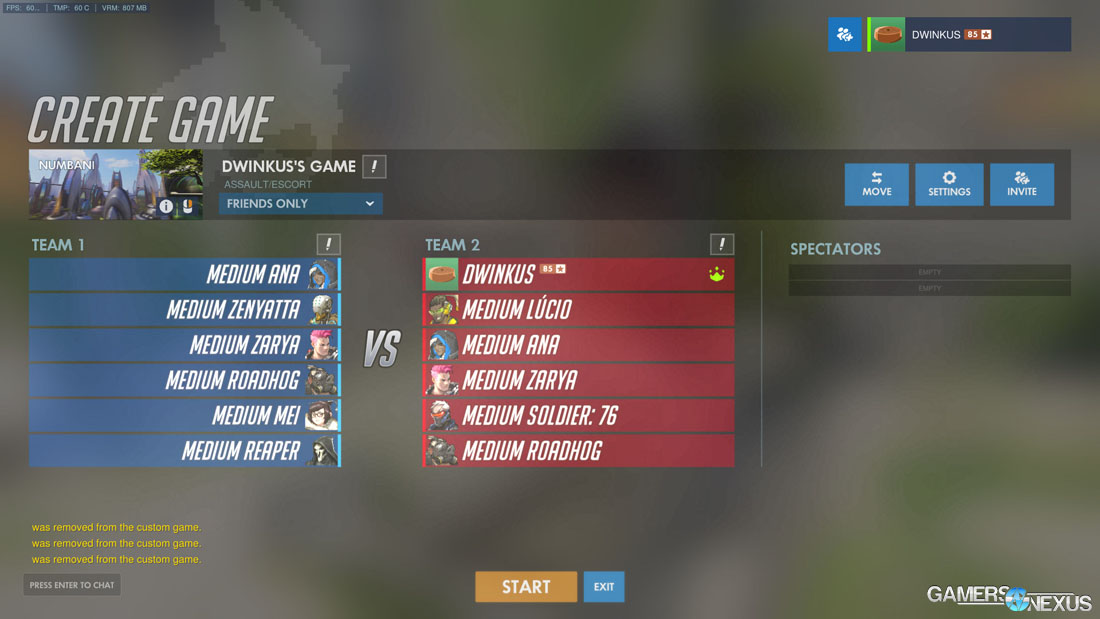
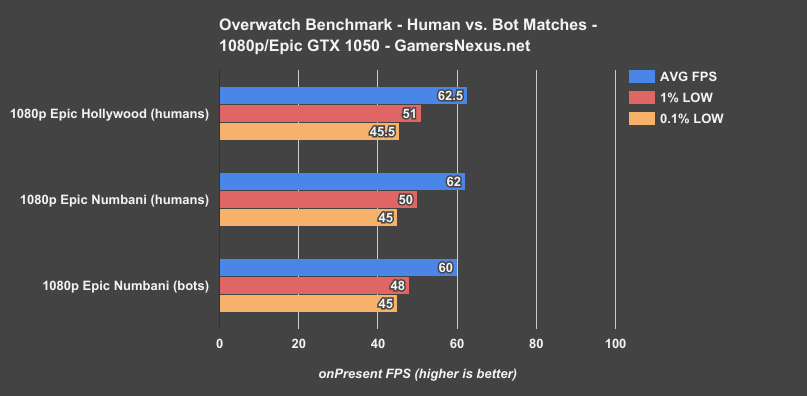
For “real” tests, we fought bot matches with the same team composition, same bot difficulty (medium), same map (Numbani), and the same objective (attack) each time, and got very consistent results. Framerates were logged from the moment the doors opened to the moment that the match ended with slow motion. In order to verify that this was a valid test method, we logged FPS in matches against real humans on Numbani and Hollywood. Those results:
Human vs. Bot Match (Test Theory Validation)
Although there’s some slight variance -- more because of the semi-random nature of matches -- this indicated that the test with bots was effectively identical to a test with humans. If anything, the bot match may have been more intensive (bot matches aren’t hosted locally -- don’t worry), but the reality is that these numbers, given all the variables of a match, are “effectively equal.”
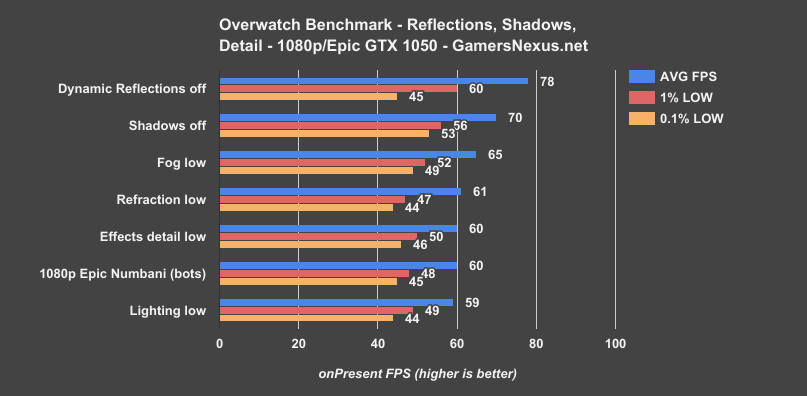
With that settled, we moved on to testing individual settings. As mentioned above, dynamic reflections, shadows, and local fog were the top candidates for optimization. We also chose to test effects detail, lighting, and refraction, since we felt that these were options that didn’t have a real chance to affect things in the practice range and could contribute to 1% and 0.1% dips ingame.
Overwatch Benchmark: Dynamic Reflections, Shadows, & Detail
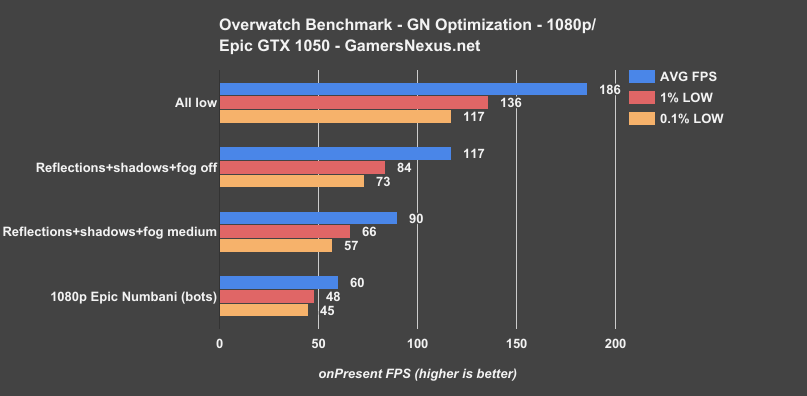
The trends seen in the practice range continued in-game, although the actual framerates changed drastically. The maximum improvement again resulted from disabling dynamic reflections, but the 0.1% Low remained at 45 FPS. Turning down effects detail, lighting, and refractions produced framerates indistinguishable from the maximum settings, even in the 1% and 0.1% Lows. This confirmed our choice of three top candidates for optimization.
Getting rid of Dynamic Reflections, now in our bot match for real-world representation, frees-up a 30% increase in average FPS. For Shadows, we see a 17% improvement, while setting everything to low (from Epic) posts a maximum possible change of 210%.
Overwatch Optimization Benchmark
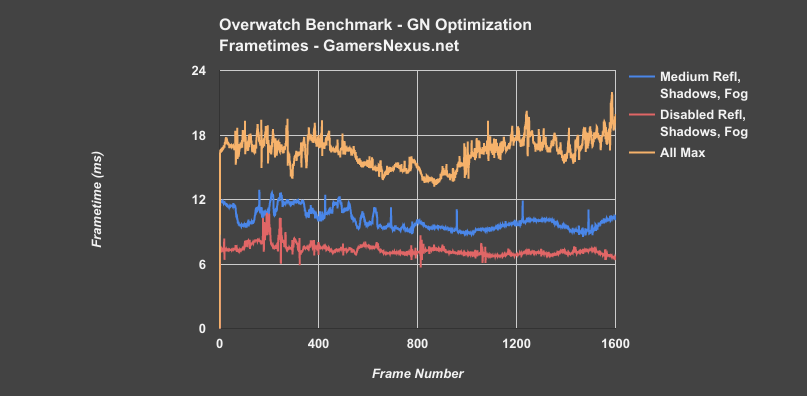
On the GTX 1050, simply turning these three settings down to medium keeps framerates above 60FPS the vast majority of the time (50% improvement, jointly). Disabling them completely gave 117FPS average (95% improvement, jointly), 69FPS lower than turning every single setting to the minimum.
Testing Our Optimized Settings on the RX 480 8GB
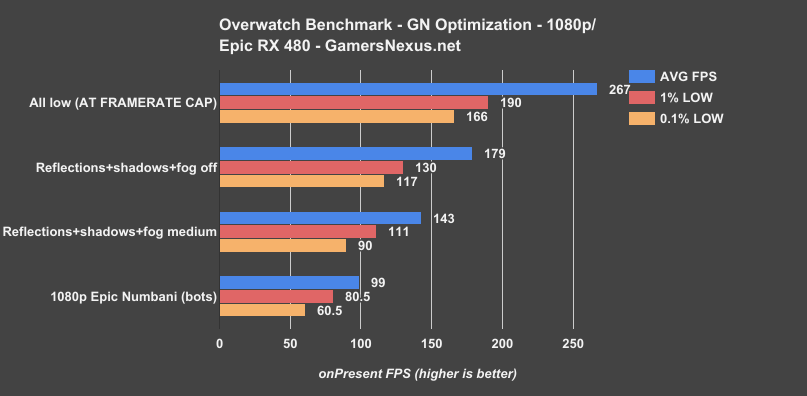
The RX 480 often bumped up against the 300FPS cap when all settings were turned down, so the 267 FPS average is below what it could be without said cap. At maximum settings, the 0.1% Low was still above 60FPS, which is perfectly playable; however, with the three relevant settings disabled, the 0.1% Low rises to nearly 120FPS--good news for owners of 120Hz monitors with a strict zero-tolerance policy.
Scaling here shows medium settings boosting from our 99FPS baseline by 44% -- comparable to the GTX 1050’s scaling. We see ~81% improvement by disabling reflections and shadows.
Conclusion
For users experiencing a GPU bottleneck in Overwatch, the order of settings to experiment with is this: dynamic reflections, shadow detail, and local fog detail (and then maybe ambient occlusion for the truly desperate). Other settings don’t significantly affect the GPU and will decrease quality with no benefit. Shadows are often a useful indicator of enemies, and turning them completely off is generally unnecessary--and the same goes for the other settings. This is hardly a formal benchmark, but turning these three settings to medium and every other setting all the way up has consistently given us 70+ FPS even with an old R9 285. This strategy will not apply to users who are experiencing a CPU bottleneck, as we did not test for CPU performance limitations or scaling.
Editorial, Test Lead: Patrick Lathan
Video Host: Steve Burke
Video Production: Andrew Coleman
