GTA V CPU Bottleneck Benchmark - 4790K vs. 3570K, FX-9590, 8370, 8320, & More
Posted on
A week of benchmarking behind us, we've now tested most major aspects of Rockstar's new GTA V PC release. We've elected to adopt the game into our test methodology for future component reviews, given its wide performance demands and load balancing between the CPU and GPU. This final GTA V benchmark looks at CPU bottlenecking at various resolutions and settings; we pit the 3570K, 4790K, FX-8320E, FX-8370E, FX-9690, G3258, and Athlon 760K against one another.
The selection casts a wide net for core count and price points, hopefully illustrating where CPU bottlenecks may appear in playing GTA V.
Previous GTA V Content
- The Complete Graphics Optimization Guide
- GTA V Texture Quality Comparison
- GTA V GPU Benchmark
- GTA V PC Crash Fixes
- [video] Graphics Optimization Guide
- [video] GTA V Max Graphics @ 4K
- [video] GTA V Benchmark
- [video] GTA V Texture Comparison
Test Methodology
We tested using our updated 2015 test bench, detailed in the table below. Our thanks to supporting hardware vendors for supplying some of the test components.
CPUs tested include:
- Intel i7-4790K ($340)
- AMD FX-9590 ($310)
- Intel i5-3570K (deprecated)
- AMD FX-8370E ($200)
- AMD FX-8320E Black Edition ($136)
- AMD Athlon 760K ($90 – deprecated)
- Intel Pentium G3258 ($70)
The latest 350.12 GeForce driver was used during testing. AMD's 15.4 Catalyst Beta was used for its GTA improvements. The first GTA V patch was applied. Game settings were manually controlled for the DUT. Overclocking was neither applied nor tested, though stock GPU overclocks (“superclocks”) were left untouched. CPU overclocking was not applied.
VRAM utilization was measured using in-game tools and then validated with MSI's Afterburner, a custom version of the Riva Tuner software. Parity checking was performed with GPU-Z. FPS measurements were taken using FRAPS and then analyzed with FRAFS.
FPS logs were analyzed using FRAFS, then added to an internal spreadsheet for further analysis.
Each game was tested for 30 seconds in an identical scenario on the cards, then repeated for parity.
| GN Test Bench 2015 | Name | Courtesy Of | Cost |
| Video Card | NVIDIA AMD | $1000, $150 | |
| CPU | CyberPower AMD GamersNexus | $340 | |
| Memory | 32GB 2133MHz HyperX Savage RAM | Kingston Tech. | $300 |
| Motherboard | Gigabyte Z97X Gaming G1 ASRock Fatal1ty 990FXSRock Fatal1ty 990FX MSI A88XM E45SI A88XM E45 | GamersNexus AMD GamersNexus | $285 $135 $76 |
| Power Supply | NZXT 1200W HALE90 V2 | NZXT | $300 |
| SSD | HyperX Predator PCI-e SSD | Kingston Tech. | TBD |
| Case | Top Deck Tech Station | GamersNexus | $250 |
| CPU Cooler | Be Quiet! Dark Rock 3 | Be Quiet! | ~$60 |
Average FPS, 1% low, and 0.1% low times are measured. We do not measure maximum or minimum FPS results as we consider these numbers to be pure outliers. Instead, we take an average of the lowest 1% of results (1% low) to show real-world, noticeable dips; we then take an average of the lowest 0.1% of results for severe spikes.
Tests were conducted on an identical configuration with either a Titan X or R9 270X, swapping only the motherboard and CPU for each test. The Titan X was used to enforce a CPU bottleneck in as many scenarios as possible. The 270X was used for illustration of a more likely user scenario.
All tests were conducted using the benchmarking utility – we opted to record only the portion where the fighter jet travels through the valley. This valley showcases nearly every setting in action – grass, water, view distance and scaling, reflections, shadows, and real-time night/day cycling for dynamic lighting effects.
Note that more “situational” settings may not be reflected perfectly in our bench. Water quality, for instance, will more severely impact FPS if swimming in the ocean rather than just flying over it or near it.
“Advanced Graphics” settings were applied to the “MAX” settings benchmark below. Anti-aliasing was disabled in all forms, sans FXAA, which we've proven to have effectively zero impact on performance. Tests conducted with Very High / Ultra settings were maxed-out on all “graphics” tab options, sans AA; advanced graphics tab options were off for these tests. “High” indicates that all “graphics” tab settings were configured to high across the board.
Memory was left clocked to 1866MHz (downclocked from native) to ensure greatest compatibility across all motherboards in the platform. Components can't be as heavily controlled in CPU testing as in GPU testing due to the nature of the test. A clean image was ghosted to the SSD for each CPU, ensuring avoidance of host-platform instability resultant of major component changes. All drivers were updated to their latest versions.
Additional hyperthreading tests are defined below.
All CPU power saving features were disabled for performance reliability. Clocks were not locked; native Turbo or other boosting technologies were left enabled to resemble a real-world scenario.
In cases of low confidence, CPUs were left to burn-in for one hour (or until failure) to determine whether the CPU could stably play the game for extended periods of time.
A Reminder: Hyperthreading & Core Inequality
Hyperthreading has long been understood to apply overhead to processing in gaming tasks. This overhead detracts marginally – insubstantially – from the FPS output in games with great consistency. Normally, such FPS differences would be chalked-up to margin of error, but we conduct hyperthreading vs. no-HT tests with additional passes to highlight that this small difference is replicable.
Hyperthreading may offer advantages in professional applications, but that's not something we'll go into here. Because the 3570K – a previous-gen i5 processor – was outperforming the 4790K HT by about 1FPS in many tests, we wanted to add HT-disabled tests to reduce confusion.
Also note that cores are not identical across architectures or generations. AMD's definition of a “core” is inherently different from Intel; this doesn't make either more “correct” than the other, it just means that philosophy and execution are different. Among countless other architectural differences, AMD and Intel starkly contrast in FPU and INT unit prevalence; AMD's modules host two INT units per FPU, whereas Intel favors FPUs slightly more. This is just one of many changes that makes linear core-to-core on-paper specs comparisons (without objective benchmarking) effectively impossible, and at the least, irresponsible.
The point of this is that “4 cores” for one CPU may have different meaning for another.
Decent FPS Doesn't Necessarily Mean 'Playable' – The Caveats
A final caveat: We took note of some visual artifacting that occurred during benchmarking, something that is only observable to an onlooker and won't be measured by FPS monitoring utilities.
The lower-end 760K CPU – an APU with the IGP disabled – exhibited occasional “flickering” and green flashes, indicating a performance limitation on the CPU. Although the CPU did push playable FPS by many definitions of the term, users of this CPU may observe annoying visual artifacts at times.
As for Intel's G3258, a dual-core Pentium solution for ultra-budget systems, we were unable to achieve stability for longer than a few minutes at a time. The two times that a test pass was completed, the 1% low and 0.1% low FPS outputs hit a dismal 7 and 5FPS (respectively), effectively making for an unplayable experience. Minutes into our burn-in (part of the low-confidence parity check), the game froze as the CPU failed to keep up with demand. It just isn't powerful enough and is too thread-limited for GTA V.
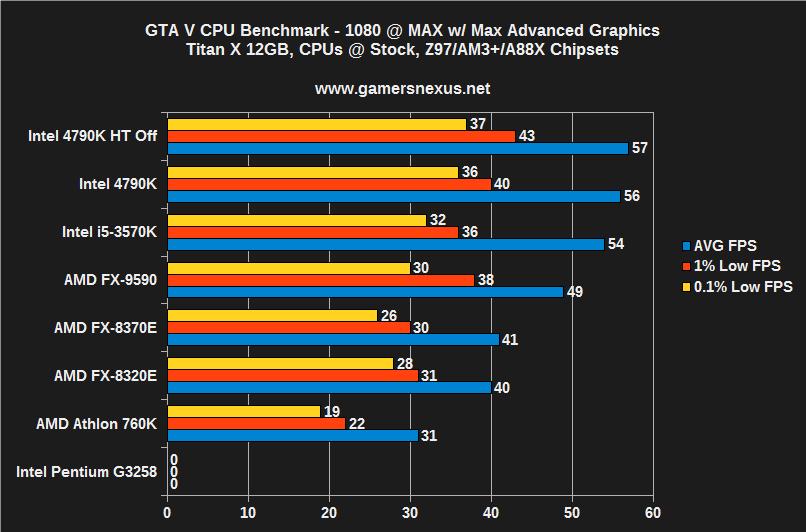
GTA CPU Benchmark – 1080p at MAX Settings with Titan X
This test produces some of the most noticeable performance jaunts between CPUs. Even with hyperthreading, the 4790K outperforms the 3570K in this single instance – we'd imagine that one of the “advanced graphics” settings, all enabled here, is more thread-intensive and doesn't suffer from the usual slight overhead hit.
As for the AMD options, the high-end FX-9590 ($310) falls a full 7FPS behind the 4790K and suffers from lower 1% and 0.1% low FPS output. The performance difference at this level is what negotiates a 60FPS framerate (or close to it) and something notably slower; although we find ~50FPS to be plenty enjoyable in a game like GTA V, the 8370E and 8320E framerates are low enough to encourage settings decreases to improve speed.
The Athlon 760K is outright unplayable at these maxed-out settings. It appears that the “advanced” tab hosts CPU-bound options.
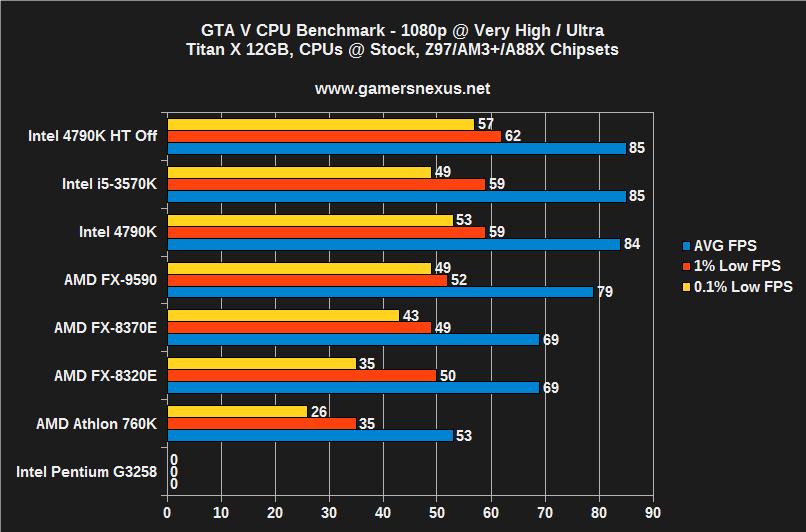
GTA CPU Test – 1080p at Very High / Ultra with Titan X
At 1080p with “very high” and “ultra” graphics settings, still using the Titan X to force a CPU bottleneck, we see that the FX processors now exceed 60FPS while still trailing Intel's offerings. It is noteworthy that the i5-4690K ($233) would hover around where the 3570K and 4790K rest, making it one of the most cost-effective purchases for GTA V.
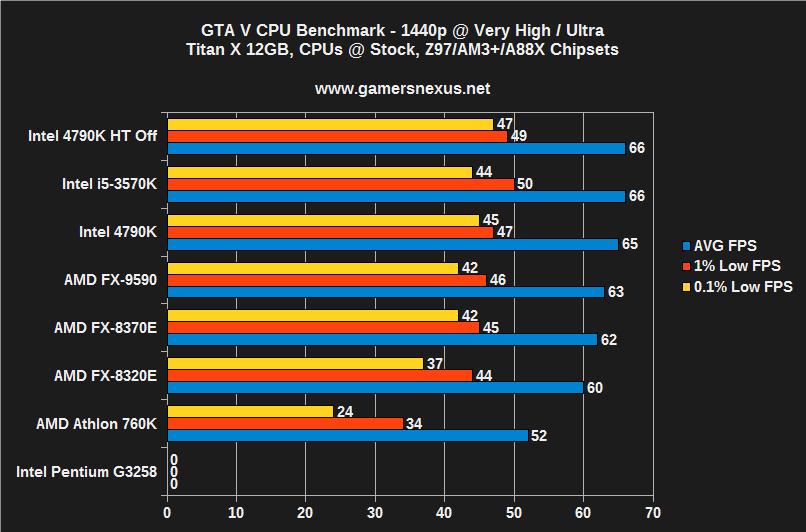
GTA V CPU Benchmark – 1440p at Very High / Ultra with Titan X
The gains of higher-end CPUs begin to vanish at this point, as we're now entering territory where the pixel throughput is high enough to saturate aspects of the GPU's pipeline. The most noteworthy differences are at the low-end, namely the 760K – trailing severely behind with its limited featureset – and the 8320E, also straggling.
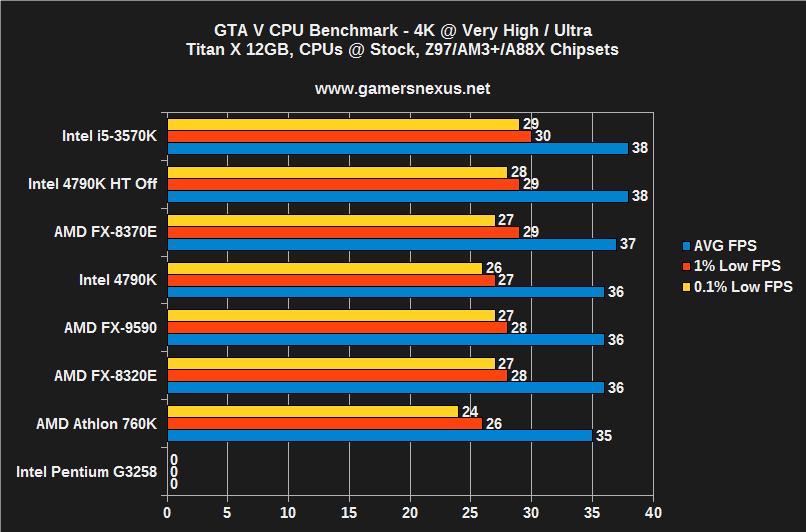
GTA V CPU Benchmark – 4K at Very High / Ultra with Titan X
4K effectively forces a GPU bottleneck, meaning that even the 760K doesn't show as large a performance limit. It did, as noted above, exhibit visual artifacting.
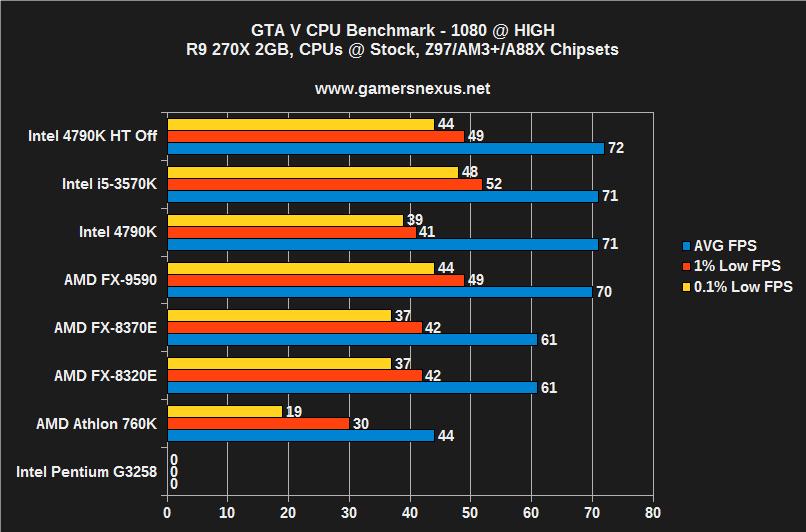
GTA V CPU Benchmark – 1080 at High with R9 270X
“High” settings with a 270X again show CPU throttling with the FX-series CPUs, aside from the 220W FX-9590, which manages to keep pace with Intel.
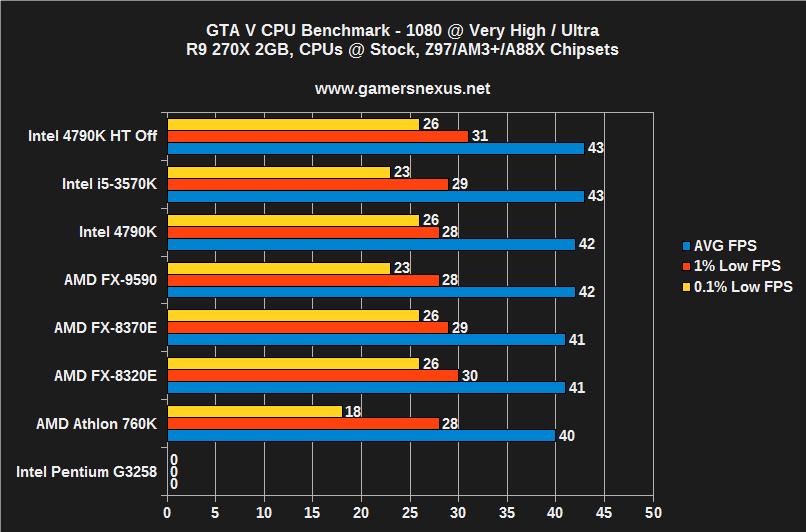
GTA V CPU FPS – 1080 at Very High / Ultra with R9 270X
At “Very High” and using a 270X, performance across the board becomes GPU-limited and fails to exhibit noteworthy gains for any individual component. The 760K drags painfully behind in 0.1% low FPS output; these visual hits threaten playability at higher settings.
Conclusion: GTA V Utilizes CPUs More Than Most Modern Games
First: Find our accompanying GPU benchmark here, and our Complete GTA V Graphics Optimization Guide here.
As we've said in most the previous posts, GTA V is a well-optimized PC title (comparatively, at least) and offers room for growth as hardware iterates. This is the kind of game we want releasing to the PC as a platform – something that isn't immediately maxed-out by last-gen hardware.
Strictly looking at CPU benchmarking, it would appear that – yes – CPUs do have a sometimes large impact on GTA V FPS. This is in contrast to many modern games that are almost exclusively GPU-limited, evidenced by the rise of affordable CPUs like the G3258 and 860K, both of which make for budget-friendly options for most games; for GTA V, however, we recommend neither and would urge purchases of mid-range or better solutions. The AMD 760K and 860K are capable of at least playing the game, but they will bottleneck with a decent video card.
Although it doesn't appear on the chart (due to availability), the i5-4690K ($232) would perform about on-par with the 3570K and 4790K, making it one of the best-value CPUs for GTA V at higher settings.
- Steve “Lelldorianx” Burke.
