The Complete GTA V Graphics Optimization Guide & Performance Benchmarks
Posted on
GTA V shipped alongside an onslaught of graphics settings – none of which offer tool-tips – that can vastly control the fluidity of gameplay. In our recent and comprehensive GTA V benchmark, we tested multiple video cards for FPS at simple “max” and “high” settings, fluctuating resolution between 1080, 1440, and 4K along the way. That content now behind us, we took the opportunity to objectively benchmark various graphics settings for performance differences, then took a few screenshots for comparison of those settings.
This GTA V optimization guide assists in choosing the best graphics settings for frame-limited video cards, explaining the options along the way.
Other GTA V Content
- CPU Benchmark for GTA V
- GTA V Texture Quality Comparison
- GTA V GPU Benchmark
- GTA V PC Crash Fixes
- [video] GTA V Max Graphics @ 4K
- [video] GTA V Benchmark
- [video] GTA V Texture Comparison
Test Methodology
For this test, we combined our methodologies from the texture comparison and the GPU benchmark.
We tested using our updated 2015 GPU test bench, detailed in the table below. Our thanks to supporting hardware vendors for supplying some of the test components.
The latest 350.12 GeForce driver was used during testing. AMD's 15.4 Catalyst Beta was used for its GTA improvements. Game settings were manually controlled for the DUT. Overclocking was neither applied nor tested, though stock overclocks (“superclocks”) were left untouched.
VRAM utilization was measured using in-game tools and then validated with MSI's Afterburner, a custom version of the Riva Tuner software. Parity checking was performed with GPU-Z. FPS measurements were taken using FRAPS and then analyzed with FRAFS.
FPS logs were analyzed using FRAFS, then added to an internal spreadsheet for further analysis.
Each game was tested for 30 seconds in an identical scenario on the cards, then repeated for parity.
| GN Test Bench 2015 | Name | Courtesy Of | Cost |
| Video Card | NVIDIA AMD | $1000, $150 | |
| CPU | Intel i7-4790K CPU | CyberPower | $340 |
| Memory | 32GB 2133MHz HyperX Savage RAM | Kingston Tech. | $300 |
| Motherboard | Gigabyte Z97X Gaming G1 | GamersNexus | $285 |
| Power Supply | NZXT 1200W HALE90 V2 | NZXT | $300 |
| SSD | HyperX Predator PCI-e SSD | Kingston Tech. | TBD |
| Case | Top Deck Tech Station | GamersNexus | $250 |
| CPU Cooler | Be Quiet! Dark Rock 3 | Be Quiet! | ~$60 |
Average FPS, 1% low, and 0.1% low times are measured. We do not measure maximum or minimum FPS results as we consider these numbers to be pure outliers. Instead, we take an average of the lowest 1% of results (1% low) to show real-world, noticeable dips; we then take an average of the lowest 0.1% of results for severe spikes.
For purposes of texture graphics comparison, we took easily replicable steps on each texture resolution setting to ensure accuracy of results. All graphics settings were configured to their maximum value on the “graphics” tab – so that'd be “very high” and “ultra” – with the exception of anti-aliasing effects, all of which were disabled. Screen resolution was set to 4K.
We traveled to preselected locations and entered first-person mode. Once in FPS mode, we stood on designated “landmarks” and took the screenshots.
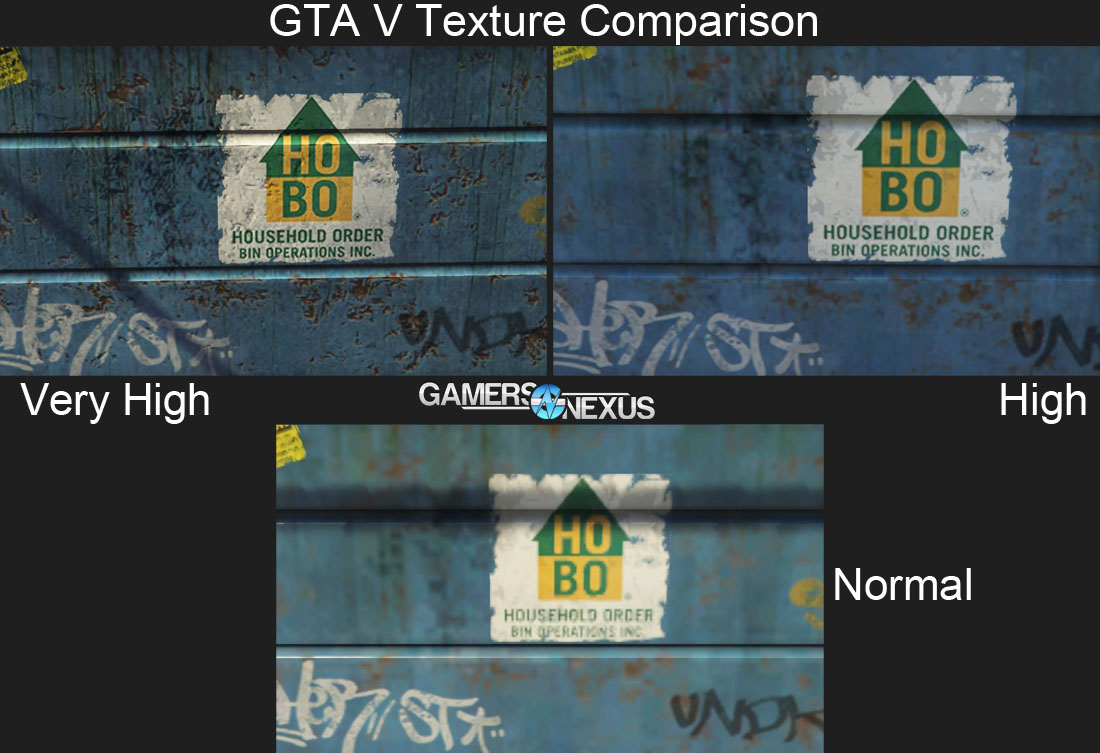
We face two issues with presentation of screenshots as data: They're massive, consuming large amounts of server bandwidth and greatly hindering page load time, and they're comparative, so we've got to find a way to show three shots at once. In order to mitigate the impact of each issue, we used a selection marquee of 546x330, selected a detailed portion of the 4K image, and then pasted it into the documents shown below. There is no scaling involved in this process.
Because file sizes were still an issue, we then scaled the finalized document into an 1100-width image, embedded below. Clicking on each image will bring up its native resolution in a new tab; no scaling occurred in the saving of these images. They're much larger images and will require longer to load.
Tests were conducted on an identical configuration with either a Titan X or R9 270X. A few initial tests were conducted on a Titan X using 4K resolution, but upon finding that settings bottlenecks were largely superseded by performance impact from resolution, we conducted the majority of tests on a more reasonable R9 270X at 1080p. Using a mid-range card provides the best display of settings impact. Some Titan X benchmarks are shown below.
All tests were conducted using the benchmarking utility – we opted to record only the portion where the fighter jet travels through the valley. This valley showcases nearly every setting in action – grass, water, view distance and scaling, reflections, shadows, and real-time night/day cycling for dynamic lighting effects.
The grass test was conducted manually atop a grassy mountain.
Note that more “situational” settings may not be reflected perfectly in our bench. Water quality, for instance, will more severely impact FPS if swimming in the ocean rather than just flying over it or near it.
There is a potential throttle in our test methodology: Because it would be unreasonable to test every single setting at every setting level with every video card we have available, it may be the case that cards which bottleneck elsewhere in the pipeline will exhibit different performance than we see here.
None of the options on the advanced graphics tab have been tested by us at this time.
A Note on CPU Performance
We haven't yet conducted official CPU benchmarks for GTA V, but have come to the realization that the game may be heavily CPU dependent in the event of a high-end GPU. To this end, our tests will not necessarily reflect performance output from lower-end CPUs.
Ignoring Suggested Limits
This setting bypasses hard limits on VRAM. If the game's settings exceed the video card's available VRAM, it is required that this option is set to “on” to ignore limitations.
As for the obvious questions – “is this bad for the card?” or “what happens when I ignore the limits” – there are a few quick answers. It isn't inherently “bad” for a video card to consume all of its VRAM. Depending on how fast your GPU's memory clock is and how quickly it can transact memory – and by how far you exceed VRAM – it may never even bottleneck on memory. FPS can tank at times (1% low and 0.1% low) as a result of forced VRAM settings; this occurs when the GPU has to cross the PCI-e bus to reach system memory and swap with the GPU memory, something we explain in this 4GB vs. 2GB comparison. In short: It might introduce tearing or a lower FPS at times, but it's generally safe to force settings if they do not exceed VRAM by so much – just keep the FPS at a playable framerate.
Note: We generally recommend avoiding the “normal” setting of most settings at all times, unless absolutely necessary. This setting has profound, noticeable impact on graphics quality in-game.
[Critical] MSAA
See FXAA below for a low-impact anti-aliasing solution.
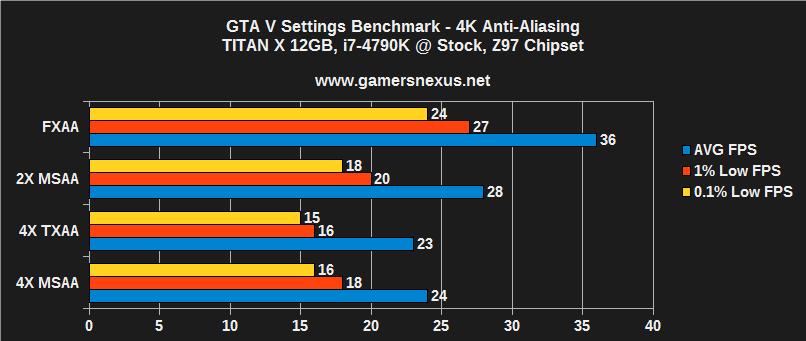
MSAA impacts performance in a critical fashion. It is strongly recommended that users disable MSAA entirely for the best performance. Anti-aliasing assists in smoothing object edges by sampling each pixel a count of times equivalent to the setting; 4x MSAA, for instance, will sample every pixel four times, then use this data to determine the correct pixel color for reduced jagged edges. At higher resolutions, AA becomes less noticeable and loses its value. This eats into the texture fill-rate and bandwidth of the GPU, something we explain here.
It is our belief that, in the case of GTA V, MSAA offers a poor FPS-to-visual quality “ratio” and should be disabled. TXAA, for nVidia users, has similar impact on performance but is temporally applied, so it combines post processes and high-quality MSAA with nVidia time-based filters to determine pixel color. This smooths-out movement with greater noticeable impact, but should only be applied in use cases where the hardware is capable of handling anti-aliasing performance hits.
[Severe] Post-FX Quality – The Biggest Impact on FPS
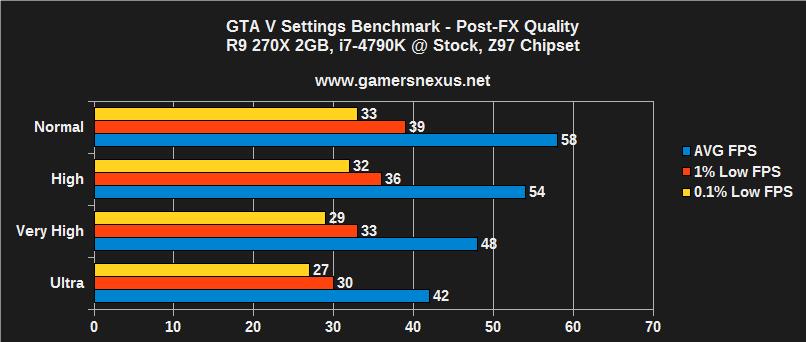
Of all the settings we tested, Post FX quality has the most severe disparity in performance across its levels.
Post processing effects in-game include bloom, depth of field (DOF), motion blur, and HDR (high-dynamic range lighting). DOF only becomes available as an option once Post FX is set to “very high,” and was left disabled in our Very High test, but enabled for Ultra.
Motion blur has effectively no measurable performance impact on our hardware.
In tow of particle FX, Post FX will be best reflected by things which project smoke, bloom (heat / sunrise), shimmer (sunrise / sunset / heat), and motion blur. Depth of Field – a separate setting – effectively applies “layers” of depth to the game. This is a filter applied to graphics, enacting a somewhat substantial performance difference when enabled. DOF in games is equivalent to its real-world roots: You've likely seen photos that have a “bokeh effect” around a portrait subject, essentially blurring the edges and background at varying depths, but keeping the subject in focus. This, in part, is attributable to depth of field.
Differences are large between Normal and Ultra, but so is the graphics quality of the game when the above scenarios present themselves. We would recommend shifting down one step (Ultra to Very High, etc.) for a marginal gain in performance that doesn't too heavily impact graphics quality. Combining this shift with other small steps will result in greater performance.
[Severe] Grass Quality – Large, Situational FPS Impact
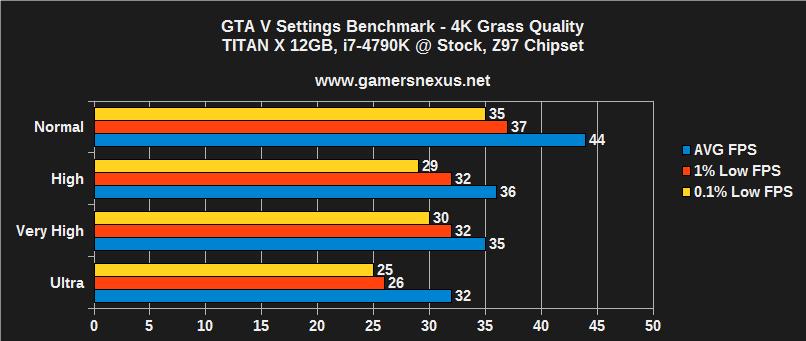
This was tested using a Titan X with 4K resolution. The switch was made because, while we did see a large impact from the R9 270X, it was noteworthy that the Titan X struggled severely with ultra grass settings. This is one of the few settings that exhibited such a large hit to Titan X performance.
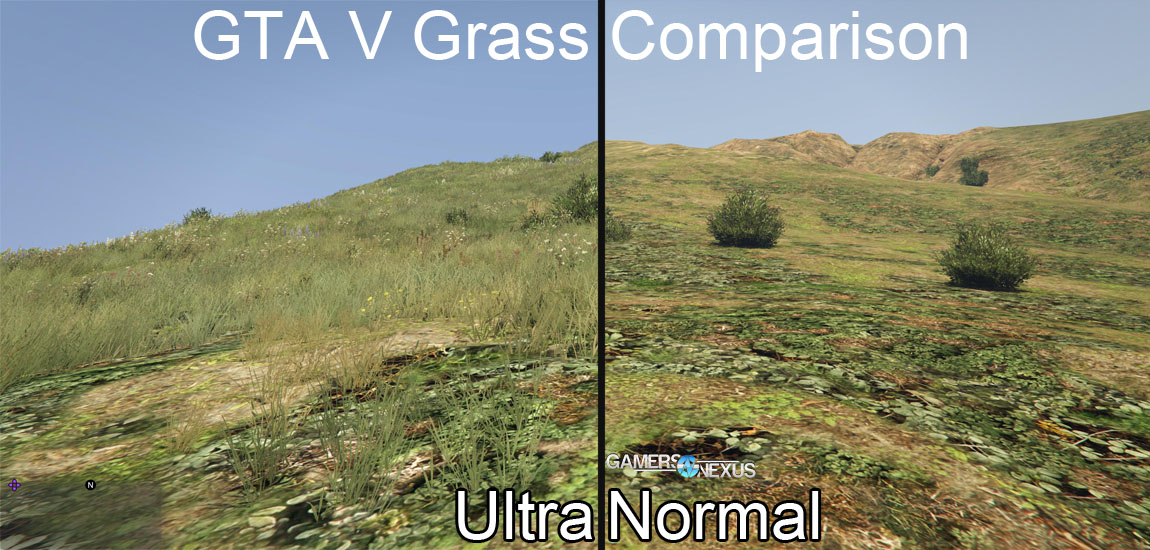
Grass quality settings impact how much standing grass there is in-game. This is best shown by traveling north of the city, where wild grass grows on hillsides. In-city grass does not show this setting, for the most part. Higher settings will spawn more tall grass, which has a swaying animation to convey wind. The lowest settings will present “flat” textured grass instead.
Unless standing grass is profoundly important to your commitment to immersion, we would recommend lowering these settings when greater performance is required.
[High] Shader Quality – Big Gain Between Normal & Very High
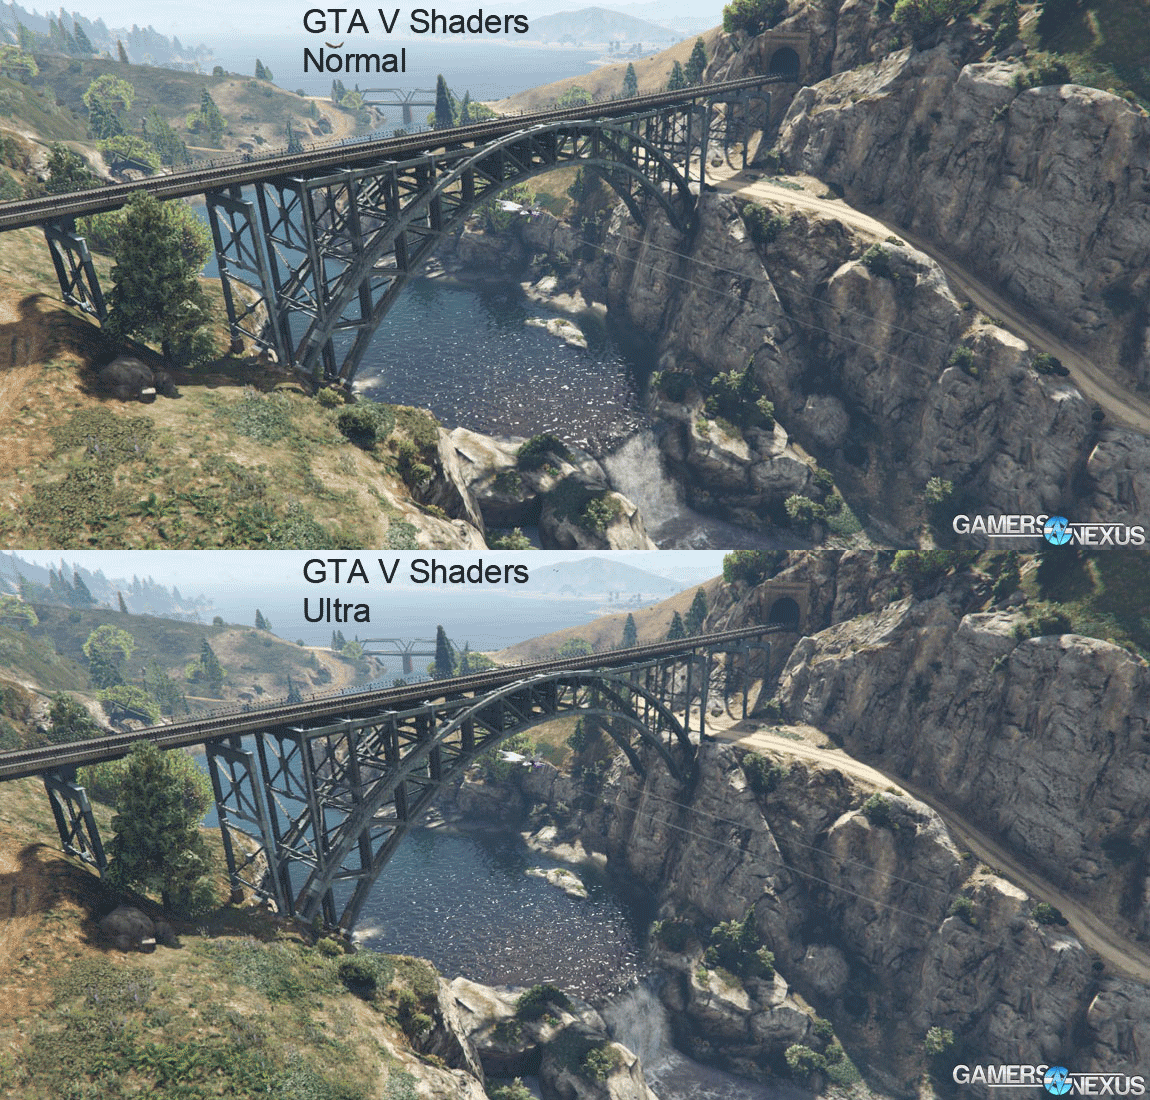
Shader quality directly affects the game's application of shading elements to objects. This is best showcased by examining the below screenshots in highlighted locations.
Looking farther into the distance, it is revealed that the lower shader qualities do not provide the same level of depth and shading to modeled objects. Lowering shader quality does not necessarily have a huge impact on visual acuity of the game (compared to other settings), but does impact performance substantially. Note that grass settings were the same, but shader levels change appearance of some foliage elements: Farther in the distance (top left), note that some bushes become less dark with higher shader settings -- this is because, realistically, more distant objects should appear to have depth (the normal setting flattens their appearance). The hillside (center right) is also worth paying attention to, as are the cliffs.
[High] Shadow Quality – Very High vs. High Shows Big Gain
As above, avoiding “normal” settings where possible is strongly recommended – perhaps excluding grass quality. For this reason, it is important to find settings that show a big performance difference between “very high” and “high,” as those would be the preferred steps down.
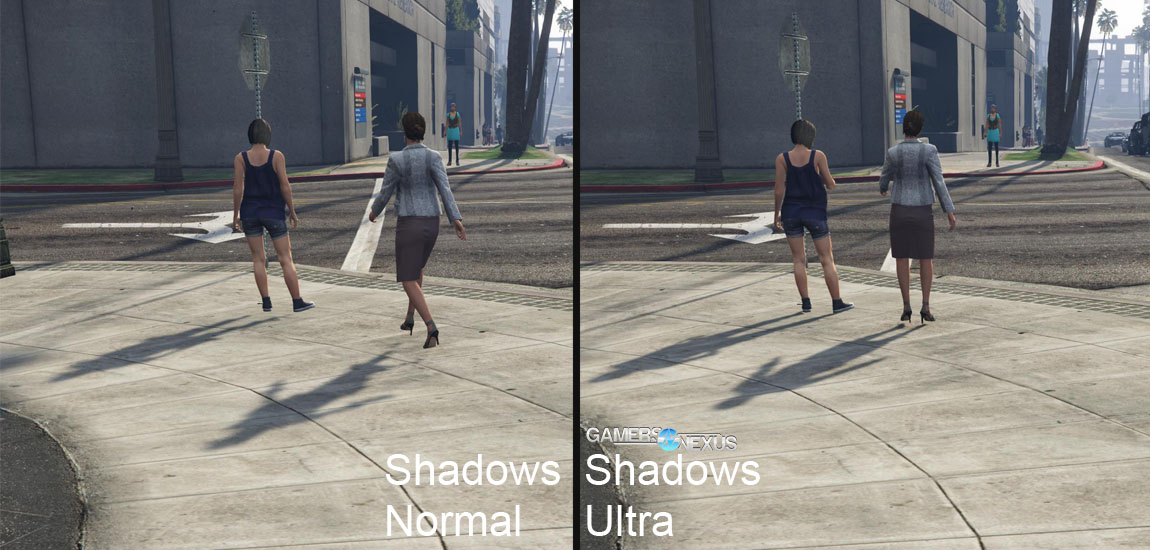
Shadow quality impacts the edges of shadows cast by in-game objects, like character actors or cars. A good example of this is to observe an actor walking around at various distances. As the player approaches a shadow, that shadow will become smoother around the edges and look more fluid in its movements (as the host NPC walks); take a few steps back – dependent upon settings – and the shadow grows more pixelated and jagged, exaggerated greatly by actor movement.
For sake of parity, we also tested shadow quality on the Titan X. This is one of the instances where the Titan X has become limited by other factors – likely resolution or bandwidth – and shows minimal performance gain from lower settings:
[Medium] Reflection Quality
This setting was only tested on normal and ultra levels, given its medium gain between the two. All other settings will fall within this range and are marginal, fairly linear improvements. Reflection quality modifies the level of detail exhibited by reflected objects in mirror-like surfaces. Windows are an easy example: Lower reflection quality diminishes the likelihood of encountering reflections that resemble their host object. Because this is something that rapidly becomes ignored when focused on the game, we recommend lowering reflection quality early in settings tweaks to gain a few frames-per-second back.
[Small] Particles Quality
Particle quality is best showcased in events that 'spawn' particle effects, like metal scraping and smoke from burning out tires. As with reflection quality, this is another graphics element that rapidly becomes ignored when dedicated to the game. Unfortunately, the performance difference is relatively small across all levels, showing noteworthy gains only between normal and very high settings.
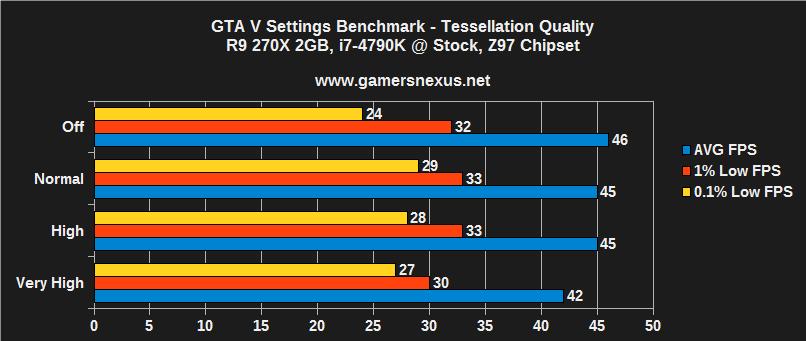
[Small] Tessellation Quality
Tessellation exaggerates deformation to provide a somewhat false appearance of added depth to objects. An example of this would be camera-bound tessellation, whereupon the player's camera angle dictates the apparent depth of a textured surface. In this example, a wall or floor may be a flat surface in the game (2-dimensional plane) that has a brick texture applied to it; with the right tessellation code and settings, the bricks can now appear to have depth, as they would in the real world.
Tessellation is an easy setting to modify for a quick, couple-FPS gain. Dropping from Very High to High has minimal visual impact, but we saw a 3FPS jump in performance. When tweaking for optimal graphics performance without sacrificing too many important or critical settings, this is among the first to drop a step. Gains at lower settings than this are not substantial.
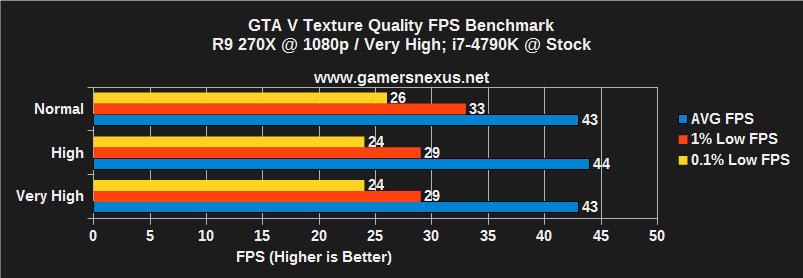
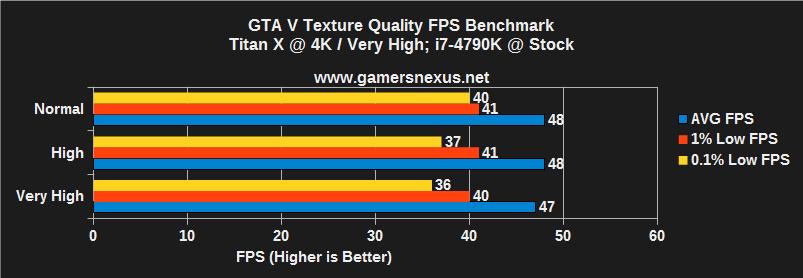
[Negligible] Texture Quality
This full test can be found over here, alongside more sample screenshots and deeper explanation. Note that the lighting is difficult to control due to the game's dynamism, so bump maps could potentially be enumerated differently.
[Negligible] FXAA
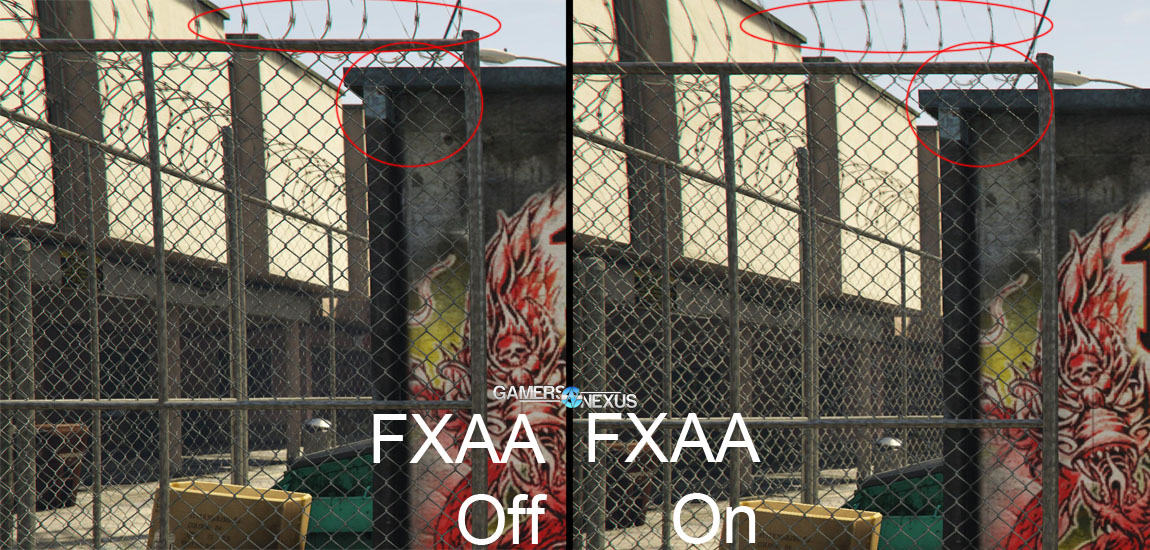
This is one of the least graphics-intensive anti-aliasing technologies out there. FXAA was introduced alongside Skyrim, serving as a scalable form of anti-aliasing that could span all the way down to IGPs. FXAA stands for Fast Approximate Anti-Aliasing. Instead of sampling each pixel in a 3D object several times, FXAA strictly finds and smooths object edges in-game based upon object depth. This is minimally intensive and should not be expected to notably impact FPS. In fact, we even tested it at 4K resolution with max settings – here's the performance difference we saw:
1FPS – so within margin of error. This was performed using the Titan X and 4K resolution strictly as a reinforcement of our previous testing methodology; a few challengers disliked our use of FXAA in the 4K benchmarks we performed a few days ago, and as shown here, there is effectively zero performance difference with FXAA on or off.
[Negligible] Distance Scaling at 4K
This is another one tested with the 4K Titan X, though we cross-checked it on the R9 270X with similar performance. Distance scaling impacts object level of detail (LOD) as it gains distance from the camera. This setting has minimal visual advantage in many cases, though becomes more apparent when immersed in the game's city streets. There is also nearly no performance disparity:
[Negligible] Shadow Smoothness
We didn't produce a benchmark chart for this one, but wanted to throw it in just for definition. Shadow smoothness dictates how light sources affect the edges (hardness) of shadows. AMD uses CHS -- contact hardened shadows -- and nVidia offers PCSS, or percentage closer soft shadows. We recommend enabling one of these two settings based upon your video card manufacturer, as they will offer the greatest optimization and visual quality.
[Negligible] Anisotropic Filtering
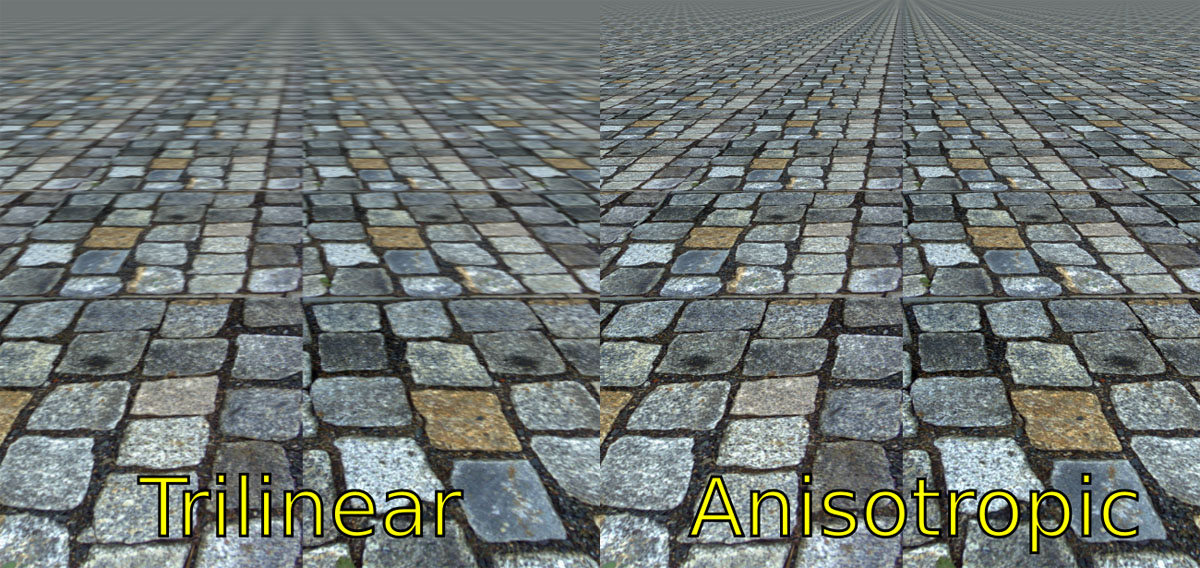
(Note: The above screenshots are not from GTA V, but showcase AF readily).
This is something we explain in our game specs glossary. Anisotropic Filtering impacts the sharpness of textures converging on the camera at various angles. Excerpted from our popular glossary:
Anisotropic Filtering is a type of texture filtering (see: Texture Fill-Rate) that is often listed alongside bilinear and trilinear filtering techniques. Texture filtering is a process through which game graphics are modified to improve smoothness of objects and ensure textures are proportionate to the screen's viewing angle. For example, a road leading to a vanishing point would require a more trapezoidal application of textures to the surface to ensure the road's dashed lines are not skewed with viewing distance (if using a square or oblique application).
There is effectively zero performance impact from Anisotropic Filtering. We recommend maximum settings for AF in most use cases.
Conclusion: A Highly Scalable Title
GTA V ($60) impresses us. The game is, thankfully, a title which is difficult to run at maxed-out settings on most reasonable hardware configurations. As PC gamers, this excites us – it means there's room for growth, something that'll prove important as new hardware ships.
Our tests also show that the game is highly scalable across multiple devices. In the GPU benchmark we published, GTA V scaled all the way down to fluid (71 FPS) framerates on an R7 250X using “normal” settings across the board. It didn't look too pretty, but it worked.
Using the above guide, we hope that you're able to better understand what each of GTA V's graphics settings means, how it affects performance, and where you should be looking to see graphics impact.
- Steve “Lelldorianx” Burke.
